
As the decade winds down, the U.S. economy continues to mark unprecedented job growth. November was the 110th straight month of reported job growth — the longest in U.S. history. In the last five years alone, the number of employed people in the United States increased by 11 million, or 7.5%.
At the national level, this growth was driven largely by the additions of food service and retail sales jobs, as well as low paying jobs in the education, health services, and professional and business sectors. These are America’s 25 thriving industries.
The vast majority of the nation’s metropolitan areas reported employment growth over the five years through 2019. In 340 of the nation’s 383 metropolitan areas, employment grew over the last half decade through this October. in the rest of the cities, however, employment was stagnant, and in a few outliers employment declined by 5% or more during that time
24/7 Wall St. reviewed the 25 metropolitan areas with the largest percentage decrease in total employment from October 2014 to October 2019 using seasonally adjusted data from the Bureau of Labor Statistics’ Local Area Unemployment Statistics program.
While only one measure of an economy, employment decline is closely tied to unfavorable outcomes in an area’s population. The majority of the metropolitan areas on this list have unemployment rates, college attainment rates, poverty rates, and population growth that are worse than the corresponding national figures. Nearly every city on this list reported a population decline even as the nation’s population grew by 3.5% over the last five years. Here are America’s fastest shrinking cities.
All but a handful of the 25 cities with the largest employment declines have a median annual household income well below the national median of $61,937. These are the 10 cities where incomes are shrinking the fastest.
Click here to see the cities that lost the most jobs
Click here to see the cities that added the most jobs
Click here to read our methodology

25. Monroe, LA
> Employment decrease (Oct. 2014 – Oct. 2019): -1.9% (-1,428 jobs)
> Industry with largest 5-yr. employment decline: Government (-1,400 jobs)
> October 2019 unemployment: 5.1%
> Median household income: $44,353

24. Weirton-Steubenville, WV-OH
> Employment decrease (Oct. 2014 – Oct. 2019): -1.9% (-927 jobs)
> Industry with largest 5-yr. employment decline: Trade, transportation, and utilities (-600 jobs)
> October 2019 unemployment: 5.8%
> Median household income: $43,747

23. El Centro, CA
> Employment decrease (Oct. 2014 – Oct. 2019): -2.2% (-1,274 jobs)
> Industry with largest 5-yr. employment decline: Mining, logging, and construction (-500 jobs)
> October 2019 unemployment: 19.2%
> Median household income: $48,984
[in-text-ad-2]

22. Binghamton, NY
> Employment decrease (Oct. 2014 – Oct. 2019): -2.4% (-2,458 jobs)
> Industry with largest 5-yr. employment decline: Professional and business services (-1,200 jobs)
> October 2019 unemployment: 4.6%
> Median household income: $53,199

21. Pine Bluff, AR
> Employment decrease (Oct. 2014 – Oct. 2019): -2.4% (-823 jobs)
> Industry with largest 5-yr. employment decline: Government (-700 jobs)
> October 2019 unemployment: 5.2%
> Median household income: $37,314
[in-text-ad]
20. Watertown-Fort Drum, NY
> Employment decrease (Oct. 2014 – Oct. 2019): -2.6% (-1,124 jobs)
> Industry with largest 5-yr. employment decline: Manufacturing (-400 jobs)
> October 2019 unemployment: 5.6%
> Median household income: $53,146

19. Anchorage, AK
> Employment decrease (Oct. 2014 – Oct. 2019): -3.5% (-6,652 jobs)
> Industry with largest 5-yr. employment decline: Professional and business services (-2,500 jobs)
> October 2019 unemployment: 5.5%
> Median household income: $81,037

18. Bay City, MI
> Employment decrease (Oct. 2014 – Oct. 2019): -3.5% (-1,737 jobs)
> Industry with largest 5-yr. employment decline: Trade, transportation, and utilities (-800 jobs)
> October 2019 unemployment: 4.8%
> Median household income: $50,606
[in-text-ad-2]

17. Fairbanks, AK
> Employment decrease (Oct. 2014 – Oct. 2019): -3.7% (-1,616 jobs)
> Industry with largest 5-yr. employment decline: Government (-1,000 jobs)
> October 2019 unemployment: 5.4%
> Median household income: $75,448

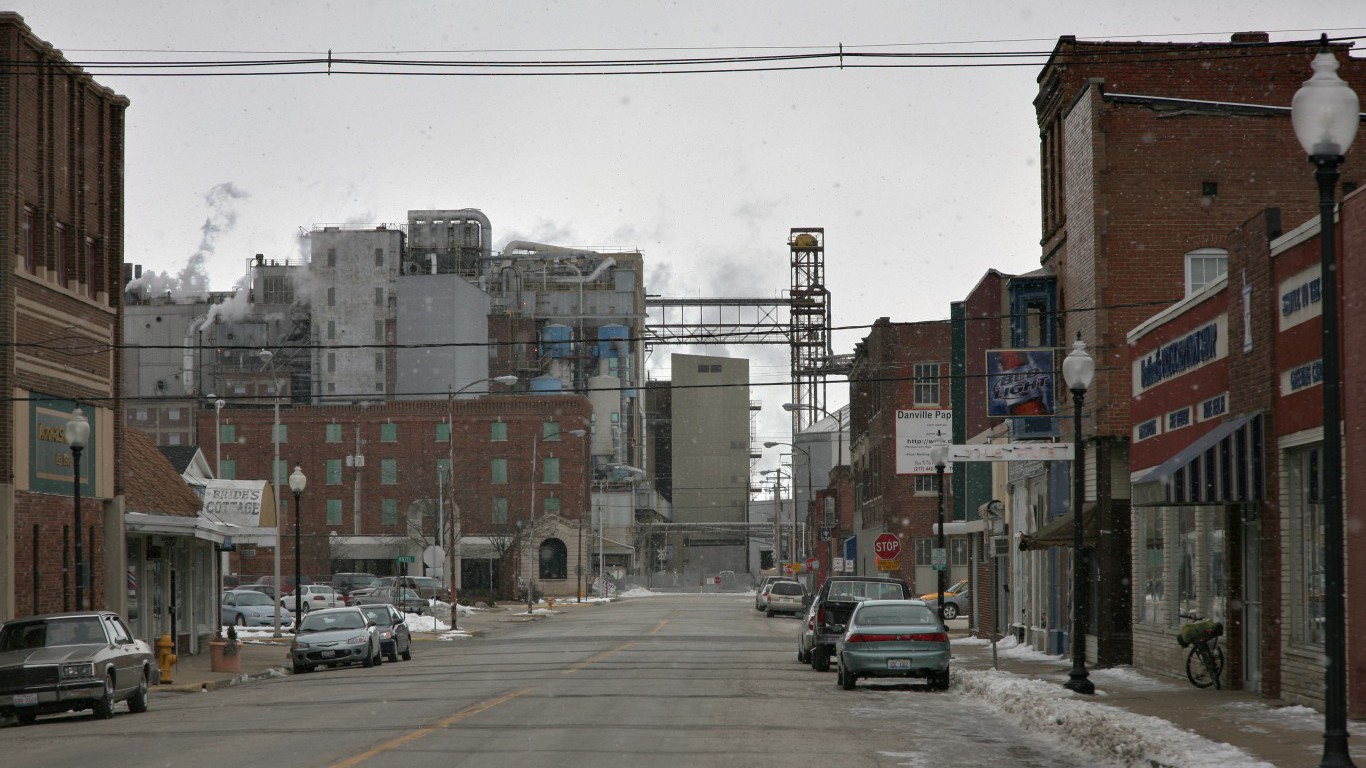
16. Danville, IL
> Employment decrease (Oct. 2014 – Oct. 2019): -3.8% (-1,262 jobs)
> Industry with largest 5-yr. employment decline: Education and health services (-700 jobs)
> October 2019 unemployment: 5.1%
> Median household income: $43,655
[in-text-ad]

15. Charleston, WV
> Employment decrease (Oct. 2014 – Oct. 2019): -4.4% (-4,086 jobs)
> Industry with largest 5-yr. employment decline: Trade, transportation, and utilities (-2,600 jobs)
> October 2019 unemployment: 4.6%
> Median household income: $40,806

14. Johnstown, PA
> Employment decrease (Oct. 2014 – Oct. 2019): -4.5% (-2,616 jobs)
> Industry with largest 5-yr. employment decline: Professional and business services (-1,500 jobs)
> October 2019 unemployment: 5.2%
> Median household income: $45,084

13. Farmington, NM
> Employment decrease (Oct. 2014 – Oct. 2019): -4.5% (-2,386 jobs)
> Industry with largest 5-yr. employment decline: Government (-500 jobs)
> October 2019 unemployment: 5.5%
> Median household income: $44,841
[in-text-ad-2]

12. Alexandria, LA
> Employment decrease (Oct. 2014 – Oct. 2019): -4.7% (-2,904 jobs)
> Industry with largest 5-yr. employment decline: Trade, transportation, and utilities (-400 jobs)
> October 2019 unemployment: 5.0%
> Median household income: $47,391

11. Shreveport-Bossier City, LA
> Employment decrease (Oct. 2014 – Oct. 2019): -4.9% (-9,047 jobs)
> Industry with largest 5-yr. employment decline: Mining, logging, and construction (-2,900 jobs)
> October 2019 unemployment: 5.0%
> Median household income: $41,969
[in-text-ad]

10. Youngstown-Warren-Boardman, OH-PA
> Employment decrease (Oct. 2014 – Oct. 2019): -5.0% (-11,827 jobs)
> Industry with largest 5-yr. employment decline: Manufacturing (-6,400 jobs)
> October 2019 unemployment: 5.8%
> Median household income: $47,476
9. Ithaca, NY
> Employment decrease (Oct. 2014 – Oct. 2019): -5.2% (-2,728 jobs)
> Industry with largest 5-yr. employment decline: Manufacturing (-500 jobs)
> October 2019 unemployment: 3.5%
> Median household income: $57,276
8. Williamsport, PA
> Employment decrease (Oct. 2014 – Oct. 2019): -5.7% (-3,312 jobs)
> Industry with largest 5-yr. employment decline: Trade, transportation, and utilities (-1,700 jobs)
> October 2019 unemployment: 4.7%
> Median household income: $55,045
[in-text-ad-2]

7. Elmira, NY
> Employment decrease (Oct. 2014 – Oct. 2019): -6.2% (-2,216 jobs)
> Industry with largest 5-yr. employment decline: Professional and business services (-800 jobs)
> October 2019 unemployment: 4.3%
> Median household income: $53,005
6. Longview, TX
> Employment decrease (Oct. 2014 – Oct. 2019): -6.3% (-6,246 jobs)
> Industry with largest 5-yr. employment decline: Mining, logging, and construction (-5,000 jobs)
> October 2019 unemployment: 3.6%
> Median household income: $51,296
[in-text-ad]
5. Victoria, TX
> Employment decrease (Oct. 2014 – Oct. 2019): -7.3% (-3,533 jobs)
> Industry with largest 5-yr. employment decline: Mining, logging, and construction (-2,300 jobs)
> October 2019 unemployment: 3.2%
> Median household income: $51,683
4. Lafayette, LA
> Employment decrease (Oct. 2014 – Oct. 2019): -8.4% (-18,639 jobs)
> Industry with largest 5-yr. employment decline: Mining, logging, and construction (-12,700 jobs)
> October 2019 unemployment: 4.5%
> Median household income: $50,825

3. Enid, OK
> Employment decrease (Oct. 2014 – Oct. 2019): -9.1% (-2,626 jobs)
> Industry with largest 5-yr. employment decline: Government (-100 jobs)
> October 2019 unemployment: 2.9%
> Median household income: $53,946
[in-text-ad-2]

2. Casper, WY
> Employment decrease (Oct. 2014 – Oct. 2019): -10.0% (-4,180 jobs)
> Industry with largest 5-yr. employment decline: Mining, logging, and construction (-2,500 jobs)
> October 2019 unemployment: 4.0%
> Median household income: $64,833
1. Houma-Thibodaux, LA
> Employment decrease (Oct. 2014 – Oct. 2019): -17.6% (-17,419 jobs)
> Industry with largest 5-yr. employment decline: Trade, transportation, and utilities (-7,100 jobs)
> October 2019 unemployment: 4.5%
> Median household income: $51,440
Methodology
To determine the cities that added the most jobs, 24/7 Wall St. reviewed the percent change in total employment from October 2014 to October 2019 in U.S. metropolitan areas using seasonally adjusted data from the Bureau of Labor Statistics’ Local Area Unemployment Statistics program. Data on unemployment also came from the BLS LAUS program. National employment data and data on industry employment for the same period are from the BLS Current Employment Statistics program and is not seasonally adjusted. Population figures for the years 2013 and 2018 are from the U.S. Census Bureau’s American Community Survey. Data on median household income, poverty, and the share of adults 25 and over with at least a bachelor’s degree also came from the ACS and are for 2018. All data are for the most recent period available.
Sponsored: Find a Qualified Financial Advisor
Finding a qualified financial advisor doesn’t have to be hard. SmartAsset’s free tool matches you with up to 3 fiduciary financial advisors in your area in 5 minutes. Each advisor has been vetted by SmartAsset and is held to a fiduciary standard to act in your best interests. If you’re ready to be matched with local advisors that can help you achieve your financial goals, get started now.
Thank you for reading! Have some feedback for us?
Contact the 24/7 Wall St. editorial team.

 24/7 Wall St.


