The United States has the highest income inequality of all G7 nations, and that gap has been widening for over 40 years. During this time, CEO pay has skyrocketed, increasing by over 1,300% since 1978, according to the Economic Policy Institute.
While worker wages have also risen, this increase has barely been enough to cover the cost of inflation. According to the Pew Research Center, although paychecks are larger than they were 40 years ago, purchasing power has hardly increased. (Here are America’s cities with the widest income gaps.)
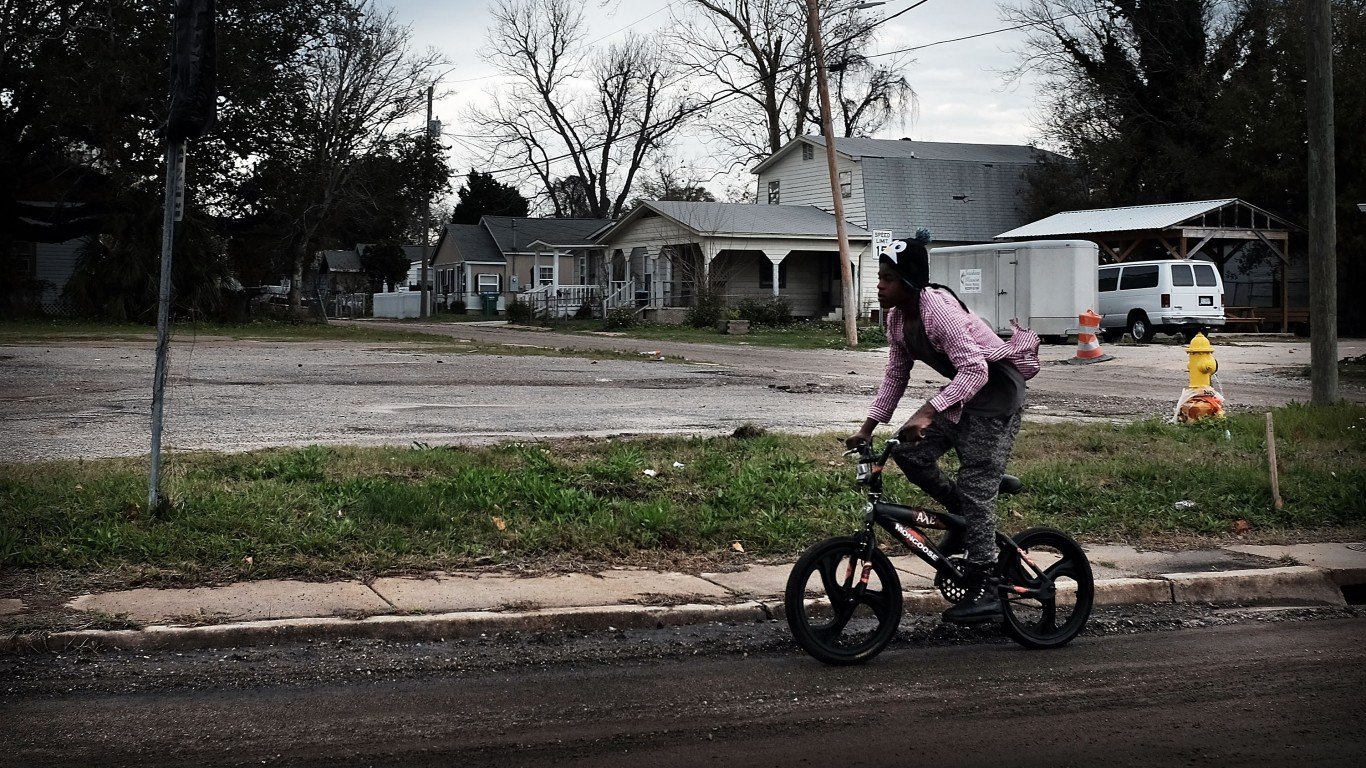
Just as income inequality has increased, so has wealth inequality. While the top 1% captures an increasing share of total wealth, the bottom 50% share of wealth has declined, with many Americans struggling with mounting debt.
To identify the wealth the bottom 50% held the year you were born, 24/7 Wall St. reviewed the total wealth of the bottom 50% of households for each year going back to 1976 from Real Time Inequality, which provides statistics on how economic growth is distributed across groups. Over the last 25 years, the bottom 50% of Americans have been in the red.
Since 1976, America’s 1% of households have added about $45 trillion in real wealth, while the share of wealth of the bottom 50% peaked in 1989, at $268 billion, with the average household in the bottom 50% holding $4,244 in real wealth.
Wealth for the bottom 50% has been negative since 1996, and liabilities more than doubled in the years of the financial crisis. The bottom 50% total net wealth jumped from about negative $600 billion in 2006 to over negative $1 trillion in 2007. Total liabilities peaked at nearly $1.6 trillion in 2008, with an average debt of nearly $18,000 per household that year.
Although the wealth of these households has been steadily recovering since 2012, the total liabilities for the bottom half of Americans was still a negative $180.49 billion in 2021, with an average debt of $1,947 per household.
Factors including the CEO-worker pay gap, a stagnant minimum wage, and a decline in labor unions have contributed to the growing inequality. The wealth and income gaps are even higher for Black and Latino Americans. According to Federal Reserve data, in 2019 white households had a net worth nearly 8 times greater than the average net worth of a Black household. (Here are the worst voting districts for Black Americans.)
Click here to see how poor the bottom half of households were each year since 1976
Click here to read our detailed methodology
1976
> Total wealth of the bottom 50%: $28.73 billion
> Avg. wealth per bottom 50% household: $589 — #16 most
> Bottom 50% wealth share: 0.2% — #16 largest
> Households in bottom 50%: 48,788,096
> Total households: 97,576,192
[in-text-ad]
1977
> Total wealth of the bottom 50%: $36.81 billion
> Avg. wealth per bottom 50% household: $734 — #15 most
> Bottom 50% wealth share: 0.2% — #15 largest
> Households in bottom 50%: 50,122,911
> Total households: 100,245,823
[recirclink id=1019603]

1978
> Total wealth of the bottom 50%: -$26.23 billion
> Avg. wealth per bottom 50% household: -$511 — #20 most
> Bottom 50% wealth share: -0.1% — #20 largest
> Households in bottom 50%: 51,328,856
> Total households: 102,657,711

1979
> Total wealth of the bottom 50%: $13.00 billion
> Avg. wealth per bottom 50% household: $247 — #18 most
> Bottom 50% wealth share: 0.1% — #18 largest
> Households in bottom 50%: 52,700,482
> Total households: 105,400,965
[in-text-ad-2]

1980
> Total wealth of the bottom 50%: $47.73 billion
> Avg. wealth per bottom 50% household: $885 — #14 most
> Bottom 50% wealth share: 0.2% — #14 largest
> Households in bottom 50%: 53,935,107
> Total households: 107,870,214

1981
> Total wealth of the bottom 50%: $74.82 billion
> Avg. wealth per bottom 50% household: $1,362 — #13 most
> Bottom 50% wealth share: 0.3% — #13 largest
> Households in bottom 50%: 54,940,611
> Total households: 109,881,223
[in-text-ad]
1982
> Total wealth of the bottom 50%: $150.25 billion
> Avg. wealth per bottom 50% household: $2,680 — #7 most
> Bottom 50% wealth share: 0.7% — #4 largest
> Households in bottom 50%: 56,056,221
> Total households: 112,112,442
[recirclink id=1041585]
1983
> Total wealth of the bottom 50%: $154.23 billion
> Avg. wealth per bottom 50% household: $2,706 — #6 most
> Bottom 50% wealth share: 0.7% — #5 largest
> Households in bottom 50%: 56,996,558
> Total households: 113,993,117

1984
> Total wealth of the bottom 50%: $111.31 billion
> Avg. wealth per bottom 50% household: $1,917 — #12 most
> Bottom 50% wealth share: 0.5% — #10 largest
> Households in bottom 50%: 58,055,515
> Total households: 116,111,031
[in-text-ad-2]
1985
> Total wealth of the bottom 50%: $131.82 billion
> Avg. wealth per bottom 50% household: $2,222 — #9 most
> Bottom 50% wealth share: 0.5% — #9 largest
> Households in bottom 50%: 59,316,379
> Total households: 118,632,757

1986
> Total wealth of the bottom 50%: $158.01 billion
> Avg. wealth per bottom 50% household: $2,610 — #8 most
> Bottom 50% wealth share: 0.5% — #7 largest
> Households in bottom 50%: 60,548,709
> Total households: 121,097,418
[in-text-ad]

1987
> Total wealth of the bottom 50%: $230.16 billion
> Avg. wealth per bottom 50% household: $3,748 — #3 most
> Bottom 50% wealth share: 0.8% — #3 largest
> Households in bottom 50%: 61,409,578
> Total households: 122,819,155
[recirclink id=1041570]

1988
> Total wealth of the bottom 50%: $243.86 billion
> Avg. wealth per bottom 50% household: $3,917 — #2 most
> Bottom 50% wealth share: 0.8% — #2 largest
> Households in bottom 50%: 62,256,400
> Total households: 124,512,801
1989
> Total wealth of the bottom 50%: $268.34 billion
> Avg. wealth per bottom 50% household: $4,244 — #1 most
> Bottom 50% wealth share: 0.8% — #1 largest
> Households in bottom 50%: 63,234,566
> Total households: 126,469,133
[in-text-ad-2]

1990
> Total wealth of the bottom 50%: $177.13 billion
> Avg. wealth per bottom 50% household: $2,753 — #5 most
> Bottom 50% wealth share: 0.5% — #8 largest
> Households in bottom 50%: 64,333,607
> Total households: 128,667,214
1991
> Total wealth of the bottom 50%: $211.28 billion
> Avg. wealth per bottom 50% household: $3,223 — #4 most
> Bottom 50% wealth share: 0.6% — #6 largest
> Households in bottom 50%: 65,559,874
> Total households: 131,119,748
[in-text-ad]

1992
> Total wealth of the bottom 50%: $132.27 billion
> Avg. wealth per bottom 50% household: $1,989 — #11 most
> Bottom 50% wealth share: 0.4% — #11 largest
> Households in bottom 50%: 66,516,699
> Total households: 133,033,397
[recirclink id=1042926]

1993
> Total wealth of the bottom 50%: $135.31 billion
> Avg. wealth per bottom 50% household: $2,007 — #10 most
> Bottom 50% wealth share: 0.4% — #12 largest
> Households in bottom 50%: 67,428,082
> Total households: 134,856,165

1994
> Total wealth of the bottom 50%: $35.01 billion
> Avg. wealth per bottom 50% household: $513 — #17 most
> Bottom 50% wealth share: 0.1% — #17 largest
> Households in bottom 50%: 68,264,805
> Total households: 136,529,609
[in-text-ad-2]
1995
> Total wealth of the bottom 50%: $13.07 billion
> Avg. wealth per bottom 50% household: $188 — #19 most
> Bottom 50% wealth share: 0.0% — #19 largest
> Households in bottom 50%: 69,443,550
> Total households: 138,887,101
1996
> Total wealth of the bottom 50%: -$64.35 billion
> Avg. wealth per bottom 50% household: -$913 — #21 most
> Bottom 50% wealth share: -0.1% — #22 largest
> Households in bottom 50%: 70,454,294
> Total households: 140,908,588
[in-text-ad]

1997
> Total wealth of the bottom 50%: -$131.56 billion
> Avg. wealth per bottom 50% household: -$1,841 — #22 most
> Bottom 50% wealth share: -0.3% — #24 largest
> Households in bottom 50%: 71,464,952
> Total households: 142,929,905
[recirclink id=1044401]

1998
> Total wealth of the bottom 50%: -$153.78 billion
> Avg. wealth per bottom 50% household: -$2,116 — #25 most
> Bottom 50% wealth share: -0.3% — #25 largest
> Households in bottom 50%: 72,659,336
> Total households: 145,318,673

1999
> Total wealth of the bottom 50%: -$148.88 billion
> Avg. wealth per bottom 50% household: -$2,018 — #24 most
> Bottom 50% wealth share: -0.3% — #23 largest
> Households in bottom 50%: 73,766,031
> Total households: 147,532,062
[in-text-ad-2]

2000
> Total wealth of the bottom 50%: -$215.40 billion
> Avg. wealth per bottom 50% household: -$2,895 — #26 most
> Bottom 50% wealth share: -0.4% — #28 largest
> Households in bottom 50%: 74,396,616
> Total households: 148,793,232

2001
> Total wealth of the bottom 50%: -$219.04 billion
> Avg. wealth per bottom 50% household: -$2,907 — #27 most
> Bottom 50% wealth share: -0.4% — #29 largest
> Households in bottom 50%: 75,352,905
> Total households: 150,705,811
[in-text-ad]

2002
> Total wealth of the bottom 50%: -$267.56 billion
> Avg. wealth per bottom 50% household: -$3,508 — #30 most
> Bottom 50% wealth share: -0.5% — #32 largest
> Households in bottom 50%: 76,275,948
> Total households: 152,551,896
[recirclink id=1019603]

2003
> Total wealth of the bottom 50%: -$275.27 billion
> Avg. wealth per bottom 50% household: -$3,569 — #31 most
> Bottom 50% wealth share: -0.5% — #31 largest
> Households in bottom 50%: 77,124,496
> Total households: 154,248,993
2004
> Total wealth of the bottom 50%: -$263.68 billion
> Avg. wealth per bottom 50% household: -$3,366 — #29 most
> Bottom 50% wealth share: -0.4% — #30 largest
> Households in bottom 50%: 78,327,652
> Total households: 156,655,305
[in-text-ad-2]
2005
> Total wealth of the bottom 50%: -$264.68 billion
> Avg. wealth per bottom 50% household: -$3,336 — #28 most
> Bottom 50% wealth share: -0.4% — #27 largest
> Households in bottom 50%: 79,336,913
> Total households: 158,673,826

2006
> Total wealth of the bottom 50%: -$599.64 billion
> Avg. wealth per bottom 50% household: -$7,461 — #34 most
> Bottom 50% wealth share: -0.8% — #36 largest
> Households in bottom 50%: 80,372,577
> Total households: 160,745,154
[in-text-ad]
2007
> Total wealth of the bottom 50%: -$1.06 trillion
> Avg. wealth per bottom 50% household: -$12,967 — #40 most
> Bottom 50% wealth share: -1.4% — #40 largest
> Households in bottom 50%: 81,595,631
> Total households: 163,191,262
[recirclink id=1041585]

2008
> Total wealth of the bottom 50%: -$1.56 trillion
> Avg. wealth per bottom 50% household: -$18,976 — #46 most
> Bottom 50% wealth share: -2.6% — #46 largest
> Households in bottom 50%: 82,391,629
> Total households: 164,783,258
2009
> Total wealth of the bottom 50%: -$1.49 trillion
> Avg. wealth per bottom 50% household: -$17,776 — #45 most
> Bottom 50% wealth share: -2.4% — #45 largest
> Households in bottom 50%: 83,645,544
> Total households: 167,291,088
[in-text-ad-2]
2010
> Total wealth of the bottom 50%: -$1.45 trillion
> Avg. wealth per bottom 50% household: -$17,113 — #43 most
> Bottom 50% wealth share: -2.2% — #43 largest
> Households in bottom 50%: 84,619,851
> Total households: 169,239,701

2011
> Total wealth of the bottom 50%: -$1.50 trillion
> Avg. wealth per bottom 50% household: -$17,491 — #44 most
> Bottom 50% wealth share: -2.3% — #44 largest
> Households in bottom 50%: 86,020,202
> Total households: 172,040,403
[in-text-ad]
2012
> Total wealth of the bottom 50%: -$1.34 trillion
> Avg. wealth per bottom 50% household: -$15,882 — #42 most
> Bottom 50% wealth share: -2.0% — #42 largest
> Households in bottom 50%: 86,740,012
> Total households: 173,480,024
[recirclink id=1041585]

2013
> Total wealth of the bottom 50%: -$1.17 trillion
> Avg. wealth per bottom 50% household: -$13,292 — #41 most
> Bottom 50% wealth share: -1.5% — #41 largest
> Households in bottom 50%: 88,054,028
> Total households: 176,108,055

2014
> Total wealth of the bottom 50%: -$1.02 trillion
> Avg. wealth per bottom 50% household: -$11,499 — #39 most
> Bottom 50% wealth share: -1.2% — #39 largest
> Households in bottom 50%: 88,994,498
> Total households: 177,988,996
[in-text-ad-2]

2015
> Total wealth of the bottom 50%: -$940.74 billion
> Avg. wealth per bottom 50% household: -$10,386 — #38 most
> Bottom 50% wealth share: -1.1% — #38 largest
> Households in bottom 50%: 90,573,677
> Total households: 181,147,354

2016
> Total wealth of the bottom 50%: -$885.48 billion
> Avg. wealth per bottom 50% household: -$9,794 — #37 most
> Bottom 50% wealth share: -1.0% — #37 largest
> Households in bottom 50%: 90,412,158
> Total households: 180,824,317
[in-text-ad]

2017
> Total wealth of the bottom 50%: -$693.19 billion
> Avg. wealth per bottom 50% household: -$7,620 — #35 most
> Bottom 50% wealth share: -0.7% — #34 largest
> Households in bottom 50%: 90,973,742
> Total households: 181,947,484
[recirclink id=1041570]

2018
> Total wealth of the bottom 50%: -$736.49 billion
> Avg. wealth per bottom 50% household: -$8,042 — #36 most
> Bottom 50% wealth share: -0.8% — #35 largest
> Households in bottom 50%: 91,578,862
> Total households: 183,157,723

2019
> Total wealth of the bottom 50%: -$542.75 billion
> Avg. wealth per bottom 50% household: -$5,903 — #33 most
> Bottom 50% wealth share: -0.5% — #33 largest
> Households in bottom 50%: 91,948,367
> Total households: 183,896,734
[in-text-ad-2]

2020
> Total wealth of the bottom 50%: -$350.26 billion
> Avg. wealth per bottom 50% household: -$3,791 — #32 most
> Bottom 50% wealth share: -0.3% — #26 largest
> Households in bottom 50%: 92,403,285
> Total households: 184,806,570

2021
> Total wealth of the bottom 50%: -$180.49 billion
> Avg. wealth per bottom 50% household: -$1,947 — #23 most
> Bottom 50% wealth share: -0.1% — #21 largest
> Households in bottom 50%: 92,679,349
> Total households: 185,358,697
Methodology
To identify the wealth of the bottom 50% the year you were born, 24/7 Wall St. reviewed the total wealth of the bottom 50% of households for each year going back to 1976 from RealTime Inequality, which provides statistics on how economic growth is distributed across groups, with research conducted by economists Thomas Blanchet, Emmanuel Saez, Gabriel Zucman.
The average wealth per household, the population, and the bottom 50% wealth share are also from Real Time Inequality, and all data is for the fourth quarter of each year. All dollar figures are annualized and adjusted for price inflation to 2021 dollars. The RealTime Inequality wealth definition includes all marketable wealth owned by households.
Contact [email protected] for any questions or corrections.