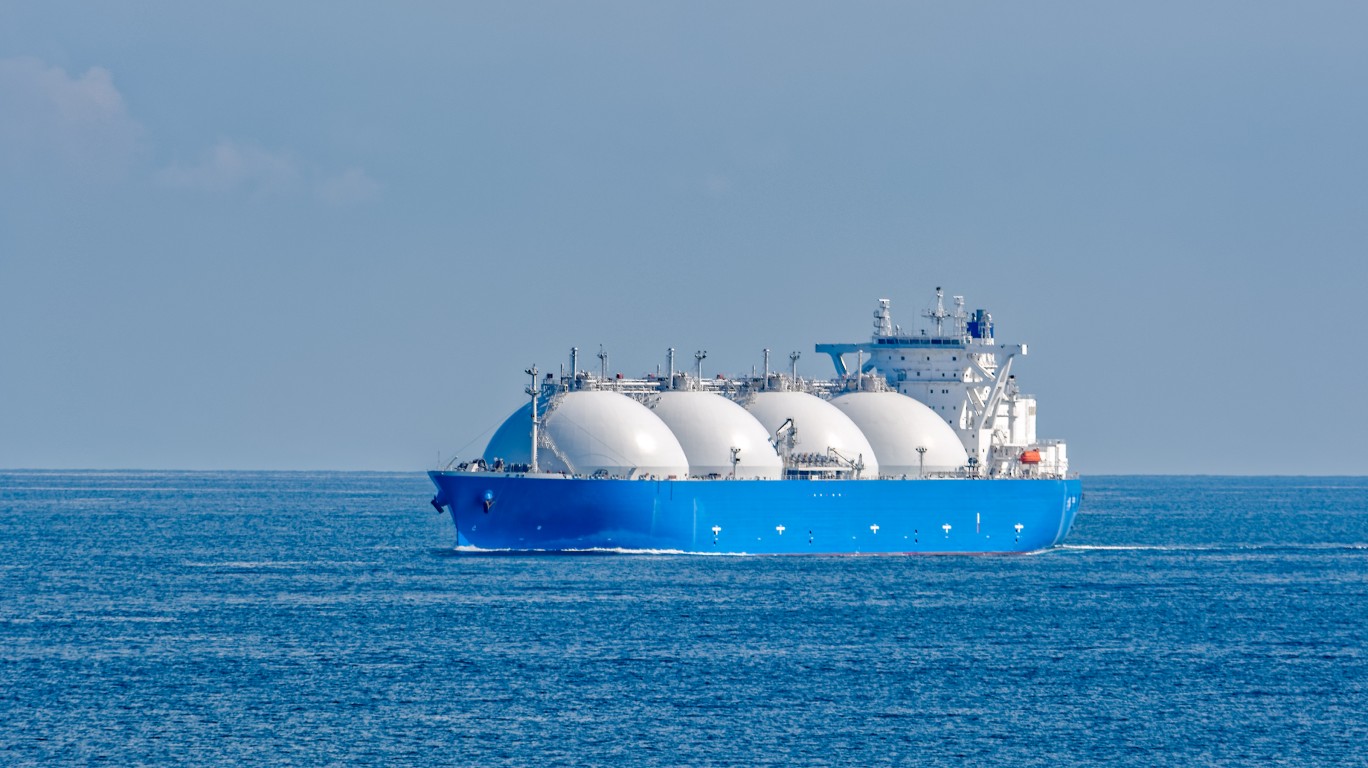
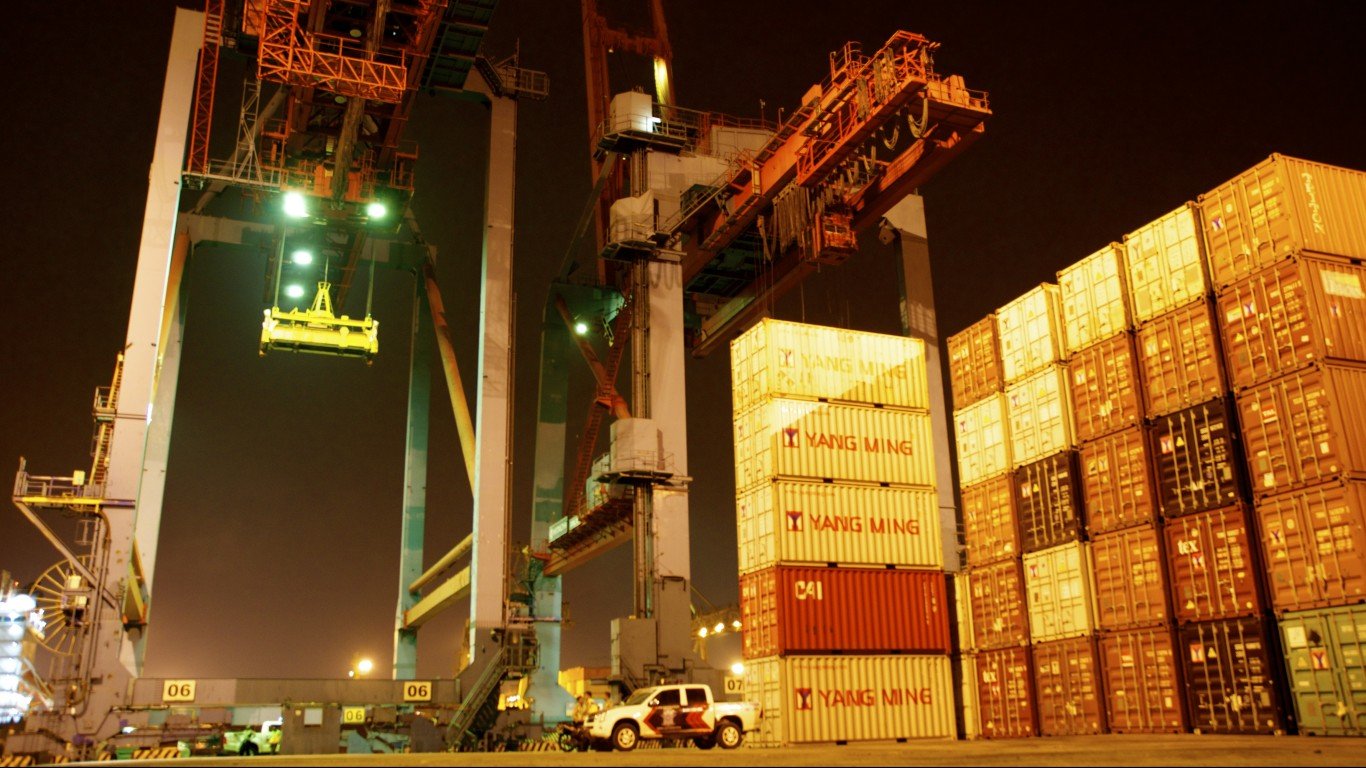
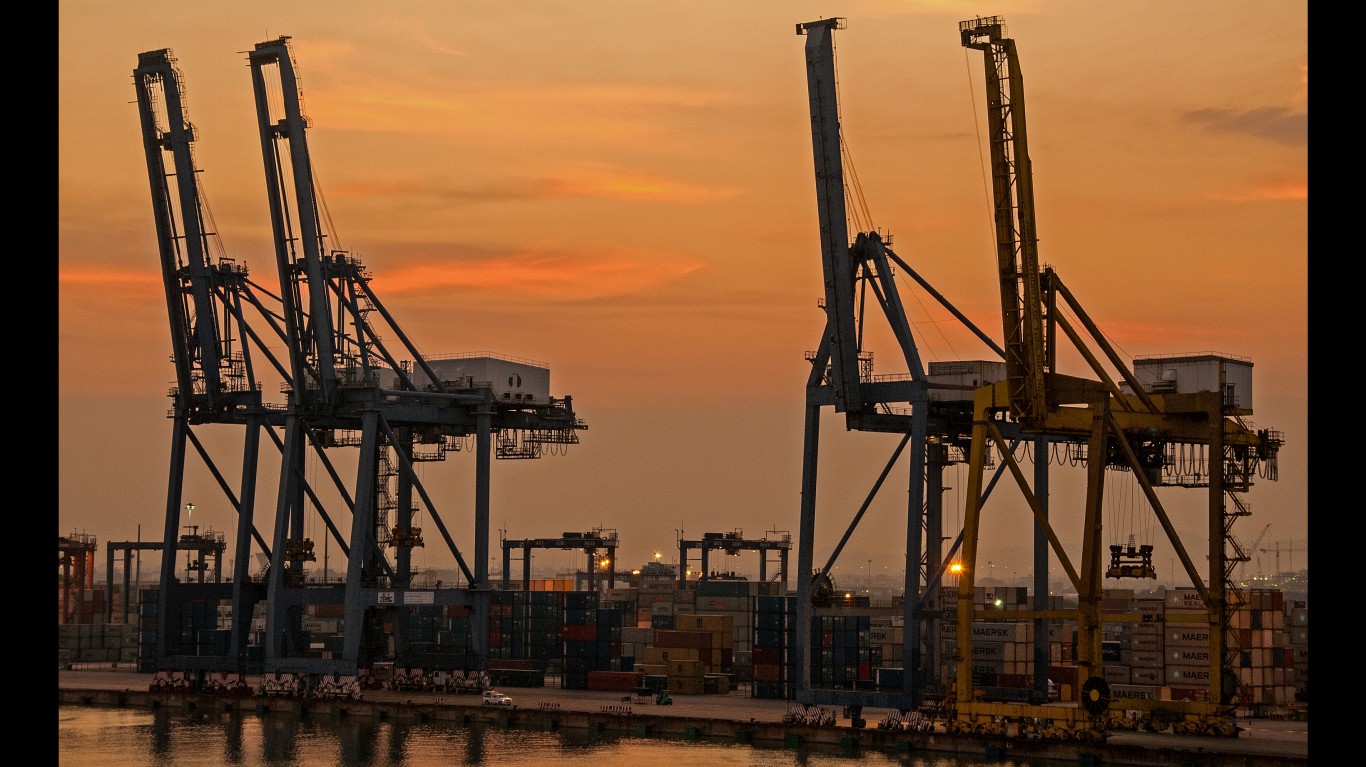
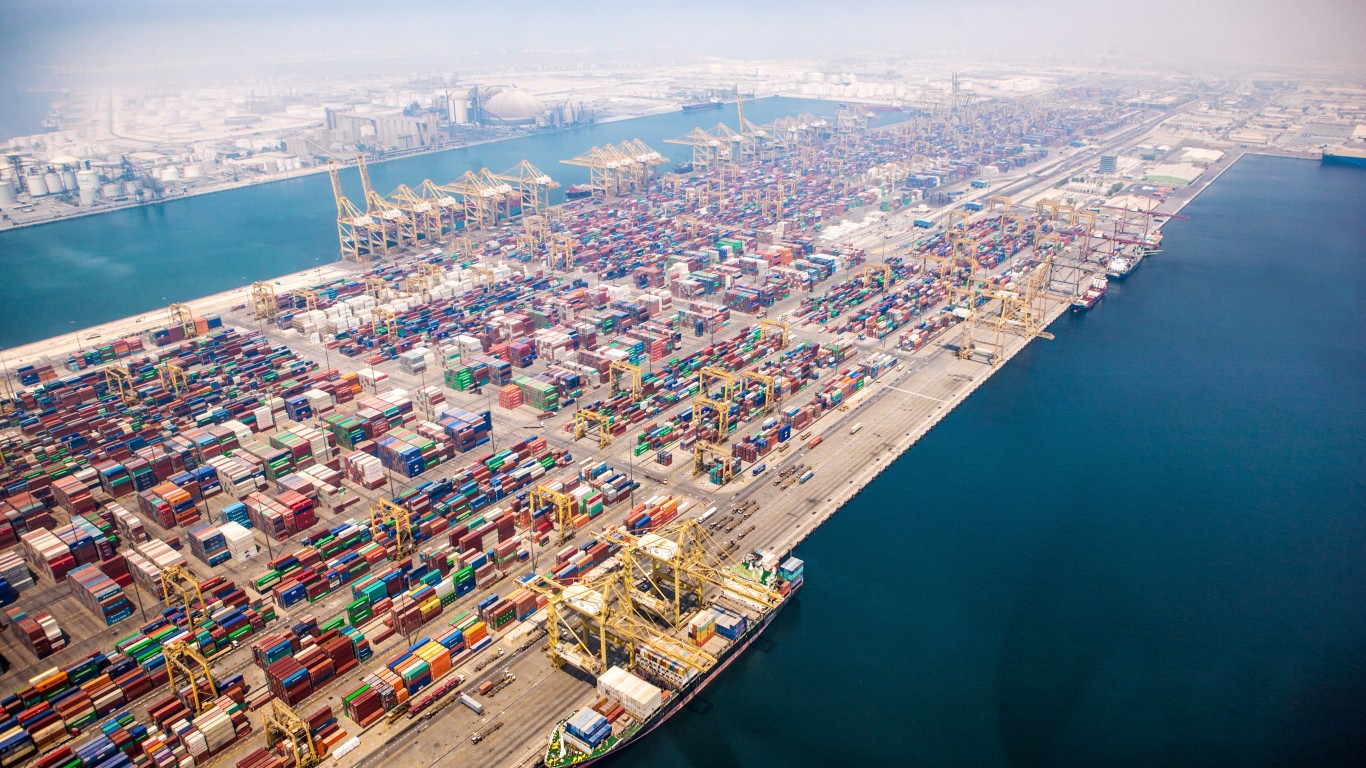
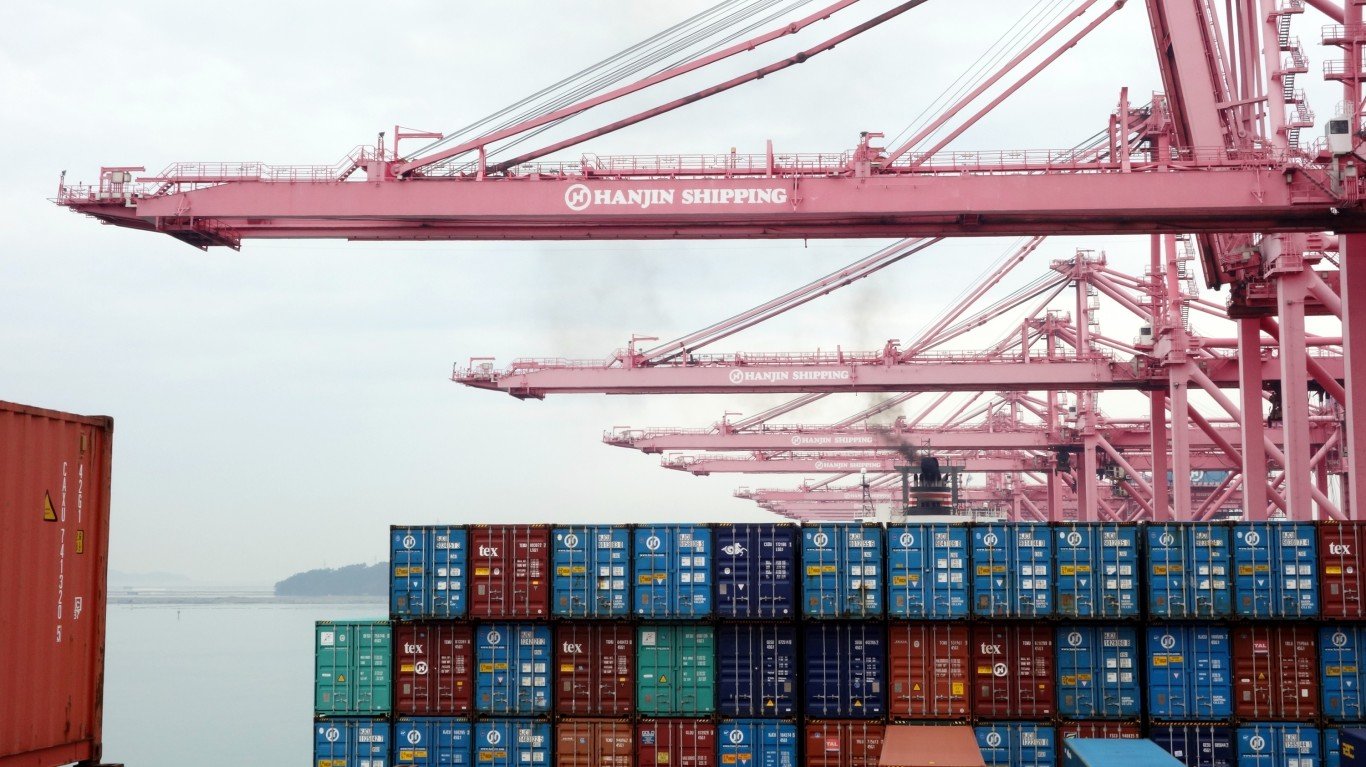
The global economy runs on metal boxes, typically measuring 20 feet (6.1 meters) in length, 8.5 feet (2.6 meters) in height, and 8 feet (2.4 meters) in width, providing 883 to 1,024 cubic feet of space for shipping anything from cars to diapers. (These are the most import dependent economies in the world.)
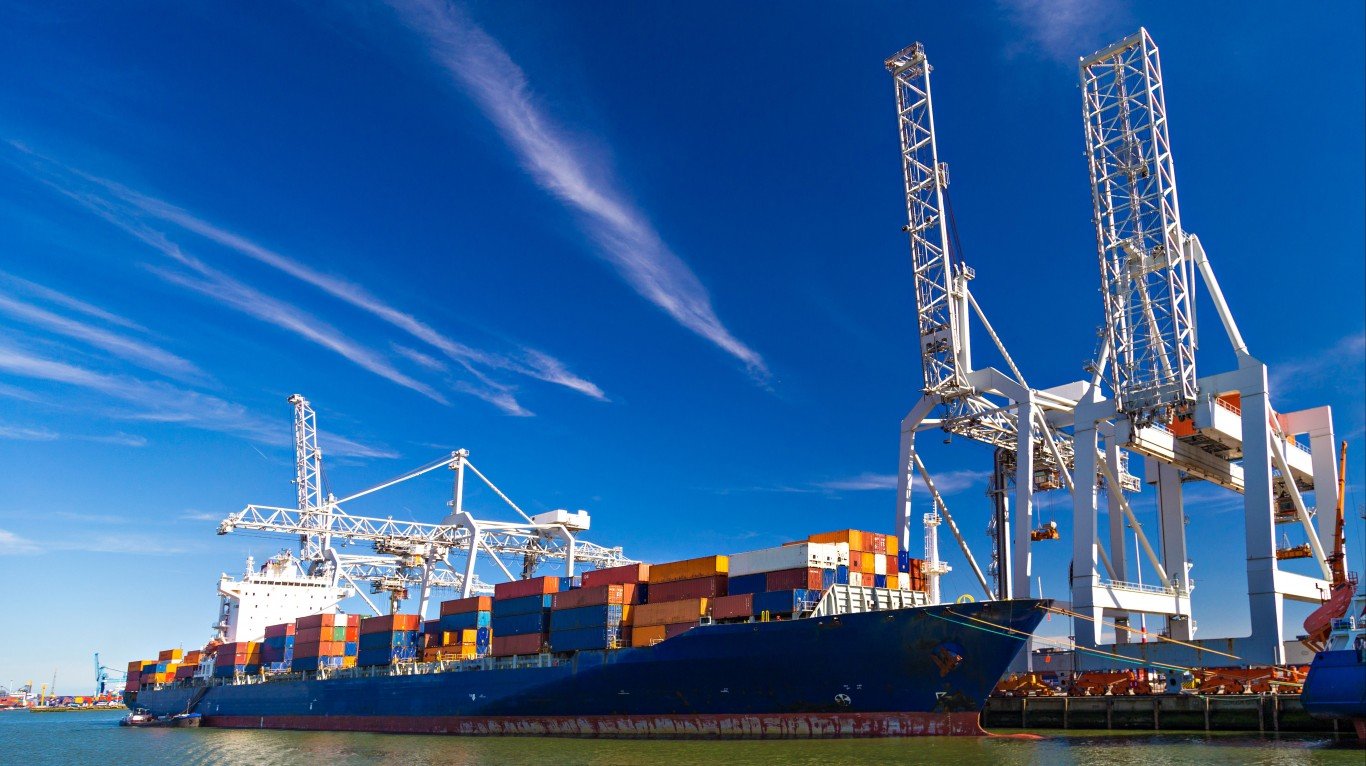
At any given time, roughly 5 million of the world’s 17 million freight containers are in active circulation, carried by the roughly 5,500 massive container ships operating today that ply the world’s oceans, seas, great lakes, and rivers.
The largest of these vessels can haul the equivalent of a 44-mile-long freight train, according to Monaco-based container ship provider Costamare. Some of the newest cargo ships have drafts that are so deep many ports cannot accept them. (These are 15 countries that control the world’s oil.)
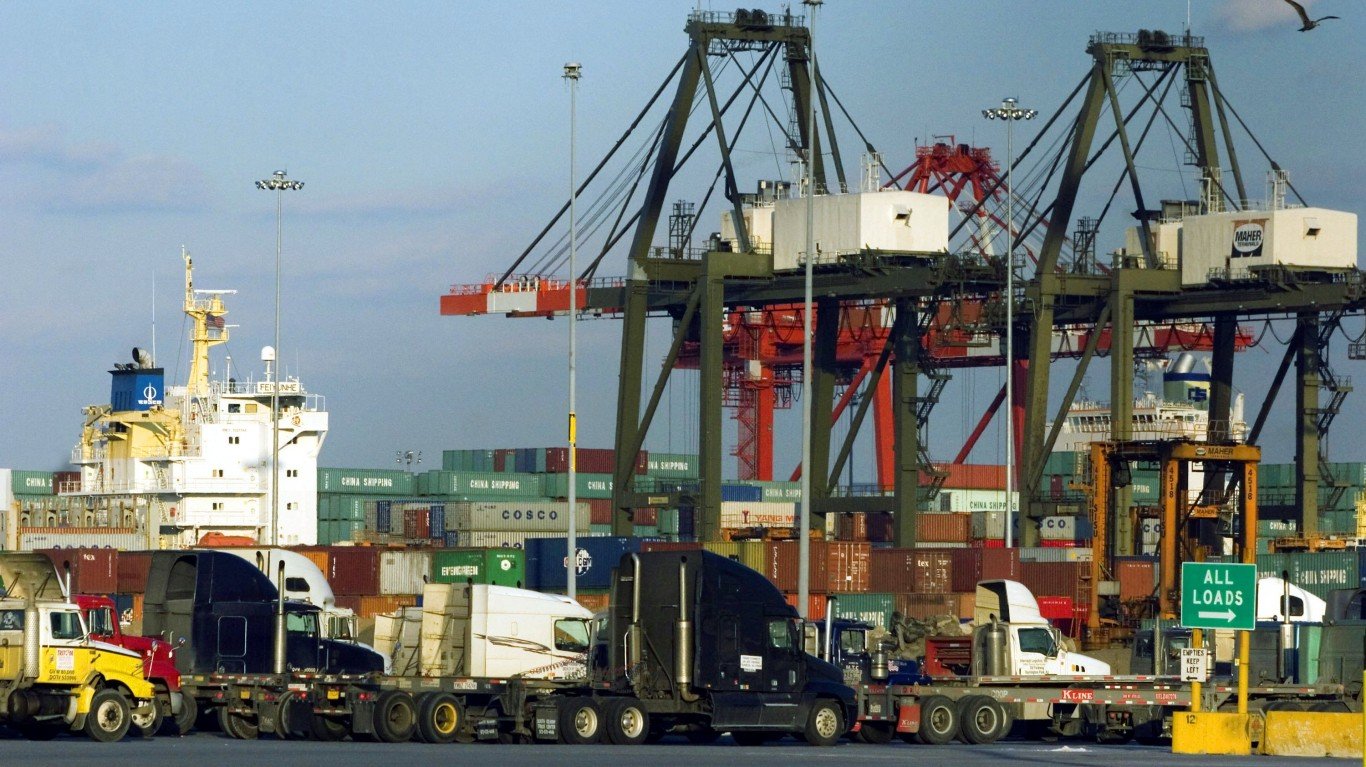
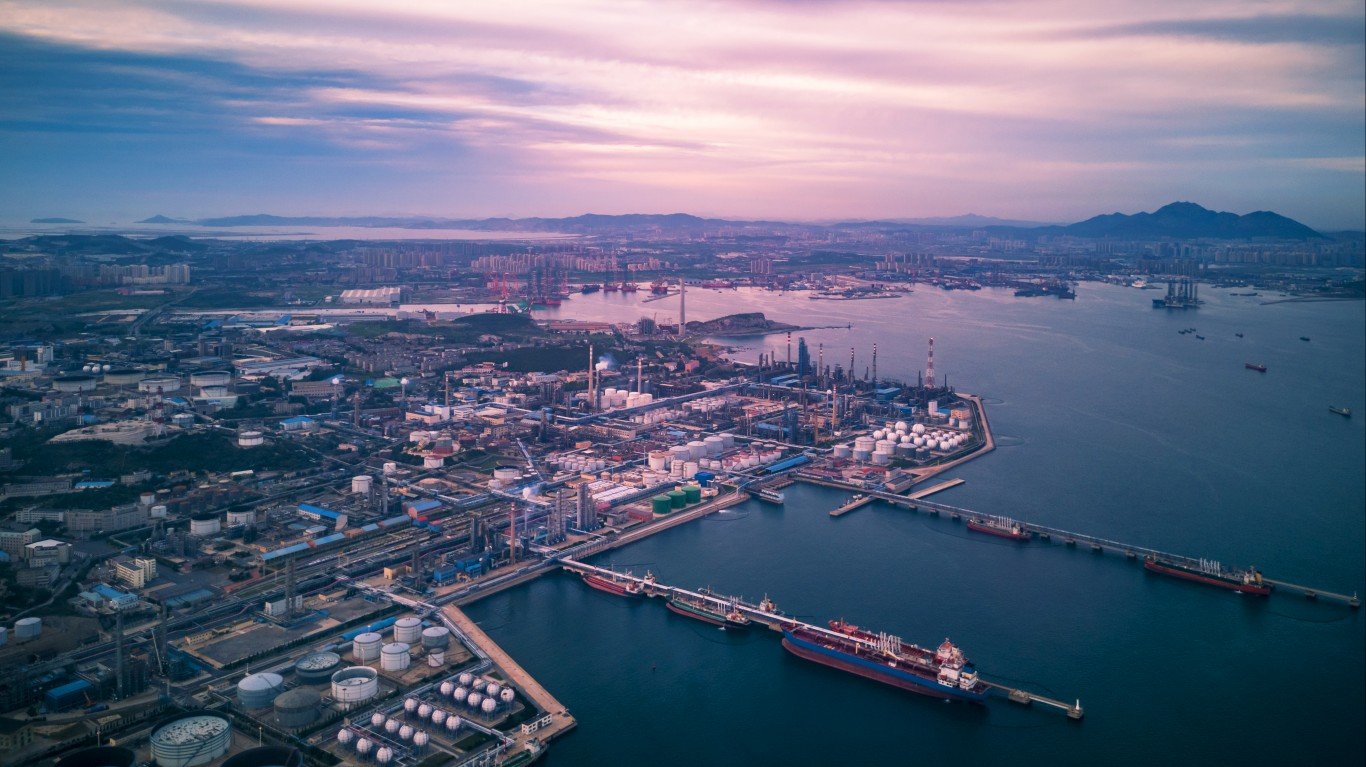
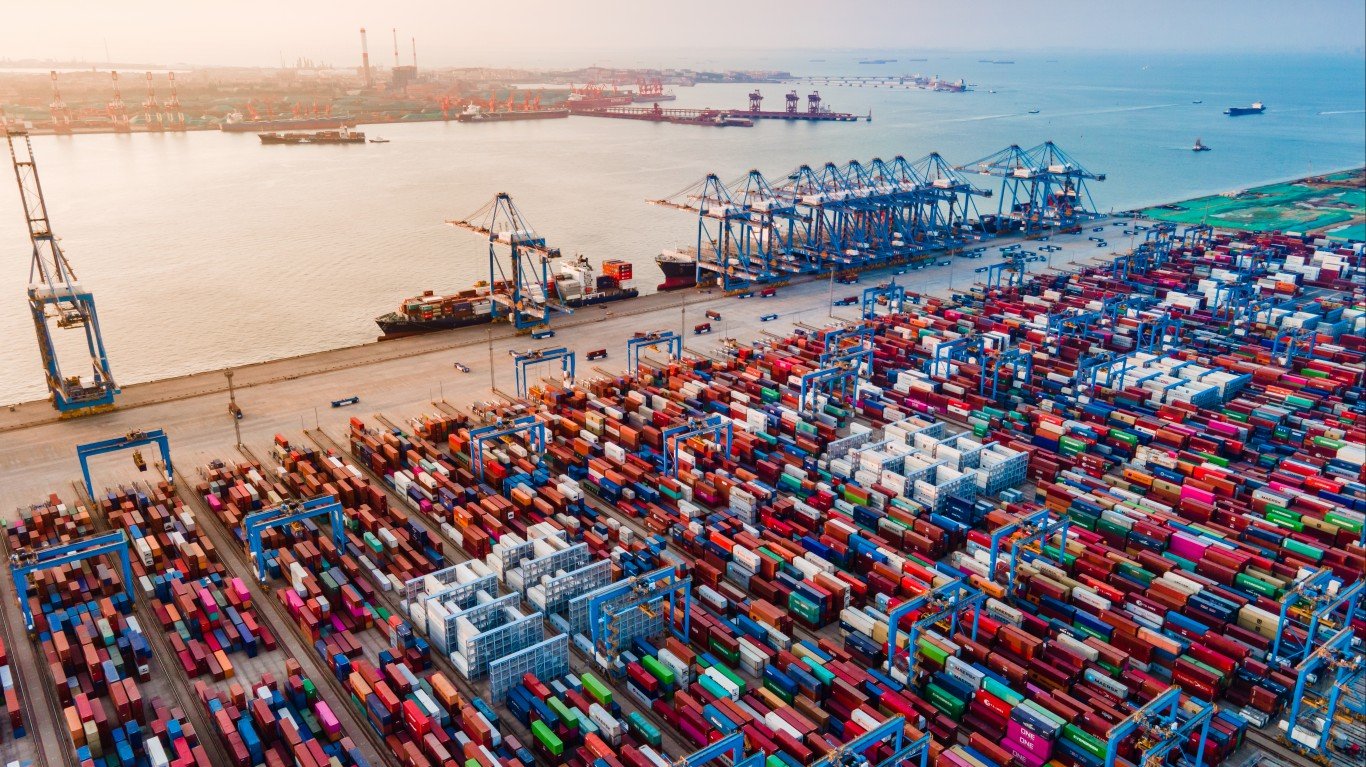
The location of the world’s largest ports shows where global trade runs the hottest. Of the top 25 largest ports based on the volume of goods that pass through them, eight are in Mainland China, three in the United States, and three in Europe. China is a top producer of outgoing goods, while Europe and North America are top consumers of these goods.
To identify the world’s 25 top shipping container ports, 24/7 Wall St. reviewed World Shipping Council’s list of Top 50 Container Ports, ranking ports by 2020 twenty-foot equivalent unit, or TEU. Additional data includes the number of vessels in the port from vessel movements and maritime information company Vesseltracker, with data taken March 16. These figures are dynamic and change constantly but provide a snapshot.
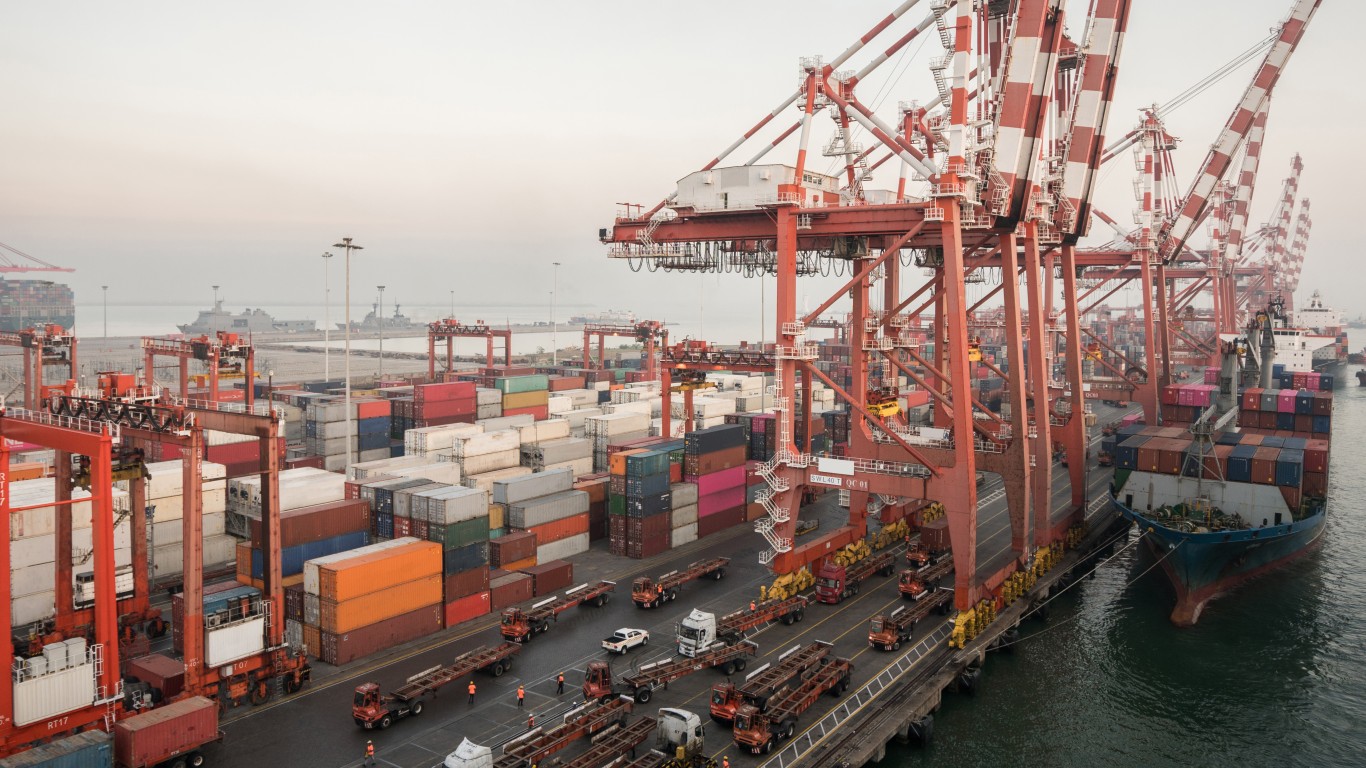
The world’s 25 top ports handled 390 million TEUs of cargo volume in 2020, up from 349 million TEUs in 2016, a 12% increase. The TEU is the common unit of measurement for ship-based logistics. In 2020, the average shipping volume in these ports was 16 million TEUs, up from 14 million TEUs four years earlier.
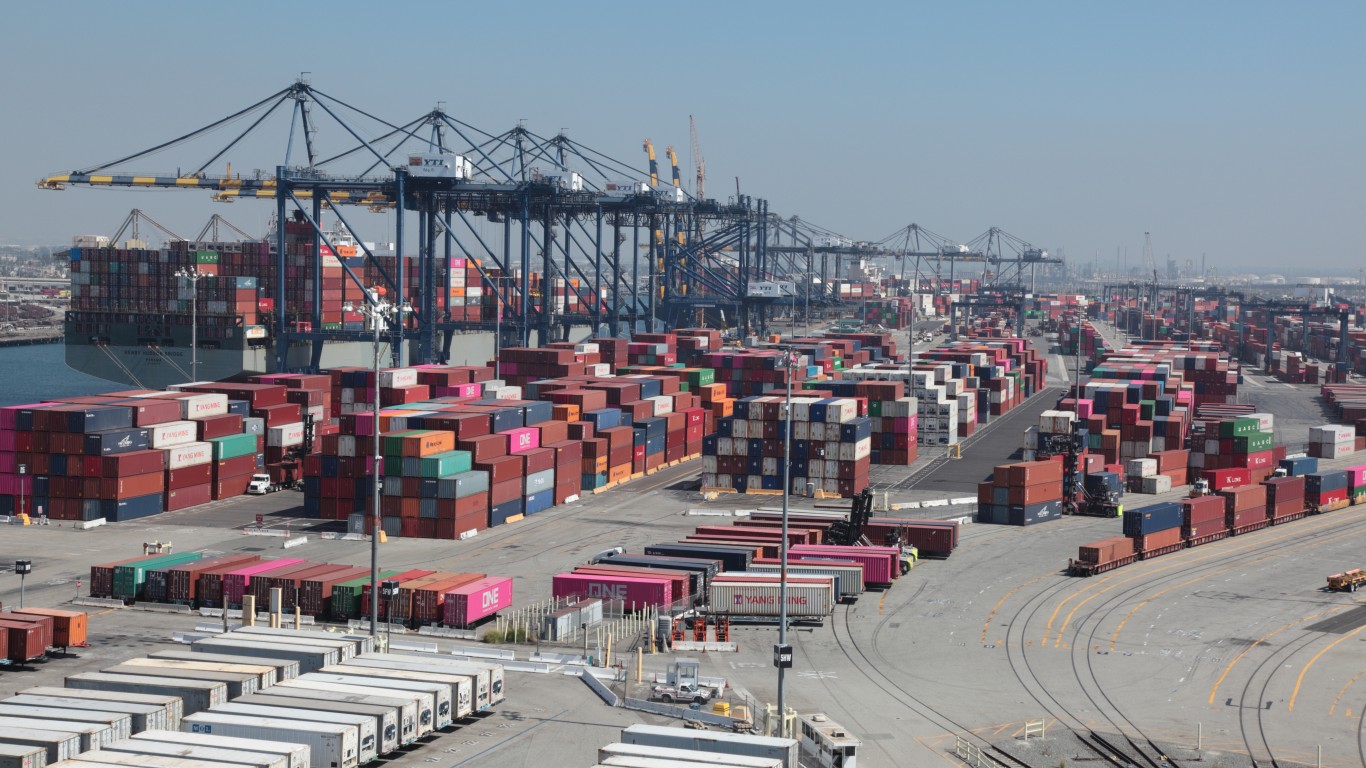
The U.S. ports of Los Angeles and Long Beach handled a combined 17.3 million TEUs in 2020, but these largest ports in the Western Hemisphere do not handle even half of the volume of the top global port in Shanghai.
Click here to see the busiest ports in the world
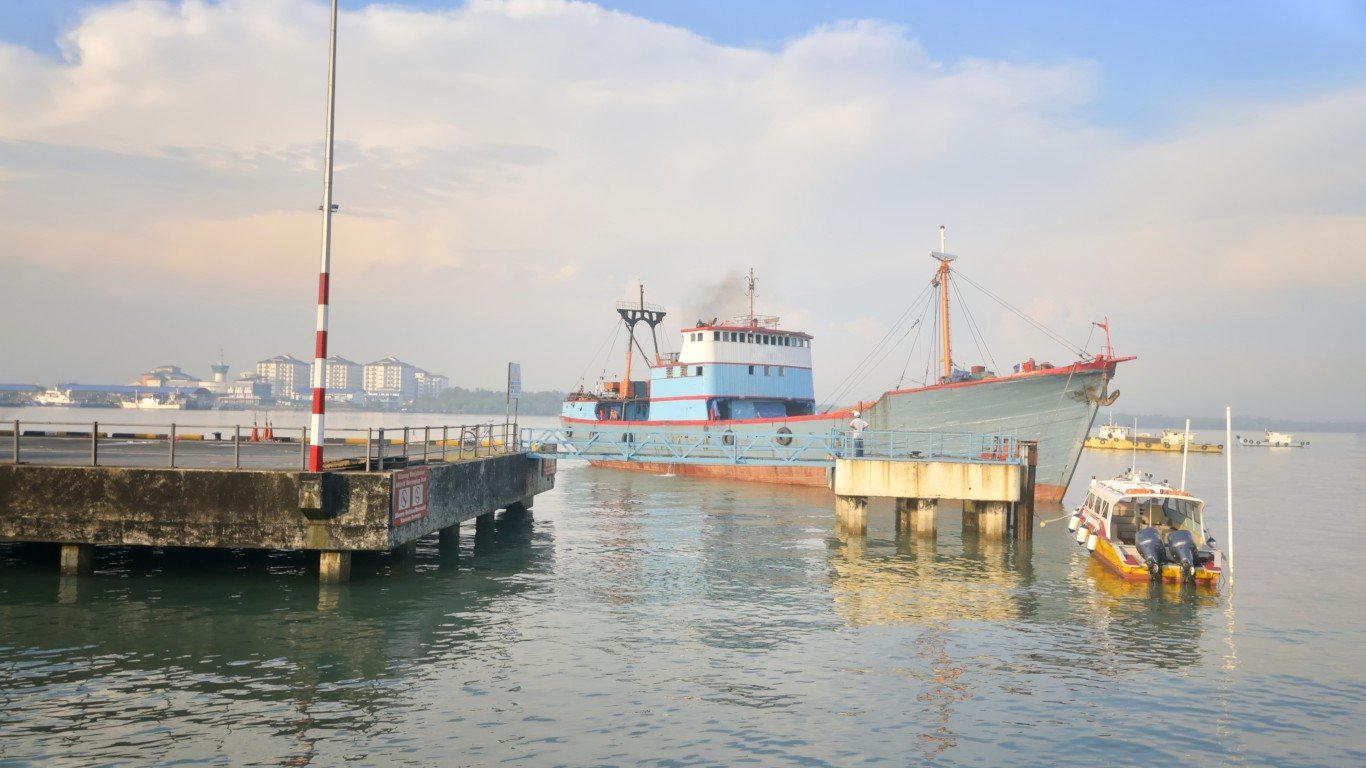
25. Tanjung Priok, Jakarta, Indonesia
> Volume 2020 (million TEU): 6.17
> Change from 2019: source discrepancy: -1.43 or -0.64 million TEU, -18.82% or 9.40%
> Change from 2016: 0.66 million TEU, or 11.98%
> Vessels in port, March 16: No data
[in-text-ad]
24. Dalian, China
> Volume 2020 (million TEU): 6.54
> Change from 2019: -3.67 million TEU, or -35.95%
> Change from 2016: -3.07 million TEU, or -31.95%
> Vessels in port, March 16: 340
[recirclink id=1065775]
23. Colombo, Sri Lanka
> Volume 2020 (million TEU): 6.85
> Change from 2019: -0.38 million TEU, or -5.26%
> Change from 2016: 1.12 million TEU, or 19.55%
> Vessels in port, March 16: 95
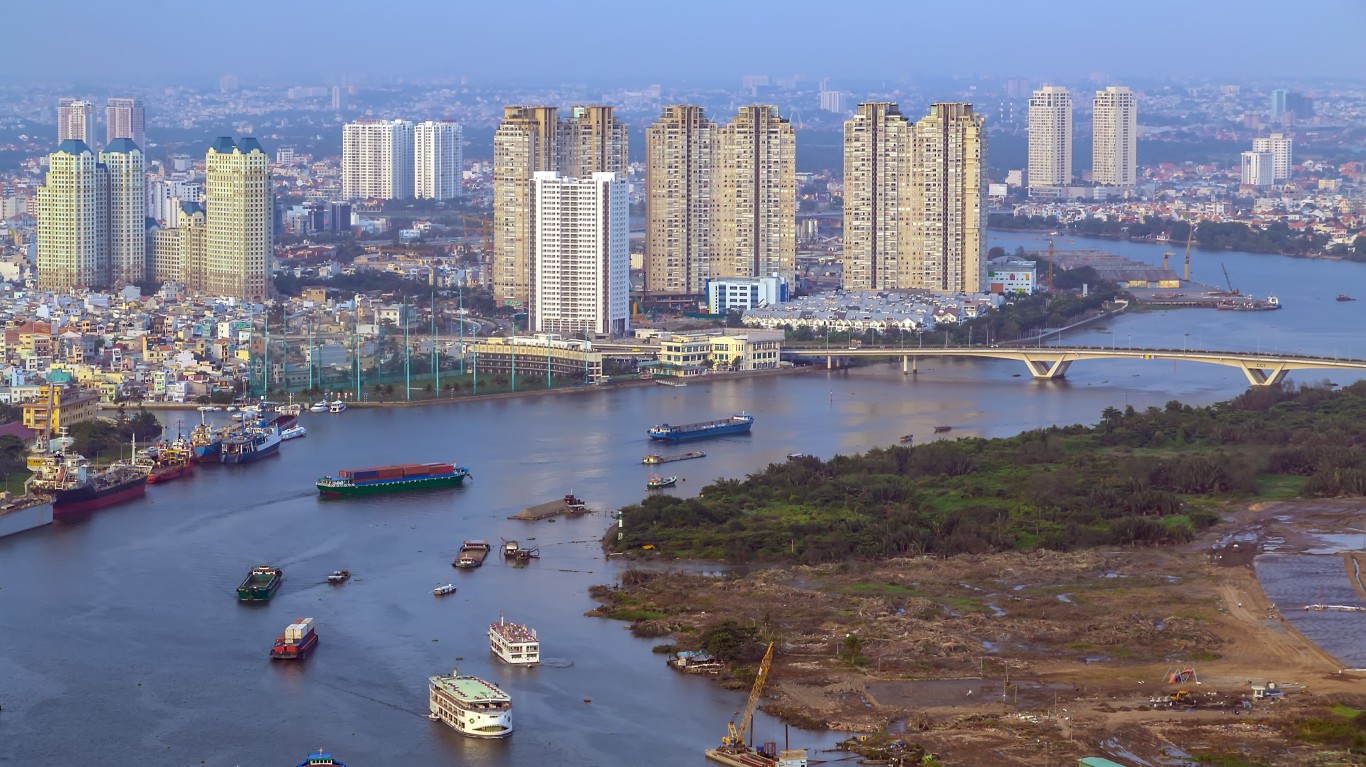
22. Ho Chi Minh City, Vietnam
> Volume 2020 (million TEU): 7.20
> Change from 2019: -0.02 million TEU, or -0.28%
> Change from 2016: 1.21 million TEU, or 20.20%
> Vessels in port, March 16: 171
[in-text-ad-2]
21. Laem Chabang, Thailand
> Volume 2020 (million TEU): 7.55
> Change from 2019: -0.55 million TEU, or -6.79%
> Change from 2016: 0.33 million TEU, or 4.57%
> Vessels in port, March 16: No data
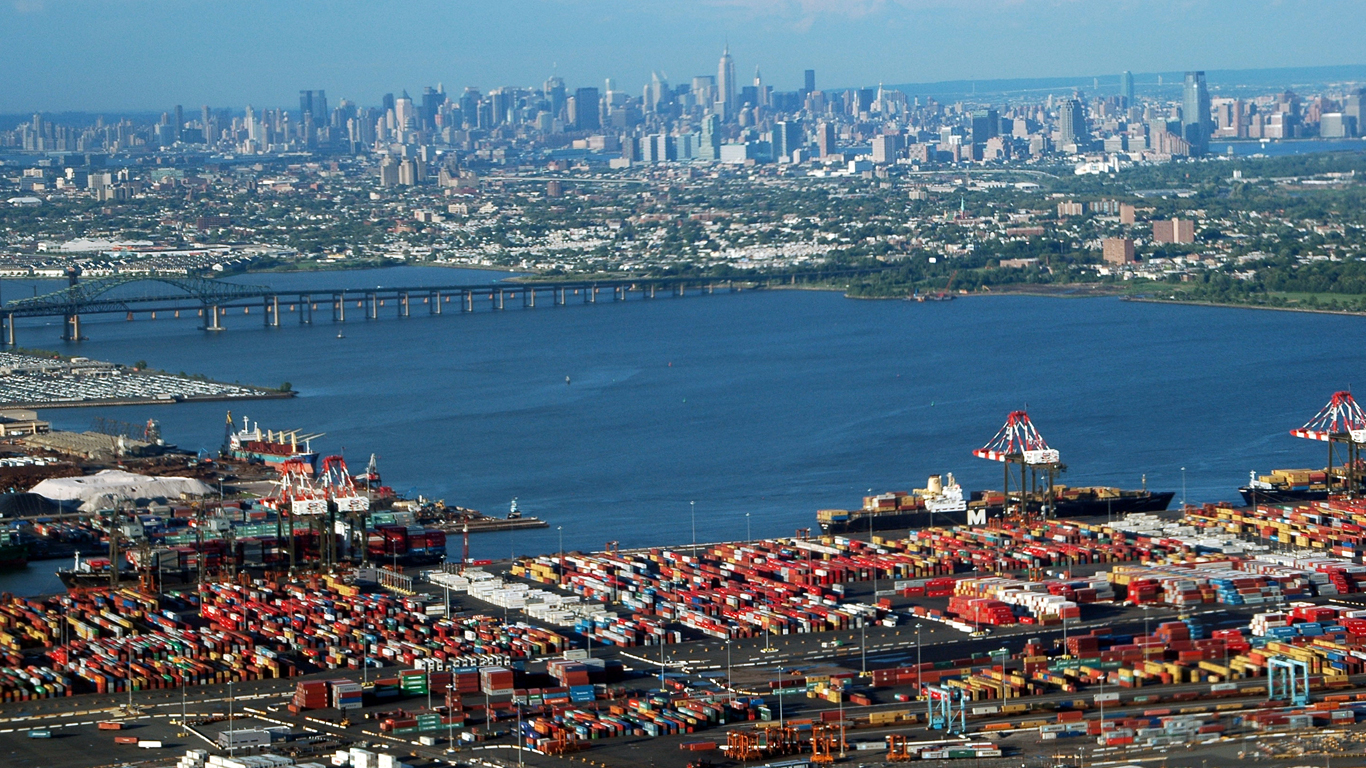
20. New York-New Jersey, United States of America
> Volume 2020 (million TEU): 7.59
> Change from 2019: 0.19 million TEU, or 2.57%
> Change from 2016: 1.34 million TEU, or 21.44%
> Vessels in port, March 16: 317
[in-text-ad]
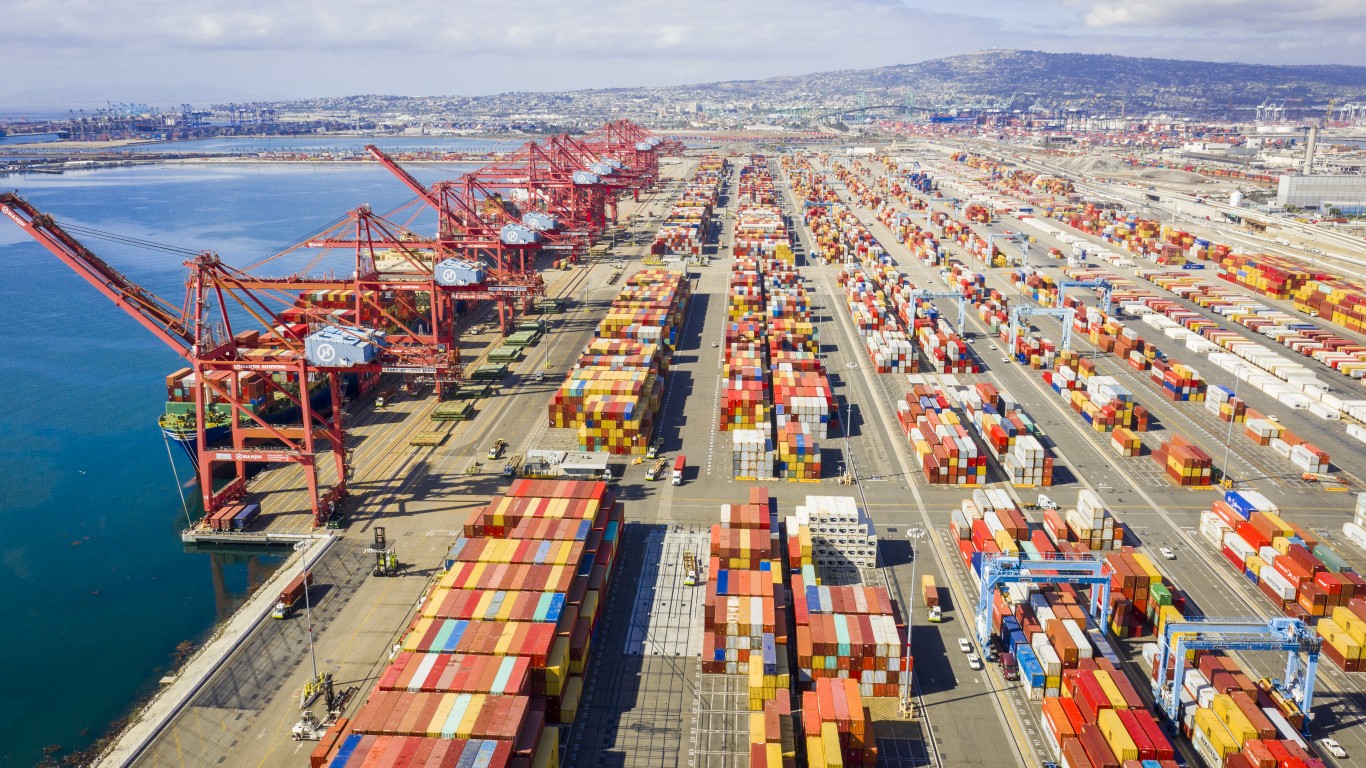
19. Long Beach, United States of America
> Volume 2020 (million TEU): 8.11
> Change from 2019: 0.48 million TEU, or 6.29%
> Change from 2016: 1.31 million TEU, or 19.26%
> Vessels in port, March 16: 109
[recirclink id=1048244]
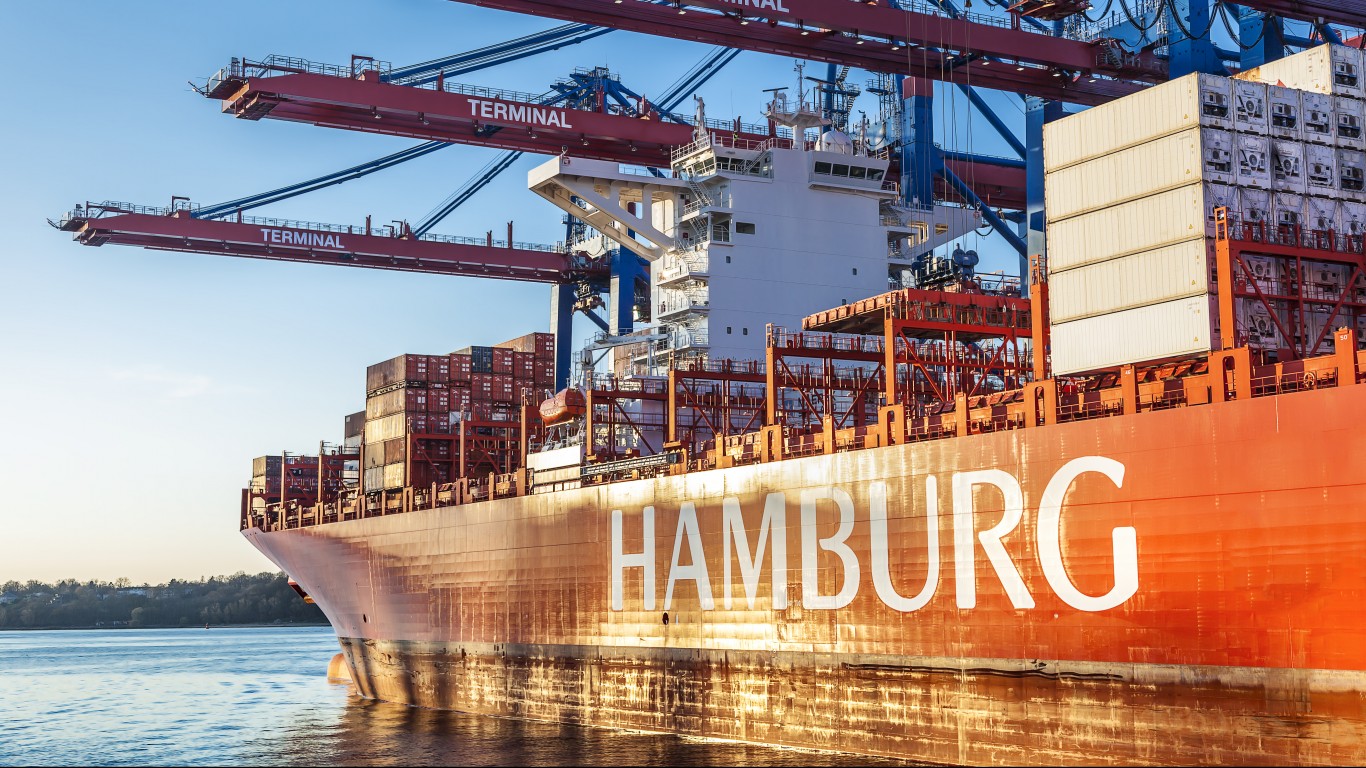
18. Hamburg, Germany
> Volume 2020 (million TEU): 8.70
> Change from 2019: -0.60 million TEU, or -6.45%
> Change from 2016: -0.21 million TEU, or -2.36%
> Vessels in port, March 16: 369
17. Los Angeles, United States of America
> Volume 2020 (million TEU): 9.20
> Change from 2019: -0.10 million TEU, or -1.08%
> Change from 2016: 0.34 million TEU, or 3.84%
> Vessels in port, March 16: 124
[in-text-ad-2]

16. Kaohsiung, Taiwan
> Volume 2020 (million TEU): 9.62
> Change from 2019: -0.80 million TEU, or -7.68%
> Change from 2016: -0.84 million TEU, or -8.03%
> Vessels in port, March 16: 403
15. Tanjung Pelepas, Malaysia
> Volume 2020 (million TEU): 9.85
> Change from 2019: 0.75 million TEU, or 8.24%
> Change from 2016: 1.57 million TEU, or 18.96%
> Vessels in port, March 16: No data
[in-text-ad]
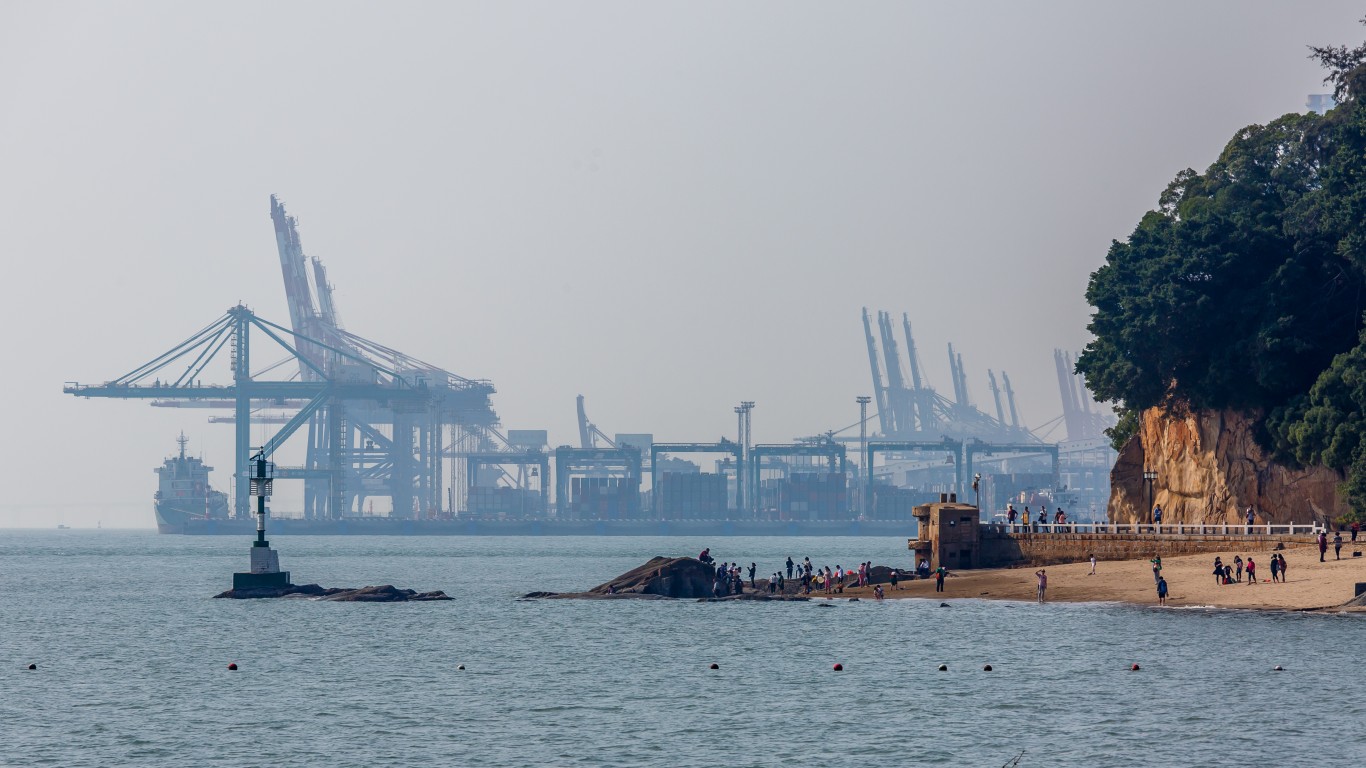
14. Xiamen, China
> Volume 2020 (million TEU): 11.41
> Change from 2019: 0.29 million TEU, or 2.61%
> Change from 2016: 1.80 million TEU, or 18.73%
> Vessels in port, March 16: 144
[recirclink id=946021]

13. Antwerp, Belgium
> Volume 2020 (million TEU): 12.04
> Change from 2019: 0.94 million TEU, or 8.47%
> Change from 2016: 2.00 million TEU, or 19.92%
> Vessels in port, March 16: 673
12. Port Klang, Malaysia
> Volume 2020 (million TEU): 13.24
> Change from 2019: -0.34 million TEU, or -2.50%
> Change from 2016: 0.04 million TEU, or 0.30%
> Vessels in port, March 16: 154
[in-text-ad-2]
11. Jebel Ali, Dubai, United Arab Emirates
> Volume 2020 (million TEU): 13.50
> Change from 2019: -0.61 million TEU, or -4.32%
> Change from 2016: -2.23 million TEU, or -14.18%
> Vessels in port, March 16: 269
10. Rotterdam, Netherlands
> Volume 2020 (million TEU): 14.35
> Change from 2019: -0.47 million TEU, or -3.17%
> Change from 2016: 1.97 million TEU, or 15.91%
> Vessels in port, March 16: 1,250
[in-text-ad]
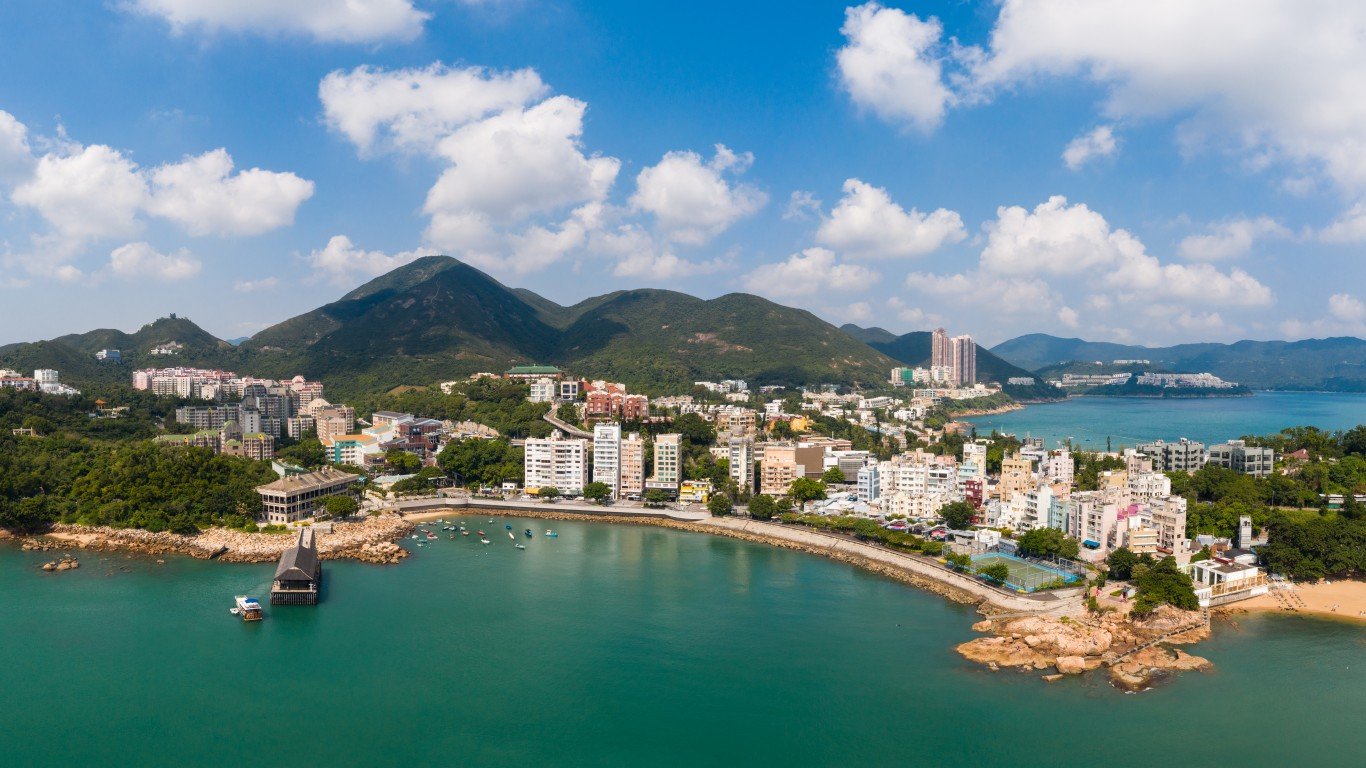
9. Hong Kong, S.A.R, China
> Volume 2020 (million TEU): 17.95
> Change from 2019: -0.35 million TEU, or -1.91%
> Change from 2016: -1.86 million TEU, or -9.39%
> Vessels in port, March 16: 948
[recirclink id=1067752]
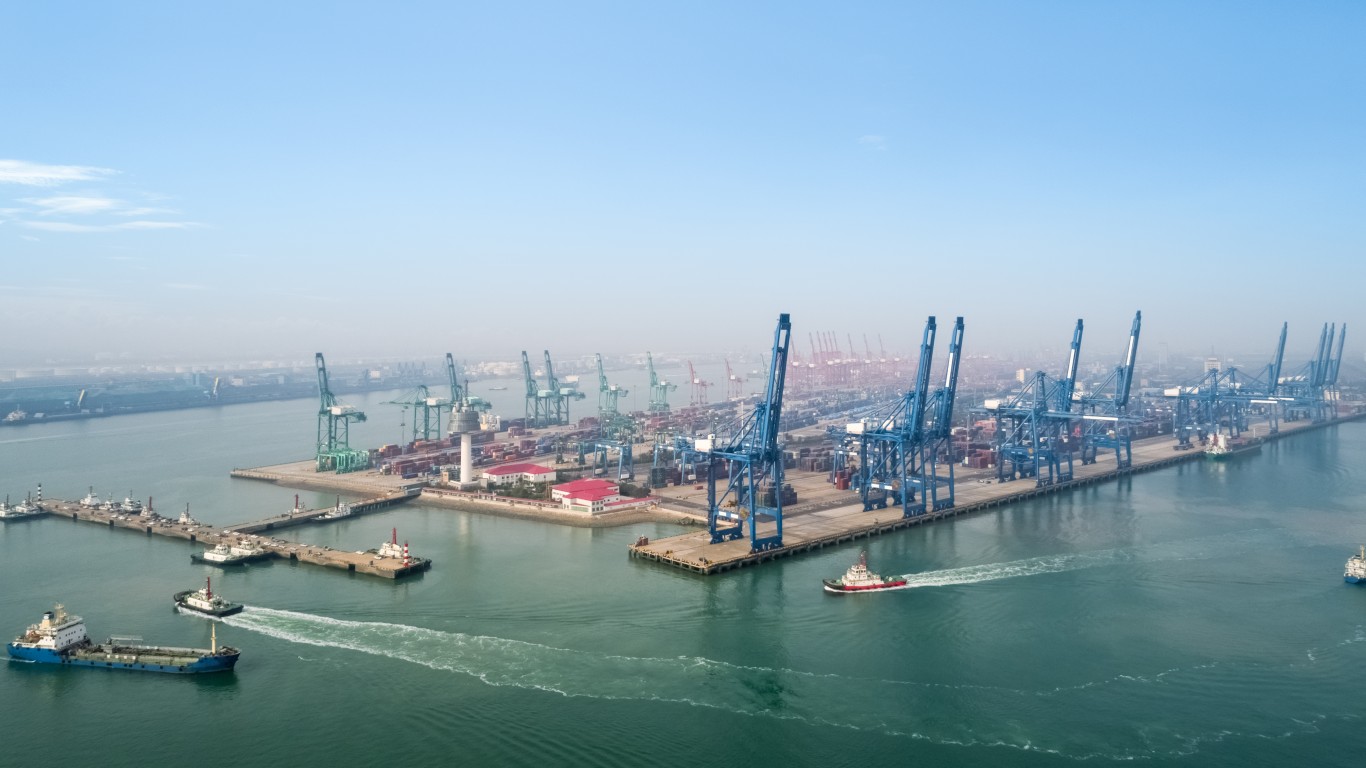
8. Tianjin, China
> Volume 2020 (million TEU): 18.35
> Change from 2019: 1.05 million TEU, or 6.07%
> Change from 2016: 3.86 million TEU, or 26.64%
> Vessels in port, March 16: 258
7. Busan, South Korea
> Volume 2020 (million TEU): 21.59
> Change from 2019: -0.40 million TEU, or -1.82%
> Change from 2016: 1.74 million TEU, or 8.77%
> Vessels in port, March 16: 563
[in-text-ad-2]
6. Qingdao, China
> Volume 2020 (million TEU): 22.00
> Change from 2019: 0.99 million TEU, or 4.71%
> Change from 2016: 3.99 million TEU, or 22.15%
> Vessels in port, March 16: 217
5. Guangzhou Harbor, China
> Volume 2020 (million TEU): 23.19
> Change from 2019: -0.04 million TEU, or -0.17%
> Change from 2016: 4.34 million TEU, or 23.02%
> Vessels in port, March 16: 634
[in-text-ad]
4. Shenzhen, China
> Volume 2020 (million TEU): 26.55
> Change from 2019: 0.78 million TEU, or 3.03%
> Change from 2016: 2.58 million TEU, or 10.76%
> Vessels in port, March 16: No data
[recirclink id=1065775]
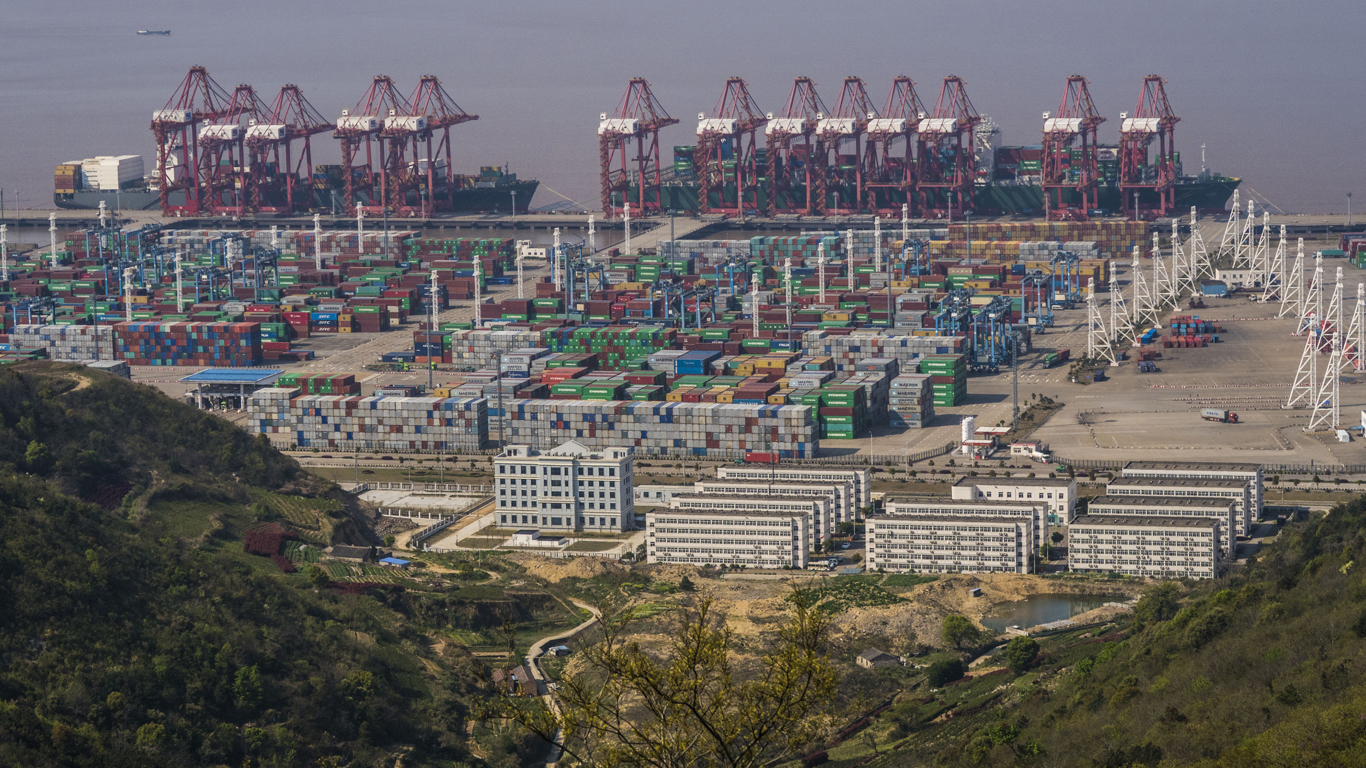
3. Ningbo-Zhoushan, China
> Volume 2020 (million TEU): 28.72
> Change from 2019: 1.23 million TEU, or 4.47%
> Change from 2016: 7.12 million TEU, or 32.96%
> Vessels in port, March 16: 1,758

2. Singapore, Singapore
> Volume 2020 (million TEU): 36.60
> Change from 2019: -0.60 million TEU, or -1.61%
> Change from 2016: 5.70 million TEU, or 18.45%
> Vessels in port, March 16: 1,036
[in-text-ad-2]
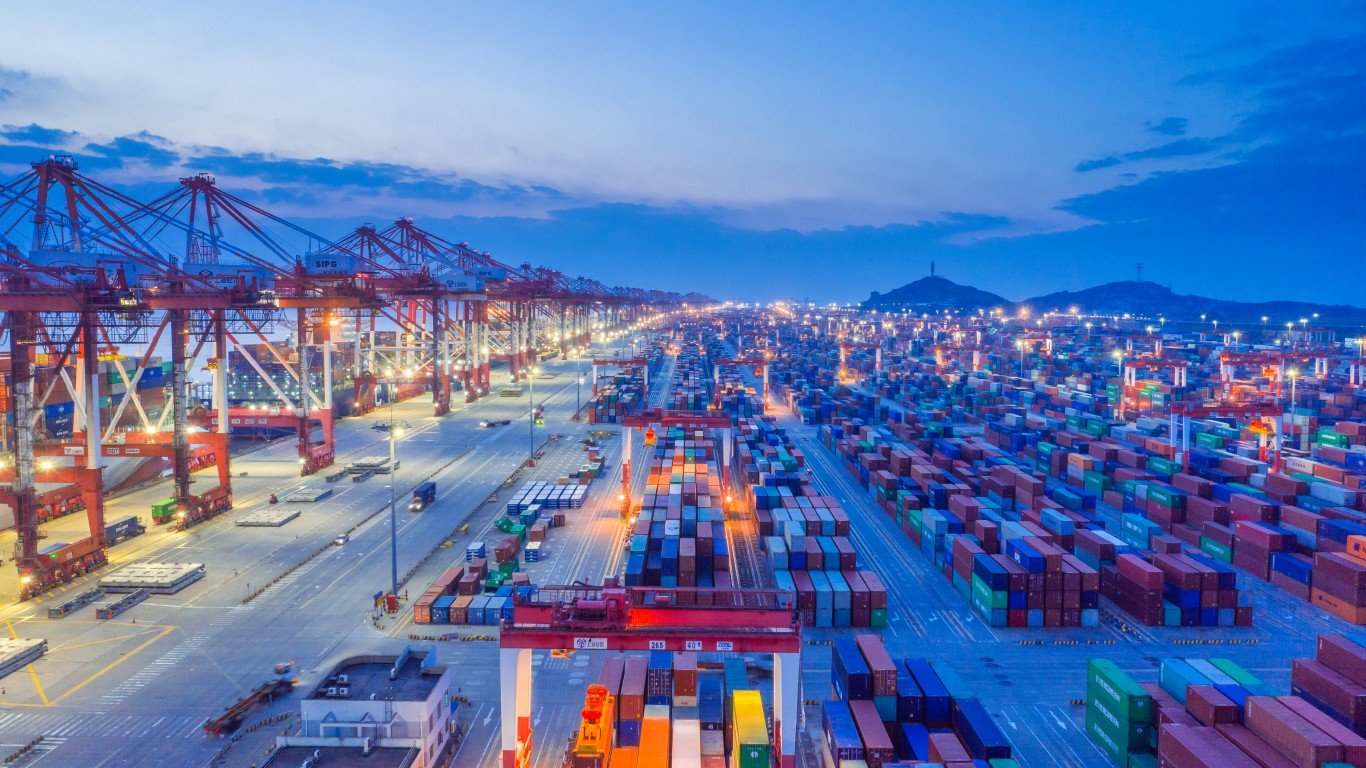
1. Shanghai, China
> Volume 2020 (million TEU): 43.50
> Change from 2019: 0.20 million TEU, or 0.46%
> Change from 2016: 6.37 million TEU, or 17.16%
> Vessels in port, March 16: 4,405
Contact [email protected] for any questions or corrections.