
The past 20 years have been an era of rapid economic growth in China. Between 2001 and 2021, China’s gross domestic product grew by more than 1,200% – from $1.34 trillion to $17.73 trillion, in current U.S. dollars. Meanwhile, the share of the Chinese population living on poverty-level income – defined as less than $5.50 U.S. dollars per day – fell from 86.9% to less than 25% over roughly the same period.
Chinese GDP growth was driven by a series of economic reforms that began in 1979. These reforms resulted in greater investment in capital and improvements in productivity. Still, despite ranking among the world’s fastest growing economies, China lags far behind the United States in GDP per capita, a measure of prosperity at the individual level.
Even in many of China’s wealthiest cities, the standard of living is considerably lower than it is in America’s wealthiest cities, though many cities are catching up.
Using data from Sina Finance, the China Statistical Yearbook 2022, and the U.S. Bureau of Economic Analysis, 24/7 Wall St. compared GDP levels in the 20 wealthiest Chinese and the 20 wealthiest American metro areas. GDP is expressed in 2021 U.S. dollars. 24/7 Wall St. also calculated GDP per capita for each city.
Each of the 20 wealthiest U.S. cities by GDP has greater overall economic output than its Chinese counterpart, by anywhere from about 21% to nearly 200% higher. Additionally, with only a handful of exceptions, the 20 wealthiest American cities have a smaller population base than the comparably ranked Chinese city. (Here is a look at the world’s nations with 100 million people or more.)
As a result, Americans living in the wealthiest U.S. cities are, on average, more prosperous than the Chinese residing in China’s wealthiest cities. Among the 20 U.S. cities on this list, GDP per capita ranges from $45,815 to $210,236. Meanwhile, GDP per capita in the 20 Chinese cities on this list ranges from $17,638 to $65,466.
Only two of China’s wealthiest cities have a higher GDP per capita than their comparably ranked American metro. Fuzhou, Fujian, the 20th wealthiest city in China, and Wuxi, Jiangsu, the 14th wealthiest Chinese city, have a higher GDP per capita than Riverside-San Bernardino-Ontario, California and Phoenix-Mesa-Chandler, Arizona, the 20th and 14th wealthiest American cities, respectively. (Here is a look at the 27 poorest nations on Earth.)
Click here to see how the richest Chinese cities compare to US.
Click here to read our detailed methodology.

Source: WangAnQi / iStock via Getty Images
20. Fuzhou, Fujian
> GDP, 2021: $175.5 billion – 20th highest in China
> Population, 2021: 3,764,559
> GDP per capita: $46,631
[in-text-ad]
Source: MattGush / iStock via Getty Images
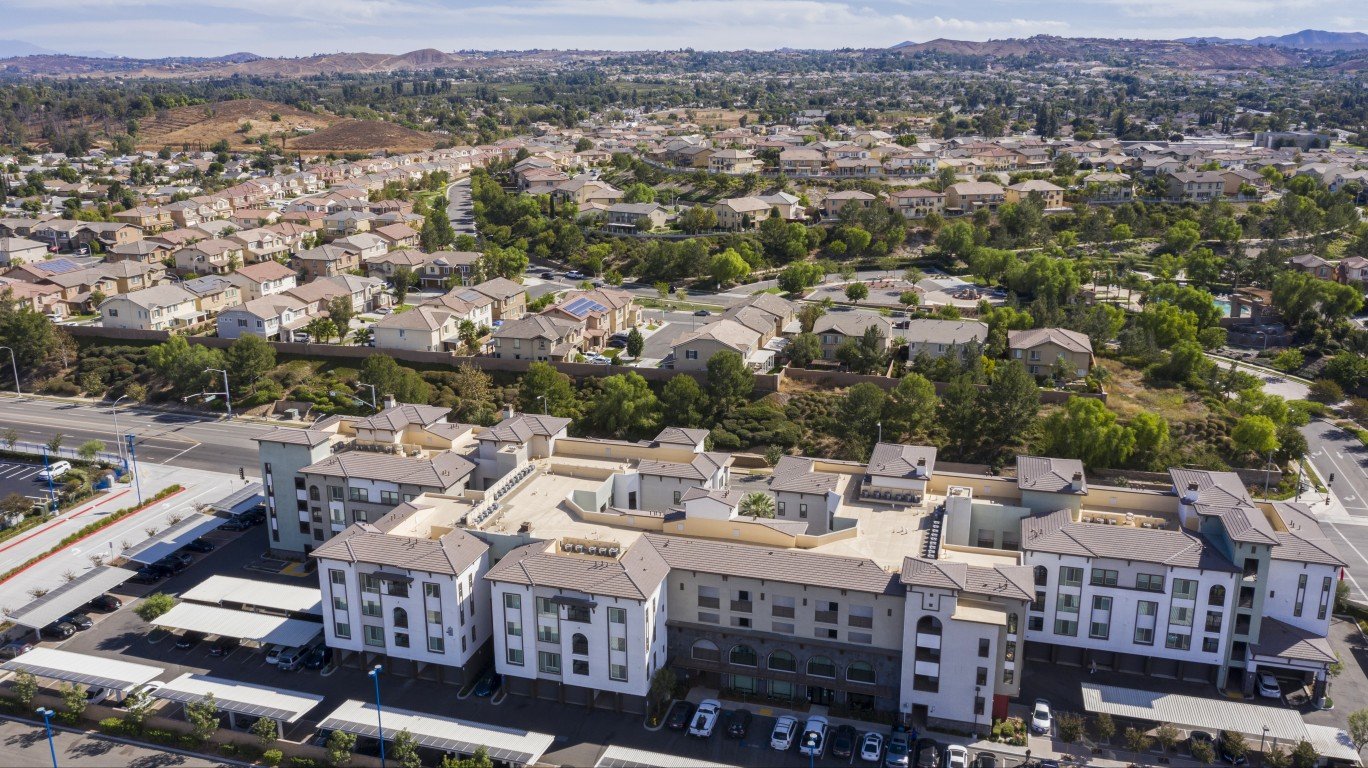
20. Riverside-San Bernardino-Ontario, CA
> GDP, 2021: $213.2 billion – 20th highest in the US
> Population, 2021: 4,653,105
> GDP per capita: $45,815

Source: 4045 / iStock via Getty Images
19. Hefei, Anhui
> GDP, 2021: $176.9 billion – 19th highest in China
> Population, 2021: 4,371,005
> GDP per capita: $40,477

Source: Kruck20 / iStock via Getty Images
19. Baltimore-Columbia-Towson, MD
> GDP, 2021: $223.0 billion – 19th highest in the US
> Population, 2021: 2,838,327
> GDP per capita: $78,556
[in-text-ad-2]
Source: onlyyouqj / iStock via Getty Images
18. Jinan, Shandong
> GDP, 2021: $177.2 billion – 18th highest in China
> Population, 2021: 5,513,597
> GDP per capita: $32,142

Source: Kruck20 / iStock via Getty Images
18. Denver-Aurora-Lakewood, CO
> GDP, 2021: $253.4 billion – 18th highest in the US
> Population, 2021: 2,972,567
> GDP per capita: $85,246
[in-text-ad]
Source: david eric / Getty Images
17. Foshan, Guangdong
> GDP, 2021: $188.5 billion – 17th highest in China
> Population, 2021: 7,406,751
> GDP per capita: $25,450
Source: SeanPavonePhoto / iStock via Getty Images
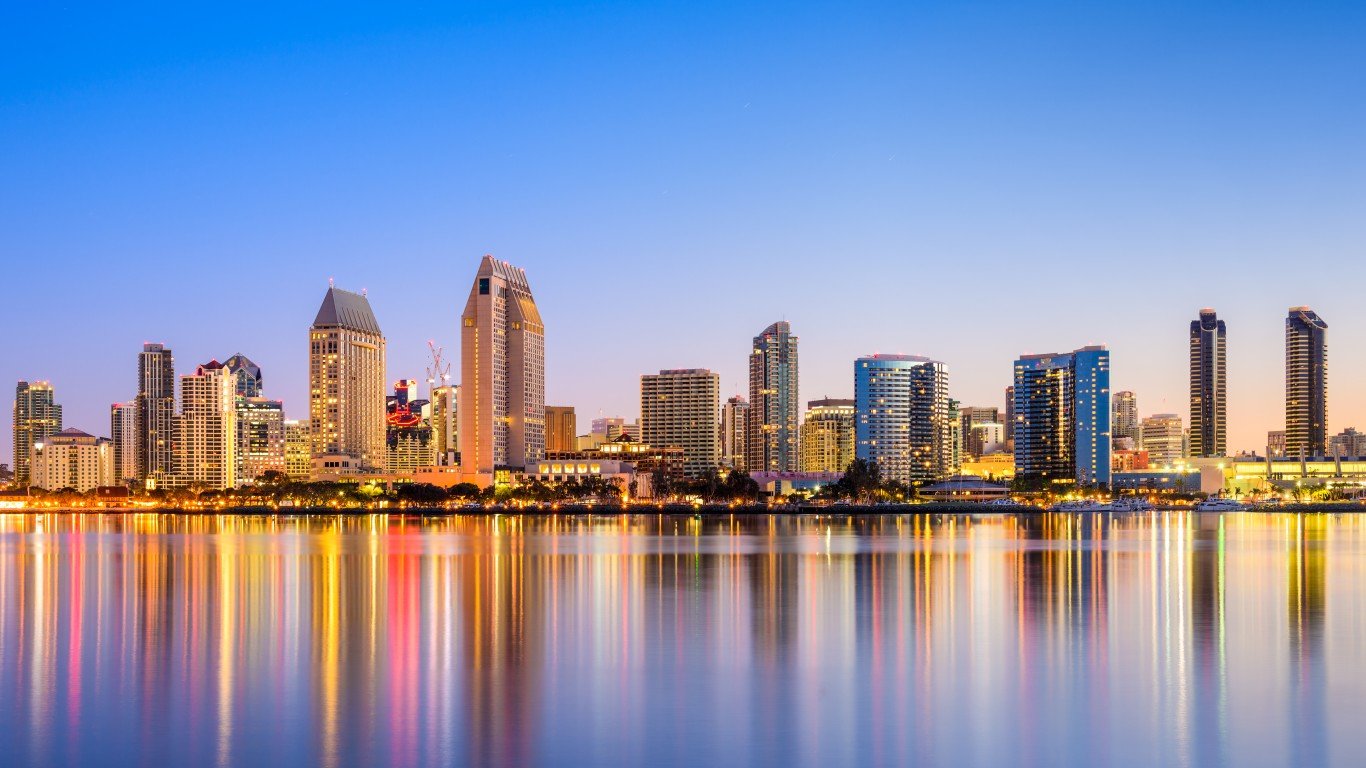
17. San Diego-Chula Vista-Carlsbad, CA
> GDP, 2021: $268.0 billion – 17th highest in the US
> Population, 2021: 3,286,069
> GDP per capita: $81,548
Source: xijian / E+ via Getty Images
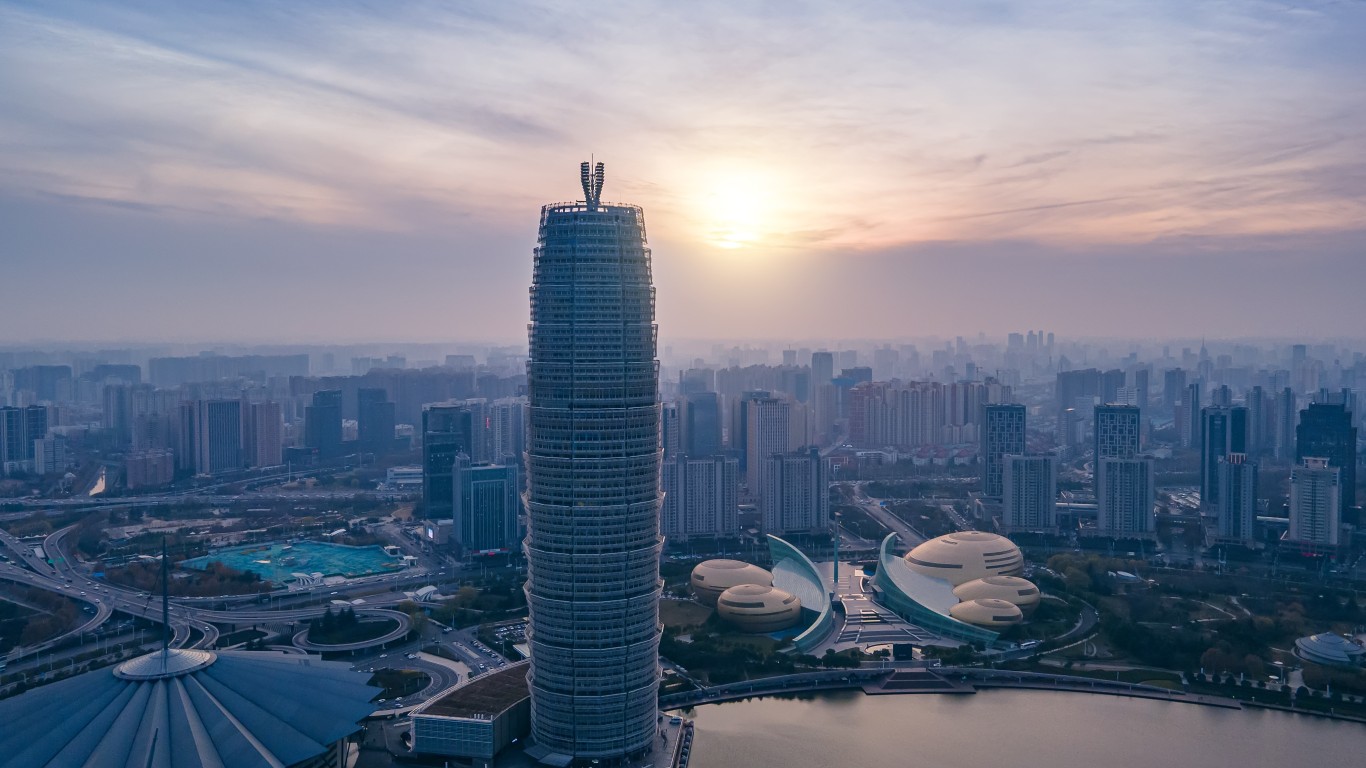
16. Zhengzhou, Henan
> GDP, 2021: $196.7 billion – 16th highest in China
> Population, 2021: 5,510,341
> GDP per capita: $35,703
[in-text-ad-2]
Source: pawel.gaul / E+ via Getty Images
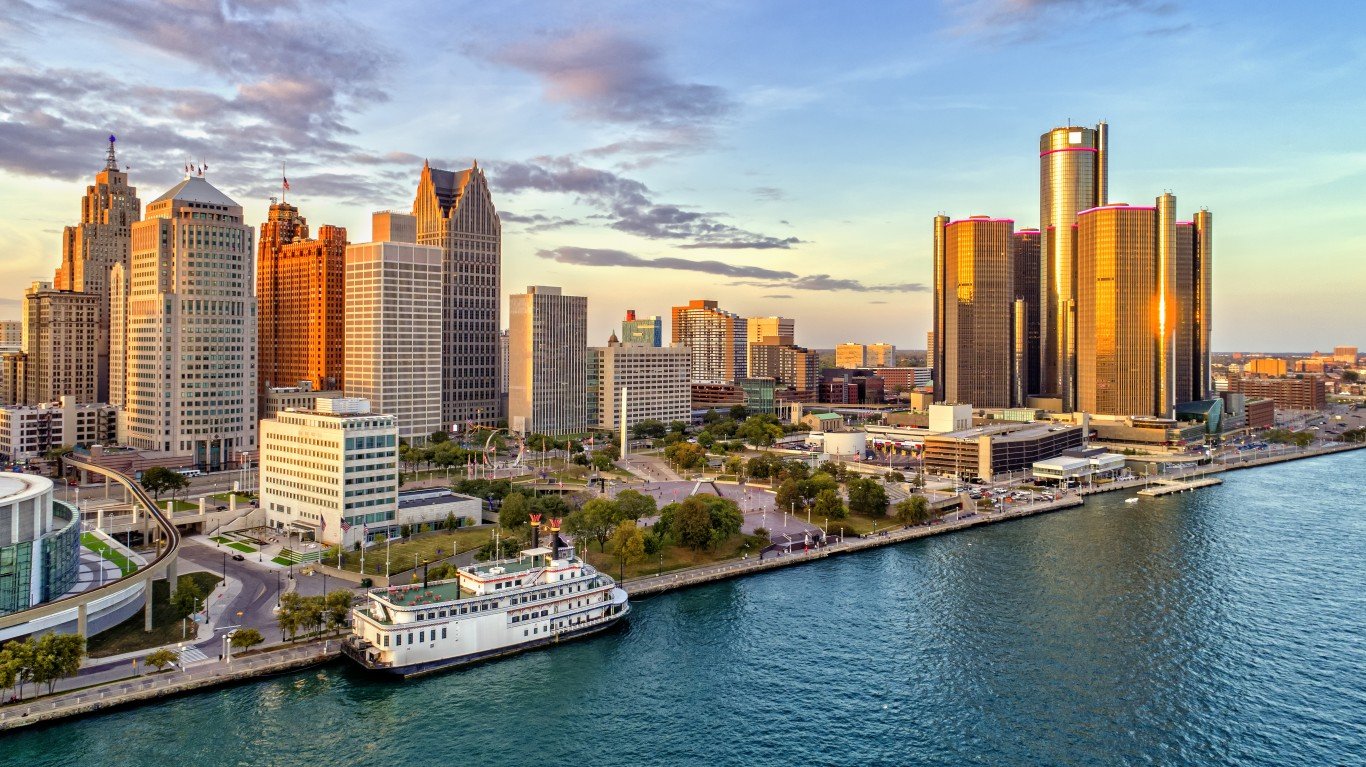
16. Detroit-Warren-Dearborn, MI
> GDP, 2021: $283.7 billion – 16th highest in the US
> Population, 2021: 4,365,205
> GDP per capita: $64,982

Source: chuyu / iStock via Getty Images
15. Changsha, Hunan
> GDP, 2021: $205.7 billion – 15th highest in China
> Population, 2021: 4,694,722
> GDP per capita: $43,821
[in-text-ad]
Source: JenniferPhotographyImaging / E+ via Getty Images
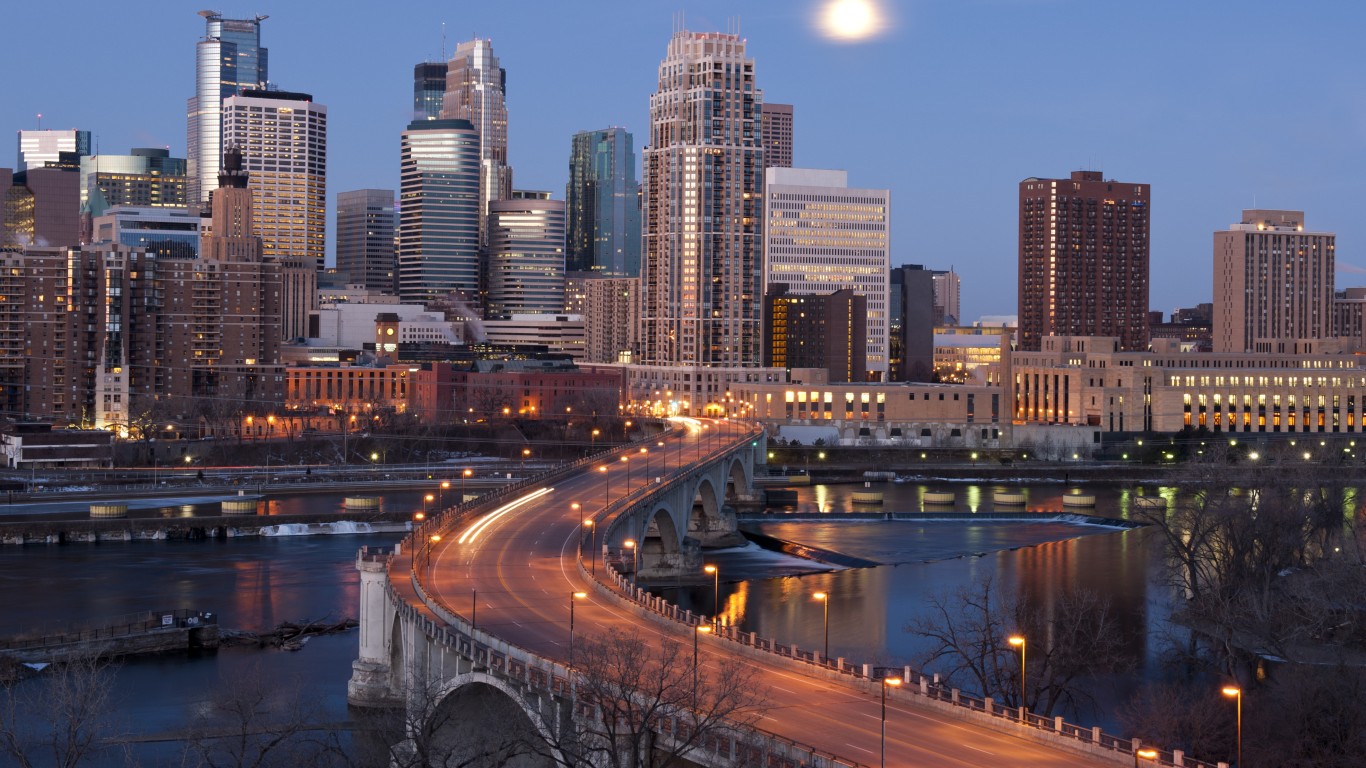
15. Minneapolis-St. Paul-Bloomington, MN-WI
> GDP, 2021: $297.0 billion – 15th highest in the US
> Population, 2021: 3,690,512
> GDP per capita: $80,468
 24/7 Wall St.
Source: ZZ3701 / iStock via Getty Images
14. Wuxi, Jiangsu
> GDP, 2021: $217.0 billion – 14th highest in China
> Population, 2021: 3,315,113
> GDP per capita: $65,466
Source: photoquest7 / iStock via Getty Images
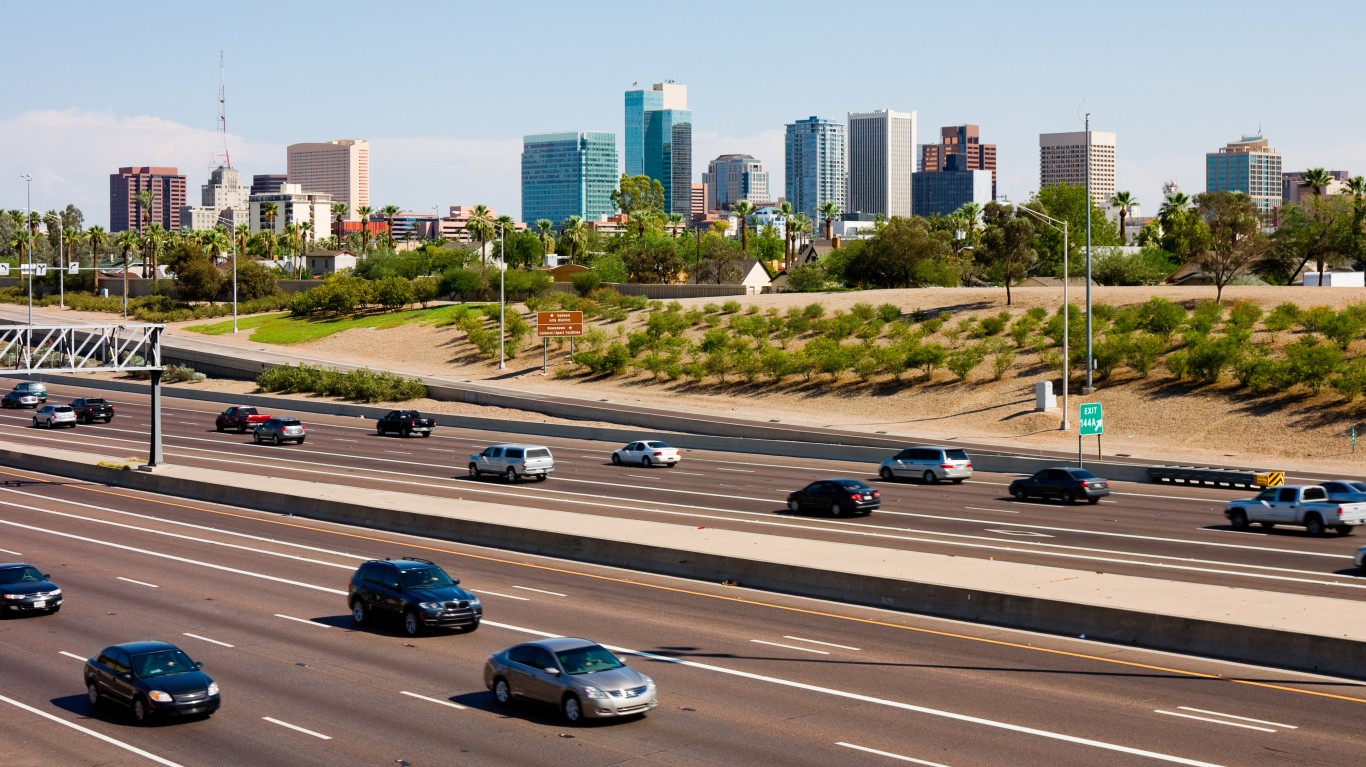
14. Phoenix-Mesa-Chandler, AZ
> GDP, 2021: $316.1 billion – 14th highest in the US
> Population, 2021: 4,946,145
> GDP per capita: $63,906
[in-text-ad-2]
Source: 4045 / iStock via Getty Images
13. Qingdao, Shandong
> GDP, 2021: $219.1 billion – 13th highest in China
> Population, 2021: 5,742,486
> GDP per capita: $38,160
Source: DenisTangneyJr / iStock via Getty Images
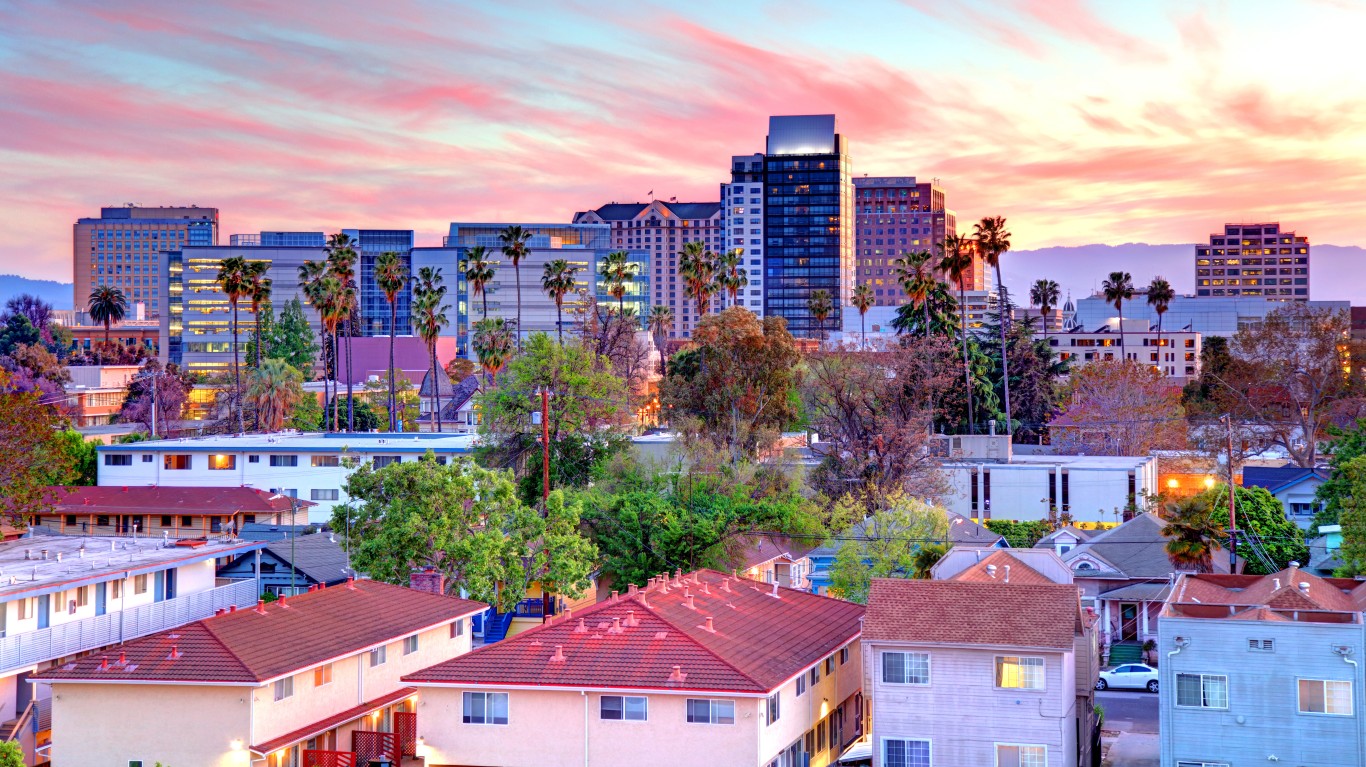
13. San Jose-Sunnyvale-Santa Clara, CA
> GDP, 2021: $410.4 billion – 13th highest in the US
> Population, 2021: 1,952,185
> GDP per capita: $210,235
[in-text-ad]
Source: onlyyouqj / iStock via Getty Images
12. Ningbo, Zhejiang
> GDP, 2021: $226.3 billion – 12th highest in China
> Population, 2021: 4,263,843
> GDP per capita: $53,063
Source: Art Wager / E+ via Getty Images
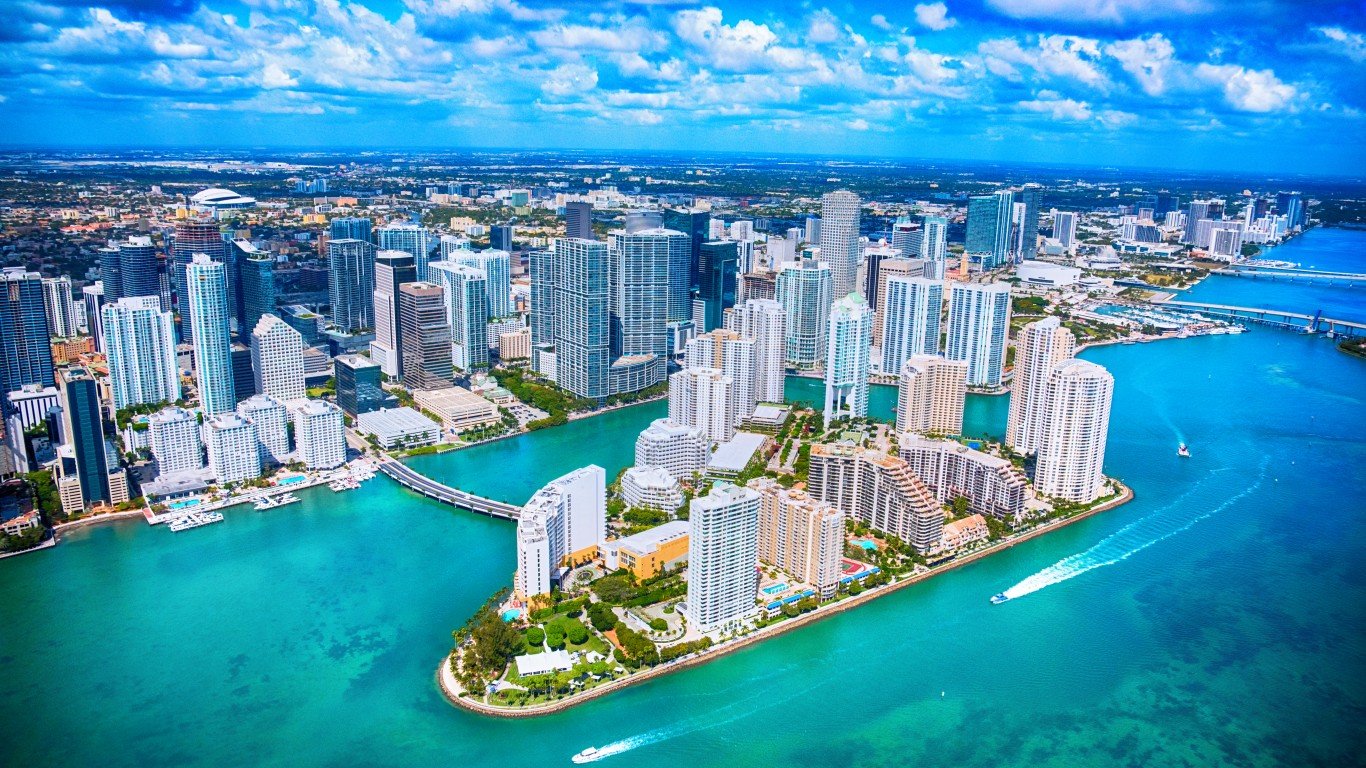
12. Miami-Fort Lauderdale-Pompano Beach, FL
> GDP, 2021: $417.1 billion – 12th highest in the US
> Population, 2021: 6,091,747
> GDP per capita: $68,478
Source: Liyao Xie / iStock via Getty Images
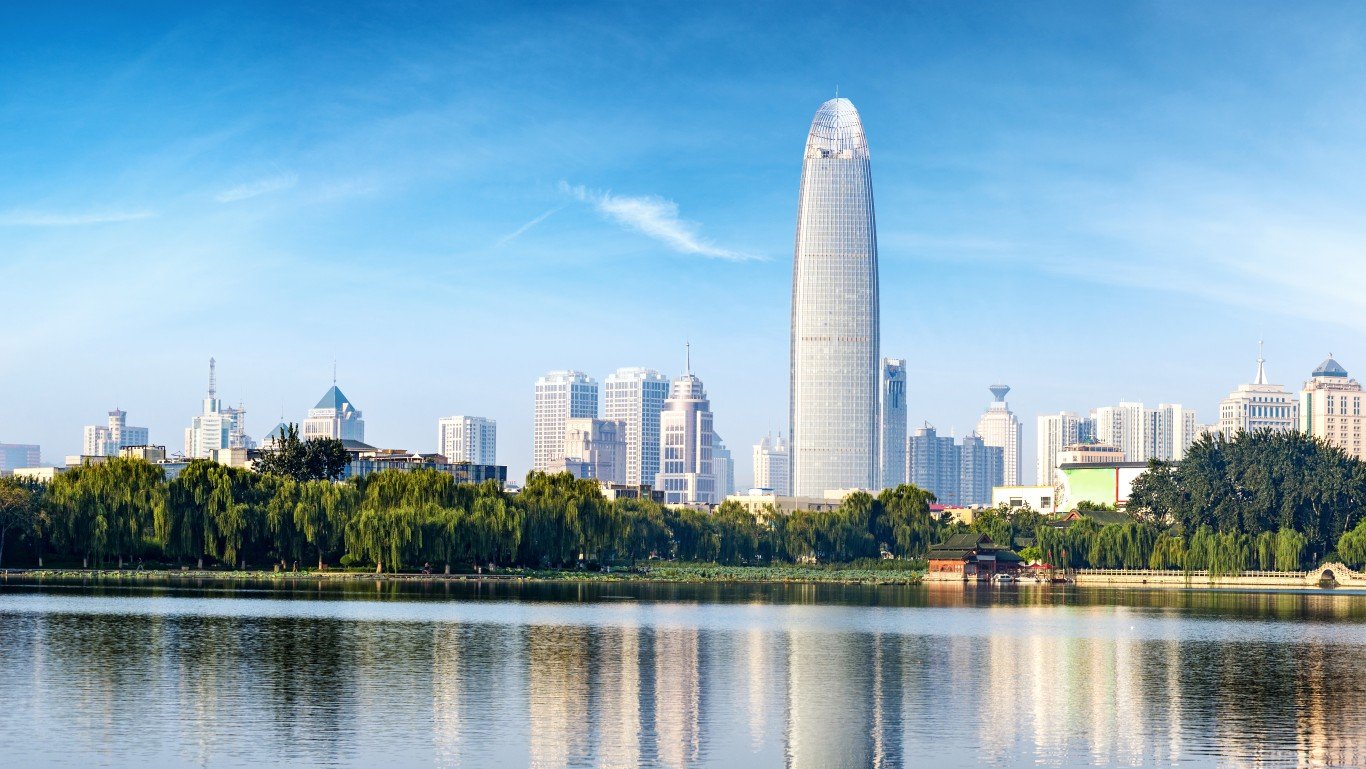
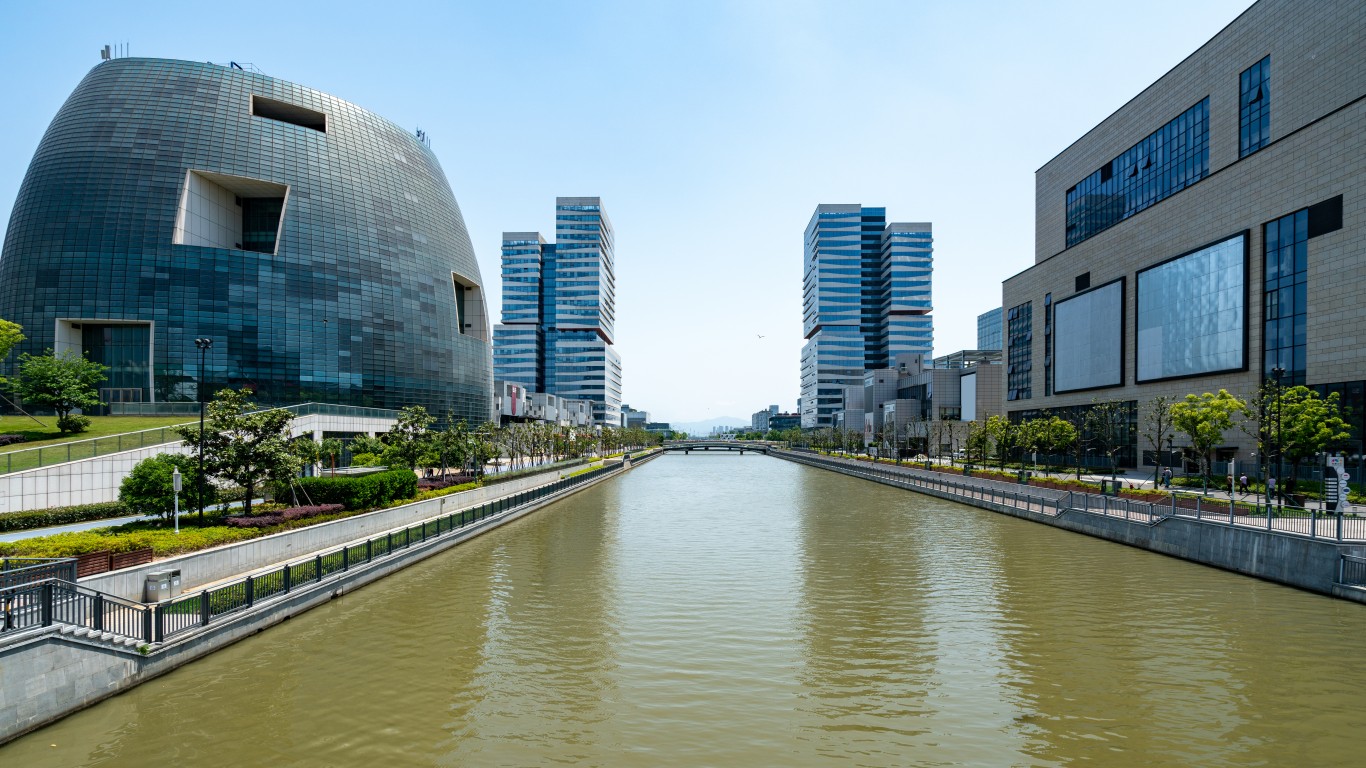
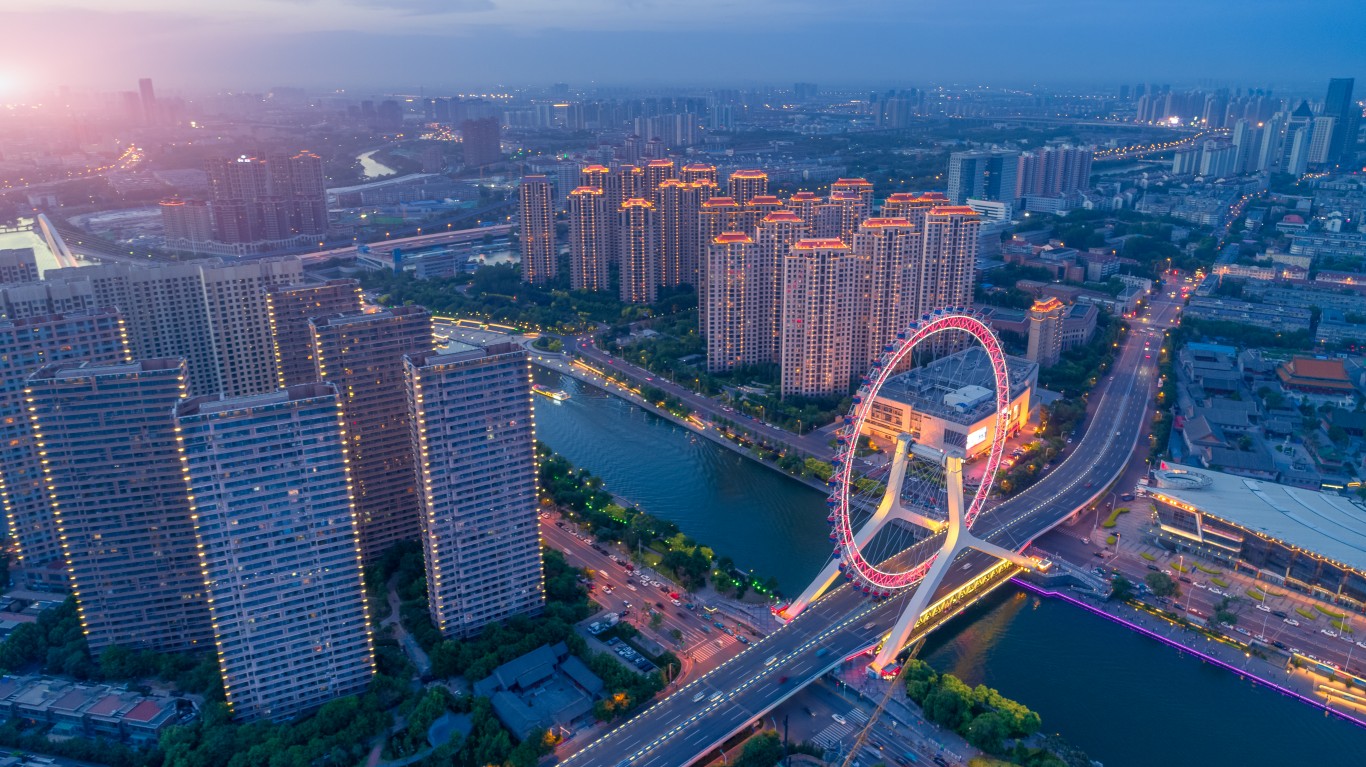
11. Tianjin, municipality
> GDP, 2021: $243.3 billion – 11th highest in China
> Population, 2021: 13,794,450
> GDP per capita: $17,638
[in-text-ad-2]
Source: Sean Pavone / iStock via Getty Images
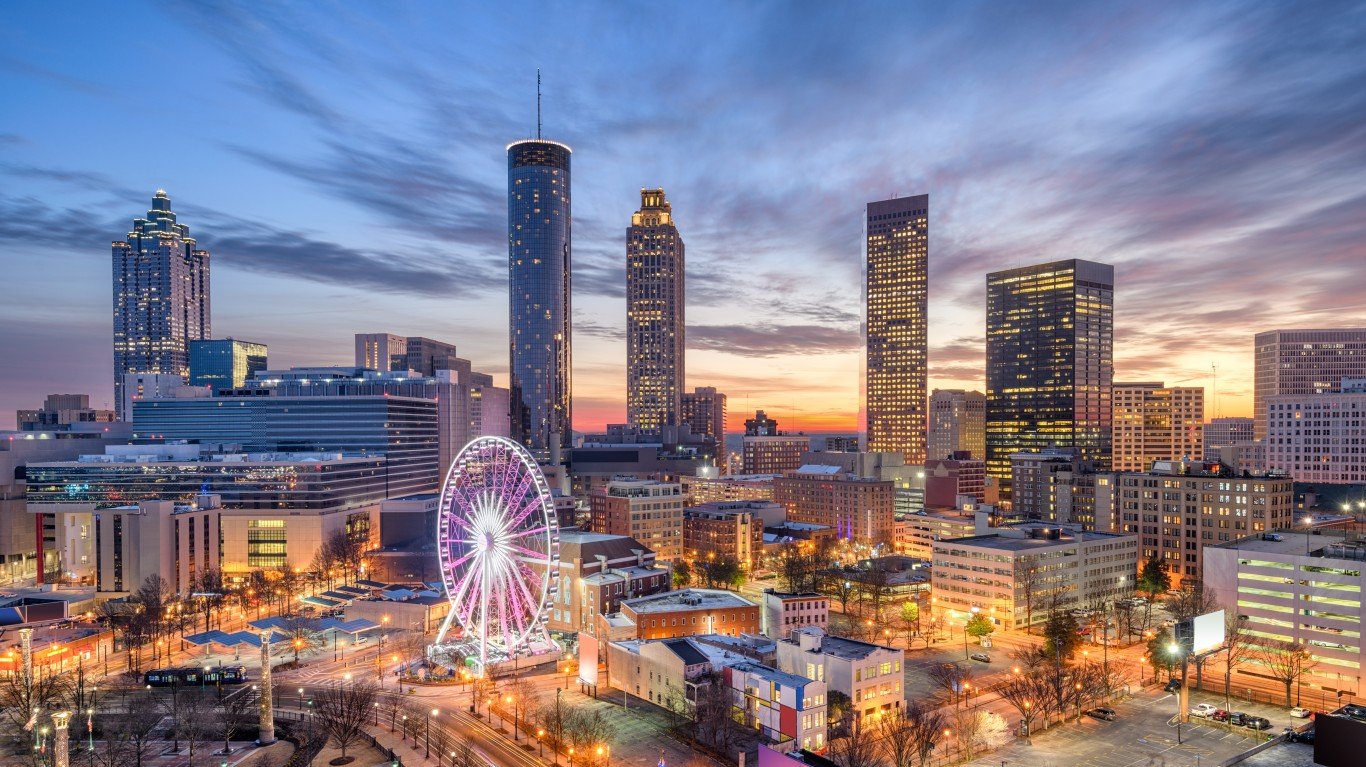
11. Atlanta-Sandy Springs-Alpharetta, GA
> GDP, 2021: $473.8 billion – 11th highest in the US
> Population, 2021: 6,144,970
> GDP per capita: $77,108

Source: xijian / E+ via Getty Images
10. Nanjing, Jiangsu
> GDP, 2021: $253.5 billion – 10th highest in China
> Population, 2021: 9,143,980
> GDP per capita: $27,729
[in-text-ad]

Source: Pgiam / E+ via Getty Images
10. Philadelphia-Camden-Wilmington, PA-NJ-DE-MD
> GDP, 2021: $477.6 billion – 10th highest in the US
> Population, 2021: 6,228,601
> GDP per capita: $76,675
Source: Julien Viry / iStock via Getty Images
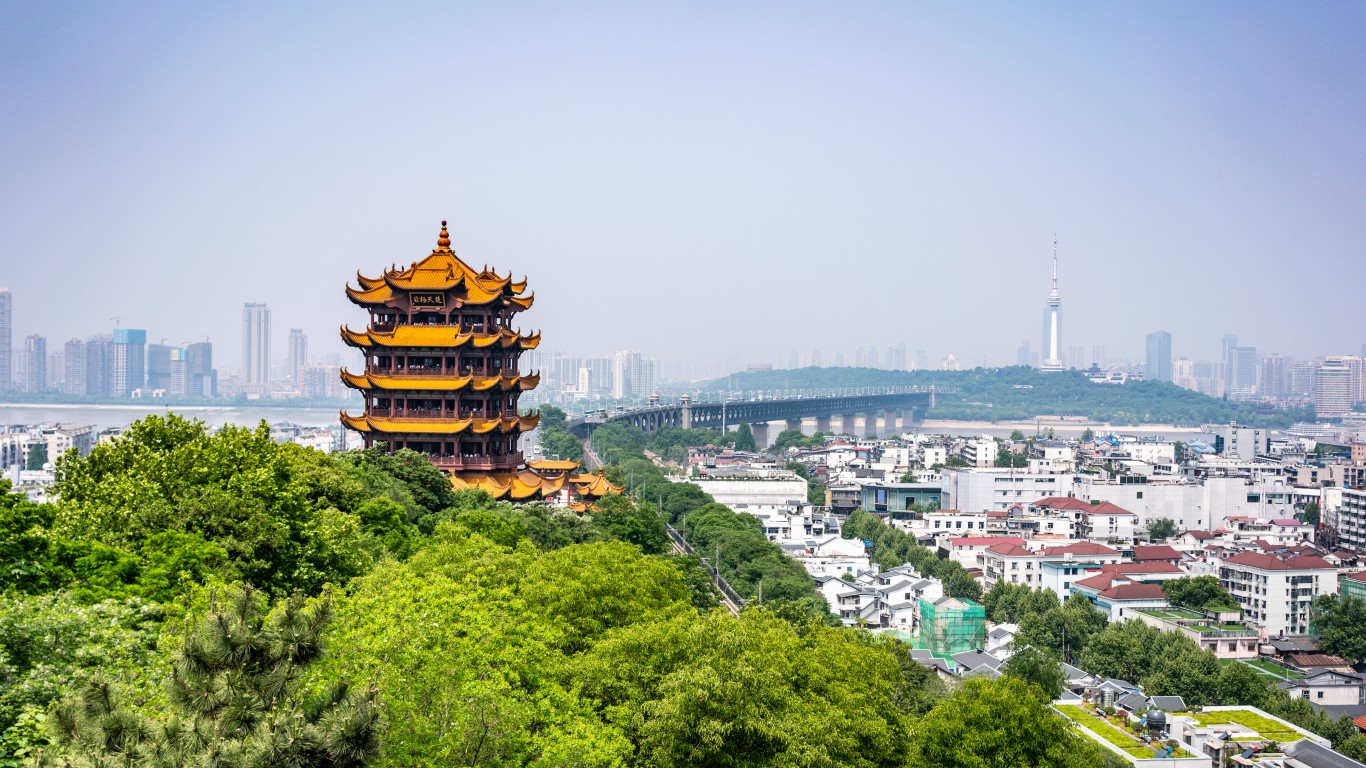
9. Wuhan, Hubei
> GDP, 2021: $274.6 billion – 9th highest in China
> Population, 2021: 8,473,405
> GDP per capita: $32,413

Source: apichart / iStock via Getty Images
9. Seattle-Tacoma-Bellevue, WA
> GDP, 2021: $480.0 billion – 9th highest in the US
> Population, 2021: 4,011,553
> GDP per capita: $119,646
[in-text-ad-2]
Source: 4045 / iStock via Getty Images
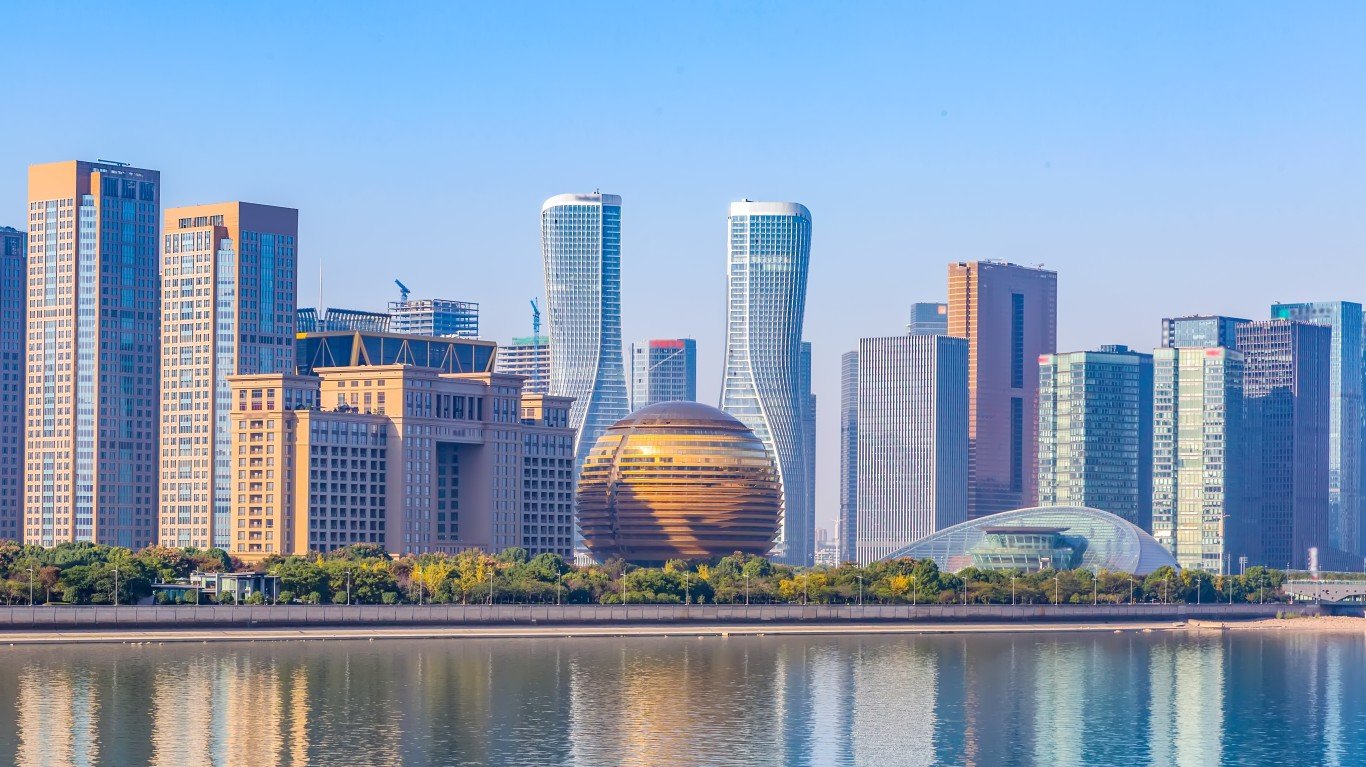
8. Hangzhou, Zhejiang
> GDP, 2021: $280.7 billion – 8th highest in China
> Population, 2021: 7,845,501
> GDP per capita: $35,782

Source: DenisTangneyJr / E+ via Getty Images
8. Boston-Cambridge-Newton, MA-NH
> GDP, 2021: $531.7 billion – 8th highest in the US
> Population, 2021: 4,899,932
> GDP per capita: $108,506
[in-text-ad]

Source: SeanPavonePhoto / Getty Images
7. Chengdu, Sichuan
> GDP, 2021: $308.8 billion – 7th highest in China
> Population, 2021: 9,305,116
> GDP per capita: $33,181
 24/7 Wall St.
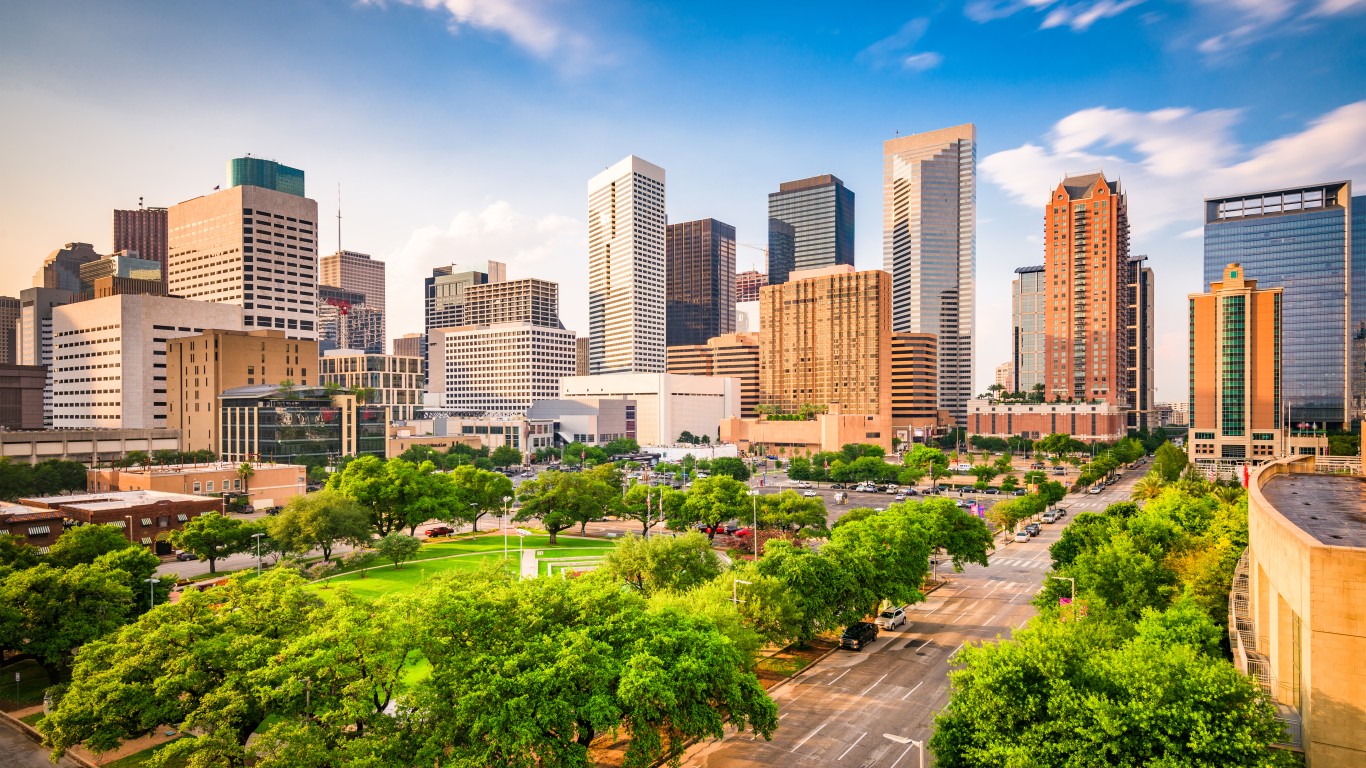
Source: Sean Pavone / iStock via Getty Images
7. Houston-The Woodlands-Sugar Land, TX
> GDP, 2021: $537.1 billion – 7th highest in the US
> Population, 2021: 7,206,841
> GDP per capita: $74,522
Source: Jian Fan / iStock via Getty Images
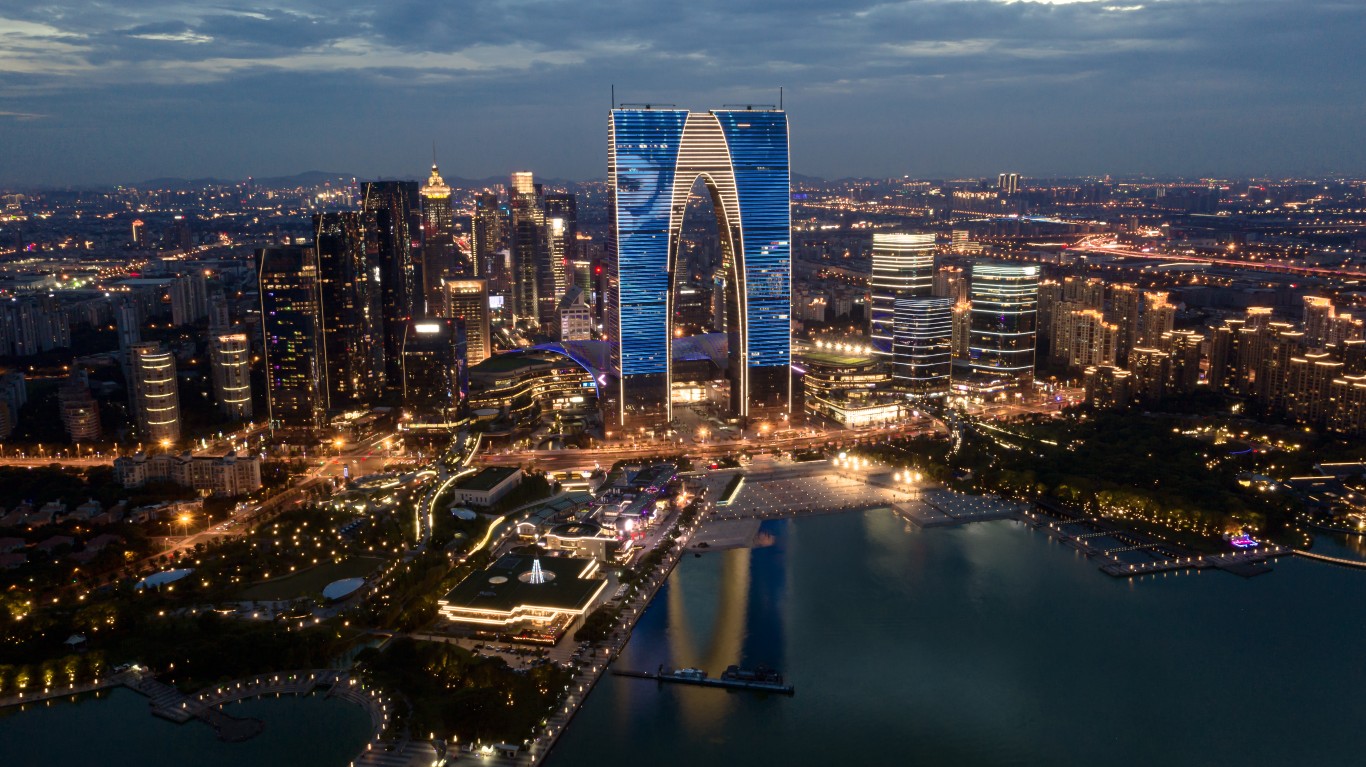
6. Suzhou, Jiangsu
> GDP, 2021: $352.2 billion – 6th highest in China
> Population, 2021: 7,427,096
> GDP per capita: $47,422
[in-text-ad-2]
Source: f11photo / iStock via Getty Images
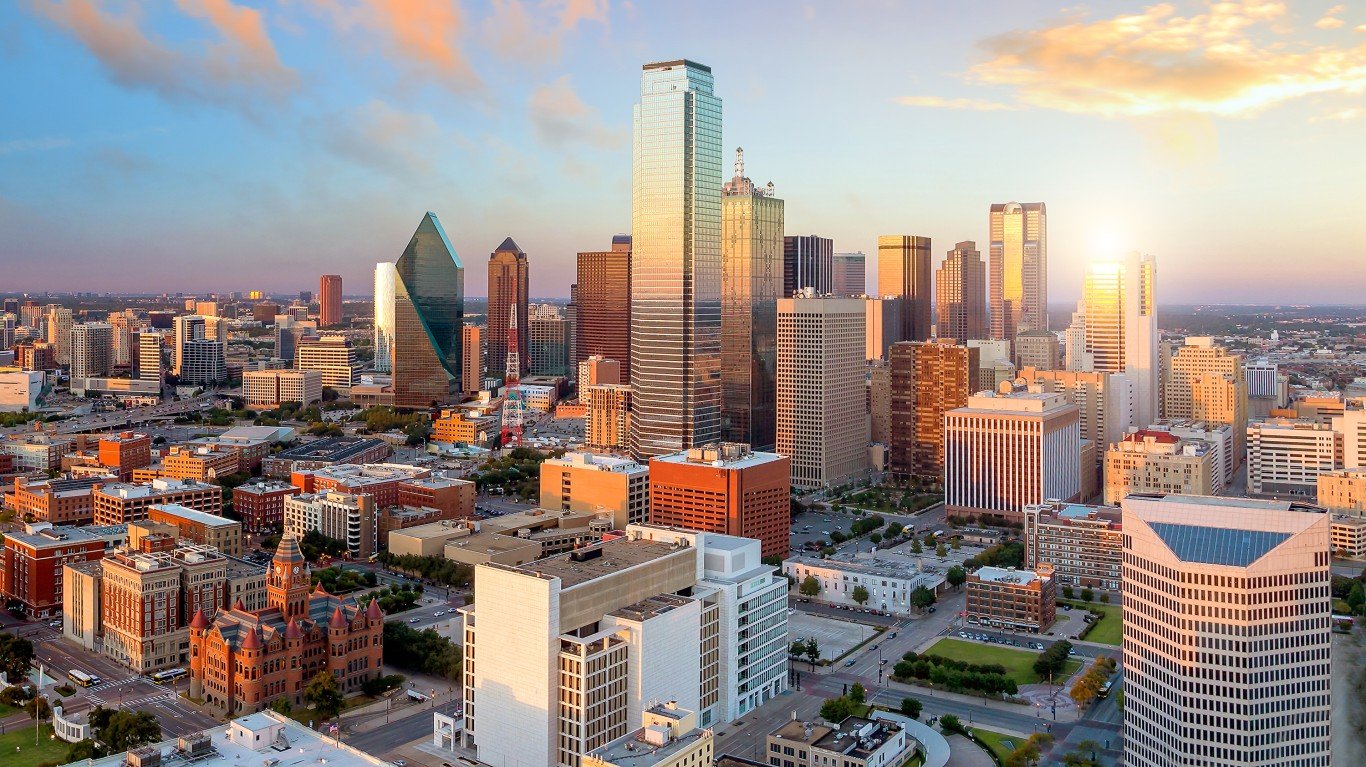
6. Dallas-Fort Worth-Arlington, TX
> GDP, 2021: $598.3 billion – 6th highest in the US
> Population, 2021: 7,759,615
> GDP per capita: $77,109
Source: Wirestock / iStock via Getty Images
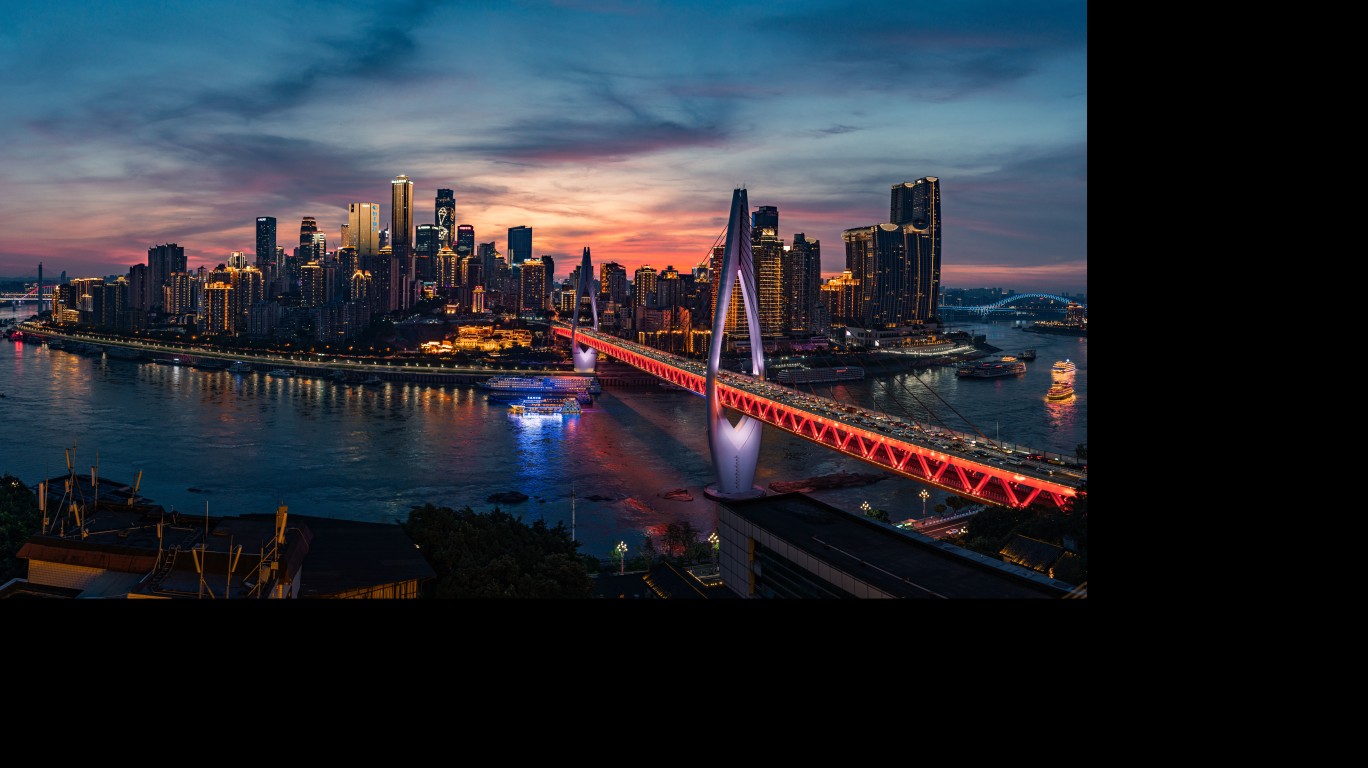
5. Chongqing, municipality
> GDP, 2021: $432.4 billion – 5th highest in China
> Population, 2021: 16,382,376
> GDP per capita: $26,395
[in-text-ad]

Source: Amy Sparwasser / iStock via Getty Images
5. Washington-Arlington-Alexandria, DC-VA-MD-WV
> GDP, 2021: $607.6 billion – 5th highest in the US
> Population, 2021: 6,358,652
> GDP per capita: $95,559
 24/7 Wall St.
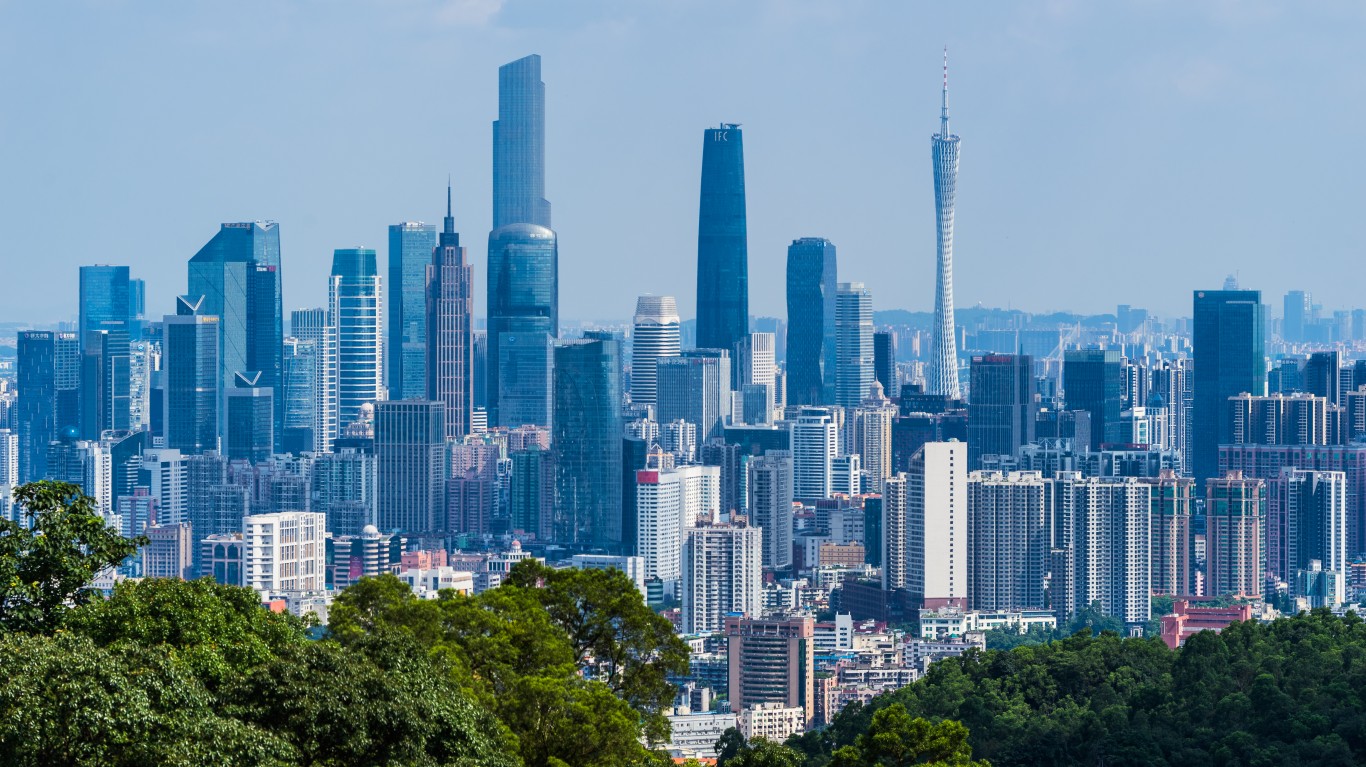
Source: yupiyan / E+ via Getty Images
4. Guangzhou, Guangdong
> GDP, 2021: $437.7 billion – 4th highest in China
> Population, 2021: 13,635,397
> GDP per capita: $32,097

Source: dell640 / iStock via Getty Images
4. San Francisco-Oakland-Berkeley, CA
> GDP, 2021: $668.7 billion – 4th highest in the US
> Population, 2021: 4,623,264
> GDP per capita: $144,633
[in-text-ad-2]
Source: Li Zhou / iStock via Getty Images
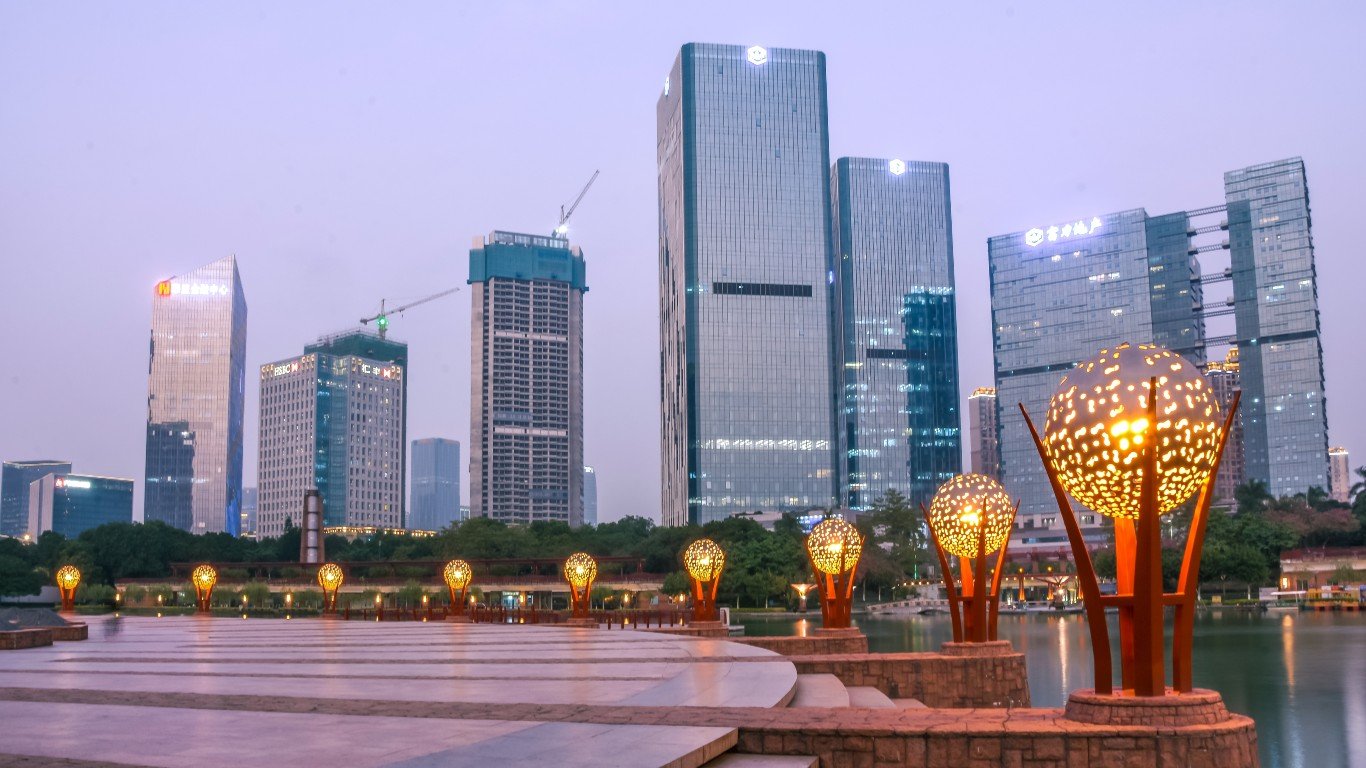
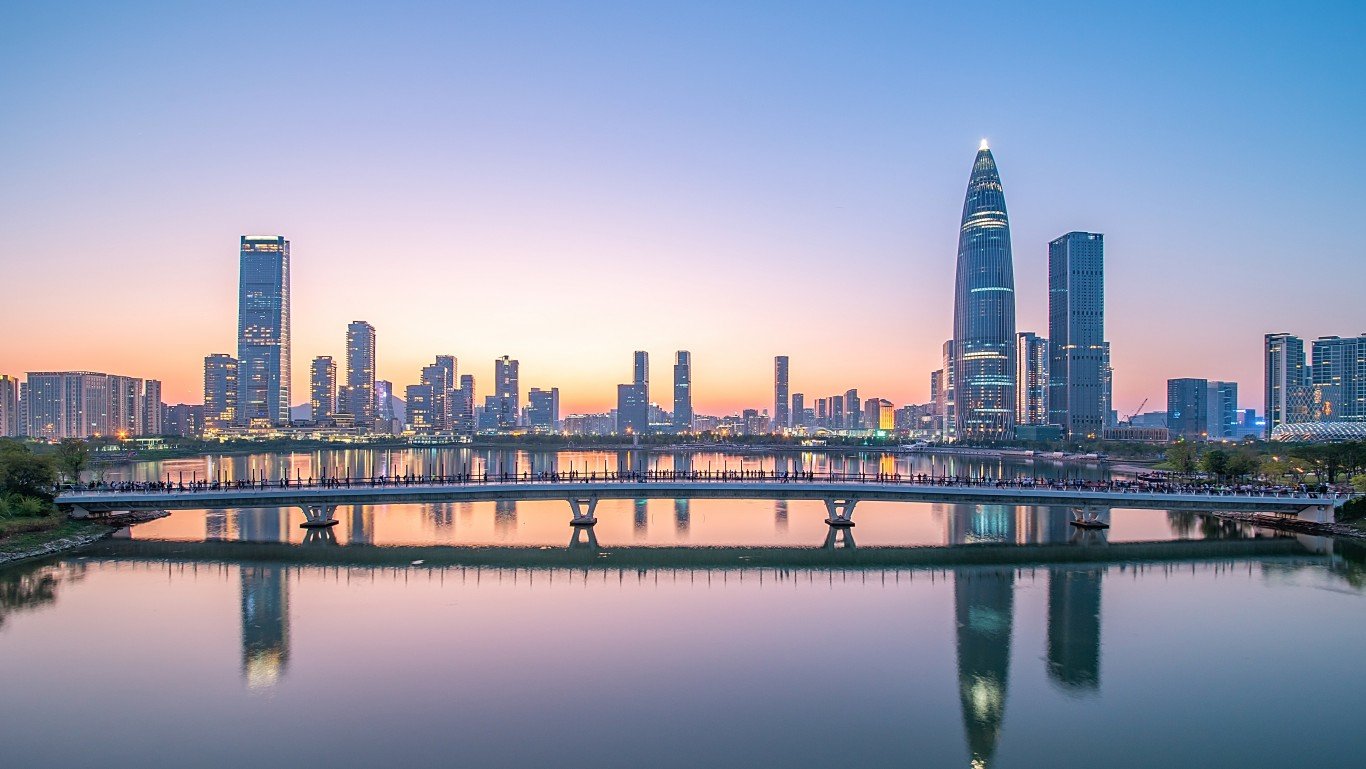
3. Shenzhen, Guangdong
> GDP, 2021: $475.4 billion – 3rd highest in China
> Population, 2021: 12,591,696
> GDP per capita: $37,752
Source: Gian Lorenzo Ferretti Photography / E+ via Getty Images
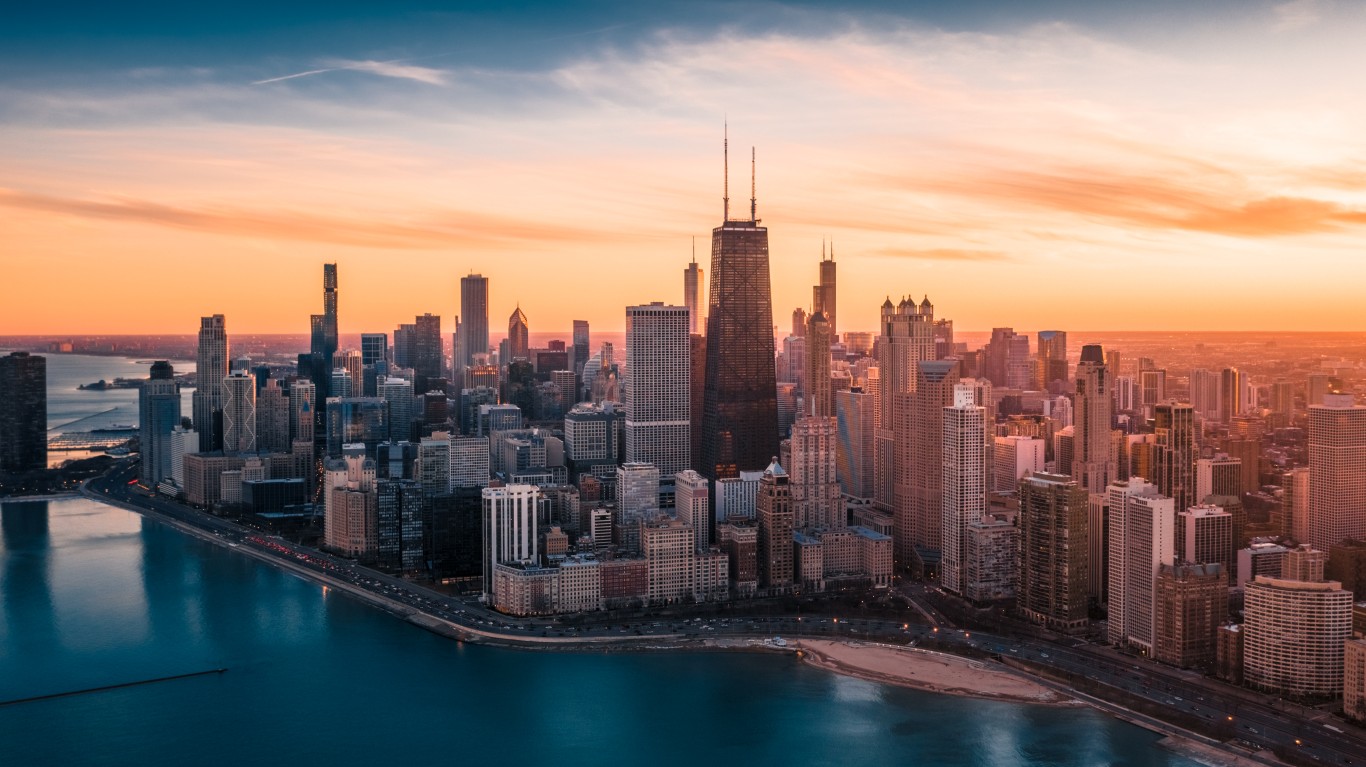
3. Chicago-Naperville-Elgin, IL-IN-WI
> GDP, 2021: $764.6 billion – 3rd highest in the US
> Population, 2021: 9,510,390
> GDP per capita: $80,395
[in-text-ad]
Source: Liyao Xie / E+ via Getty Images
2. Beijing, municipality
> GDP, 2021: $624.3 billion – 2nd highest in China
> Population, 2021: 20,896,821
> GDP per capita: $29,874
Source: Ron and Patty Thomas / E+ via Getty Images
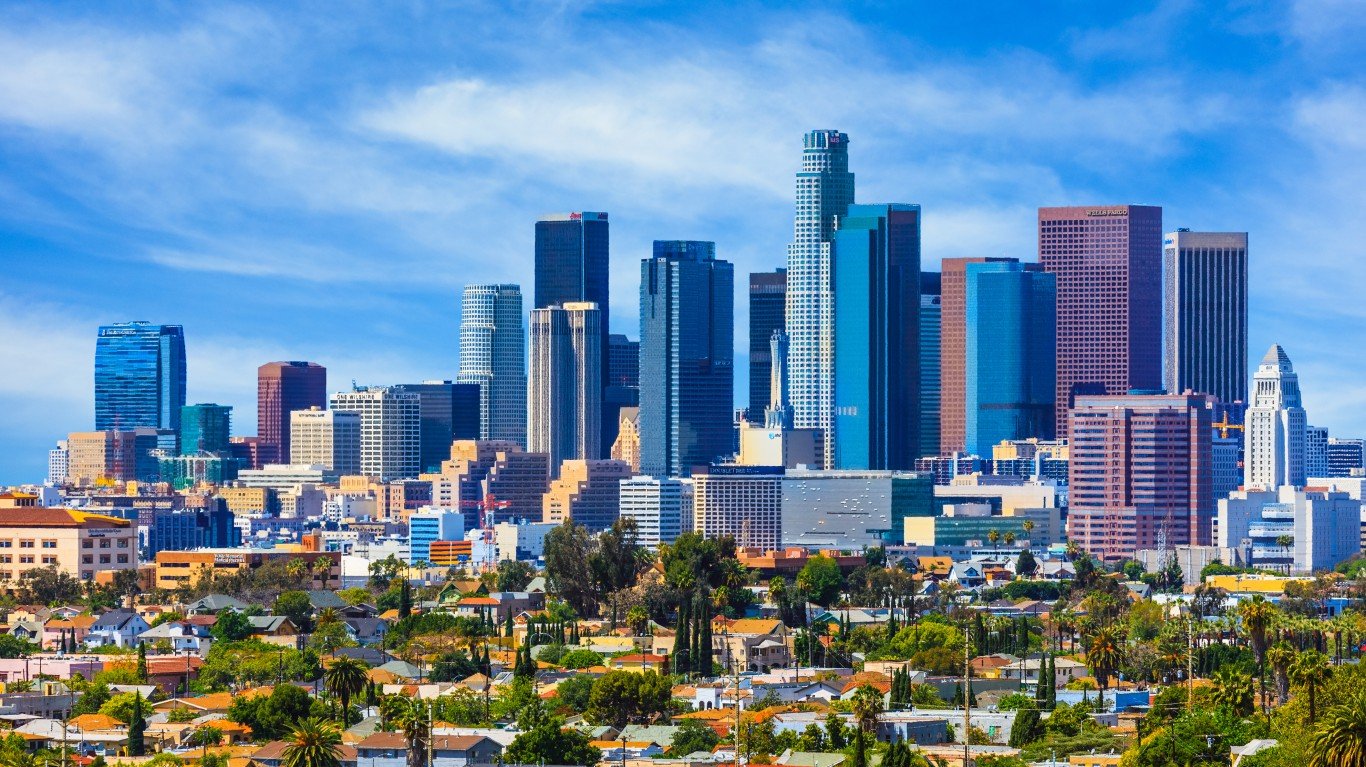
2. Los Angeles-Long Beach-Anaheim, CA
> GDP, 2021: $1,124.7 billion – 2nd highest in the US
> Population, 2021: 12,997,353
> GDP per capita: $86,532
Source: zhaojiankang / iStock via Getty Images
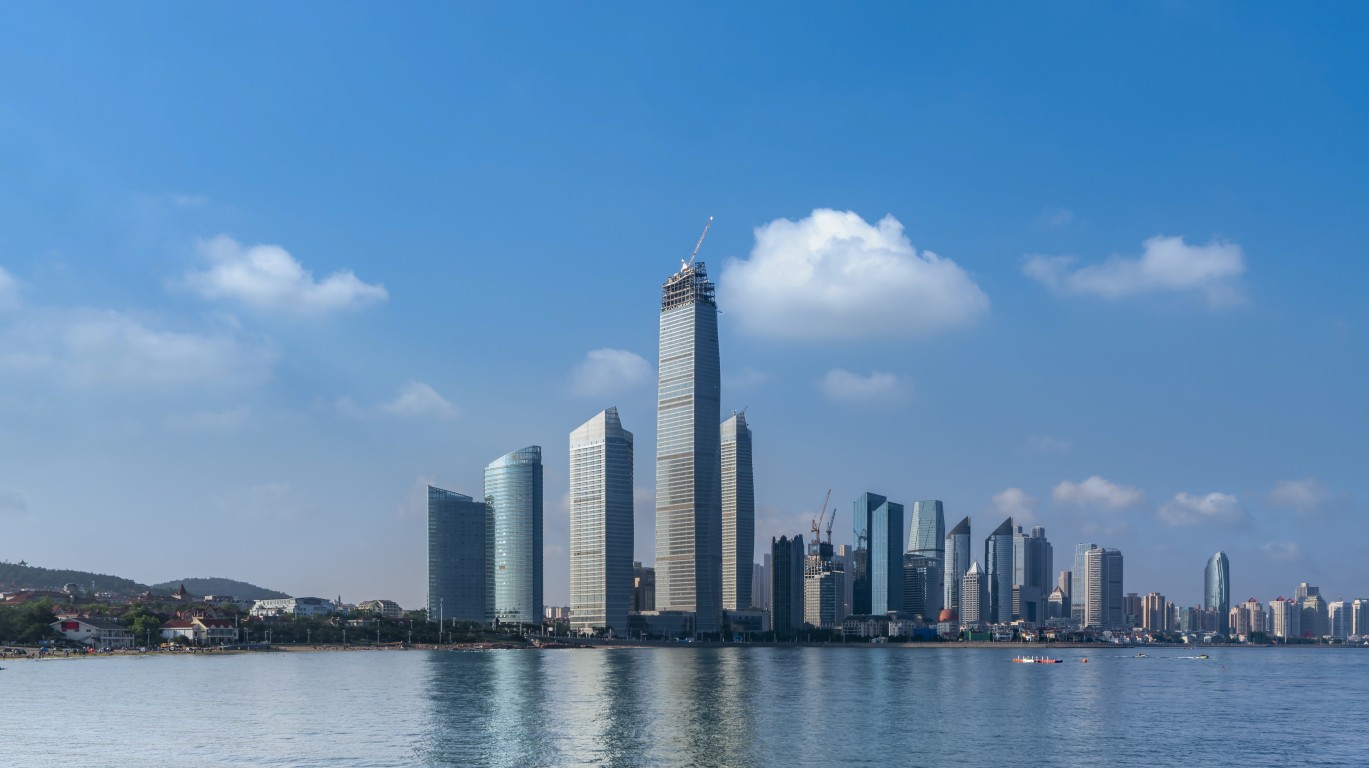
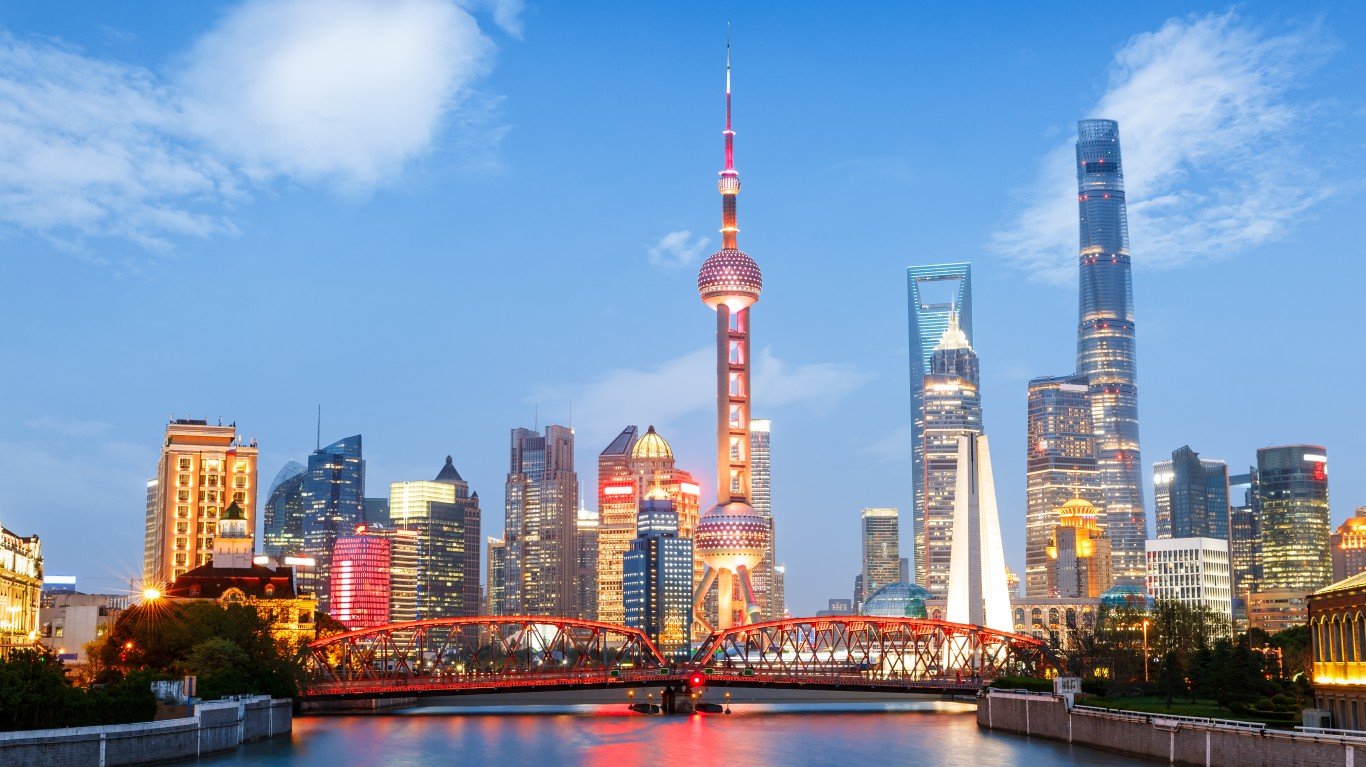
1. Shanghai, municipality
> GDP, 2021: $669.9 billion – highest in China
> Population, 2021: 27,795,702
> GDP per capita: $24,101
[in-text-ad-2]
Source: Eloi_Omella / iStock via Getty Images
1. New York-Newark-Jersey City, NY-NJ-PA
> GDP, 2021: $1,992.8 billion – highest in the US
> Population, 2021: 19,768,458
> GDP per capita: $100,806
Methodology
To compare the 20 richest cities in China and the U.S., 24/7 Wall St. used a translated source, Sina Finance, from Wikipedia to find the gross domestic product of Chinese cities and data from the U.S. Bureau of Economic Analysis to find the GDP of U.S. metropolitan areas. We were able to confirm most of the cities using a Statista list of GDP of provincial capital cities and municipalities in China in 2021, sourced from China Statistical Yearbook 2022, chapter 25.2.
We converted the GDP of Chinese cities from yuan using the average exchange rate for 2021, as calculated by the Federal Reserve, of 6.4508. U.S. and Chinese cities are matched and ordered by their GDP within each country, that is, the cities with the 20th highest GDP in China and the U.S. are matched and so on.
Population data for Chinese cities are 2021 estimates from the United Nations Population Division and are for urban agglomeration. Population data for U.S. metro areas came from the U.S. Census Bureau’s 2021 American Community Survey. 24/7 Wall St. calculated GDP per capita using both figures.
Essential Tips for Investing: Sponsored
A financial advisor can help you understand the advantages and disadvantages of investment properties. Finding a qualified financial advisor doesn’t have to be hard. SmartAsset’s free tool matches you with up to three financial advisors who serve your area, and you can interview your advisor matches at no cost to decide which one is right for you. If you’re ready to find an advisor who can help you achieve your financial goals, get started now.
Investing in real estate can diversify your portfolio. But expanding your horizons may add additional costs. If you’re an investor looking to minimize expenses, consider checking out online brokerages. They often offer low investment fees, helping you maximize your profit.
Thank you for reading! Have some feedback for us?
Contact the 24/7 Wall St. editorial team.
Editors' Picks