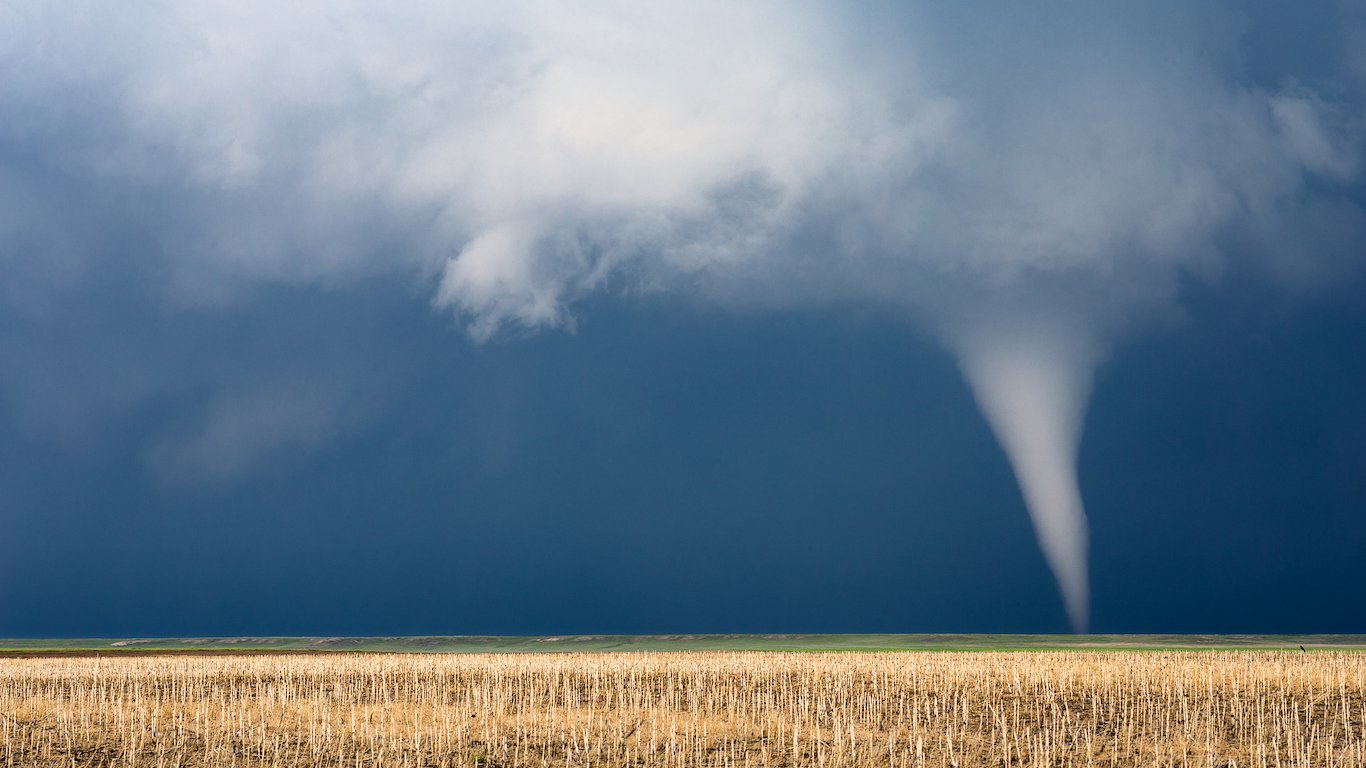
The torrid summer of 2023 is drawing to a close, and according to the European Union-funded Copernicus Climate Change Service, the planet had its hottest three months ever. It was the hottest August on record (global mean surface air temperature), and the second-hottest month ever after July 2023. (Here are the hottest inhabited places on Earth.)
To identify the hottest summers on Earth over the last 50 years, 24/7 Wall st. reviewed data on the average temperature in August for each year between 1940 and Aug. 31, 2023 from the Copernicus Climate Change Service. The anomaly — the degree by which each average temperature in August differs from historically normal temperatures between 1991 and 2020 — also came from the Copernicus Climate Change Service.
The June-to-August season for 2023 was the warmest on record worldwide, with an average temperature of 16.77°C (62.1 Fahrenheit), 0.66°C above average. The hottest 10 summers have all occurred over the past 10 years.
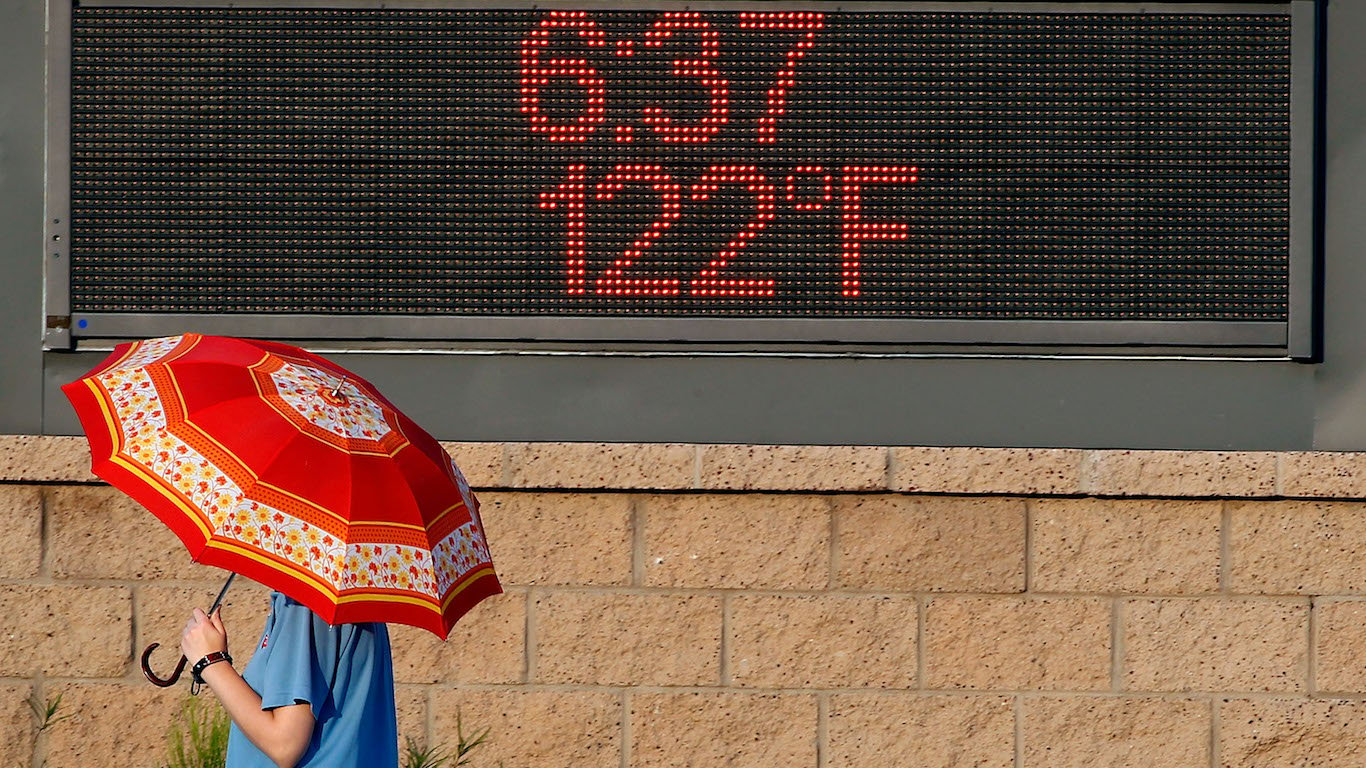
The Copernicus group said August is estimated to have been around 1.5°C warmer than the pre-industrial average for 1850-1900. The 1.5°C mark is considered a critical threshold and once crossed, the effects of climate change are expected to become more severe. August recorded the highest global monthly average sea-surface temperatures of 20.98°C, or 69.7 Fahrenheit. The period from January to August 2023 is the second warmest on record after 2016, when a warming El Niño event occurred.
“What we are observing, not only new extremes but the persistence of these record-breaking conditions, and the impacts these have on both people and planet, are a clear consequence of the warming of the climate system,” said Carlo Buontempo, director of the Copernicus Climate Change Service, European Centre for Medium-Range Weather Forecasts, in a statement. (These are the 25 worst cities to live as global warming gets worse.)
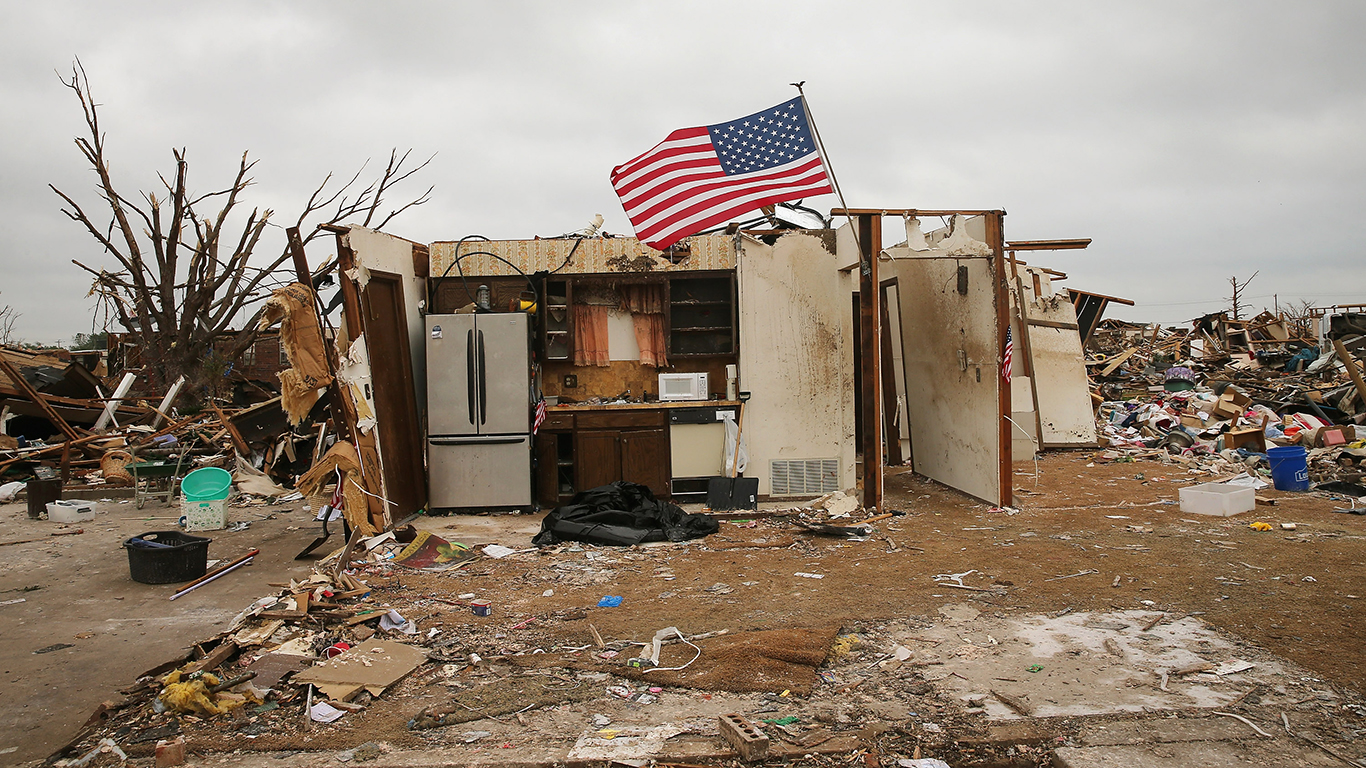
In the United States, more than 6,500 daily heat records have so far broken during the scorching summer. As of Sept. 6, Phoenix had 52 days of highs of 110 degrees or above. Cities such as Houston; Chicago; Lincoln, Nebraska; Wichita, Kansas; New Orleans; Denver; and Portland, Oregon, to name a few, all reported daily heat records.
Click here to see the hottest boreal summers over the last 50 years.
Source: Pictorial Parade / Getty Images
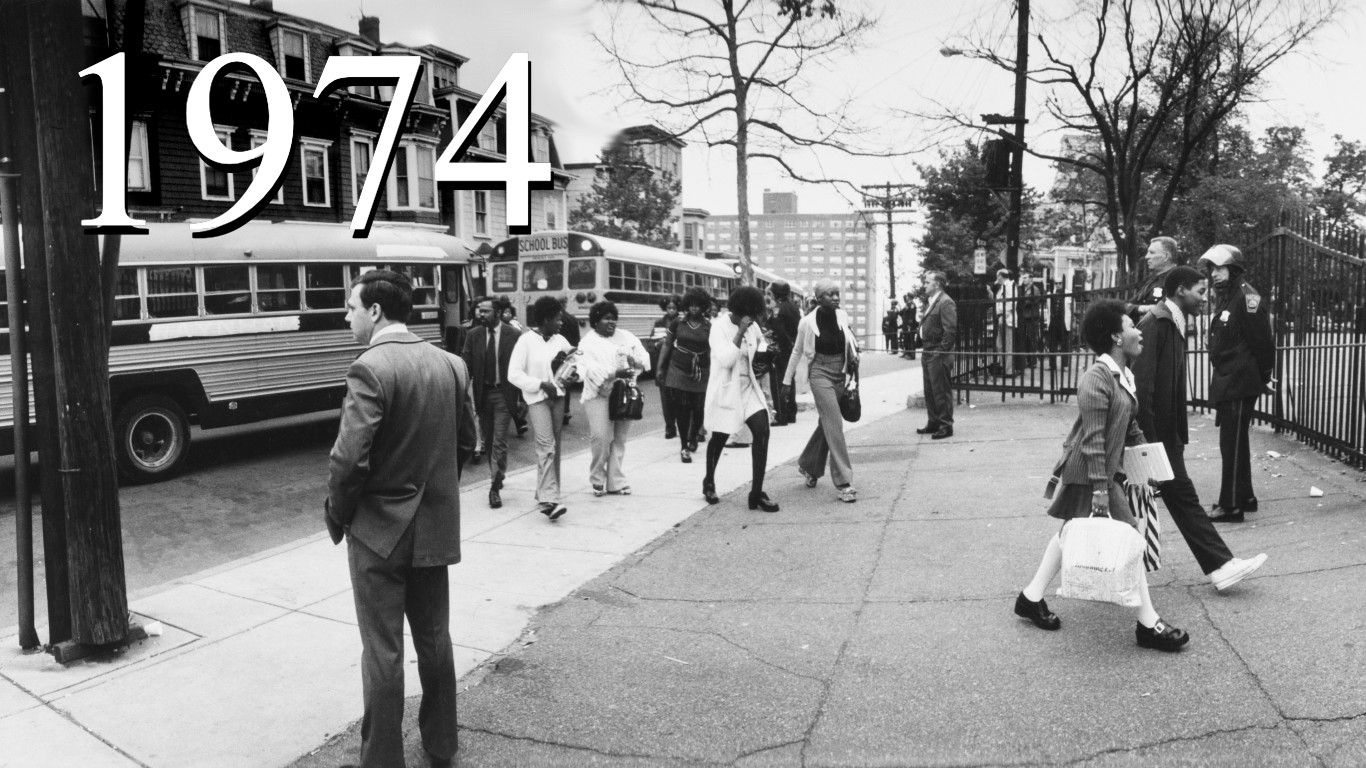
1974
> Avg temp in August: 59.8°F – #75 highest on 1940-2023 record
> Size of anomaly: -1.2°F from 1991-2020 normal – #29 coldest difference
[in-text-ad]
Source: Archive Photos / Getty Images
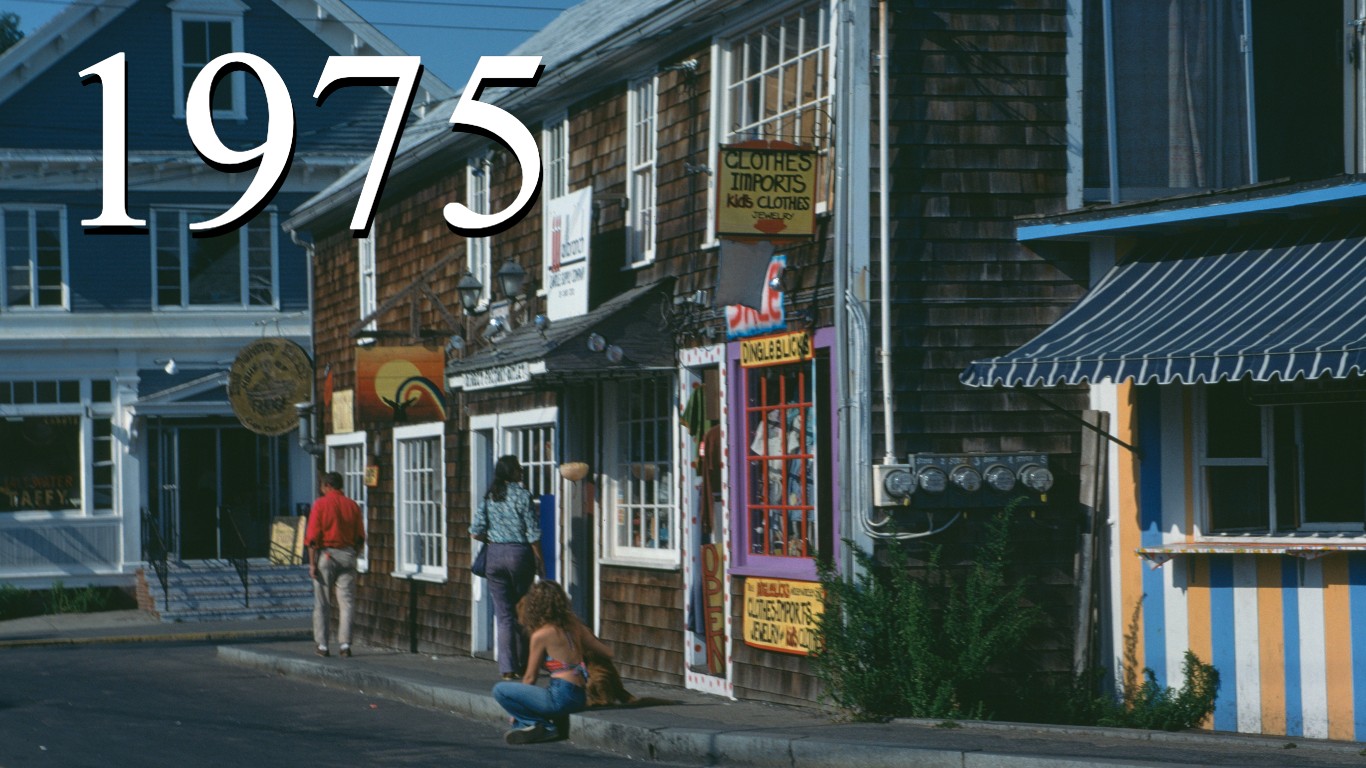
1975
> Avg temp in August: 59.6°F – #81 highest on 1940-2023 record
> Size of anomaly: -1.4°F from 1991-2020 normal – #31 coldest difference
 24/7 Wall St.
Source: Keystone / Getty Images
1976
> Avg temp in August: 59.7°F – #78 highest on 1940-2023 record
> Size of anomaly: -1.3°F from 1991-2020 normal – #30 coldest difference
Source: Michael Ochs Archives / Getty Images
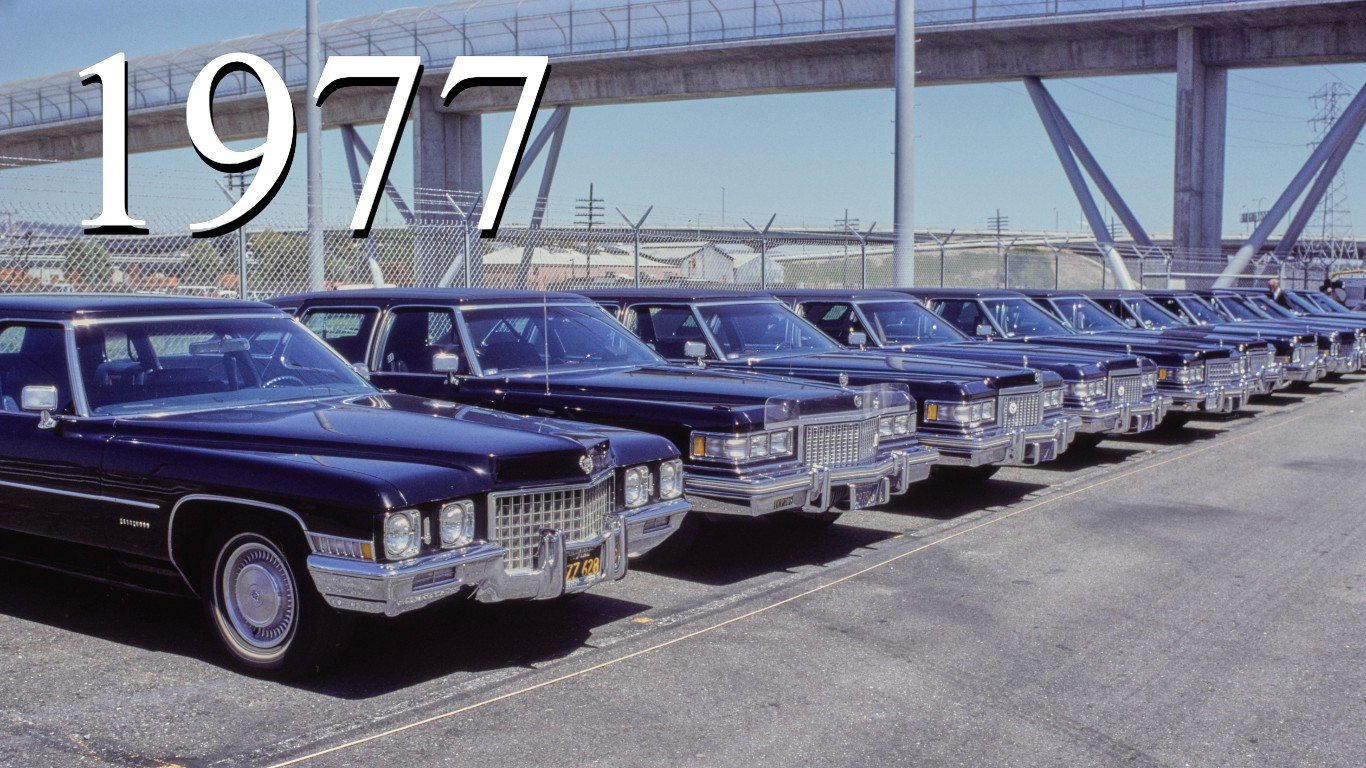
1977
> Avg temp in August: 60.2°F – #41 highest on 1940-2023 record
> Size of anomaly: -0.8°F from 1991-2020 normal – #22 coldest difference
[in-text-ad-2]

Source: Space Frontiers / Getty Images
1978
> Avg temp in August: 59.9°F – #69 highest on 1940-2023 record
> Size of anomaly: -1.1°F from 1991-2020 normal – #28 coldest difference

Source: Tony Duffy / Getty Images
1979
> Avg temp in August: 60.2°F – #45 highest on 1940-2023 record
> Size of anomaly: -0.8°F from 1991-2020 normal – #25 coldest difference
[in-text-ad]
Source: FPG / Getty Images
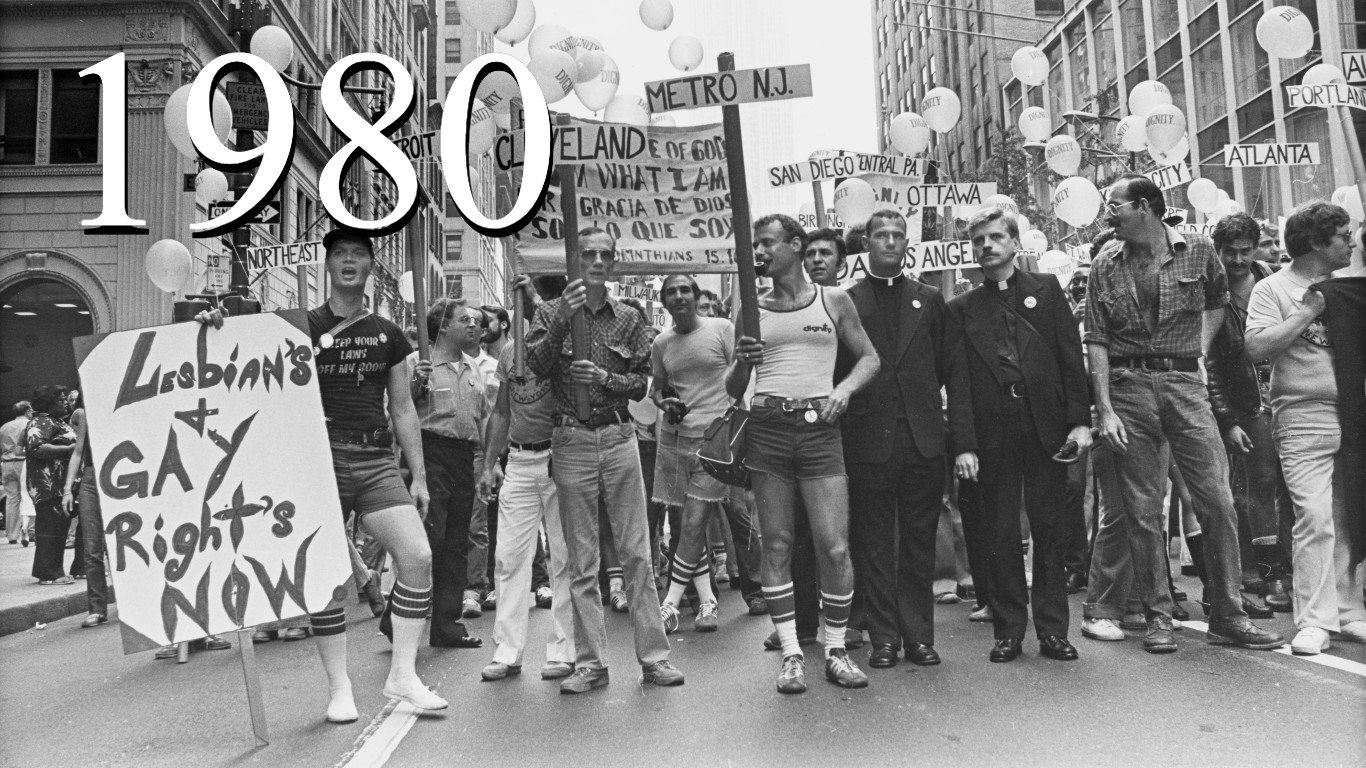
1980
> Avg temp in August: 60.5°F – #35 highest on 1940-2023 record
> Size of anomaly: -0.5°F from 1991-2020 normal – #16 coldest difference
 24/7 Wall St.
Source: Gene Forte / Getty Images
1981
> Avg temp in August: 60.6°F – #34 highest on 1940-2023 record
> Size of anomaly: -0.4°F from 1991-2020 normal – #15 coldest difference
Source: Hulton Archive / Getty Images
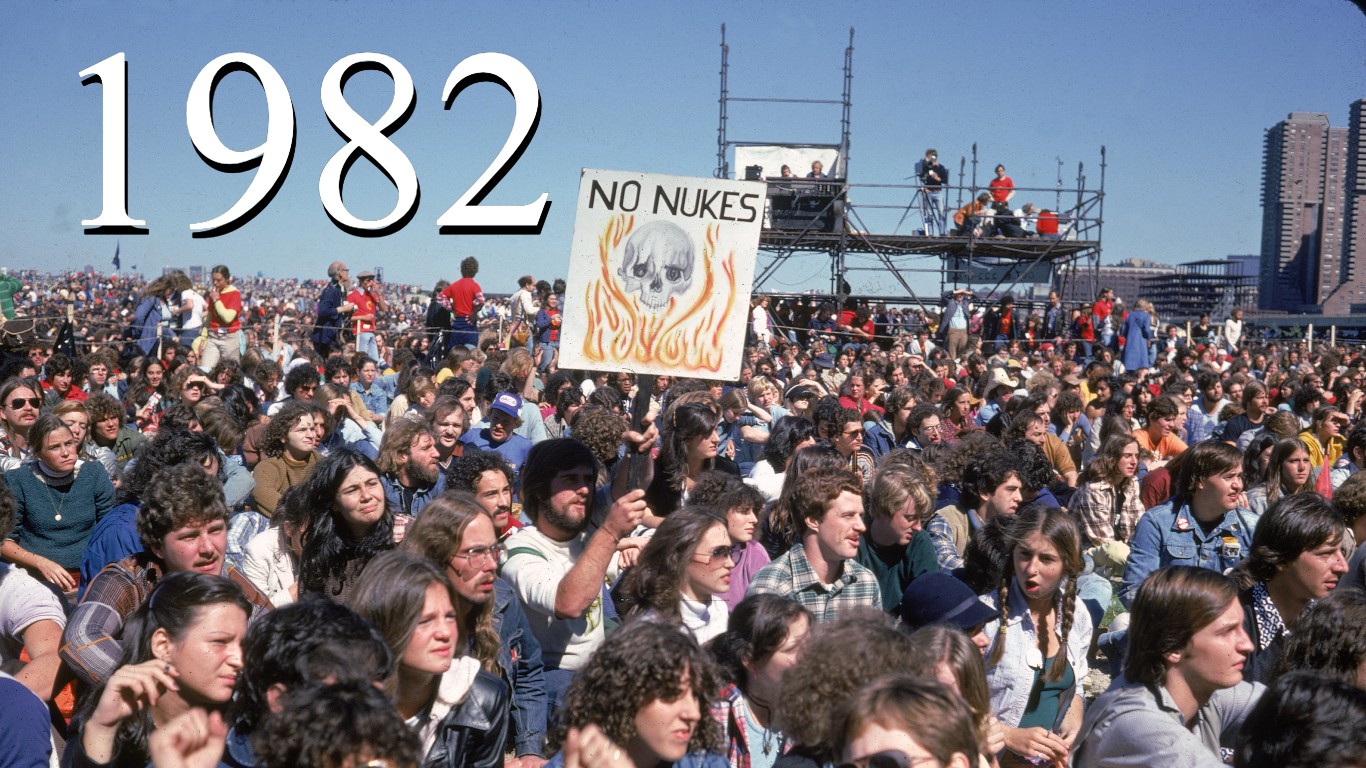
1982
> Avg temp in August: 60.3°F – #40 highest on 1940-2023 record
> Size of anomaly: -0.7°F from 1991-2020 normal – #21 coldest difference
[in-text-ad-2]
Source: Tony Duffy / Getty Images
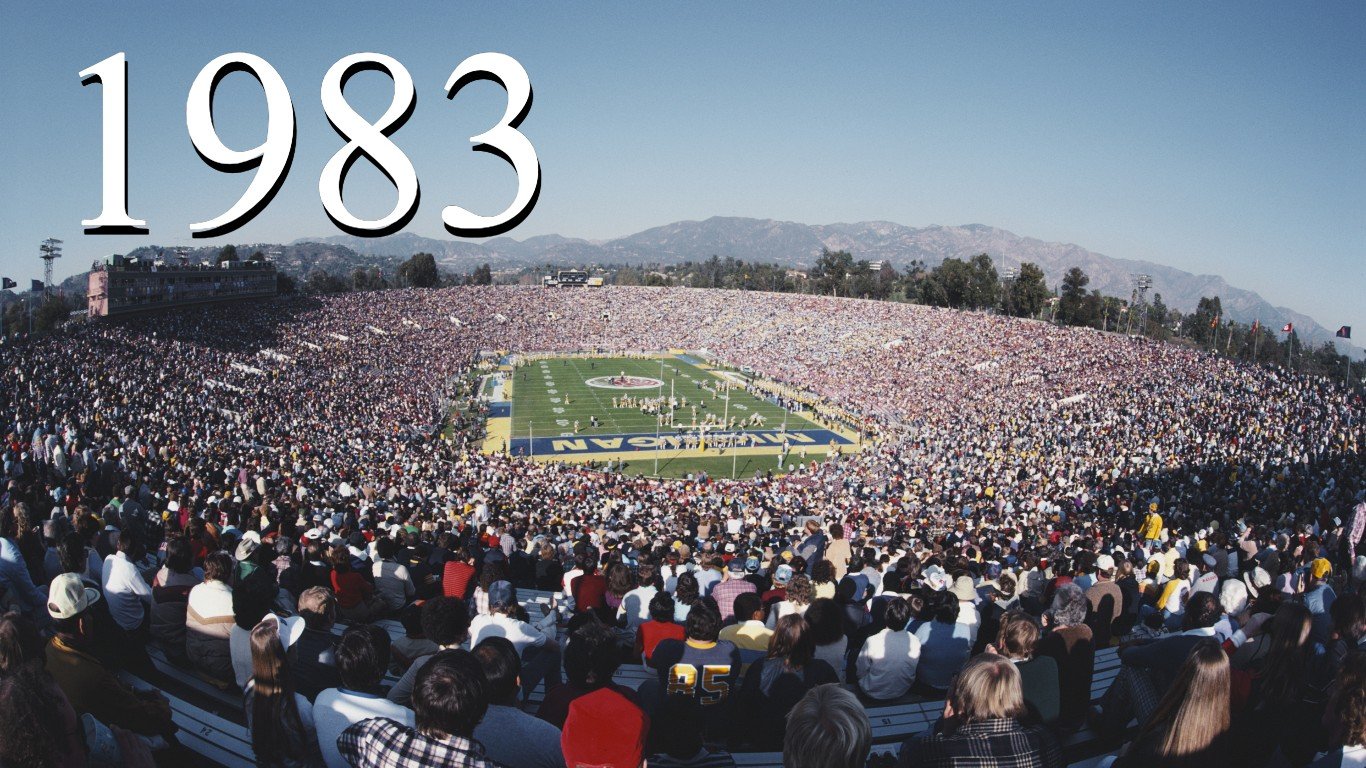
1983
> Avg temp in August: 60.5°F – #36 highest on 1940-2023 record
> Size of anomaly: -0.5°F from 1991-2020 normal – #17 coldest difference

Source: Michael Ochs Archives / Getty Images
1984
> Avg temp in August: 60.1°F – #48 highest on 1940-2023 record
> Size of anomaly: -0.9°F from 1991-2020 normal – #27 coldest difference
[in-text-ad]
Source: Space Frontiers / Getty Images
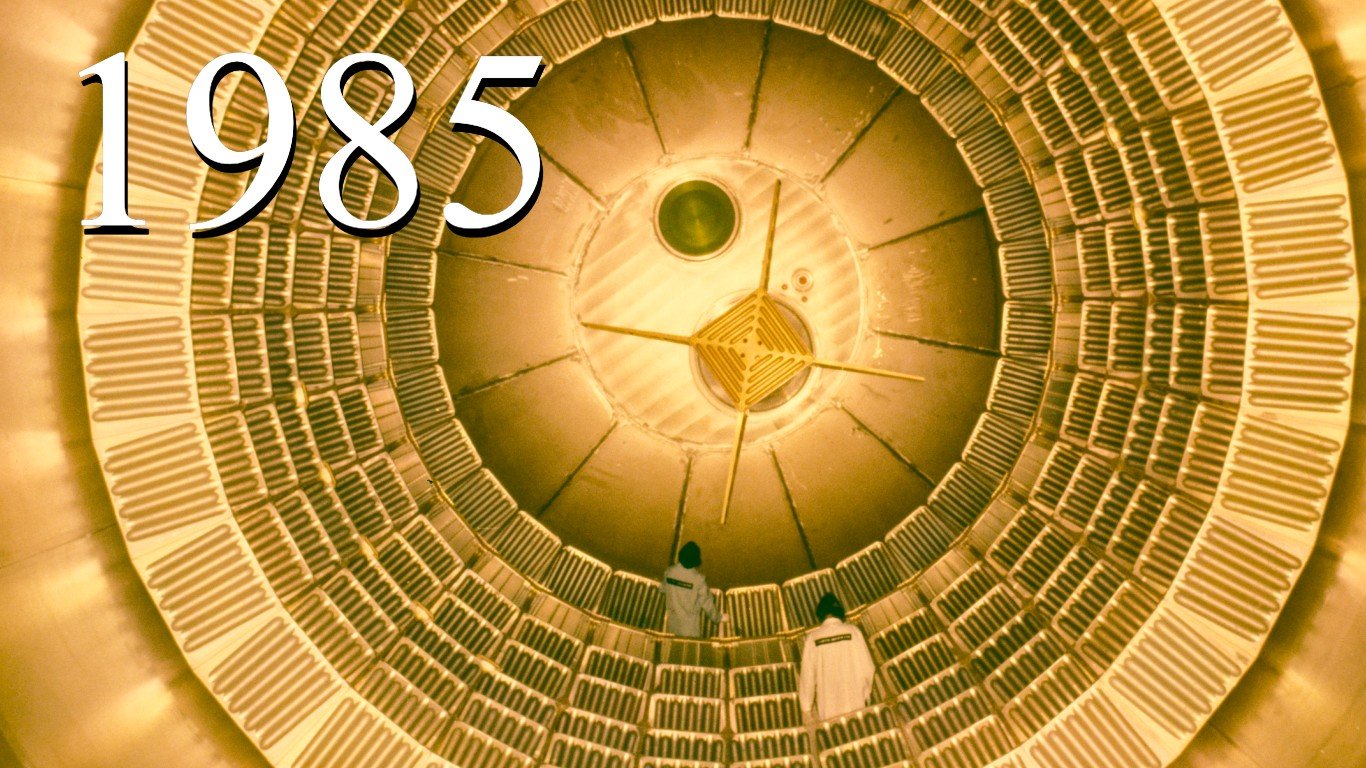
1985
> Avg temp in August: 60.2°F – #47 highest on 1940-2023 record
> Size of anomaly: -0.8°F from 1991-2020 normal – #26 coldest difference
Source: Getty Images / Staff
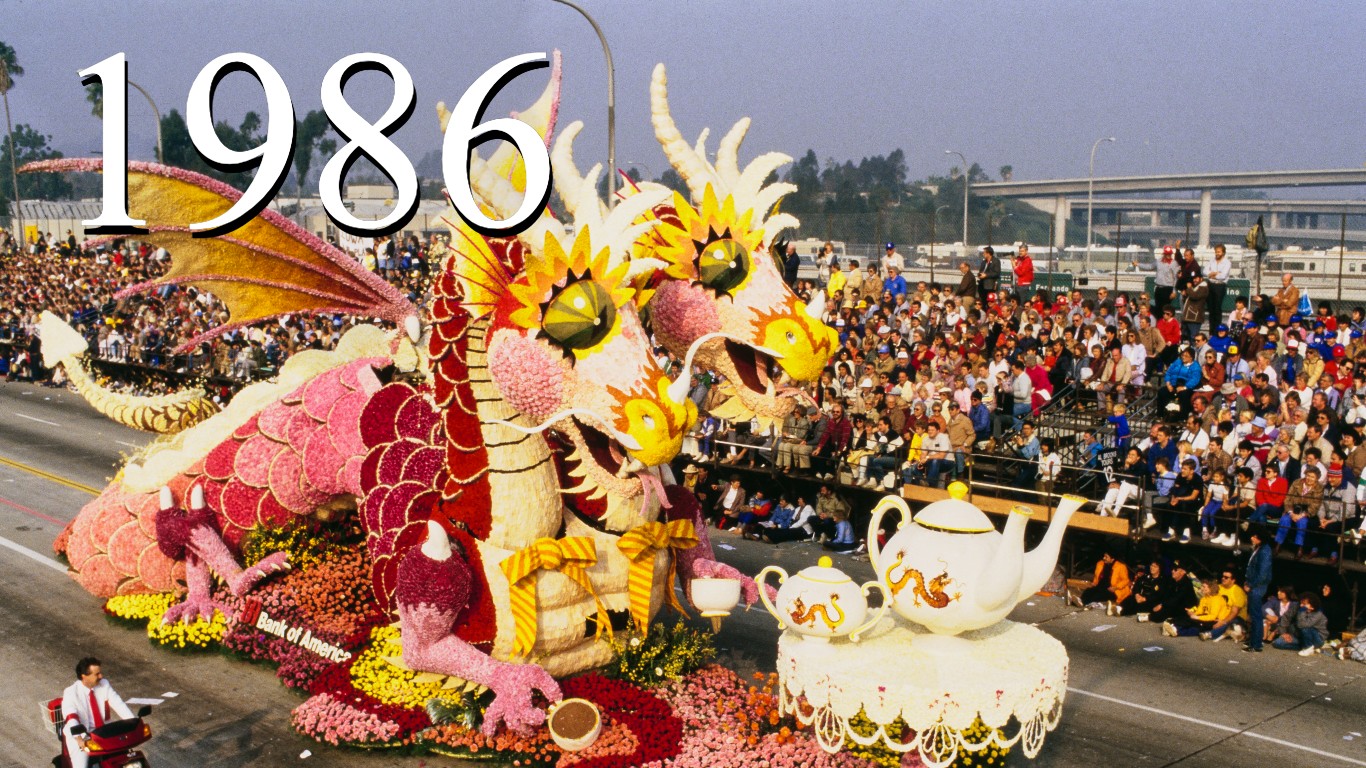
1986
> Avg temp in August: 60.2°F – #45 highest on 1940-2023 record
> Size of anomaly: -0.8°F from 1991-2020 normal – #24 coldest difference
Source: Rick Stewart / Getty Images
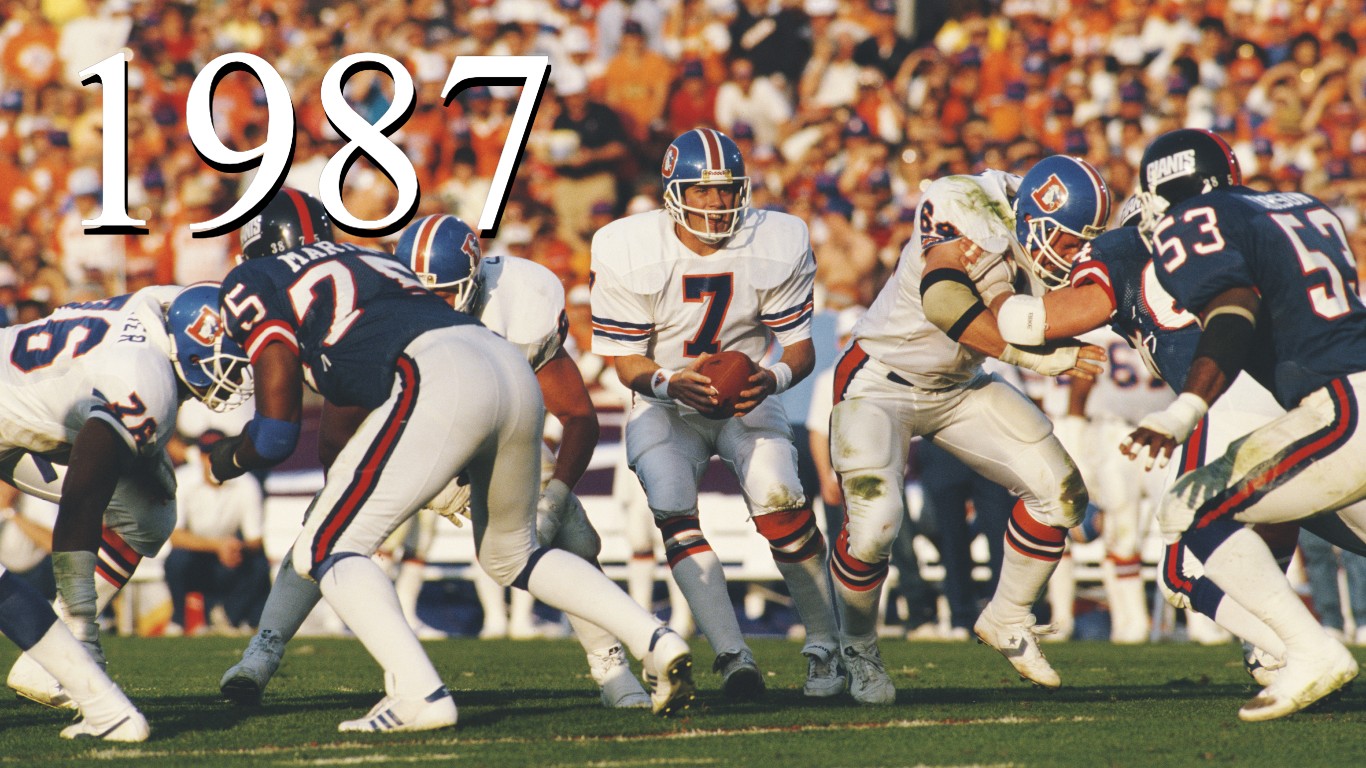
1987
> Avg temp in August: 60.7°F – #29 highest on 1940-2023 record
> Size of anomaly: -0.3°F from 1991-2020 normal – #10 coldest difference
[in-text-ad-2]

Source: Getty Images / Staff
1988
> Avg temp in August: 60.7°F – #28 highest on 1940-2023 record
> Size of anomaly: -0.3°F from 1991-2020 normal – #9 coldest difference

Source: Pascal Rondeau / Getty Images
1989
> Avg temp in August: 60.4°F – #38 highest on 1940-2023 record
> Size of anomaly: -0.6°F from 1991-2020 normal – #19 coldest difference
[in-text-ad]

Source: Space Frontiers / Getty Images
1990
> Avg temp in August: 60.7°F – #27 highest on 1940-2023 record
> Size of anomaly: -0.3°F from 1991-2020 normal – #8 coldest difference

Source: Public Domain / Wikimedia Commons
1991
> Avg temp in August: 60.9°F – #21 highest on 1940-2023 record
> Size of anomaly: -0.1°F from 1991-2020 normal – #3 coldest difference

Source: Public Domain / Wikimedia Commons
1992
> Avg temp in August: 60.2°F – #41 highest on 1940-2023 record
> Size of anomaly: -0.8°F from 1991-2020 normal – #22 coldest difference
[in-text-ad-2]

Source: Public Domain / Wikimedia Commons
1993
> Avg temp in August: 60.4°F – #39 highest on 1940-2023 record
> Size of anomaly: -0.6°F from 1991-2020 normal – #20 coldest difference

Source: Phil Cole / Getty Images
1994
> Avg temp in August: 60.4°F – #37 highest on 1940-2023 record
> Size of anomaly: -0.6°F from 1991-2020 normal – #18 coldest difference
[in-text-ad]

Source: Public Domain / Wikimedia Commons
1995
> Avg temp in August: 60.8°F – #24 highest on 1940-2023 record
> Size of anomaly: -0.2°F from 1991-2020 normal – #6 coldest difference
Source: Jeff J Mitchell / Getty Images
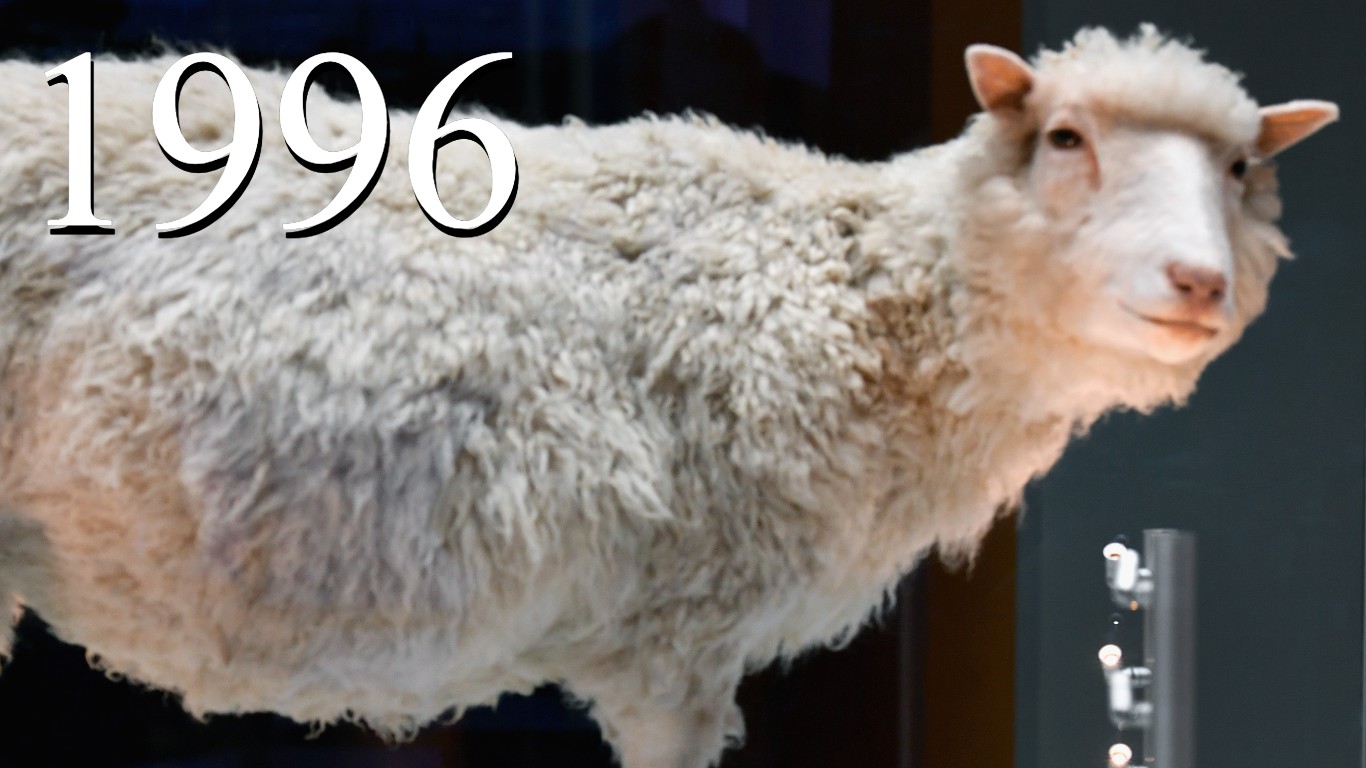
1996
> Avg temp in August: 60.6°F – #31 highest on 1940-2023 record
> Size of anomaly: -0.4°F from 1991-2020 normal – #12 coldest difference

Source: Doug Pensinger / Getty Images
1997
> Avg temp in August: 60.8°F – #26 highest on 1940-2023 record
> Size of anomaly: -0.2°F from 1991-2020 normal – #7 coldest difference
[in-text-ad-2]

Source: Space Frontiers / Getty Images
1998
> Avg temp in August: 61.3°F – #10 highest on 1940-2023 record
> Size of anomaly: 0.3°F from 1991-2020 normal – ##N/A warmest difference

Source: USAF / Getty Images
1999
> Avg temp in August: 60.6°F – #32 highest on 1940-2023 record
> Size of anomaly: -0.4°F from 1991-2020 normal – #13 coldest difference
[in-text-ad]
Source: NASA / Getty Images
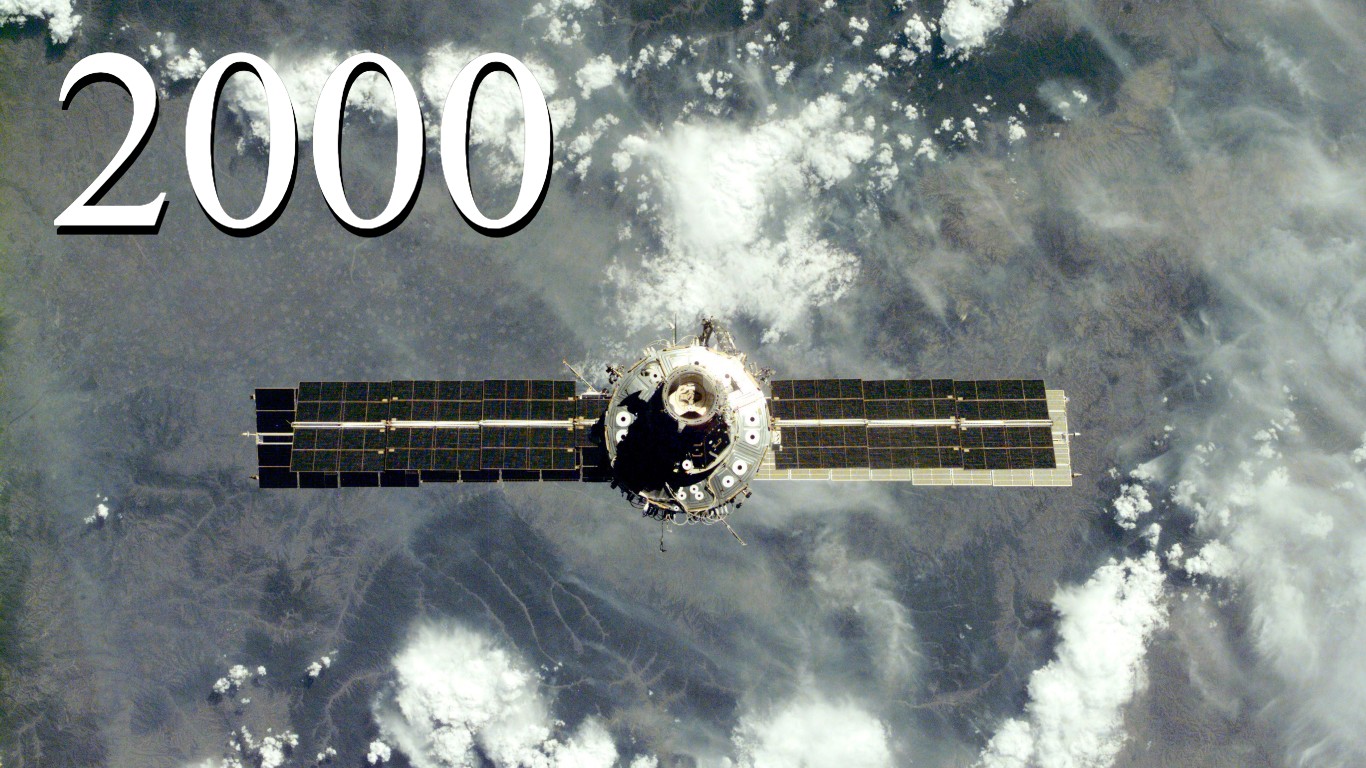
2000
> Avg temp in August: 60.6°F – #32 highest on 1940-2023 record
> Size of anomaly: -0.4°F from 1991-2020 normal – #13 coldest difference
Source: Mark Wilson / Getty Images
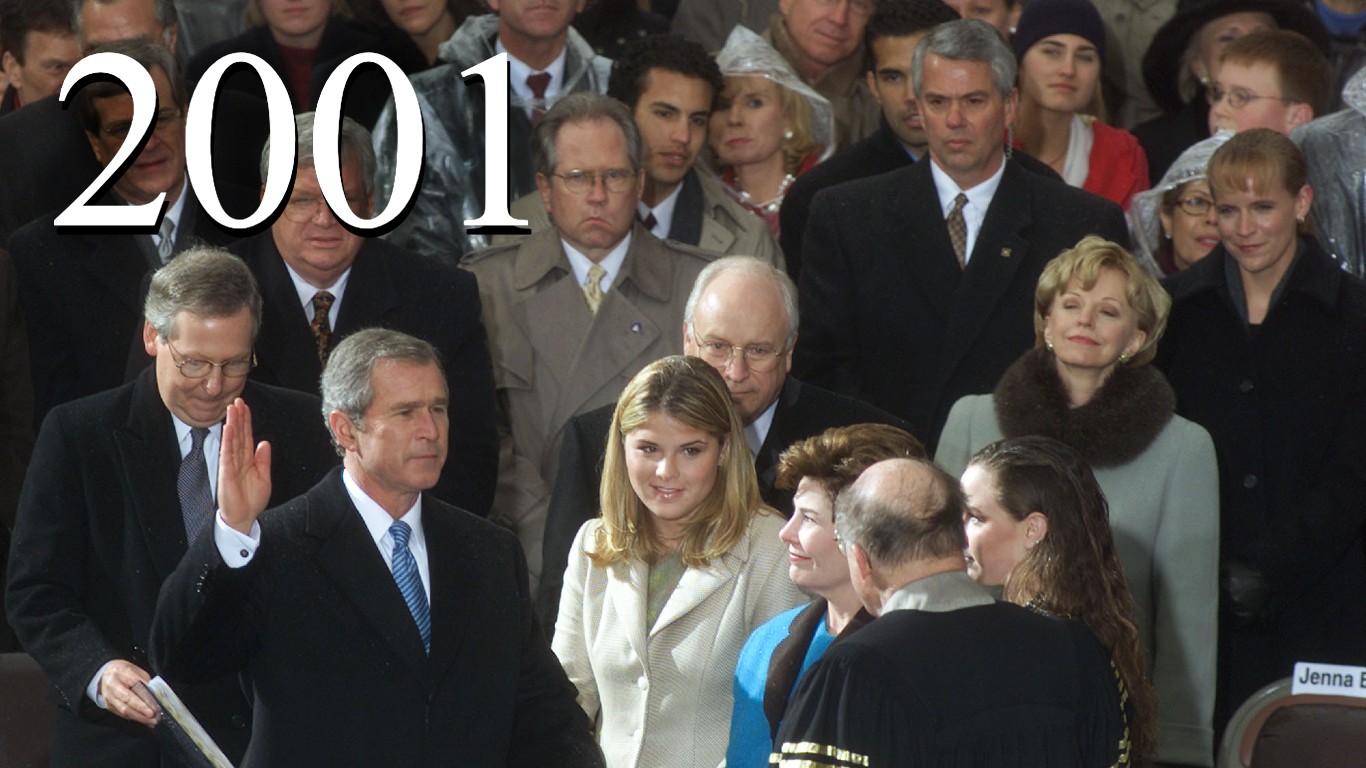
2001
> Avg temp in August: 60.9°F – #23 highest on 1940-2023 record
> Size of anomaly: -0.1°F from 1991-2020 normal – #5 coldest difference

Source: Mark Wilson / Getty Images
2002
> Avg temp in August: 61.0°F – #19 highest on 1940-2023 record
> Size of anomaly: 0.0°F from 1991-2020 normal – ##N/A warmest difference
[in-text-ad-2]
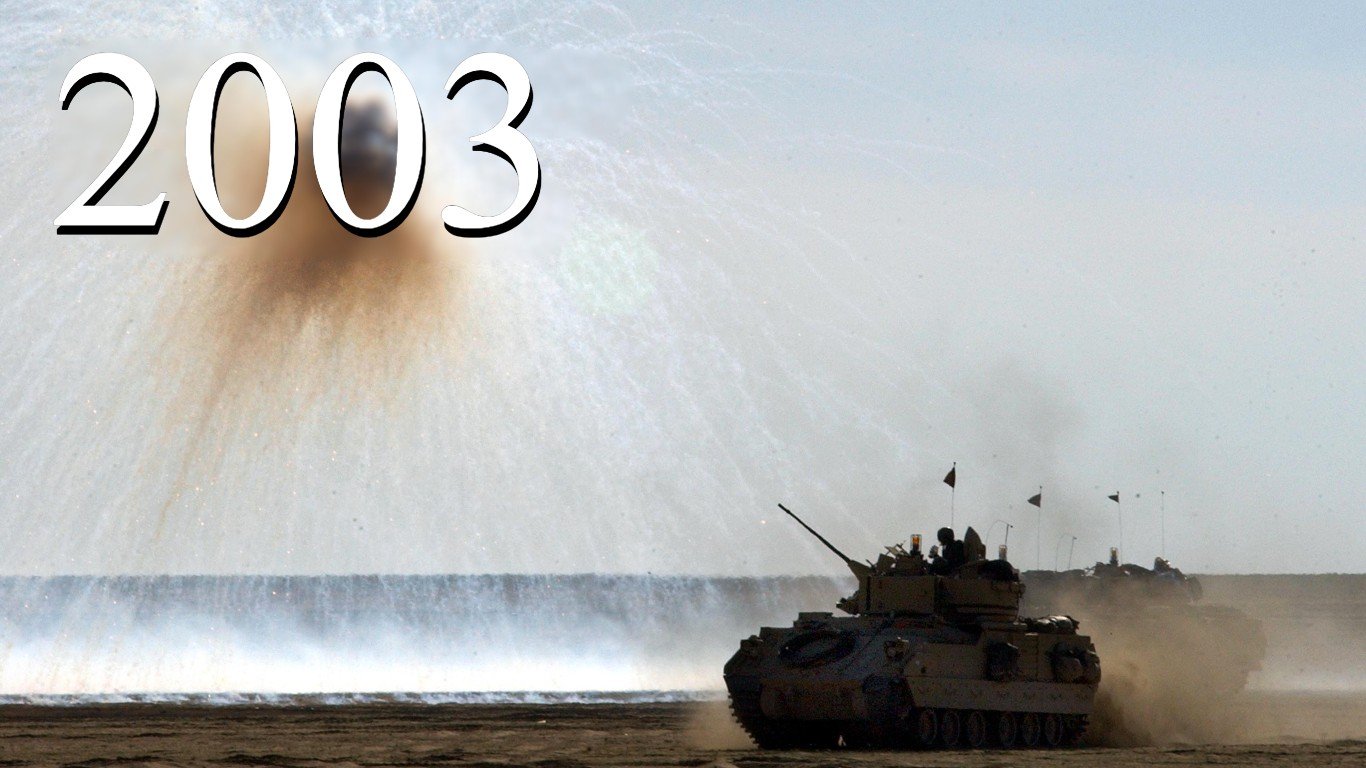
Source: Scott Barbour / Getty Images
2003
> Avg temp in August: 60.9°F – #21 highest on 1940-2023 record
> Size of anomaly: -0.1°F from 1991-2020 normal – #3 coldest difference

Source: Chris Jackson / Getty Images
2004
> Avg temp in August: 60.7°F – #29 highest on 1940-2023 record
> Size of anomaly: -0.3°F from 1991-2020 normal – #10 coldest difference
[in-text-ad]

2005
> Avg temp in August: 61.1°F – #14 highest on 1940-2023 record
> Size of anomaly: 0.1°F from 1991-2020 normal – #13 warmest difference

Source: Wathiq Khuzaie / Getty Images
2006
> Avg temp in August: 61.1°F – #17 highest on 1940-2023 record
> Size of anomaly: 0.1°F from 1991-2020 normal – #16 warmest difference

Source: David Paul Morris / Getty Images
2007
> Avg temp in August: 61.0°F – #20 highest on 1940-2023 record
> Size of anomaly: 0.0°F from 1991-2020 normal – ##N/A coldest difference
[in-text-ad-2]
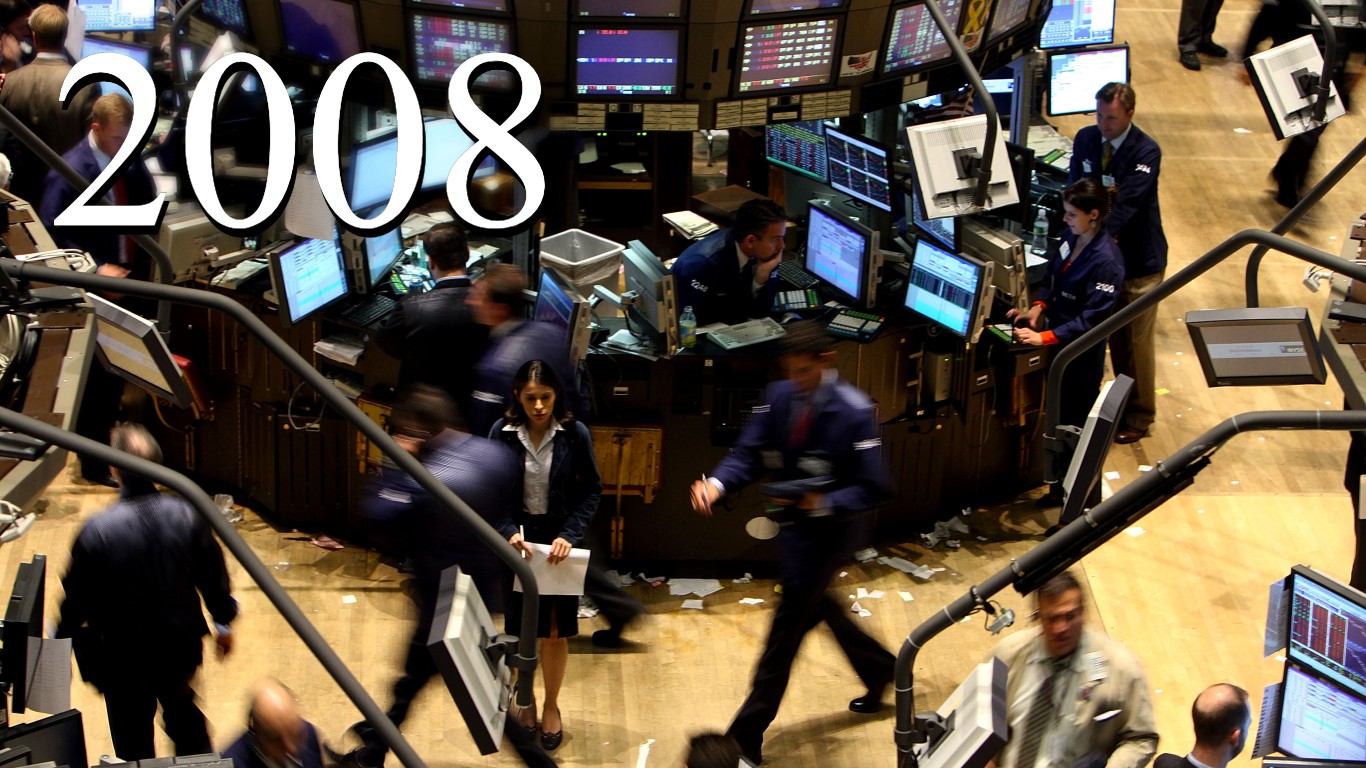
Source: Spencer Platt / Getty Images
2008
> Avg temp in August: 60.8°F – #24 highest on 1940-2023 record
> Size of anomaly: -0.2°F from 1991-2020 normal – #6 coldest difference

Source: Alex Wong / Getty Images
2009
> Avg temp in August: 61.1°F – #14 highest on 1940-2023 record
> Size of anomaly: 0.1°F from 1991-2020 normal – #13 warmest difference
[in-text-ad]

Source: Chris Graythen / Getty Images
2010
> Avg temp in August: 61.1°F – #14 highest on 1940-2023 record
> Size of anomaly: 0.1°F from 1991-2020 normal – #13 warmest difference
 24/7 Wall St.
Source: Majid Saeedi / Getty Images
2011
> Avg temp in August: 61.2°F – #11 highest on 1940-2023 record
> Size of anomaly: 0.2°F from 1991-2020 normal – #10 warmest difference

Source: Peter Macdiarmid / Getty Images
2012
> Avg temp in August: 61.1°F – #13 highest on 1940-2023 record
> Size of anomaly: 0.1°F from 1991-2020 normal – #12 warmest difference
[in-text-ad-2]

Source: Michael Buckner / Getty Images
2013
> Avg temp in August: 61.1°F – #18 highest on 1940-2023 record
> Size of anomaly: 0.1°F from 1991-2020 normal – #17 warmest difference

Source: Sean Gallup / Getty Images
2014
> Avg temp in August: 61.2°F – #11 highest on 1940-2023 record
> Size of anomaly: 0.2°F from 1991-2020 normal – #10 warmest difference
[in-text-ad]
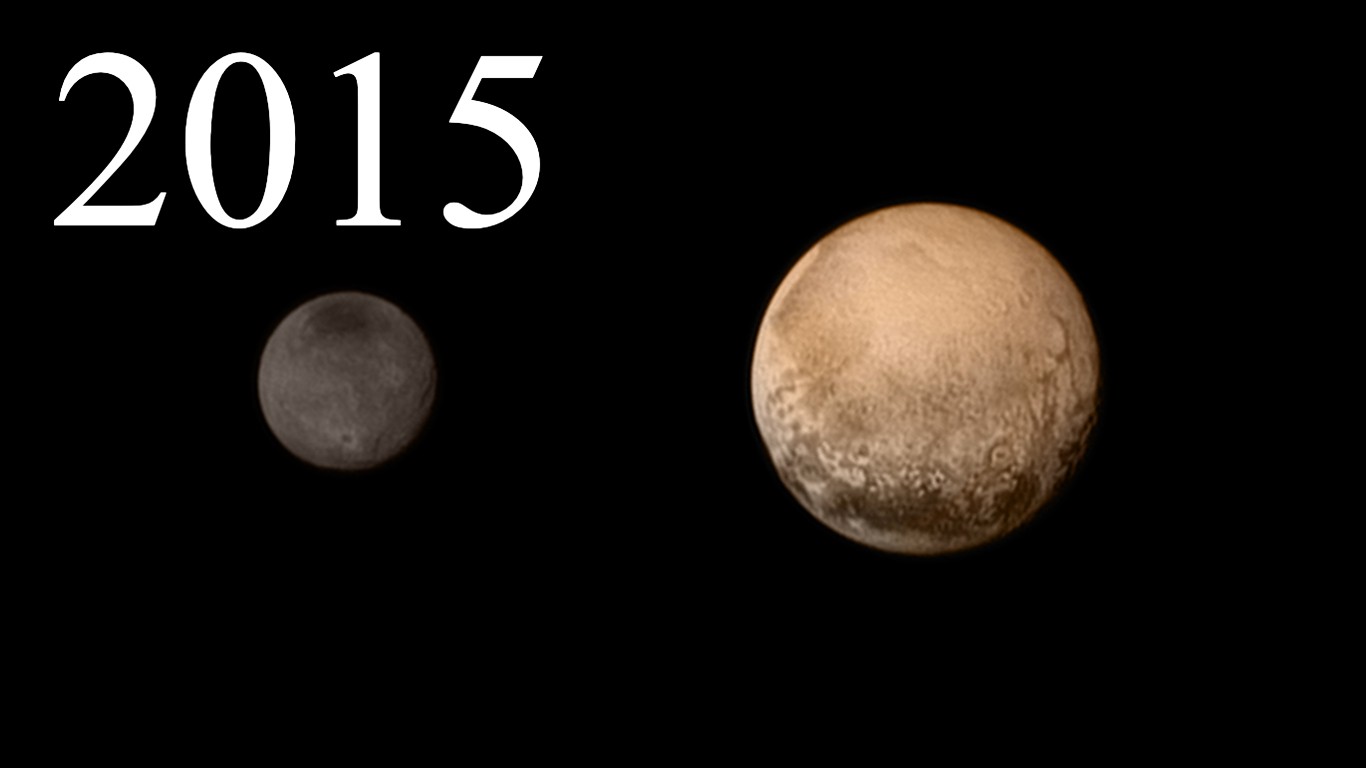
Source: NASA / Getty Images
2015
> Avg temp in August: 61.3°F – #9 highest on 1940-2023 record
> Size of anomaly: 0.3°F from 1991-2020 normal – #9 warmest difference

Source: Scott Olson / Getty Images
2016
> Avg temp in August: 61.6°F – #3 highest on 1940-2023 record
> Size of anomaly: 0.6°F from 1991-2020 normal – #3 warmest difference
Source: NASA / Getty Images
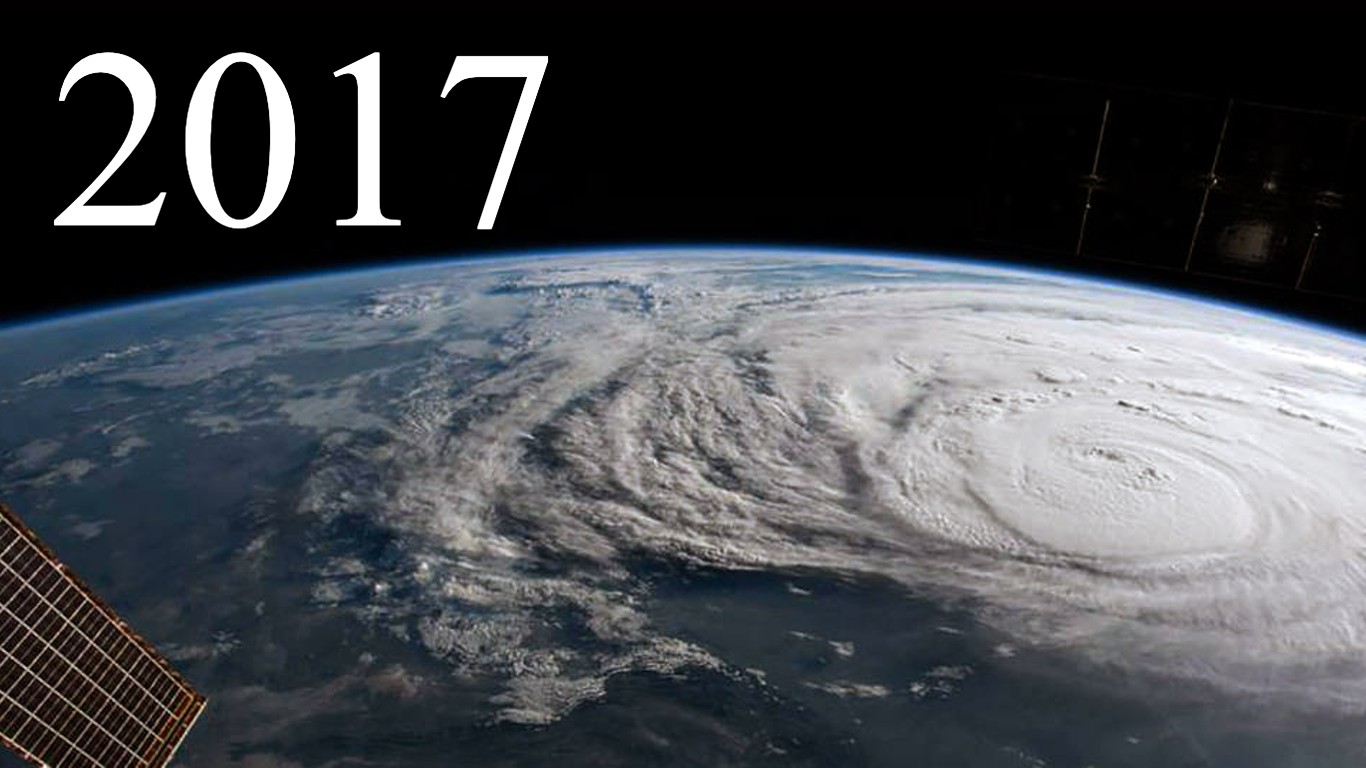
2017
> Avg temp in August: 61.4°F – #7 highest on 1940-2023 record
> Size of anomaly: 0.4°F from 1991-2020 normal – #7 warmest difference
[in-text-ad-2]

Source: Justin Sullivan / Getty Images
2018
> Avg temp in August: 61.4°F – #8 highest on 1940-2023 record
> Size of anomaly: 0.4°F from 1991-2020 normal – #8 warmest difference
Source: Anthony Kwan / Getty Images
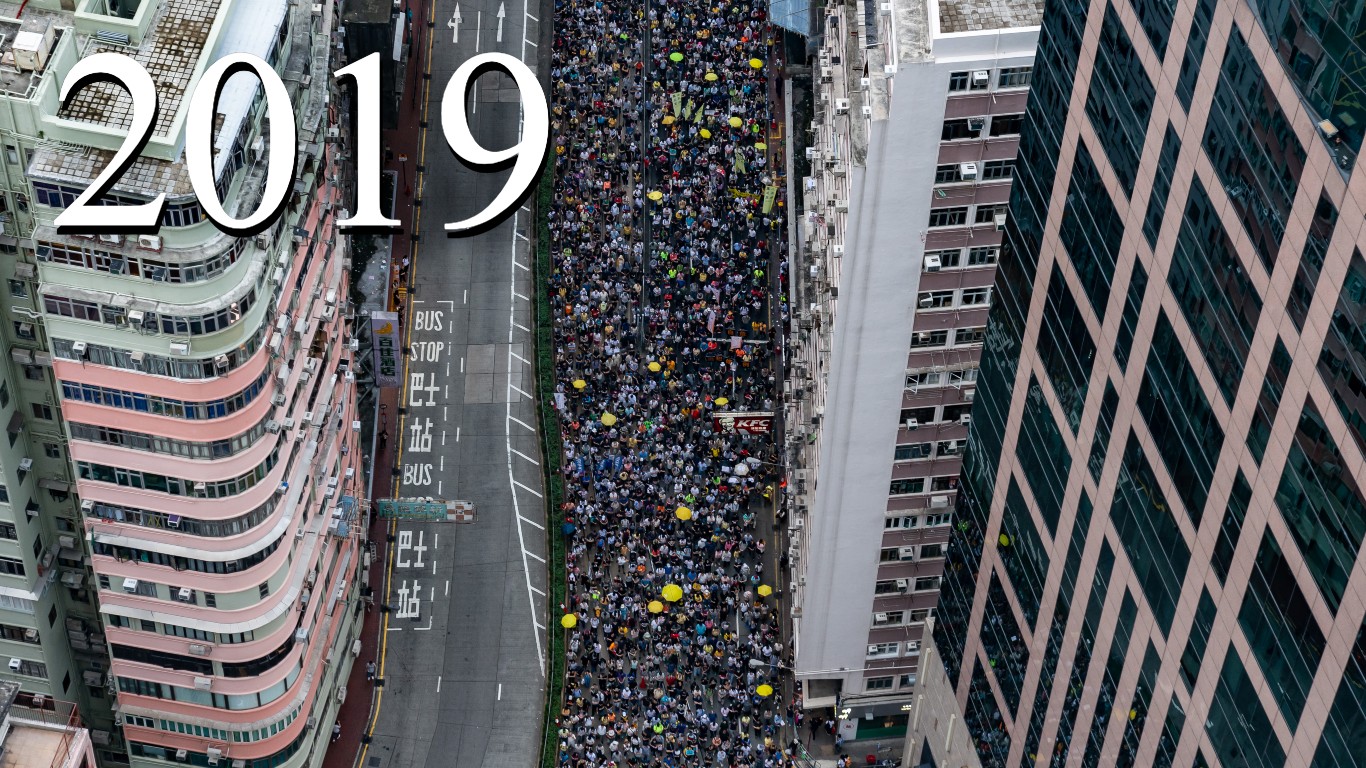
2019
> Avg temp in August: 61.7°F – #2 highest on 1940-2023 record
> Size of anomaly: 0.7°F from 1991-2020 normal – #2 warmest difference
[in-text-ad]

Source: flyparade / Getty Images
2020
> Avg temp in August: 61.6°F – #5 highest on 1940-2023 record
> Size of anomaly: 0.6°F from 1991-2020 normal – #5 warmest difference

Source: Alex Wong / Getty Images
2021
> Avg temp in August: 61.5°F – #6 highest on 1940-2023 record
> Size of anomaly: 0.5°F from 1991-2020 normal – #6 warmest difference

Source: romrodinka / Getty Images
2022
> Avg temp in August: 61.6°F – #4 highest on 1940-2023 record
> Size of anomaly: 0.6°F from 1991-2020 normal – #4 warmest difference
[in-text-ad-2]
 by Madelgarius")
2023
> Avg temp in August: 62.2°F – #1 highest on 1940-2023 record
> Size of anomaly: 1.2°F from 1991-2020 normal – #1 warmest difference
Sponsored: Attention Savvy Investors: Speak to 3 Financial Experts – FREE
Ever wanted an extra set of eyes on an investment you’re considering? Now you can speak with up to 3 financial experts in your area for FREE. By simply
clicking here you can begin to match with financial professionals who can help guide you through the financial decisions you’re making. And the best part? The first conversation with them is free.
Click here to match with up to 3 financial pros who would be excited to help you make financial decisions.
Thank you for reading! Have some feedback for us?
Contact the 24/7 Wall St. editorial team.
Editors' Picks