Though it is home to only 4% of the world’s population, the United States accounts for over 25% of global economic activity. However, not all parts of the country benefit equally from this prosperity.
Data from the World Bank shows that income inequality is more pronounced in the U.S. than it is in much of the rest of the world – particularly among nations with similar levels of economic development and democratic, free-market values. Even though the U.S. is the wealthiest country in the world by gross domestic product, more than 41 million Americans, or 12.8% of the population, live below the poverty line.
In communities across the country, overall quality of life is undermined by a number of key social and economic conditions. In addition to poverty, these include crime, widespread unemployment, poor health outcomes, and limited access to essential services, among other factors.
Using data from the Census Bureau, the FBI, and the Centers for Disease Control and Prevention, 24/7 Wall St. created a weighted index of 22 measures to identify the worst cities to live in in every state. The measures used in the index fall into one of three broad categories: economy, community, and overall quality of life. We considered all places in the U.S. with sufficient data and populations of at least 8,000. Our list includes cities, towns, villages, boroughs, and unincorporated communities.
In all but a few cities and towns on this list, incomes are lower than they are across the state as a whole, and residents are more likely to live below the poverty line. Many of the places on the list have also been hit hard by the ongoing opioid epidemic, with fatal overdose rates as much as 150% higher than the comparable overdose rate statewide. (Here is a look at America’s 40 worst counties to live in.)
The housing market in many of these places may be a reflection of the low overall quality of life. Home prices tend to fall when demand declines, and in nearly every city and town on this list, the typical home is worth anywhere between $11,000 and $455,000 less than the typical home is worth in the state, based on the latest census estimates. (Here is a look at the cheapest city to buy a home in your state.)
It is important to note that while each community on this list ranks as the worst place to live within a given state, standards of living can still vary considerably between them.
Editor’s note: In a previous version of this story, Webster, MA, a census-designated place, ranked as the worst place to live in Massachusetts. However, the Webster CDP is located within the broader town of Webster, which ranks more favorably within the state. To avoid conflation between the greater town and the CDP subsection, Webster CDP was excluded from this analysis.
Here is the worst city to live in every state.
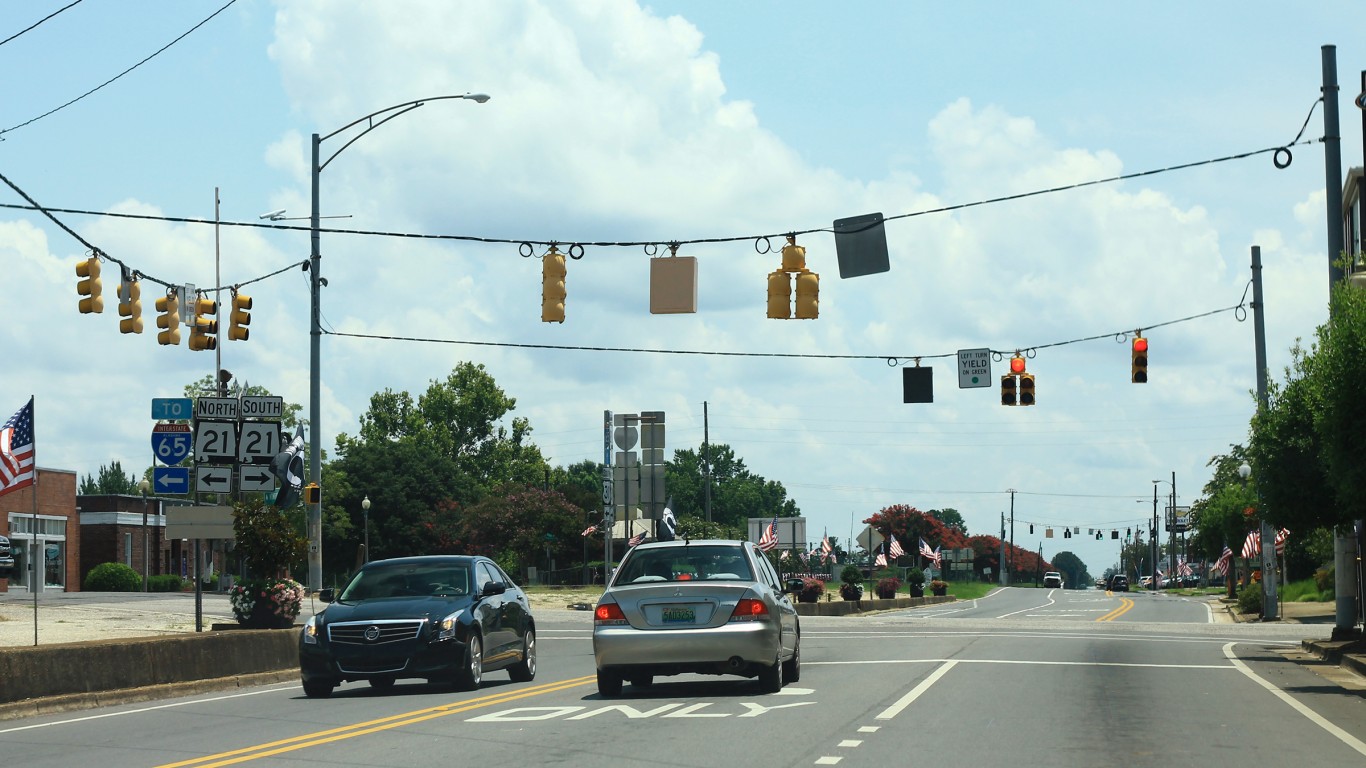
Alabama: Atmore
> Poverty rate: 36.9% (state: 15.8%)
> Median home value: $98,600 (state: $157,100)
> Median household income: $29,104 (state: $54,943)
> Drug-induced mortality: 52.0 deaths per 100,000 (state: 24.9 per 100,000)
> Total population: 8,734

Alaska: Tanaina
> Poverty rate: 10.9% (state: 10.4%)
> Median home value: $258,100 (state: $282,800)
> Median household income: $81,659 (state: $80,287)
> Drug-induced mortality: 26.4 deaths per 100,000 (state: 27.3 per 100,000)
> Total population: 10,314

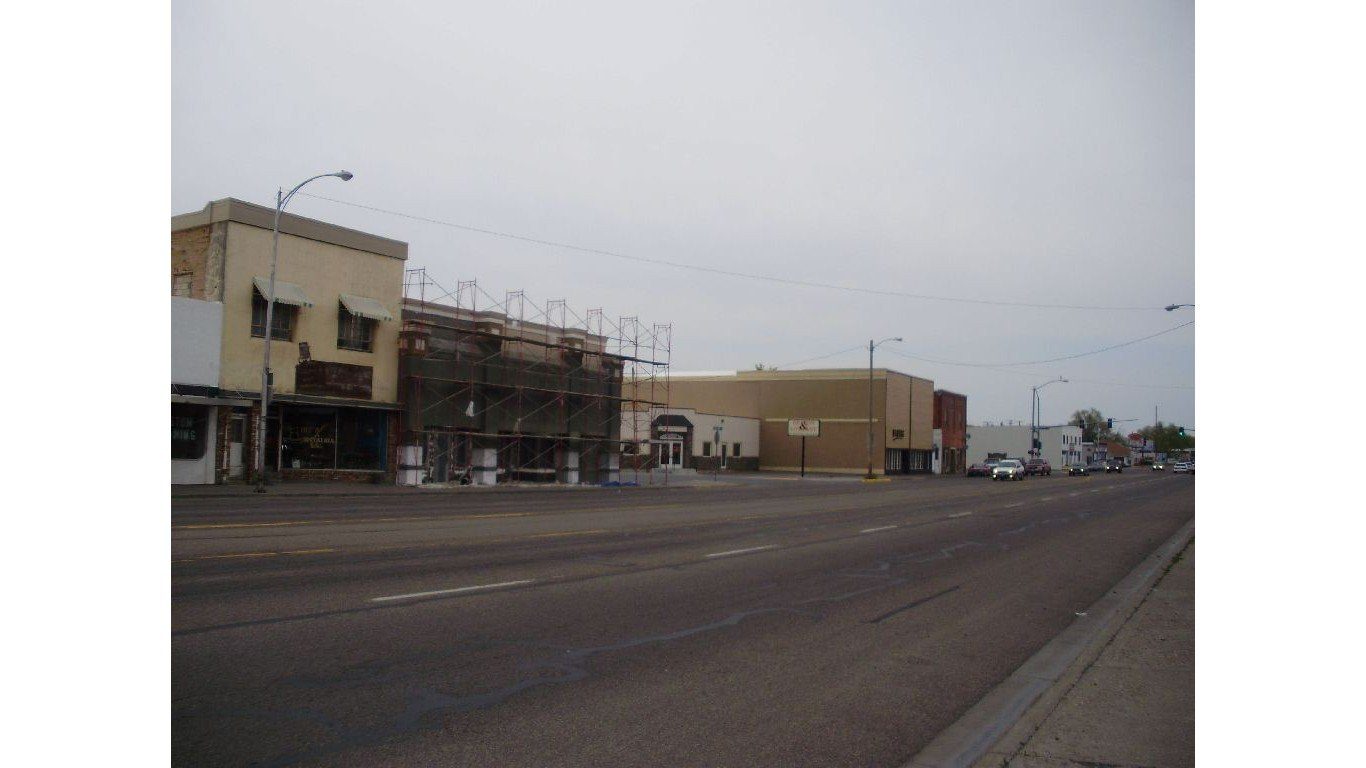
Arizona: New Kingman-Butler
> Poverty rate: 23.3% (state: 13.5%)
> Median home value: $79,300 (state: $265,600)
> Median household income: $39,139 (state: $65,913)
> Drug-induced mortality: 27.8 deaths per 100,000 (state: 34.4 per 100,000)
> Total population: 12,858

Arkansas: Helena-West Helena
> Poverty rate: 43.0% (state: 16.0%)
> Median home value: $70,700 (state: $142,100)
> Median household income: $25,735 (state: $52,123)
> Drug-induced mortality: N/A
> Total population: 9,707
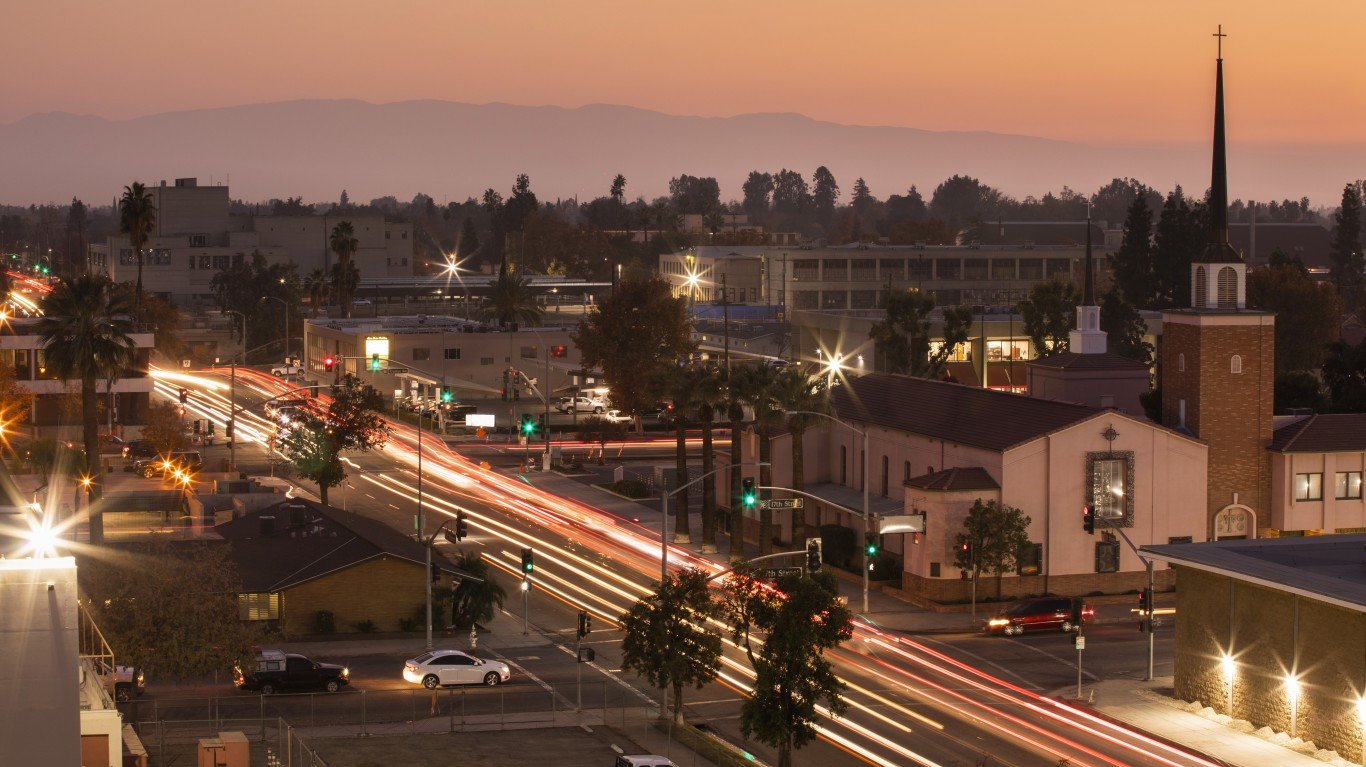
California: East Bakersfield
> Poverty rate: 44.8% (state: 12.3%)
> Median home value: $118,200 (state: $573,200)
> Median household income: $30,091 (state: $84,097)
> Drug-induced mortality: 42.4 deaths per 100,000 (state: 23.3 per 100,000)
> Total population: 11,025
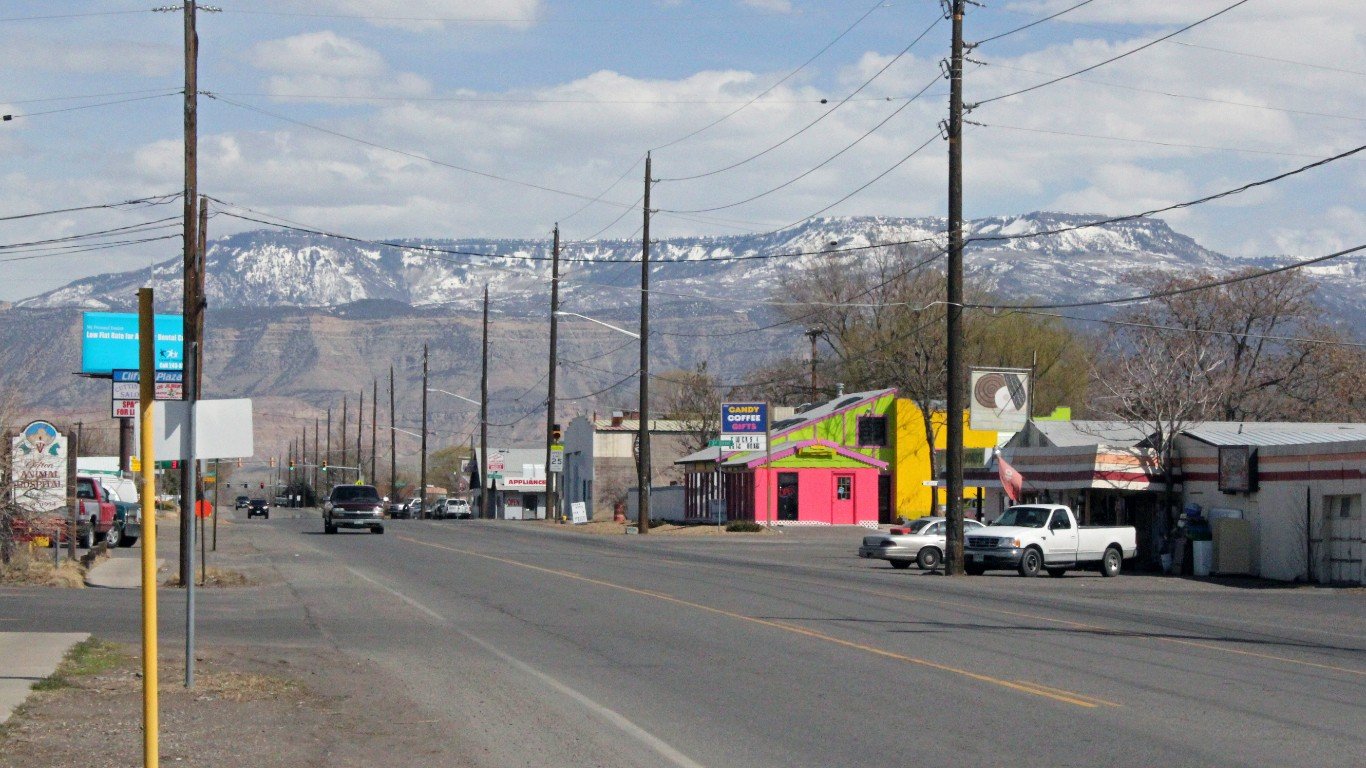
Colorado: Clifton
> Poverty rate: 17.6% (state: 9.6%)
> Median home value: $166,900 (state: $397,500)
> Median household income: $49,350 (state: $80,184)
> Drug-induced mortality: 25.5 deaths per 100,000 (state: 26.5 per 100,000)
> Total population: 20,122
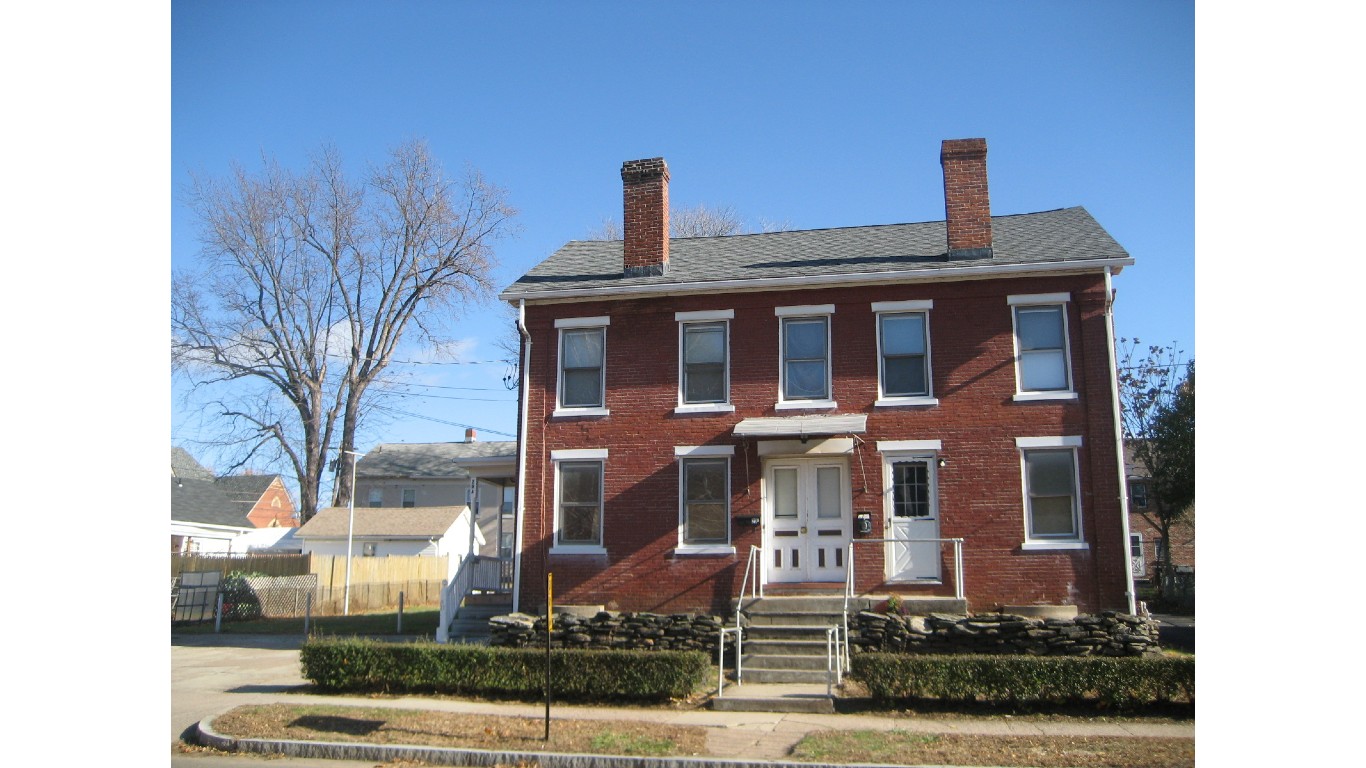
Connecticut: Thompsonville
> Poverty rate: 23.7% (state: 10.0%)
> Median home value: $181,000 (state: $286,700)
> Median household income: $49,626 (state: $83,572)
> Drug-induced mortality: 44.2 deaths per 100,000 (state: 40.0 per 100,000)
> Total population: 8,134

Delaware: Smyrna
> Poverty rate: 13.8% (state: 11.4%)
> Median home value: $225,900 (state: $269,700)
> Median household income: $63,794 (state: $72,724)
> Drug-induced mortality: 42.8 deaths per 100,000 (state: 47.8 per 100,000)
> Total population: 12,619

Florida: Beverly Hills
> Poverty rate: 27.6% (state: 13.1%)
> Median home value: $107,800 (state: $248,700)
> Median household income: $37,728 (state: $61,777)
> Drug-induced mortality: 47.5 deaths per 100,000 (state: 32.5 per 100,000)
> Total population: 10,236
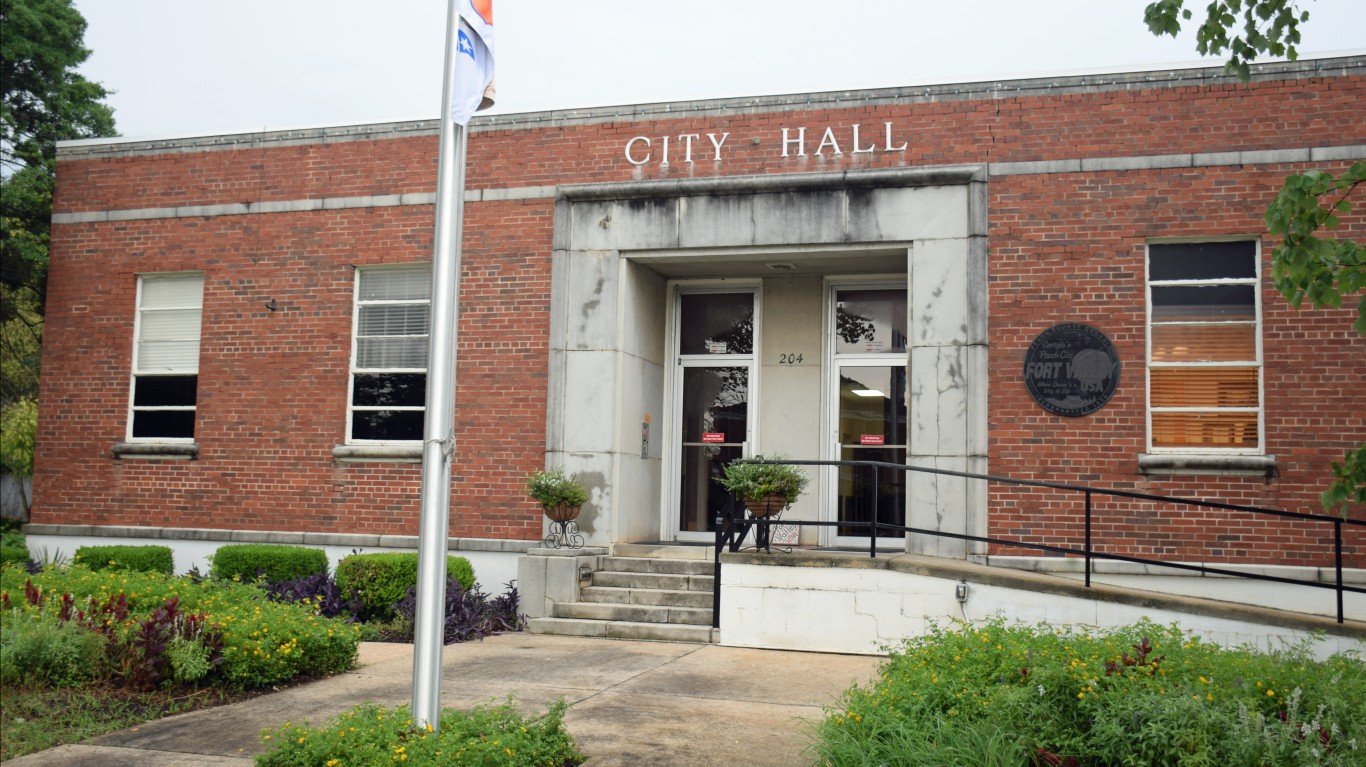
Georgia: Fort Valley
> Poverty rate: 33.5% (state: 13.9%)
> Median home value: $89,500 (state: $206,700)
> Median household income: $30,574 (state: $65,030)
> Drug-induced mortality: N/A
> Total population: 8,829

Hawaii: Makaha
> Poverty rate: 31.2% (state: 9.5%)
> Median home value: $386,900 (state: $662,100)
> Median household income: $47,470 (state: $88,005)
> Drug-induced mortality: 21.0 deaths per 100,000 (state: 20.3 per 100,000)
> Total population: 9,710
Idaho: Blackfoot
> Poverty rate: 13.9% (state: 11.4%)
> Median home value: $171,700 (state: $266,500)
> Median household income: $51,971 (state: $63,377)
> Drug-induced mortality: 18.2 deaths per 100,000 (state: 17.2 per 100,000)
> Total population: 12,106
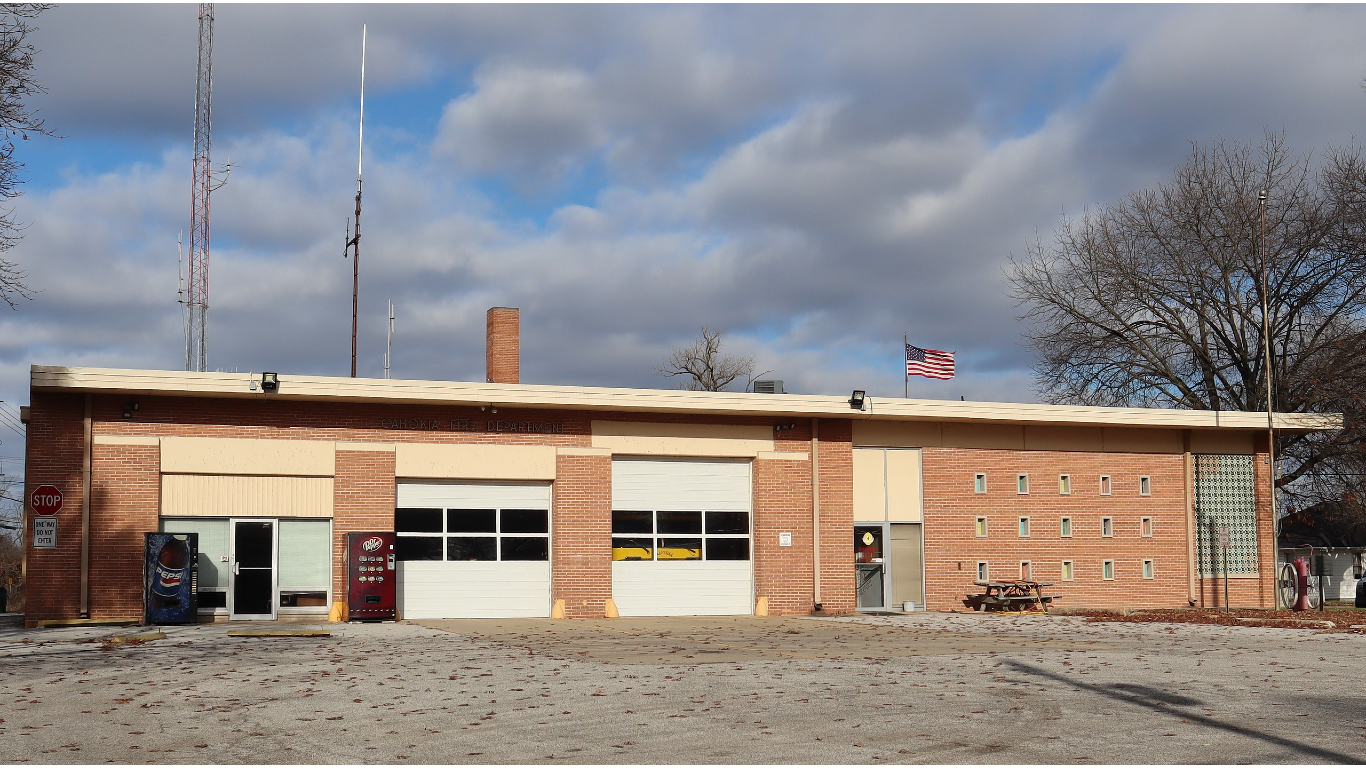
Illinois: Cahokia
> Poverty rate: 35.4% (state: 11.8%)
> Median home value: $40,900 (state: $212,600)
> Median household income: $30,556 (state: $72,563)
> Drug-induced mortality: 36.5 deaths per 100,000 (state: 27.2 per 100,000)
> Total population: 12,440
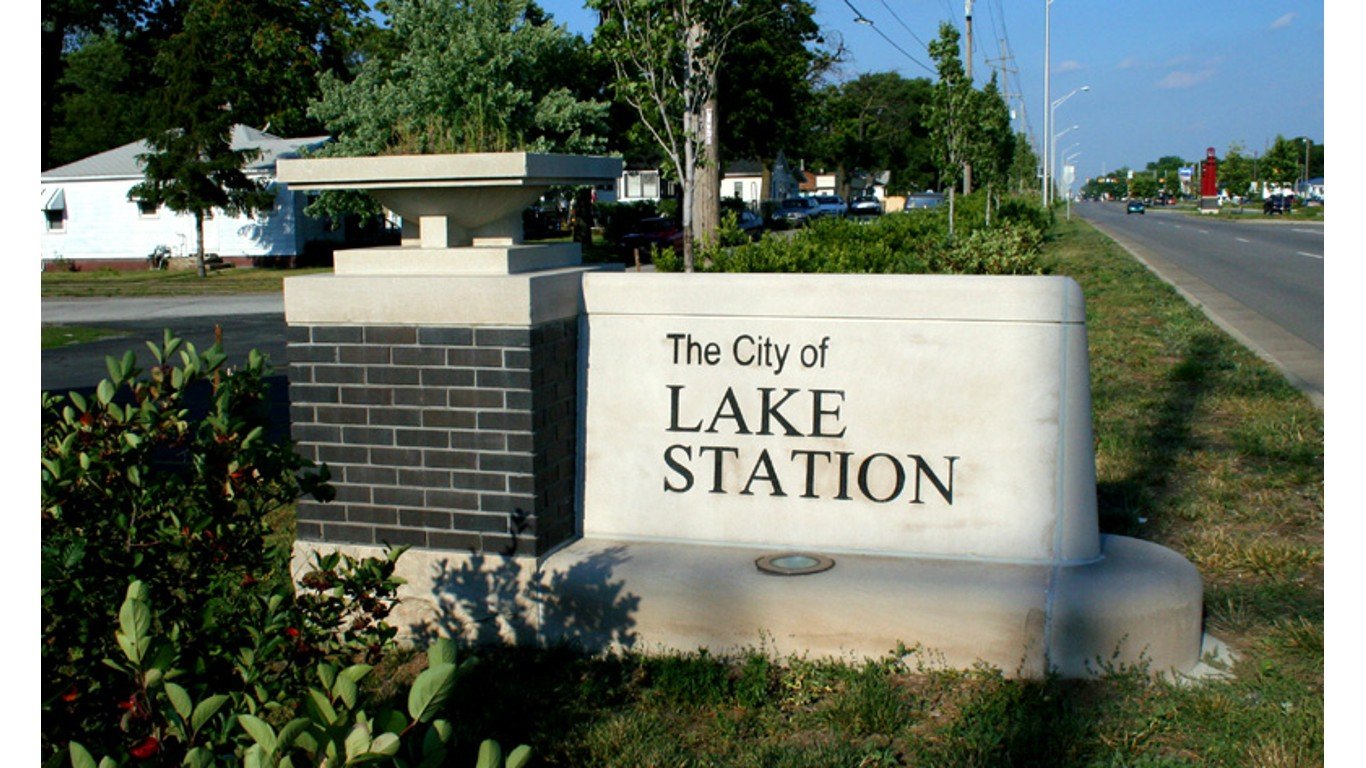
Indiana: Lake Station
> Poverty rate: 18.1% (state: 12.5%)
> Median home value: $88,700 (state: $158,500)
> Median household income: $50,852 (state: $61,944)
> Drug-induced mortality: 37.8 deaths per 100,000 (state: 34.5 per 100,000)
> Total population: 13,292

Iowa: Denison
> Poverty rate: 25.2% (state: 11.0%)
> Median home value: $91,000 (state: $160,700)
> Median household income: $45,204 (state: $65,429)
> Drug-induced mortality: N/A
> Total population: 8,323
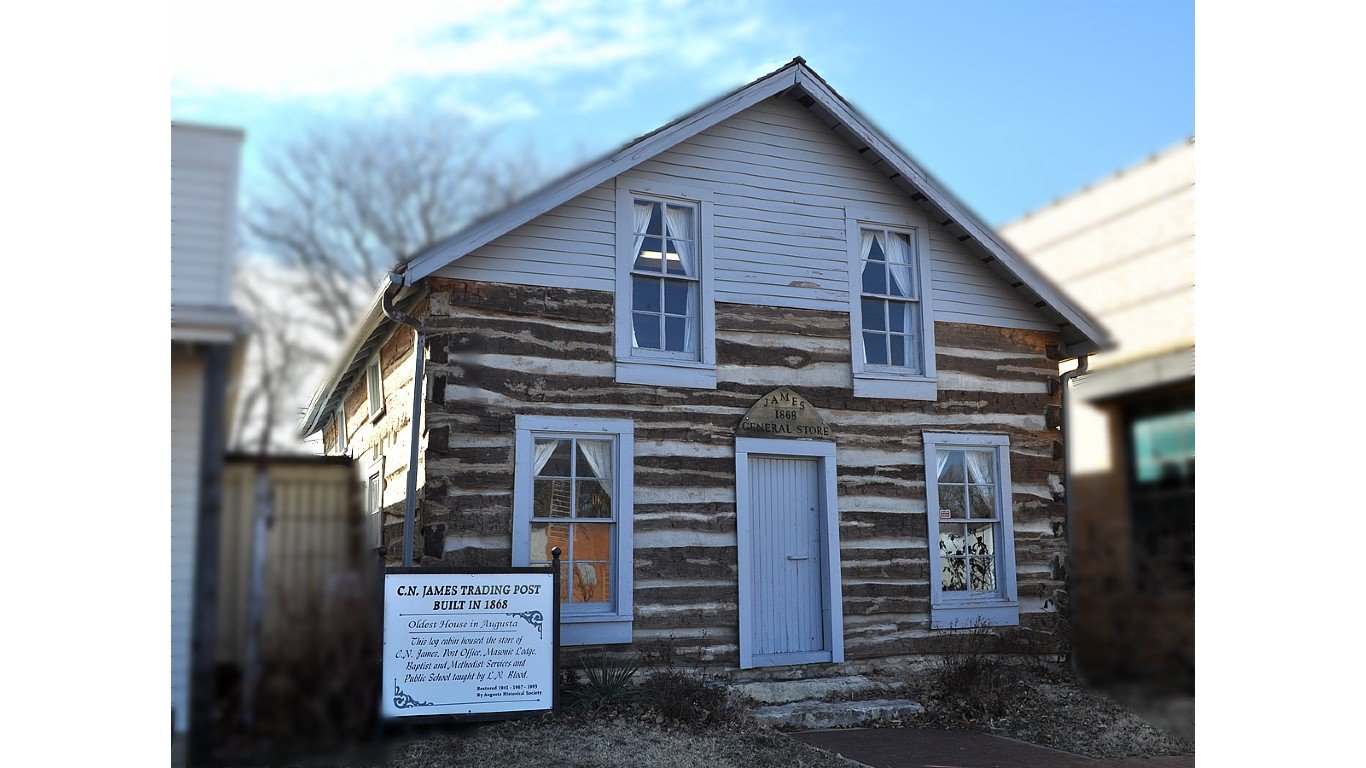
Kansas: Augusta
> Poverty rate: 11.4% (state: 11.5%)
> Median home value: $139,300 (state: $164,800)
> Median household income: $52,500 (state: $64,521)
> Drug-induced mortality: 18.8 deaths per 100,000 (state: 18.9 per 100,000)
> Total population: 9,299

Kentucky: Somerset
> Poverty rate: 30.6% (state: 16.3%)
> Median home value: $117,000 (state: $155,100)
> Median household income: $30,107 (state: $55,454)
> Drug-induced mortality: 42.4 deaths per 100,000 (state: 46.1 per 100,000)
> Total population: 11,696

Louisiana: Bastrop
> Poverty rate: 44.0% (state: 18.8%)
> Median home value: $82,000 (state: $174,000)
> Median household income: $23,955 (state: $53,571)
> Drug-induced mortality: 43.2 deaths per 100,000 (state: 41.7 per 100,000)
> Total population: 9,879
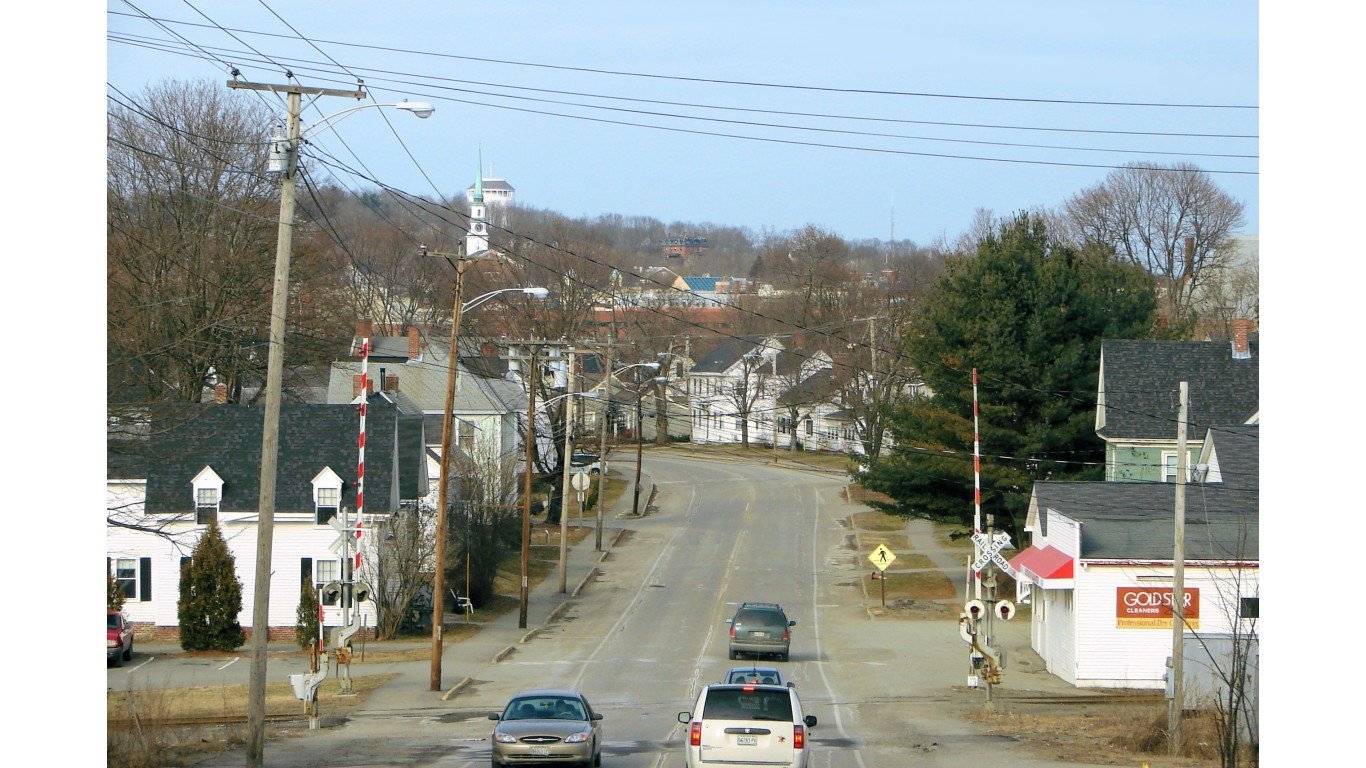
Maine: Brewer
> Poverty rate: 15.5% (state: 11.0%)
> Median home value: $172,800 (state: $212,100)
> Median household income: $50,614 (state: $63,182)
> Drug-induced mortality: 53.2 deaths per 100,000 (state: 37.7 per 100,000)
> Total population: 9,606

Maryland: Hagerstown
> Poverty rate: 25.5% (state: 9.2%)
> Median home value: $164,400 (state: $338,500)
> Median household income: $42,965 (state: $91,431)
> Drug-induced mortality: 64.3 deaths per 100,000 (state: 44.0 per 100,000)
> Total population: 43,015

Massachusetts: Holyoke
> Poverty rate: 26.5% (state: 9.9%)
> Median home value: $209,900 (state: $424,700)
> Median household income: $45,045 (state: $89,026)
> Drug-induced mortality: 52.8 deaths per 100,000 (state: 35.9 per 100,000)
> Total population: 30,460

Michigan: Beecher
> Poverty rate: 32.4% (state: 13.3%)
> Median home value: $33,700 (state: $172,100)
> Median household income: $33,105 (state: $63,202)
> Drug-induced mortality: 47.7 deaths per 100,000 (state: 28.9 per 100,000)
> Total population: 9,171
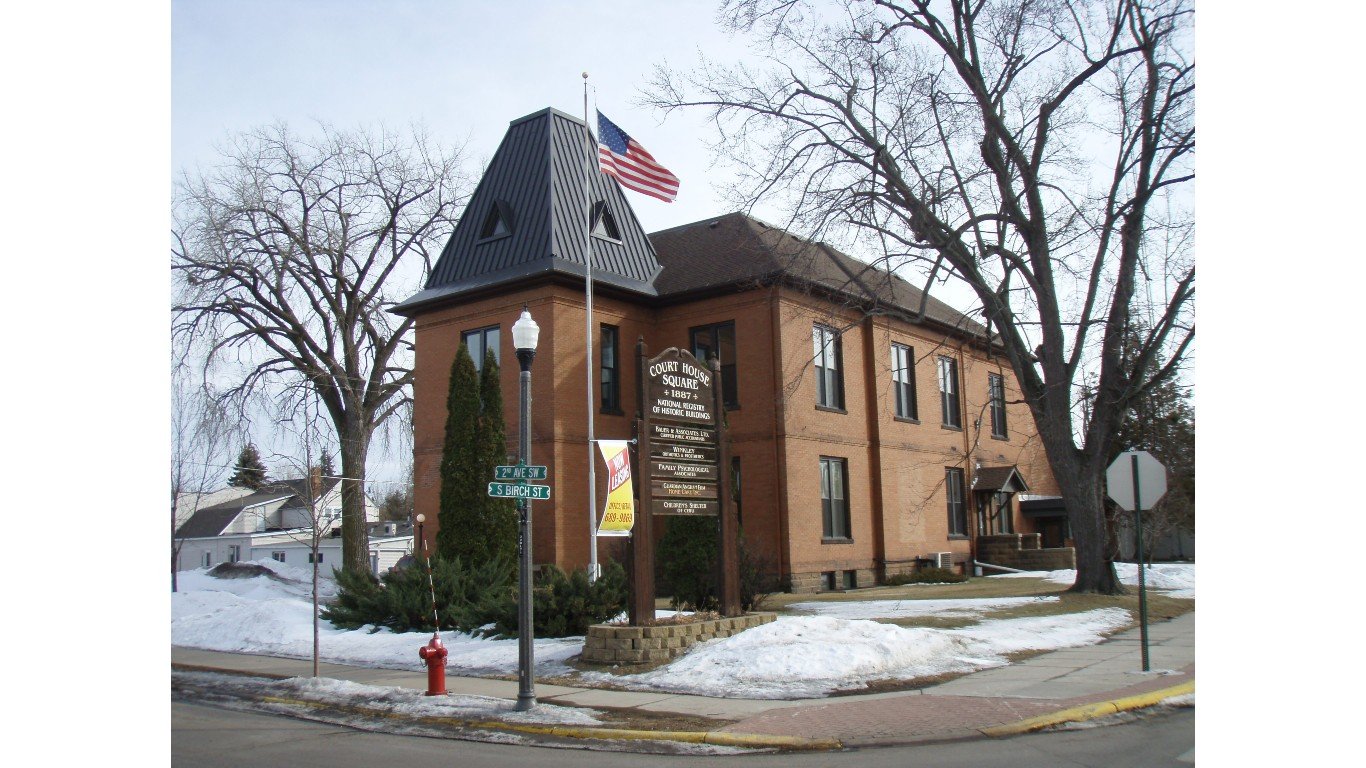
Minnesota: Cambridge
> Poverty rate: 8.4% (state: 9.2%)
> Median home value: $187,500 (state: $250,200)
> Median household income: $57,969 (state: $77,706)
> Drug-induced mortality: 17.8 deaths per 100,000 (state: 20.9 per 100,000)
> Total population: 9,454

Mississippi: Yazoo City
> Poverty rate: 39.1% (state: 19.4%)
> Median home value: $66,400 (state: $133,000)
> Median household income: $30,092 (state: $49,111)
> Drug-induced mortality: N/A
> Total population: 10,887
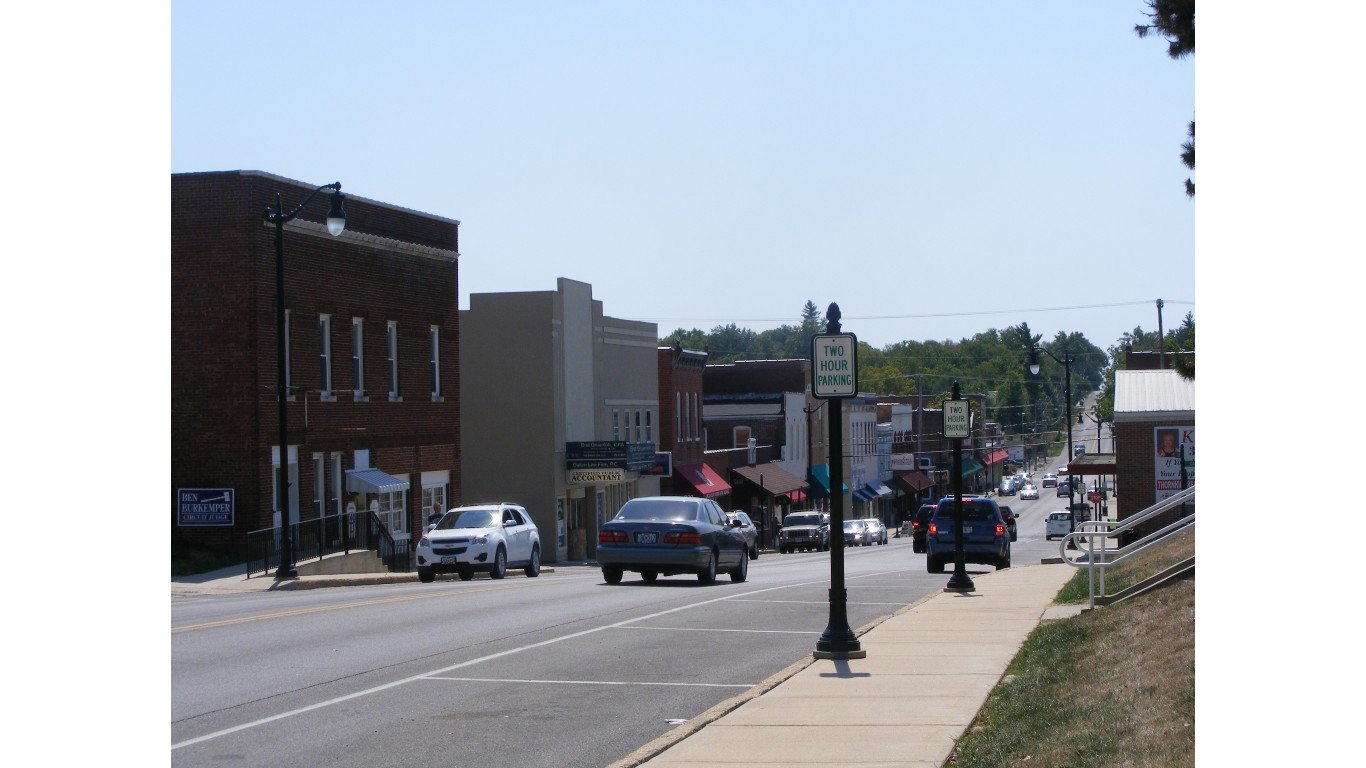
Missouri: Troy
> Poverty rate: 10.8% (state: 12.8%)
> Median home value: $160,600 (state: $171,800)
> Median household income: $73,406 (state: $61,043)
> Drug-induced mortality: 34.9 deaths per 100,000 (state: 31.6 per 100,000)
> Total population: 12,463

Montana: Helena Valley Southeast
> Poverty rate: 15.4% (state: 12.5%)
> Median home value: $226,900 (state: $263,700)
> Median household income: $63,675 (state: $60,560)
> Drug-induced mortality: 13.7 deaths per 100,000 (state: 16.7 per 100,000)
> Total population: 9,316

Nebraska: Lexington
> Poverty rate: 15.4% (state: 10.3%)
> Median home value: $123,500 (state: $174,100)
> Median household income: $56,729 (state: $66,644)
> Drug-induced mortality: N/A
> Total population: 10,325

Nevada: Pahrump
> Poverty rate: 14.4% (state: 12.9%)
> Median home value: $215,100 (state: $315,900)
> Median household income: $53,743 (state: $65,686)
> Drug-induced mortality: 32.4 deaths per 100,000 (state: 27.4 per 100,000)
> Total population: 42,471

New Hampshire: Claremont
> Poverty rate: 16.7% (state: 7.4%)
> Median home value: $136,600 (state: $288,700)
> Median household income: $46,414 (state: $83,449)
> Drug-induced mortality: 33.9 deaths per 100,000 (state: 31.0 per 100,000)
> Total population: 12,955
New Jersey: Bridgeton
> Poverty rate: 35.1% (state: 9.8%)
> Median home value: $109,800 (state: $355,700)
> Median household income: $39,995 (state: $89,703)
> Drug-induced mortality: 53.3 deaths per 100,000 (state: 33.0 per 100,000)
> Total population: 26,643

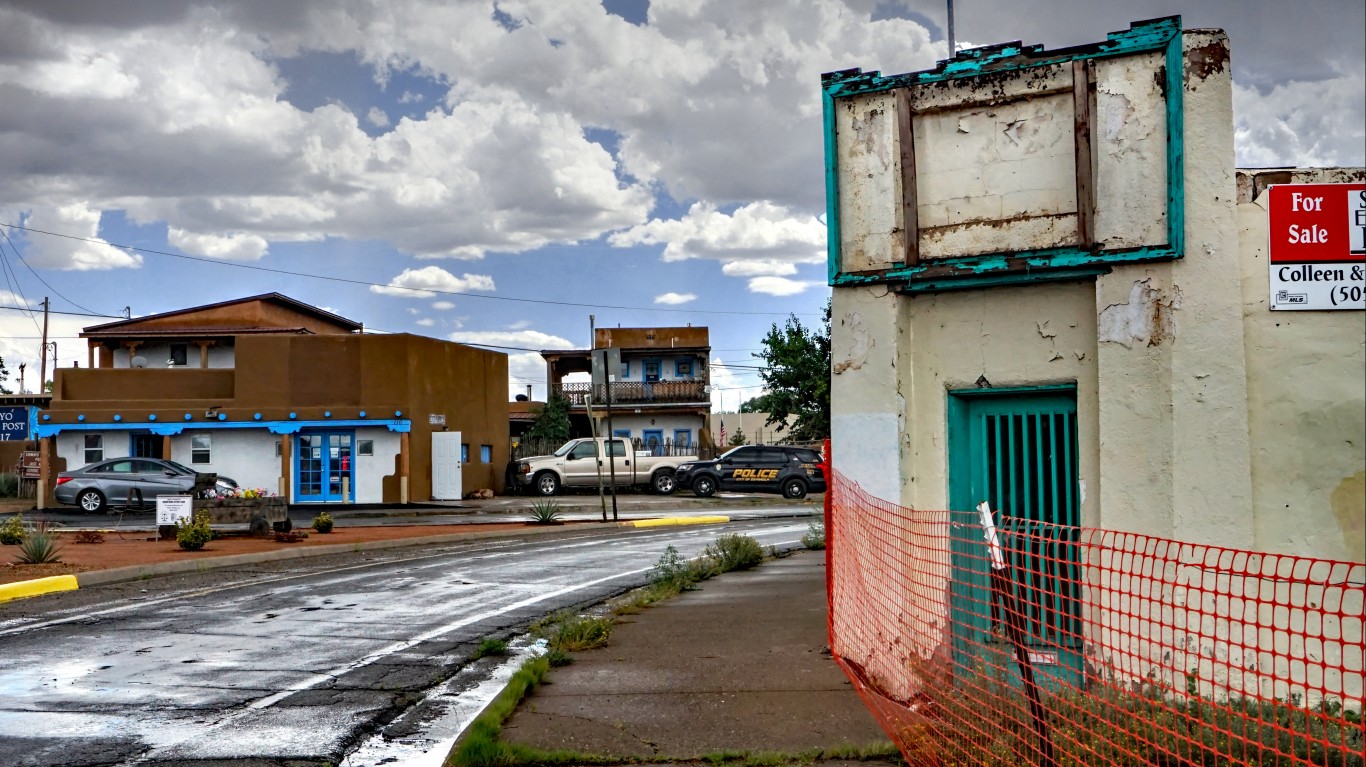
New Mexico: Española
> Poverty rate: 19.9% (state: 18.3%)
> Median home value: $165,600 (state: $184,800)
> Median household income: $42,611 (state: $54,020)
> Drug-induced mortality: 100.3 deaths per 100,000 (state: 40.5 per 100,000)
> Total population: 10,492
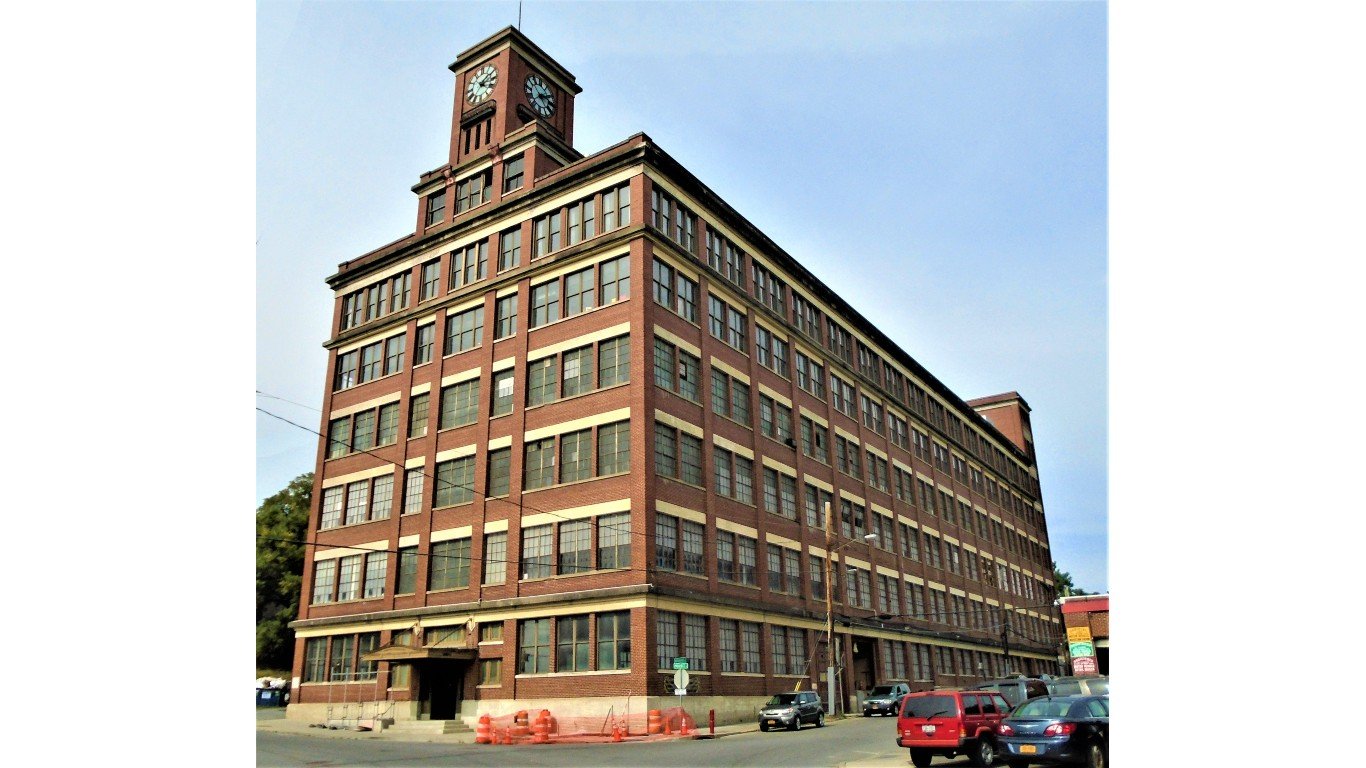
New York: Amsterdam
> Poverty rate: 23.8% (state: 13.5%)
> Median home value: $92,900 (state: $340,600)
> Median household income: $43,164 (state: $75,157)
> Drug-induced mortality: 17.6 deaths per 100,000 (state: 25.6 per 100,000)
> Total population: 18,218
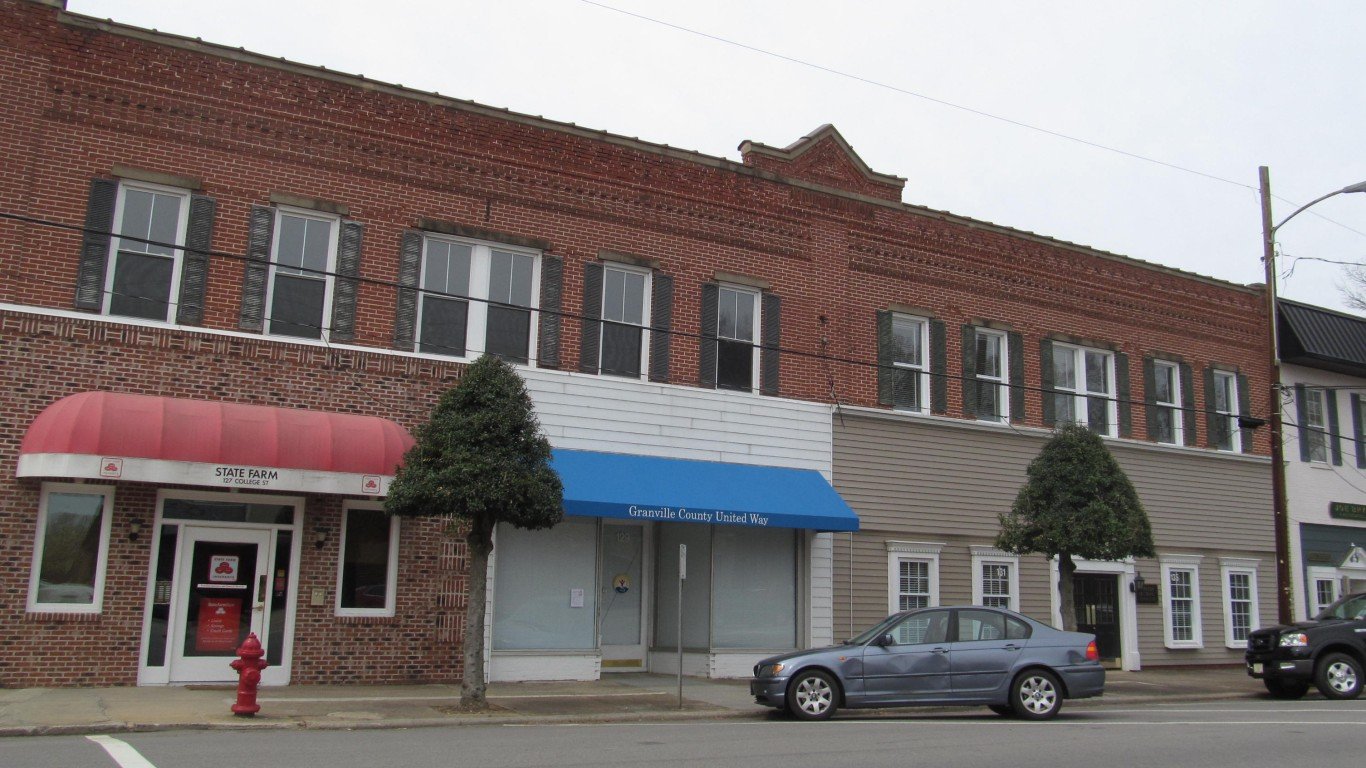
North Carolina: Oxford
> Poverty rate: 24.0% (state: 13.7%)
> Median home value: $143,800 (state: $197,500)
> Median household income: $39,399 (state: $60,516)
> Drug-induced mortality: 27.9 deaths per 100,000 (state: 31.0 per 100,000)
> Total population: 8,658
North Dakota: Dickinson
> Poverty rate: 12.3% (state: 10.7%)
> Median home value: $236,000 (state: $209,900)
> Median household income: $64,806 (state: $68,131)
> Drug-induced mortality: N/A
> Total population: 24,851

Ohio: East Liverpool
> Poverty rate: 29.0% (state: 13.4%)
> Median home value: $59,600 (state: $159,900)
> Median household income: $32,722 (state: $61,938)
> Drug-induced mortality: 49.0 deaths per 100,000 (state: 43.8 per 100,000)
> Total population: 10,051

Oklahoma: Poteau
> Poverty rate: 22.5% (state: 15.2%)
> Median home value: $120,100 (state: $150,800)
> Median household income: $40,711 (state: $56,956)
> Drug-induced mortality: 18.9 deaths per 100,000 (state: 21.1 per 100,000)
> Total population: 8,741
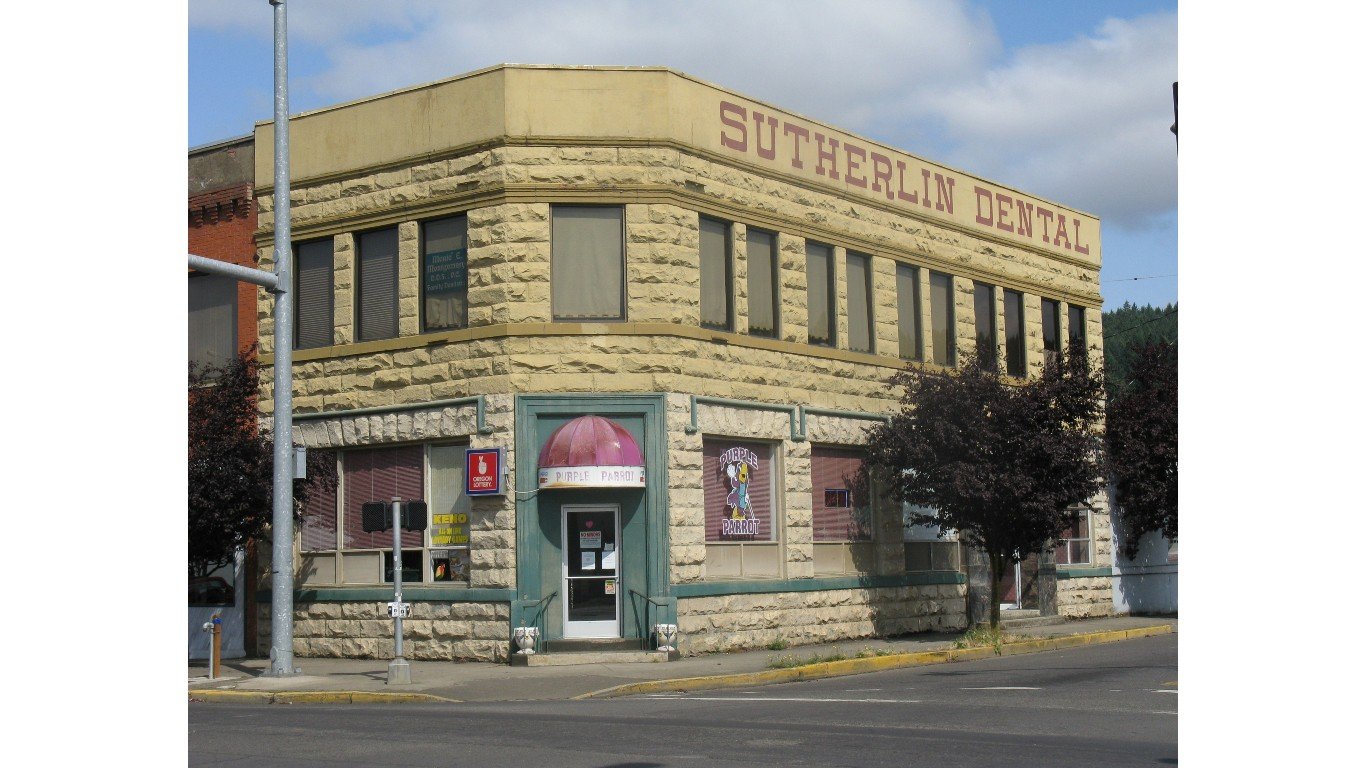
Oregon: Sutherlin
> Poverty rate: 14.7% (state: 12.1%)
> Median home value: $188,100 (state: $362,200)
> Median household income: $43,750 (state: $70,084)
> Drug-induced mortality: 29.9 deaths per 100,000 (state: 24.7 per 100,000)
> Total population: 8,429
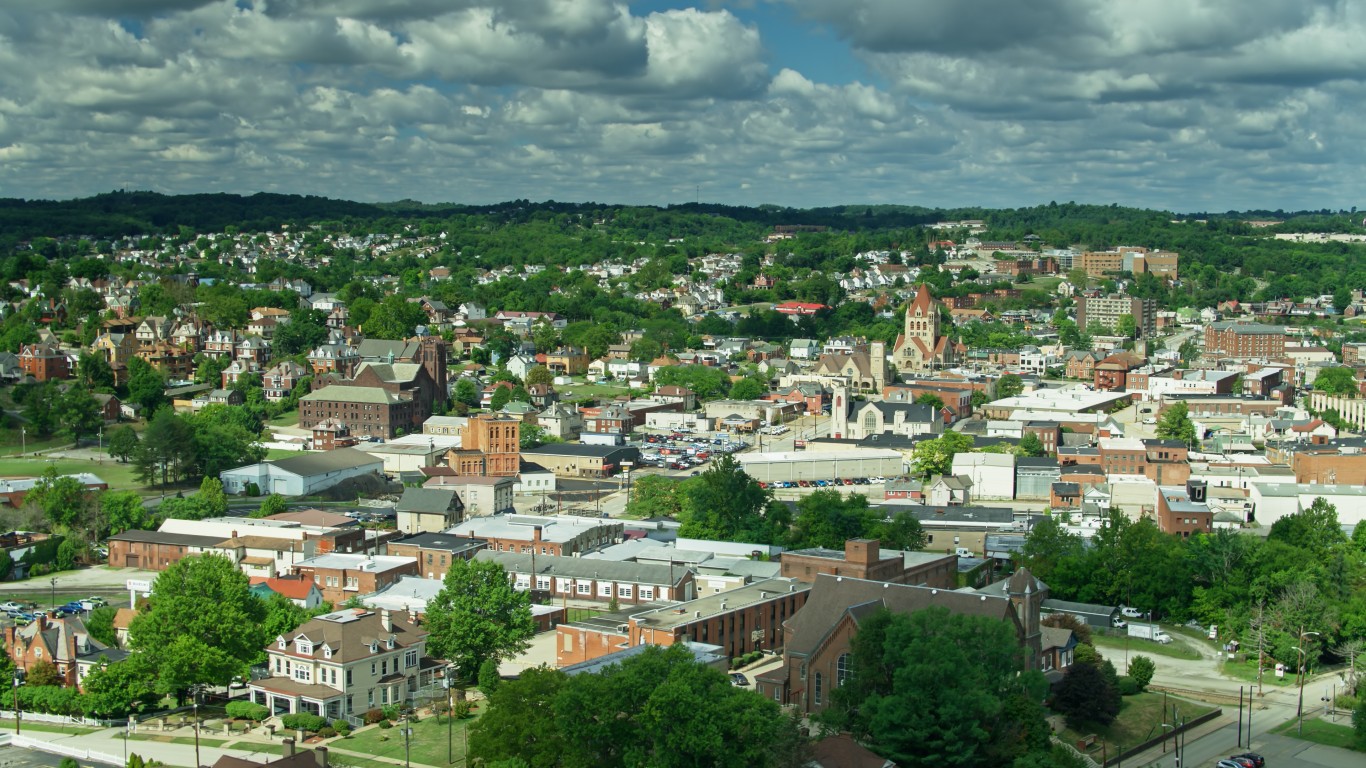
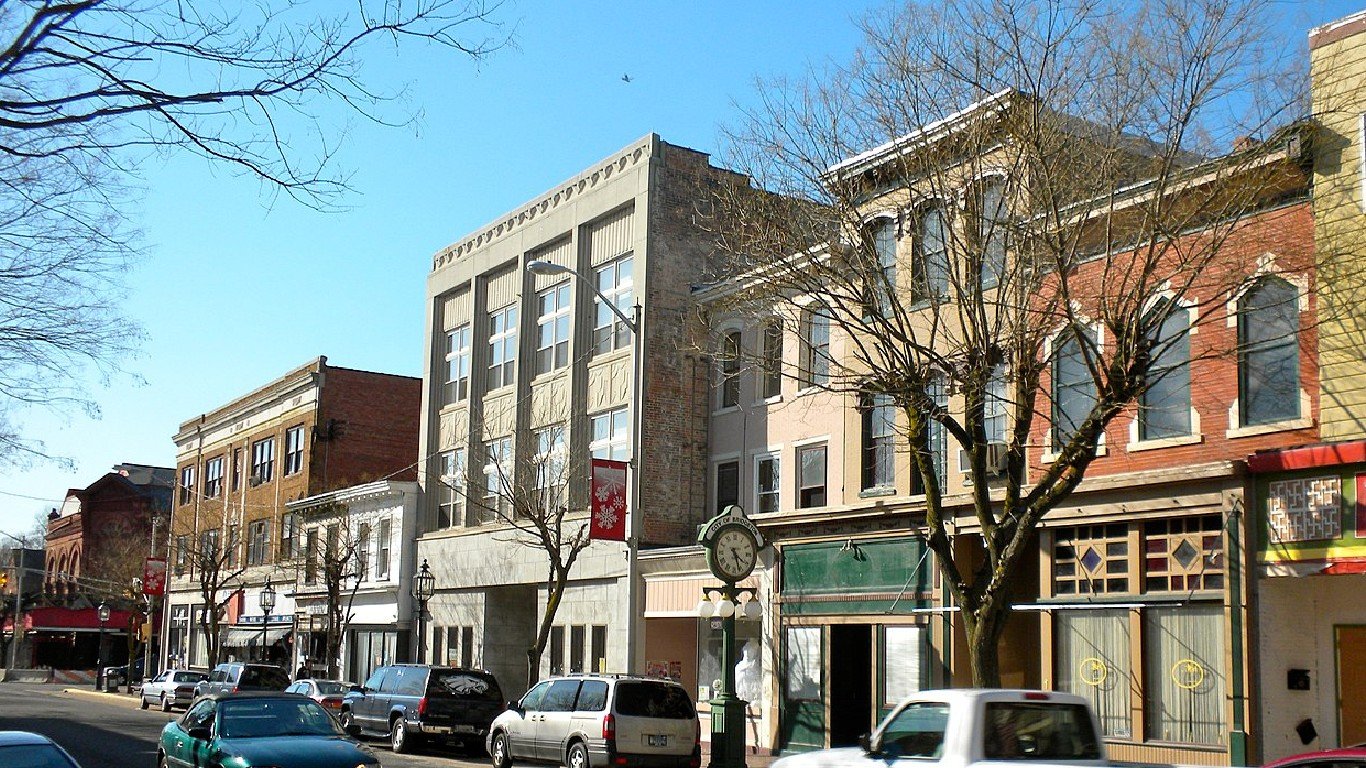
Pennsylvania: Uniontown
> Poverty rate: 24.8% (state: 11.8%)
> Median home value: $81,700 (state: $197,300)
> Median household income: $32,016 (state: $67,587)
> Drug-induced mortality: 55.4 deaths per 100,000 (state: 39.8 per 100,000)
> Total population: 9,988

Rhode Island: Central Falls
> Poverty rate: 24.9% (state: 11.3%)
> Median home value: $187,300 (state: $292,600)
> Median household income: $40,235 (state: $74,489)
> Drug-induced mortality: 41.5 deaths per 100,000 (state: 36.7 per 100,000)
> Total population: 22,192
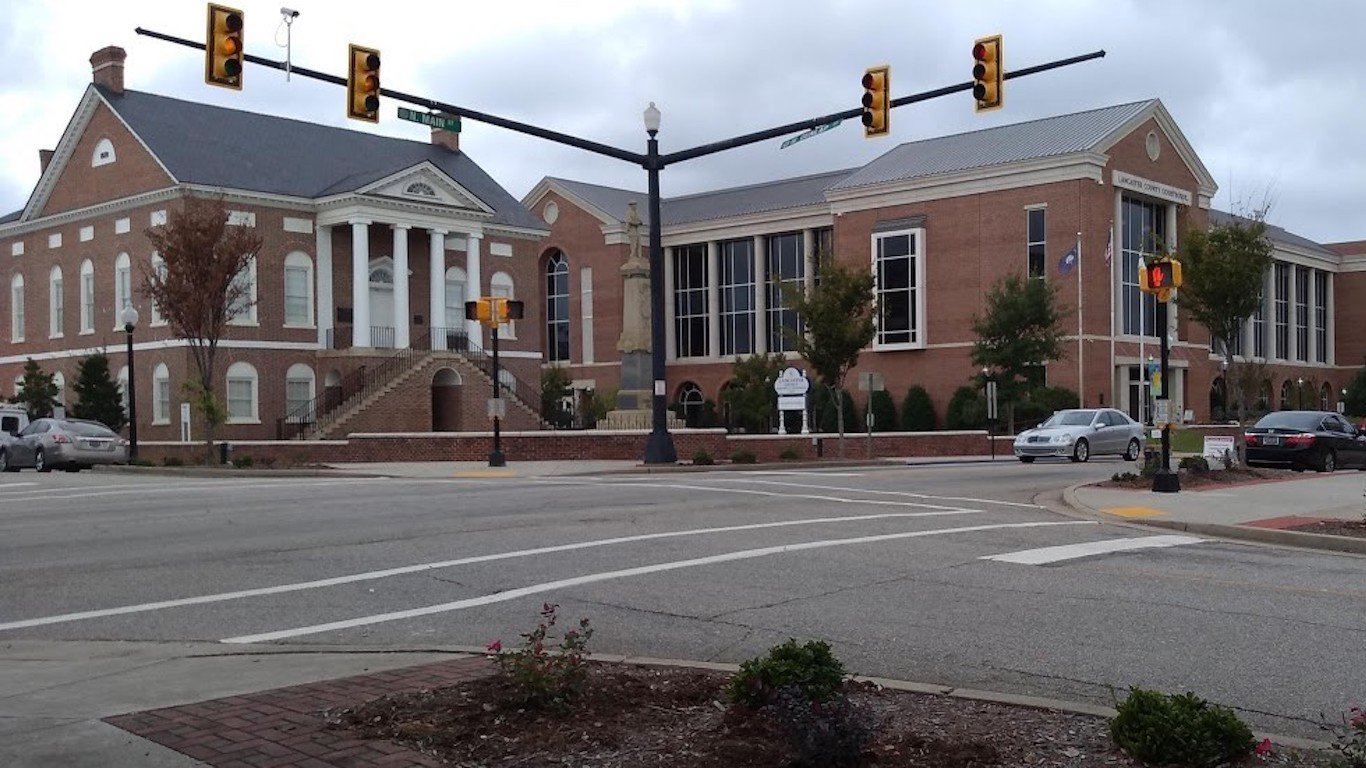
South Carolina: Lancaster
> Poverty rate: 35.5% (state: 14.5%)
> Median home value: $163,400 (state: $181,800)
> Median household income: $29,738 (state: $58,234)
> Drug-induced mortality: 51.1 deaths per 100,000 (state: 33.4 per 100,000)
> Total population: 8,489

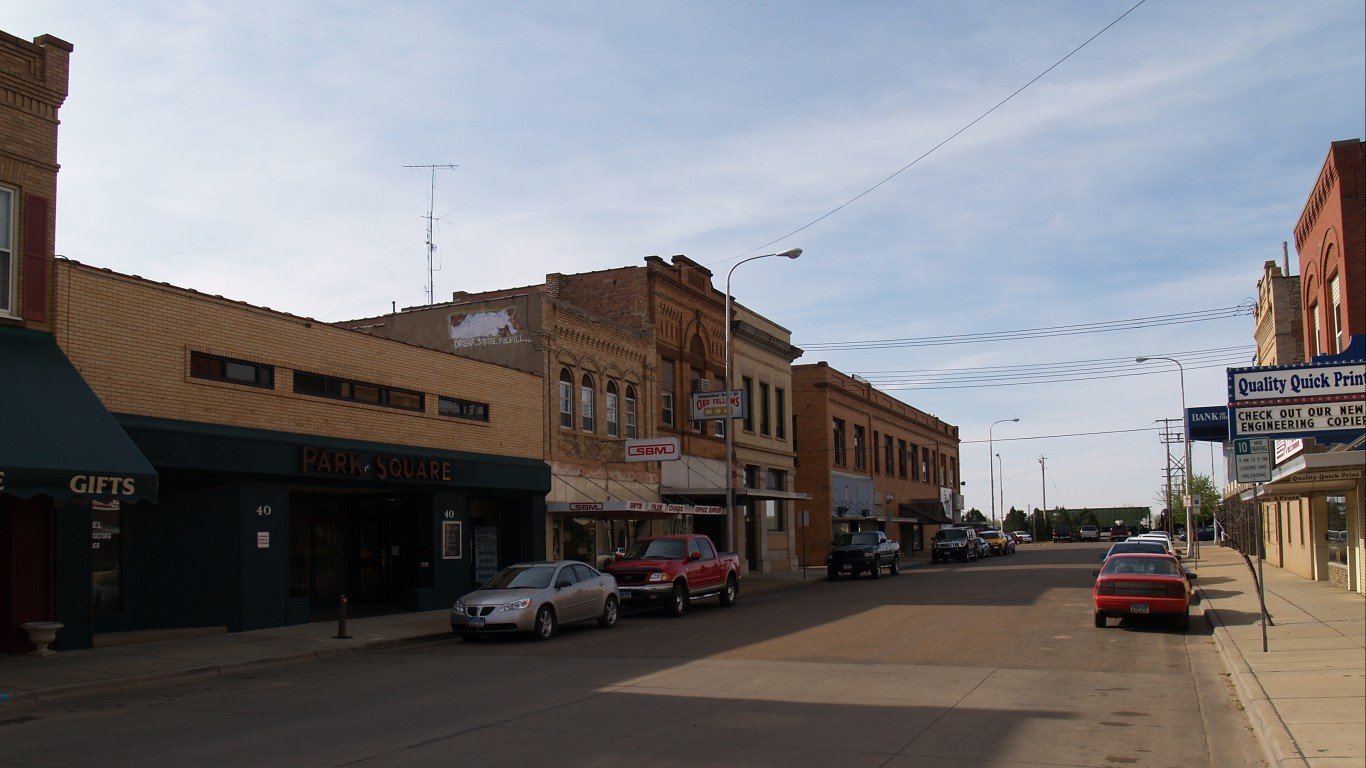
South Dakota: Huron
> Poverty rate: 14.5% (state: 12.5%)
> Median home value: $108,100 (state: $187,800)
> Median household income: $51,206 (state: $63,920)
> Drug-induced mortality: N/A
> Total population: 14,060

Tennessee: Bloomingdale
> Poverty rate: 20.9% (state: 14.3%)
> Median home value: $115,400 (state: $193,700)
> Median household income: $45,726 (state: $58,516)
> Drug-induced mortality: 37.2 deaths per 100,000 (state: 45.2 per 100,000)
> Total population: 8,759
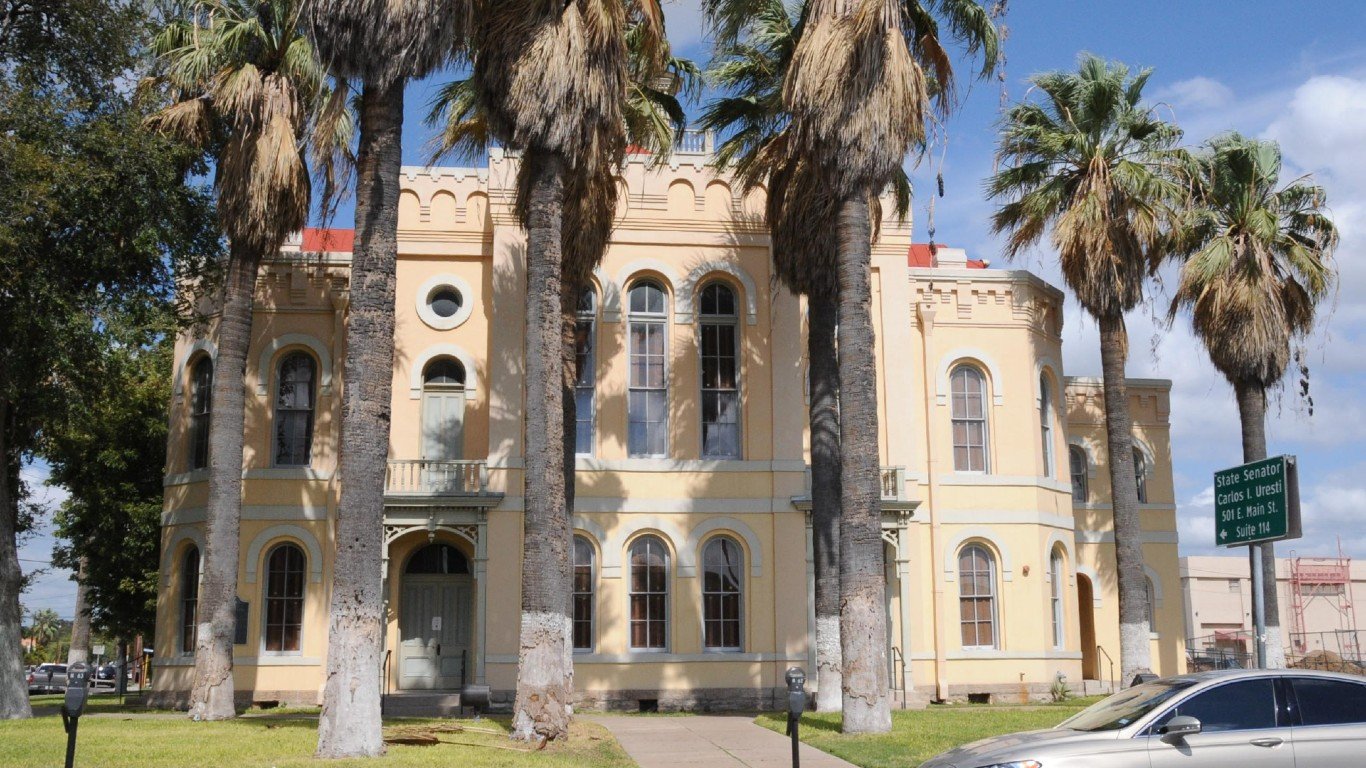
Texas: Eidson Road
> Poverty rate: 34.8% (state: 14.0%)
> Median home value: $68,900 (state: $202,600)
> Median household income: $30,464 (state: $67,321)
> Drug-induced mortality: N/A
> Total population: 9,743
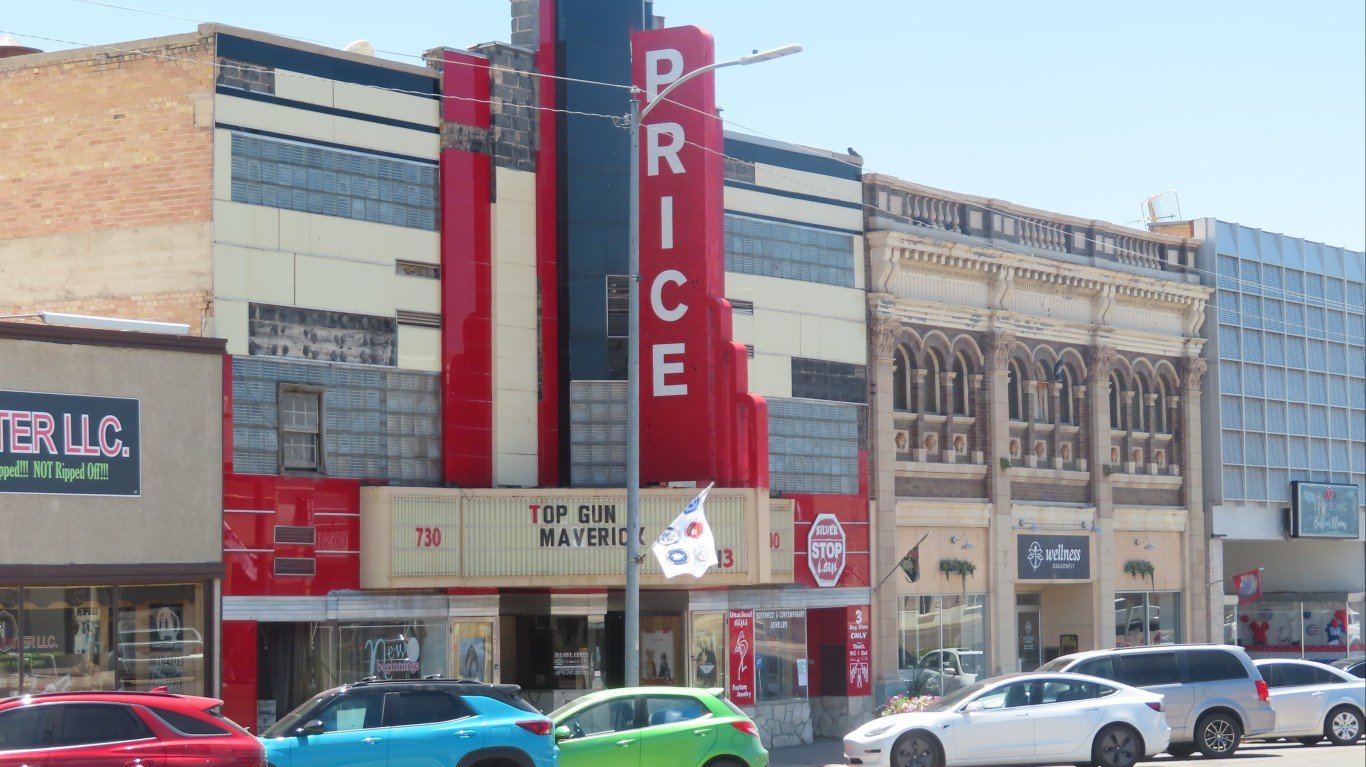
Utah: Price
> Poverty rate: 17.1% (state: 8.8%)
> Median home value: $153,700 (state: $339,700)
> Median household income: $45,429 (state: $79,133)
> Drug-induced mortality: 32.5 deaths per 100,000 (state: 20.1 per 100,000)
> Total population: 8,192

Vermont: Barre
> Poverty rate: 23.7% (state: 10.5%)
> Median home value: $157,700 (state: $240,600)
> Median household income: $44,298 (state: $67,674)
> Drug-induced mortality: 35.1 deaths per 100,000 (state: 31.9 per 100,000)
> Total population: 8,514

Virginia: Bellwood
> Poverty rate: 20.4% (state: 9.9%)
> Median home value: $153,100 (state: $295,500)
> Median household income: $44,872 (state: $80,615)
> Drug-induced mortality: 31.2 deaths per 100,000 (state: 25.8 per 100,000)
> Total population: 8,138

Washington: Kelso
> Poverty rate: 21.1% (state: 10.0%)
> Median home value: $201,800 (state: $397,600)
> Median household income: $51,203 (state: $82,400)
> Drug-induced mortality: 29.1 deaths per 100,000 (state: 25.1 per 100,000)
> Total population: 12,566

West Virginia: Bluefield
> Poverty rate: 20.6% (state: 16.9%)
> Median home value: $78,100 (state: $128,800)
> Median household income: $39,677 (state: $50,884)
> Drug-induced mortality: 109.0 deaths per 100,000 (state: 72.9 per 100,000)
> Total population: 9,699

Wisconsin: Two Rivers
> Poverty rate: 9.0% (state: 10.7%)
> Median home value: $96,800 (state: $200,400)
> Median household income: $54,544 (state: $67,080)
> Drug-induced mortality: 20.9 deaths per 100,000 (state: 26.2 per 100,000)
> Total population: 11,276

Wyoming: Riverton
> Poverty rate: 13.5% (state: 10.7%)
> Median home value: $167,900 (state: $237,900)
> Median household income: $51,565 (state: $68,002)
> Drug-induced mortality: 39.0 deaths per 100,000 (state: 17.6 per 100,000)
> Total population: 10,619
Methodology:
To identify the worst cities to live in every state, 24/7 Wall St. created a weighted index of 22 measures across three categories: economy, quality of life, and community.
The economy category consists of seven measures:
- Employment growth from 2016 to 2021, included at full weight
- Annual unemployment rate, included at full weight
- Median household income, included at full weight
- Poverty rate, included at full weight
- Percentage of the population 25 years and over with bachelor’s degree or higher, included at full weight
- Median home value, included at full weight
- Median real estate taxes as percentage of median home value, included at full weight
The quality of life category consists of 11 measures:
- Percentage of commuting workers 16 and over took public transportation, walked, or took other means to work, included at full weight
- Percentage of workers 16 years and over who worked in their place of residence, included at full weight
- Mean travel time to work, included at half-weight
- Average hospital 30-day readmission rate, included at half-weight
- Average hospital mortality rate for heart attack, CABG surgery, COPD, heart failure, neumonia, and stroke, included at half-weight
- Distance to nearest hospital, included at half-weight
- Percentage of the population in urban census tracts at least 1 mile from a grocery store and in rural census tracts at least 10 miles from a grocery store, included at half-weight
- Annual crude drug-induced mortality rate per 100,000 residents, included at half-weight
- Rate of hospital stays for ambulatory-care sensitive conditions per 100,000 Medicare enrollees, included at half-weight
- Violent crimes per 100,000 residents, included at full weight
- Property crimes per 100,000 residents, included at full weight
The community category consists of four measures:
- Population with access to exercise opportunities, included at full weight
- Motion picture theaters (except drive-ins), libraries and archives, theater companies and dinner theaters, sports teams and clubs, museums, zoos and botanical gardens, nature parks and other similar institutions, golf courses and country clubs, and marinas per 10,000 establishments, included at full weight
- Drinking places (alcoholic beverages) per 10,000 establishments, included at full weight
- Restaurants and other eating places per 10,000 establishments, included at full weight
Data on population, employment, unemployment, median home value, median household income, median property taxes paid, commuter characteristics, average travel time to work, and poverty came from the U.S. Census Bureau’s American Community Survey and are five-year estimates for the period 2017 to 2021. Employment data used to calculate five-year employment growth are five-year estimates for the years 2012 to 2016.
Data on the share of the population in urban census tracts or areas at least 1 mile from a grocery store and in rural census tracts at least 10 miles from a grocery store, a measure of poor food access, came from the U.S. Department of Agriculture’s 2021 update to the Food Access Research Atlas and is at the county level.
Data on hospital locations came from the Centers for Medicare & Medicaid Services. Data on 30-day readmission rates and 30-day mortality rates also came from the CMS and are for the period July 2019 to June 2022. Data was aggregated to the city level for cities with at least one hospital, and was aggregated to the county level for cities with no hospitals. Data on the number of drug-related deaths per 100,000 residents per year for the period 2019 to 2021 is from the Centers for Disease Control and Prevention and is at the county level. Data on preventable hospitalizations per 1,000 Medicare enrollees and the percentage of the population with access to exercise opportunities came from the 2023 County Health Rankings and Roadmaps program, a collaboration between the Robert Wood Johnson Foundation and University of Wisconsin Population Health Institute, and is at the county level.
Data on the number of violent crimes and property crimes reported per 100,000 residents came from the FBI’s Uniform Crime Reporting Program and are for the year 2020.
Data on the number of motion picture theaters (except drive-ins), libraries and archives, theater companies and dinner theaters, sports teams and clubs, museums, zoos and botanical gardens, nature parks and other similar institutions, golf courses and country clubs, marinas, drinking places, and restaurants came from the Census Bureau’s 2021 County Business Patterns series and is at the county level.
Our list includes cities, towns, villages, boroughs, and census-designated places. We did not include places with fewer than 8,000 residents in our analysis. Cities must also have data available for 15 of the 22 measures considered.
Editor’s note: In a previous version of this story, Webster, MA, a census-designated place, ranked as the worst place to live in Massachusetts. However, the Webster CDP is located within the broader town of Webster, which ranks more favorably within the state. To avoid conflation between the greater town and the CDP subsection, Webster CDP was excluded from this analysis.
Contact [email protected] for any questions or corrections.