In an era of economic uncertainty, the U.S. job market remains resilient. After falling to 3.7% in November 2023, the national unemployment rate has been below 4% for 22 consecutive months, the longest streak in over 50 years.
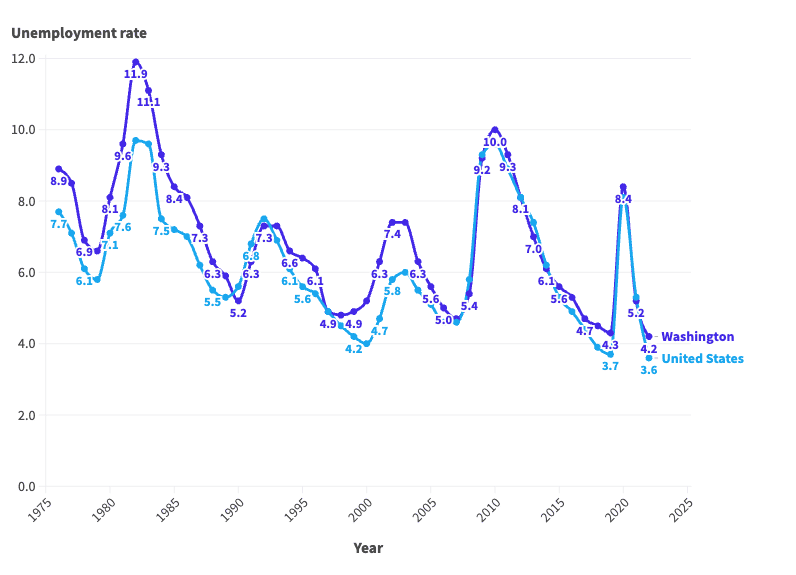
Of course, if history is any guide, much of the economy is subject to boom and bust cycles — and the job market is no exception. Since the mid-1970s, the average annual unemployment rate in the U.S. has fluctuated between 3.6% and nearly 10%, according to the Bureau of Labor Statistics.
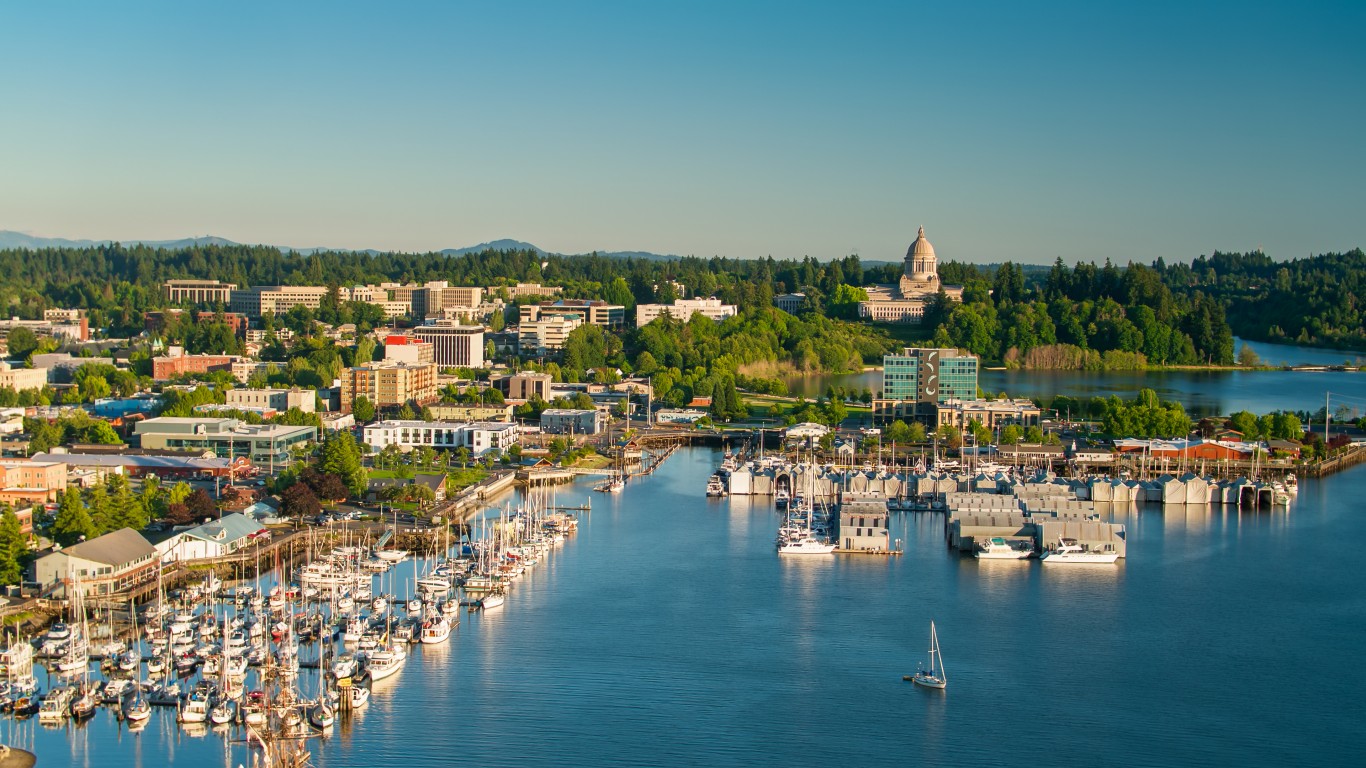
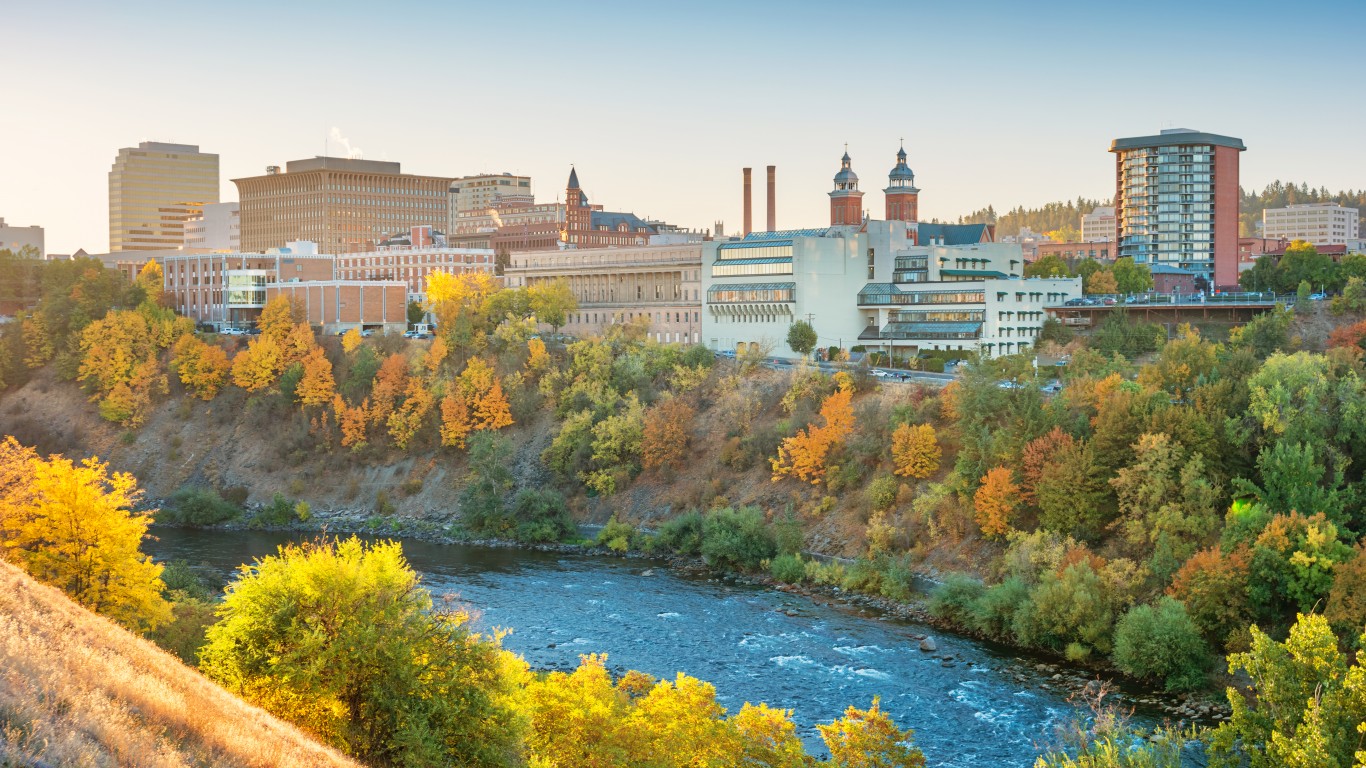
These same cyclical patterns are also evident in Washington, where the job market is supported largely by the professional and scientific and retail trade industries. The annual unemployment rate in the state was 4.2% in 2022, a multi-decade low. However, conditions for job seekers have not always been so favorable.
According to historical BLS data going back to 1976, the annual jobless rate has been as high as 11.9% in Washington. More than once, unemployment in the state has either matched or come close to that peak.
This is how Washington’s job market has changed in each of the last 47 years.
1976: 8.9%
- Avg. unemployment rate: 8.9% (7.7% nationwide)
- Labor force participation rate: 61.4% (61.6% nationwide)
- Unemployed population in Washington: 142,037
1977: 8.5%
- Avg. unemployment rate: 8.5% (7.1% nationwide)
- Labor force participation rate: 62.7% (62.3% nationwide)
- Unemployed population in Washington: 142,710
1978: 6.9%
- Avg. unemployment rate: 6.9% (6.1% nationwide)
- Labor force participation rate: 64.1% (63.2% nationwide)
- Unemployed population in Washington: 123,698
1979: 6.6%
- Avg. unemployment rate: 6.6% (5.8% nationwide)
- Labor force participation rate: 65.3% (63.7% nationwide)
- Unemployed population in Washington: 130,381
1980: 8.1%
- Avg. unemployment rate: 8.1% (7.1% nationwide)
- Labor force participation rate: 64.5% (63.8% nationwide)
- Unemployed population in Washington: 156,112
1981: 9.6%
- Avg. unemployment rate: 9.6% (7.6% nationwide)
- Labor force participation rate: 64.3% (63.9% nationwide)
- Unemployed population in Washington: 187,403
1982: 11.9%
- Avg. unemployment rate: 11.9% (9.7% nationwide)
- Labor force participation rate: 64.1% (64.0% nationwide)
- Unemployed population in Washington: 235,851
1983: 11.1%
- Avg. unemployment rate: 11.1% (9.6% nationwide)
- Labor force participation rate: 64.3% (64.0% nationwide)
- Unemployed population in Washington: 228,865
1984: 9.3%
- Avg. unemployment rate: 9.3% (7.5% nationwide)
- Labor force participation rate: 64.4% (64.4% nationwide)
- Unemployed population in Washington: 193,051
1985: 8.4%
- Avg. unemployment rate: 8.4% (7.2% nationwide)
- Labor force participation rate: 64.7% (64.8% nationwide)
- Unemployed population in Washington: 173,797
1986: 8.1%
- Avg. unemployment rate: 8.1% (7.0% nationwide)
- Labor force participation rate: 65.6% (65.3% nationwide)
- Unemployed population in Washington: 176,980
1987: 7.3%
- Avg. unemployment rate: 7.3% (6.2% nationwide)
- Labor force participation rate: 66.5% (65.6% nationwide)
- Unemployed population in Washington: 164,862
1988: 6.3%
- Avg. unemployment rate: 6.3% (5.5% nationwide)
- Labor force participation rate: 67.1% (65.9% nationwide)
- Unemployed population in Washington: 146,110
1989: 5.9%
- Avg. unemployment rate: 5.9% (5.3% nationwide)
- Labor force participation rate: 68.9% (66.5% nationwide)
- Unemployed population in Washington: 145,129
1990: 5.2%
- Avg. unemployment rate: 5.2% (5.6% nationwide)
- Labor force participation rate: 68.6% (66.5% nationwide)
- Unemployed population in Washington: 129,580
1991: 6.3%
- Avg. unemployment rate: 6.3% (6.8% nationwide)
- Labor force participation rate: 68.0% (66.2% nationwide)
- Unemployed population in Washington: 156,004
1992: 7.3%
- Avg. unemployment rate: 7.3% (7.5% nationwide)
- Labor force participation rate: 68.6% (66.4% nationwide)
- Unemployed population in Washington: 190,334
1993: 7.3%
- Avg. unemployment rate: 7.3% (6.9% nationwide)
- Labor force participation rate: 68.3% (66.3% nationwide)
- Unemployed population in Washington: 196,376
1994: 6.6%
- Avg. unemployment rate: 6.6% (6.1% nationwide)
- Labor force participation rate: 67.9% (66.6% nationwide)
- Unemployed population in Washington: 172,578
1995: 6.4%
- Avg. unemployment rate: 6.4% (5.6% nationwide)
- Labor force participation rate: 68.1% (66.6% nationwide)
- Unemployed population in Washington: 174,883
1996: 6.1%
- Avg. unemployment rate: 6.1% (5.4% nationwide)
- Labor force participation rate: 69.0% (66.8% nationwide)
- Unemployed population in Washington: 171,201
1997: 4.9%
- Avg. unemployment rate: 4.9% (4.9% nationwide)
- Labor force participation rate: 69.5% (67.1% nationwide)
- Unemployed population in Washington: 145,985
1998: 4.8%
- Avg. unemployment rate: 4.8% (4.5% nationwide)
- Labor force participation rate: 69.7% (67.1% nationwide)
- Unemployed population in Washington: 146,536
1999: 4.9%
- Avg. unemployment rate: 4.9% (4.2% nationwide)
- Labor force participation rate: 69.5% (67.1% nationwide)
- Unemployed population in Washington: 147,241
2000: 5.2%
- Avg. unemployment rate: 5.2% (4.0% nationwide)
- Labor force participation rate: 69.1% (67.1% nationwide)
- Unemployed population in Washington: 157,856
2001: 6.3%
- Avg. unemployment rate: 6.3% (4.7% nationwide)
- Labor force participation rate: 68.1% (66.8% nationwide)
- Unemployed population in Washington: 185,301
2002: 7.4%
- Avg. unemployment rate: 7.4% (5.8% nationwide)
- Labor force participation rate: 67.4% (66.6% nationwide)
- Unemployed population in Washington: 219,675
2003: 7.4%
- Avg. unemployment rate: 7.4% (6.0% nationwide)
- Labor force participation rate: 67.3% (66.2% nationwide)
- Unemployed population in Washington: 226,245
2004: 6.3%
- Avg. unemployment rate: 6.3% (5.5% nationwide)
- Labor force participation rate: 67.3% (66.0% nationwide)
- Unemployed population in Washington: 201,073
2005: 5.6%
- Avg. unemployment rate: 5.6% (5.1% nationwide)
- Labor force participation rate: 67.7% (66.0% nationwide)
- Unemployed population in Washington: 182,714
2006: 5.0%
- Avg. unemployment rate: 5.0% (4.6% nationwide)
- Labor force participation rate: 67.7% (66.2% nationwide)
- Unemployed population in Washington: 165,704
2007: 4.7%
- Avg. unemployment rate: 4.7% (4.6% nationwide)
- Labor force participation rate: 68.0% (66.0% nationwide)
- Unemployed population in Washington: 156,610
2008: 5.4%
- Avg. unemployment rate: 5.4% (5.8% nationwide)
- Labor force participation rate: 68.3% (66.0% nationwide)
- Unemployed population in Washington: 182,379
2009: 9.2%
- Avg. unemployment rate: 9.2% (9.3% nationwide)
- Labor force participation rate: 66.9% (65.4% nationwide)
- Unemployed population in Washington: 286,984
2010: 10.0%
- Avg. unemployment rate: 10.0% (9.6% nationwide)
- Labor force participation rate: 65.9% (64.7% nationwide)
- Unemployed population in Washington: 316,342
2011: 9.3%
- Avg. unemployment rate: 9.3% (8.9% nationwide)
- Labor force participation rate: 64.7% (64.1% nationwide)
- Unemployed population in Washington: 293,412
2012: 8.1%
- Avg. unemployment rate: 8.1% (8.1% nationwide)
- Labor force participation rate: 64.5% (63.7% nationwide)
- Unemployed population in Washington: 265,444
2013: 7.0%
- Avg. unemployment rate: 7.0% (7.4% nationwide)
- Labor force participation rate: 63.6% (63.2% nationwide)
- Unemployed population in Washington: 229,825
2014: 6.1%
- Avg. unemployment rate: 6.1% (6.2% nationwide)
- Labor force participation rate: 63.3% (62.9% nationwide)
- Unemployed population in Washington: 207,249
2015: 5.6%
- Avg. unemployment rate: 5.6% (5.3% nationwide)
- Labor force participation rate: 63.3% (62.7% nationwide)
- Unemployed population in Washington: 193,577
2016: 5.3%
- Avg. unemployment rate: 5.3% (4.9% nationwide)
- Labor force participation rate: 63.7% (62.8% nationwide)
- Unemployed population in Washington: 189,031
2017: 4.7%
- Avg. unemployment rate: 4.7% (4.4% nationwide)
- Labor force participation rate: 63.7% (62.9% nationwide)
- Unemployed population in Washington: 172,929
2018: 4.5%
- Avg. unemployment rate: 4.5% (3.9% nationwide)
- Labor force participation rate: 64.2% (62.9% nationwide)
- Unemployed population in Washington: 168,546
2019: 4.3%
- Avg. unemployment rate: 4.3% (3.7% nationwide)
- Labor force participation rate: 65.2% (63.1% nationwide)
- Unemployed population in Washington: 166,916
2020: 8.4%
- Avg. unemployment rate: 8.4% (8.1% nationwide)
- Labor force participation rate: 64.3% (61.7% nationwide)
- Unemployed population in Washington: 332,714
2021: 5.2%
- Avg. unemployment rate: 5.2% (5.3% nationwide)
- Labor force participation rate: 63.2% (61.7% nationwide)
- Unemployed population in Washington: 203,002
2022: 4.2%
- Avg. unemployment rate: 4.2% (3.6% nationwide)
- Labor force participation rate: 64.1% (62.2% nationwide)
- Unemployed population in Washington: 168,024
| Year | Washington unemployment rate | U.S. unemployment rate | Unemployed population in Washington |
|---|---|---|---|
| 1976 | 8.9 | 7.7 | 142,037 |
| 1977 | 8.5 | 7.1 | 142,710 |
| 1978 | 6.9 | 6.1 | 123,698 |
| 1979 | 6.6 | 5.8 | 130,381 |
| 1980 | 8.1 | 7.1 | 156,112 |
| 1981 | 9.6 | 7.6 | 187,403 |
| 1982 | 11.9 | 9.7 | 235,851 |
| 1983 | 11.1 | 9.6 | 228,865 |
| 1984 | 9.3 | 7.5 | 193,051 |
| 1985 | 8.4 | 7.2 | 173,797 |
| 1986 | 8.1 | 7.0 | 176,980 |
| 1987 | 7.3 | 6.2 | 164,862 |
| 1988 | 6.3 | 5.5 | 146,110 |
| 1989 | 5.9 | 5.3 | 145,129 |
| 1990 | 5.2 | 5.6 | 129,580 |
| 1991 | 6.3 | 6.8 | 156,004 |
| 1992 | 7.3 | 7.5 | 190,334 |
| 1993 | 7.3 | 6.9 | 196,376 |
| 1994 | 6.6 | 6.1 | 172,578 |
| 1995 | 6.4 | 5.6 | 174,883 |
| 1996 | 6.1 | 5.4 | 171,201 |
| 1997 | 4.9 | 4.9 | 145,985 |
| 1998 | 4.8 | 4.5 | 146,536 |
| 1999 | 4.9 | 4.2 | 147,241 |
| 2000 | 5.2 | 4.0 | 157,856 |
| 2001 | 6.3 | 4.7 | 185,301 |
| 2002 | 7.4 | 5.8 | 219,675 |
| 2003 | 7.4 | 6.0 | 226,245 |
| 2004 | 6.3 | 5.5 | 201,073 |
| 2005 | 5.6 | 5.1 | 182,714 |
| 2006 | 5.0 | 4.6 | 165,704 |
| 2007 | 4.7 | 4.6 | 156,610 |
| 2008 | 5.4 | 5.8 | 182,379 |
| 2009 | 9.2 | 9.3 | 286,984 |
| 2010 | 10.0 | 9.6 | 316,342 |
| 2011 | 9.3 | 8.9 | 293,412 |
| 2012 | 8.1 | 8.1 | 265,444 |
| 2013 | 7.0 | 7.4 | 229,825 |
| 2014 | 6.1 | 6.2 | 207,249 |
| 2015 | 5.6 | 5.3 | 193,577 |
| 2016 | 5.3 | 4.9 | 189,031 |
| 2017 | 4.7 | 4.4 | 172,929 |
| 2018 | 4.5 | 3.9 | 168,546 |
| 2019 | 4.3 | 3.7 | 166,916 |
| 2020 | 8.4 | 8.1 | 332,714 |
| 2021 | 5.2 | 5.3 | 203,002 |
| 2022 | 4.2 | 3.6 | 168,024 |
Contact [email protected] for any questions or corrections.