In an era of economic uncertainty, the U.S. job market remains resilient. After falling to 3.7% in November 2023, the national unemployment rate has been below 4% for 22 consecutive months, the longest streak in over 50 years.
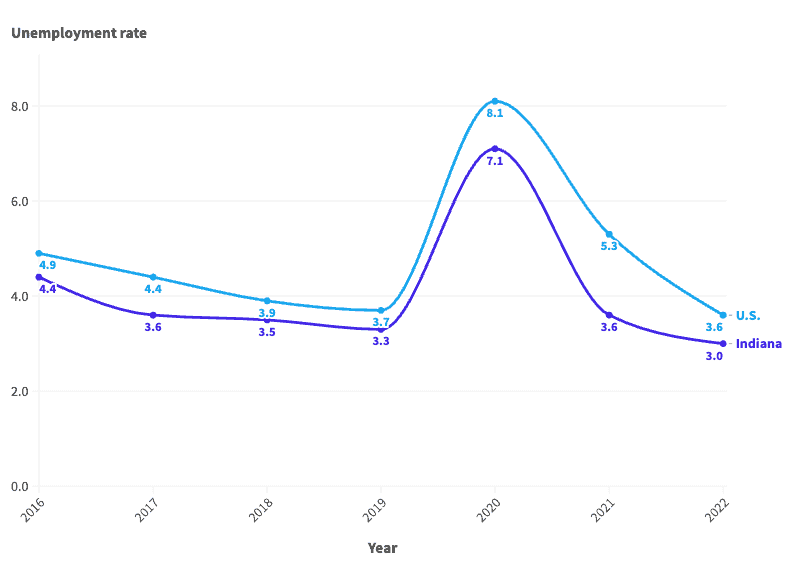
Of course, if history is any guide, much of the economy is subject to boom and bust cycles — and the job market is no exception. In the last seven years — a period that spanned three presidential administrations and included a global pandemic — the average annual unemployment rate in the U.S. has fluctuated between 3.6% and 8.1%, according to the Bureau of Labor Statistics.
These same cyclical patterns are also evident in Indiana, where the job market is supported largely by the manufacturing and retail trade industries. The annual unemployment rate in the state was 3.0% in 2022, a multi-decade low. However, conditions for job seekers have not always been so favorable.
According to BLS data going back to 2016, the year Donald Trump was elected president, the annual jobless rate has been as high as 7.1% in Indiana.
This is how Indiana’s job market has changed since 2016.
2016: 4.4% unemployment
- Avg. unemployment rate: 4.4% (4.9% nationwide)
- Labor force participation rate: 64.7% (62.8% nationwide)
- Unemployed population in Indiana: 145,401
2017: 3.6% unemployment

- Avg. unemployment rate: 3.6% (4.4% nationwide)
- Labor force participation rate: 64.2% (62.9% nationwide)
- Unemployed population in Indiana: 116,644
2018: 3.5% unemployment
- Avg. unemployment rate: 3.5% (3.9% nationwide)
- Labor force participation rate: 64.9% (62.9% nationwide)
- Unemployed population in Indiana: 115,774
2019: 3.3% unemployment
- Avg. unemployment rate: 3.3% (3.7% nationwide)
- Labor force participation rate: 64.7% (63.1% nationwide)
- Unemployed population in Indiana: 112,371
2020: 7.1% unemployment
- Avg. unemployment rate: 7.1% (8.1% nationwide)
- Labor force participation rate: 63.1% (61.7% nationwide)
- Unemployed population in Indiana: 243,638
2021: 3.6% unemployment
- Avg. unemployment rate: 3.6% (5.3% nationwide)
- Labor force participation rate: 62.9% (61.7% nationwide)
- Unemployed population in Indiana: 130,582
2022: 3.0% unemployment
- Avg. unemployment rate: 3.0% (3.6% nationwide)
- Labor force participation rate: 63.5% (62.2% nationwide)
- Unemployed population in Indiana: 101,811
| Year | Indiana unemployment rate (%) | U.S. unemployment rate (%) | Unemployed population in Indiana |
|---|---|---|---|
| 2016 | 4.4 | 4.9 | 145,401 |
| 2017 | 3.6 | 4.4 | 116,644 |
| 2018 | 3.5 | 3.9 | 115,774 |
| 2019 | 3.3 | 3.7 | 112,371 |
| 2020 | 7.1 | 8.1 | 243,638 |
| 2021 | 3.6 | 5.3 | 130,582 |
| 2022 | 3.0 | 3.6 | 101,811 |
Contact [email protected] for any questions or corrections.