Home prices have surged in the U.S. in recent years. Driven by rising demand and supply constraints during the pandemic, the median home sale price spiked by nearly 50% from the second quarter of 2020 to Q3 in 2022. While the sale price of a typical American home has fallen in recent months since, housing prices remain at historic highs.
Not only have home values soared, but borrowing costs for home buyers have also climbed. The average interest rate on a 30-year fixed mortgage has been above 6% since September 2022, a high not seen in nearly a decade and a half. In a market defined by high prices and high mortgage rates, homeownership has become prohibitively expensive for a large number of Americans.
Still, housing prices are also subject to a number of factors that can be isolated from broader, nationwide market trends — and location is one of them. Two homes that are virtually identical can vary in price by hundreds of thousands of dollars, depending on where they are. And for prospective homeowners on a budget, some Illinois cities are far more affordable than others.
According to five-year estimates from the U.S. Census Bureau’s 2022 American Community Survey, the typical home in Illinois is worth $239,100. But across the 41 cities, towns, and unincorporated communities in the state with populations of at least 40,000, median home values range from less than $100,000 to nearly $600,000.
In any local market, home prices are often a reflection of what residents can afford. In Illinois, many of the least expensive cities for homebuyers are not high-income areas. Of the 41 Illinois cities with available data from the ACS, 14 have a median home value that is less than the statewide median. In all but two of these places, the typical household earns less than the statewide median household income of $78,433. Similarly, most of Illinois’ more expensive housing markets have higher earning populations.
These are the cheapest and most expensive housing markets in Illinois.
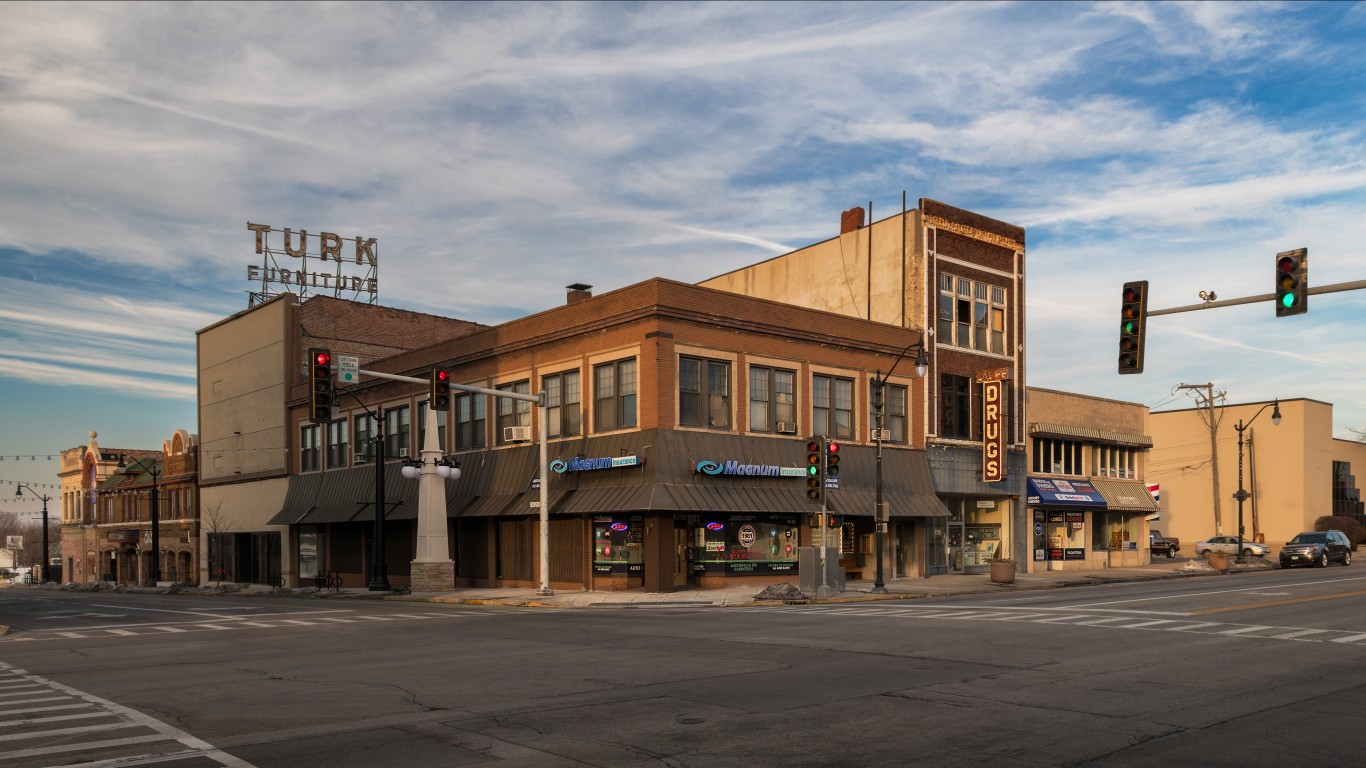
41. Decatur
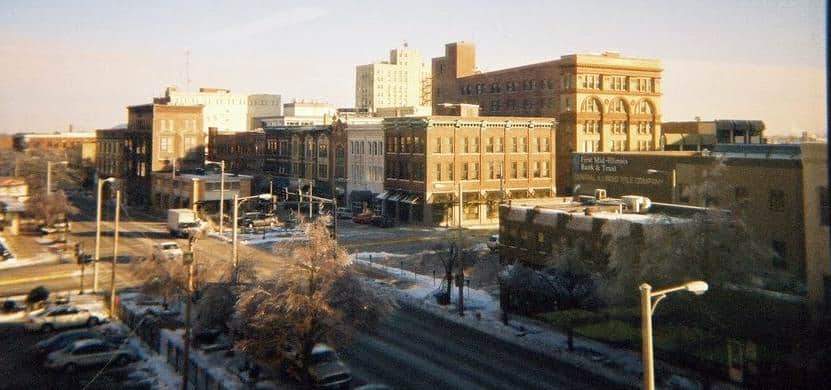
Source: Public Domain / Wikimedia Commons
- Median home value: $96,800
- Homes worth over $1 million: 0.4%
- Homeownership rate: 61.2%
- Median household income: $49,039
- Total population: 70,975
40. Rockford

Source: benkrut / iStock via Getty Images
- Median home value: $114,100
- Homes worth over $1 million: 0.2%
- Homeownership rate: 54.1%
- Median household income: $50,744
- Total population: 148,173
39. Belleville
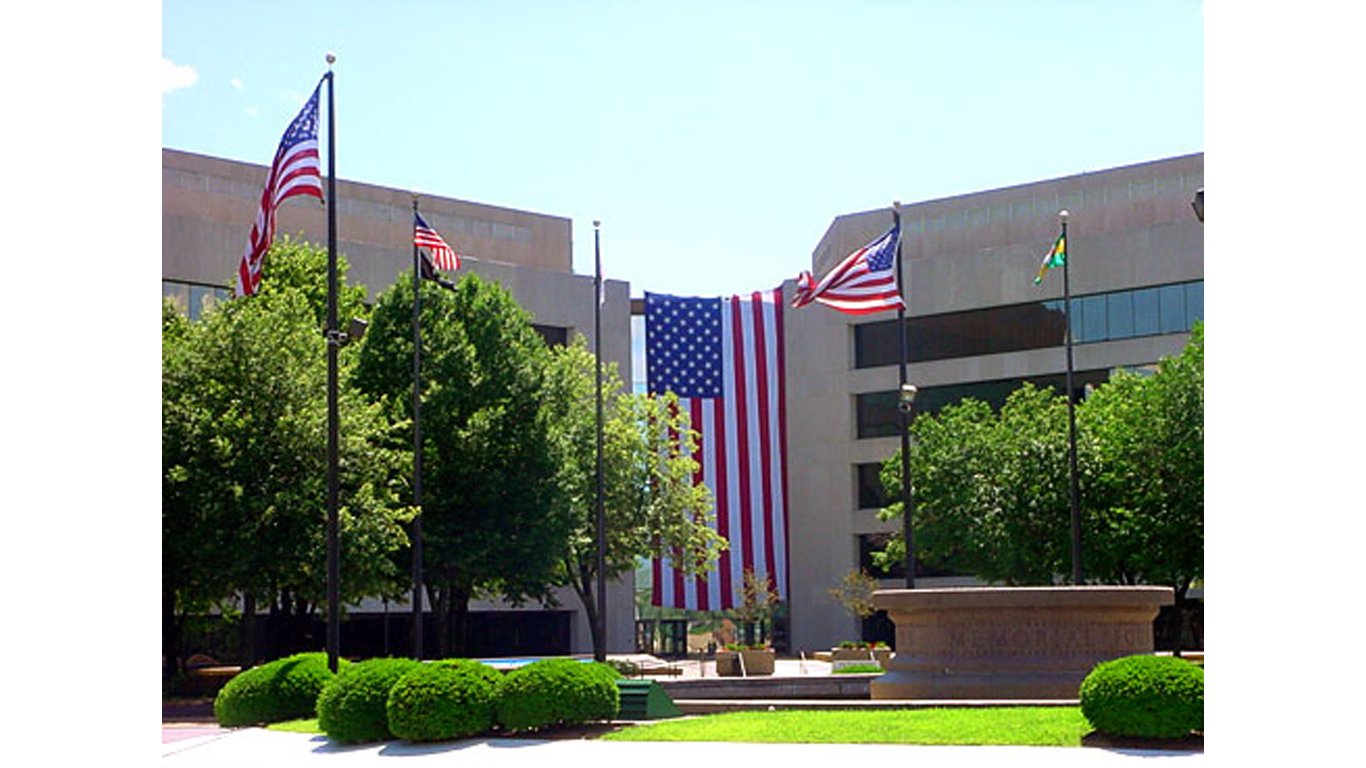
Source: Xing979 at English Wikipedia / Public Domain / Wikimedia Commons
- Median home value: $122,700
- Homes worth over $1 million: 0.2%
- Homeownership rate: 62.5%
- Median household income: $60,573
- Total population: 42,155
38. Moline

Source: rruntsch / iStock via Getty Images
- Median home value: $141,100
- Homes worth over $1 million: 0.2%
- Homeownership rate: 66.3%
- Median household income: $63,553
- Total population: 42,452
37. Peoria
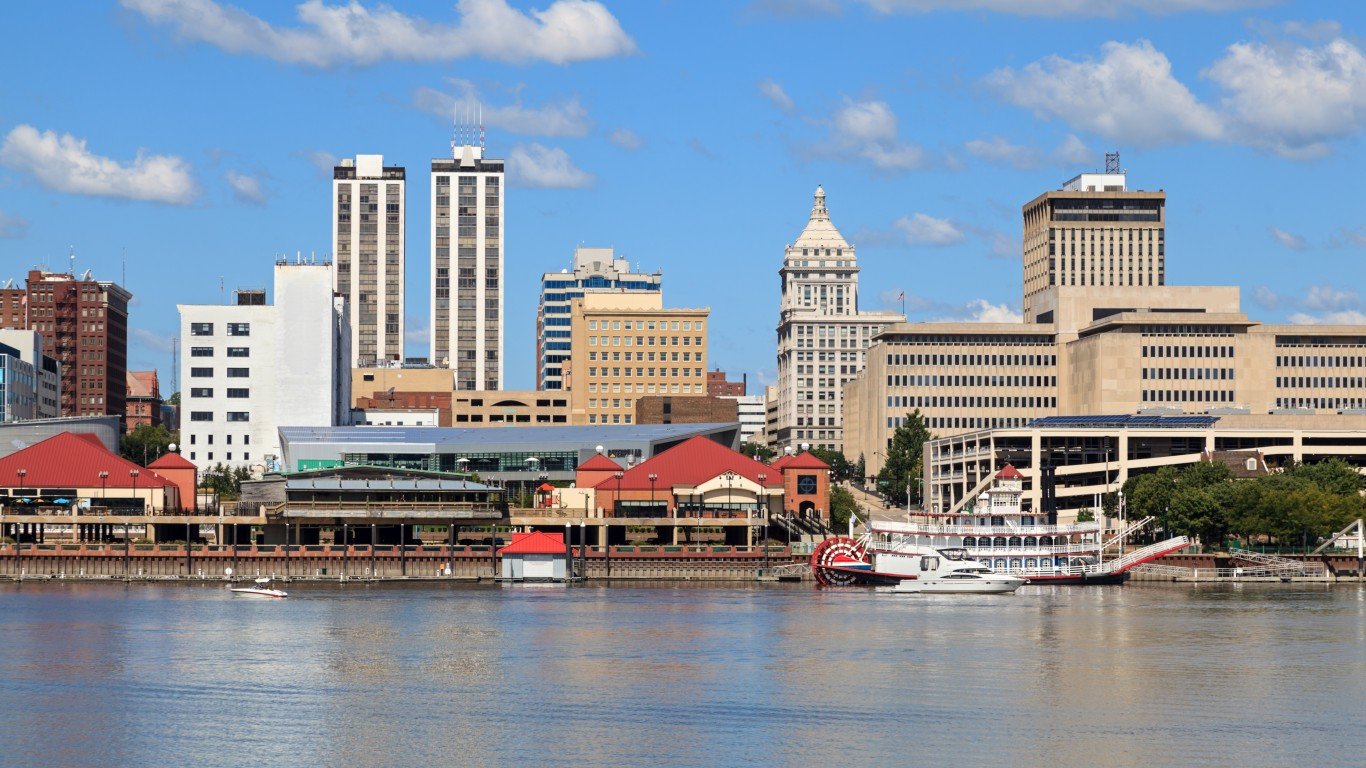
Source: ghornephoto / iStock via Getty Images
- Median home value: $146,700
- Homes worth over $1 million: 0.3%
- Homeownership rate: 56.3%
- Median household income: $58,068
- Total population: 113,054
36. Springfield

Source: fotoguy22 / iStock via Getty Images
- Median home value: $147,700
- Homes worth over $1 million: 0.6%
- Homeownership rate: 62.4%
- Median household income: $62,419
- Total population: 114,214
35. Waukegan
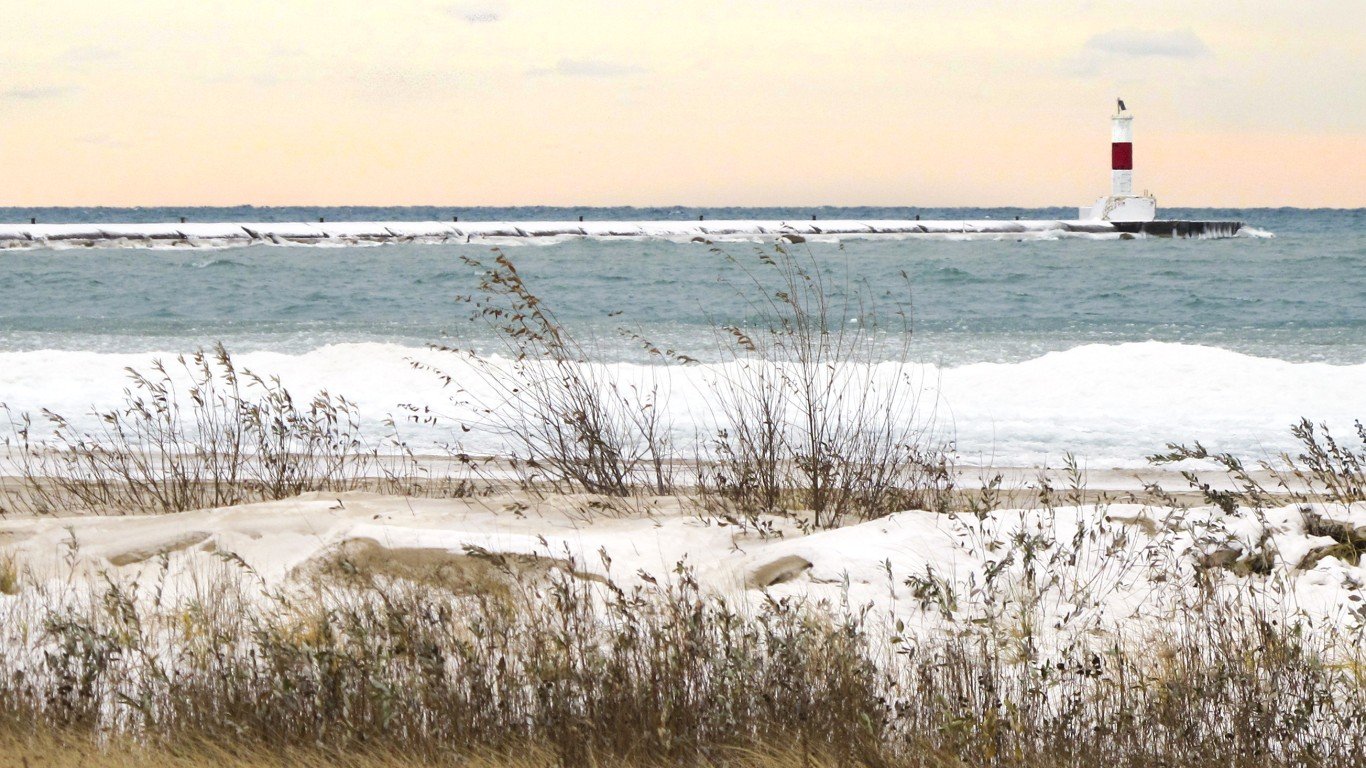
Source: patty_c / iStock via Getty Images
- Median home value: $164,400
- Homes worth over $1 million: 1.0%
- Homeownership rate: 48.9%
- Median household income: $66,077
- Total population: 89,435
34. Bloomington
Source: ghornephoto / iStock via Getty Images
- Median home value: $190,700
- Homes worth over $1 million: 0.0%
- Homeownership rate: 61.1%
- Median household income: $73,119
- Total population: 78,788
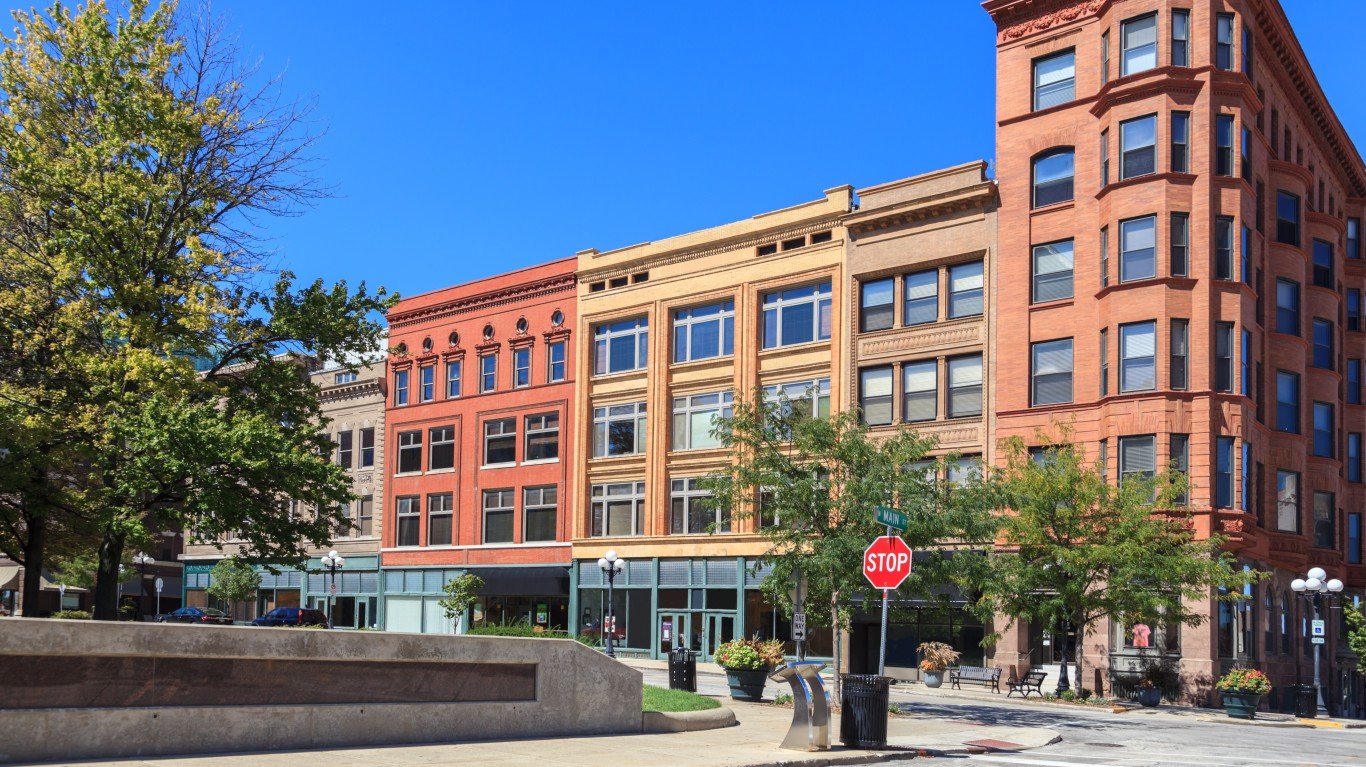
33. Champaign

Source: Michael Reaves / Getty Images Sport via Getty Images
- Median home value: $191,200
- Homes worth over $1 million: 0.2%
- Homeownership rate: 45.4%
- Median household income: $58,273
- Total population: 88,628
32. DeKalb
Source: benkrut / iStock via Getty Images
- Median home value: $192,200
- Homes worth over $1 million: 0.0%
- Homeownership rate: 42.1%
- Median household income: $47,410
- Total population: 40,697
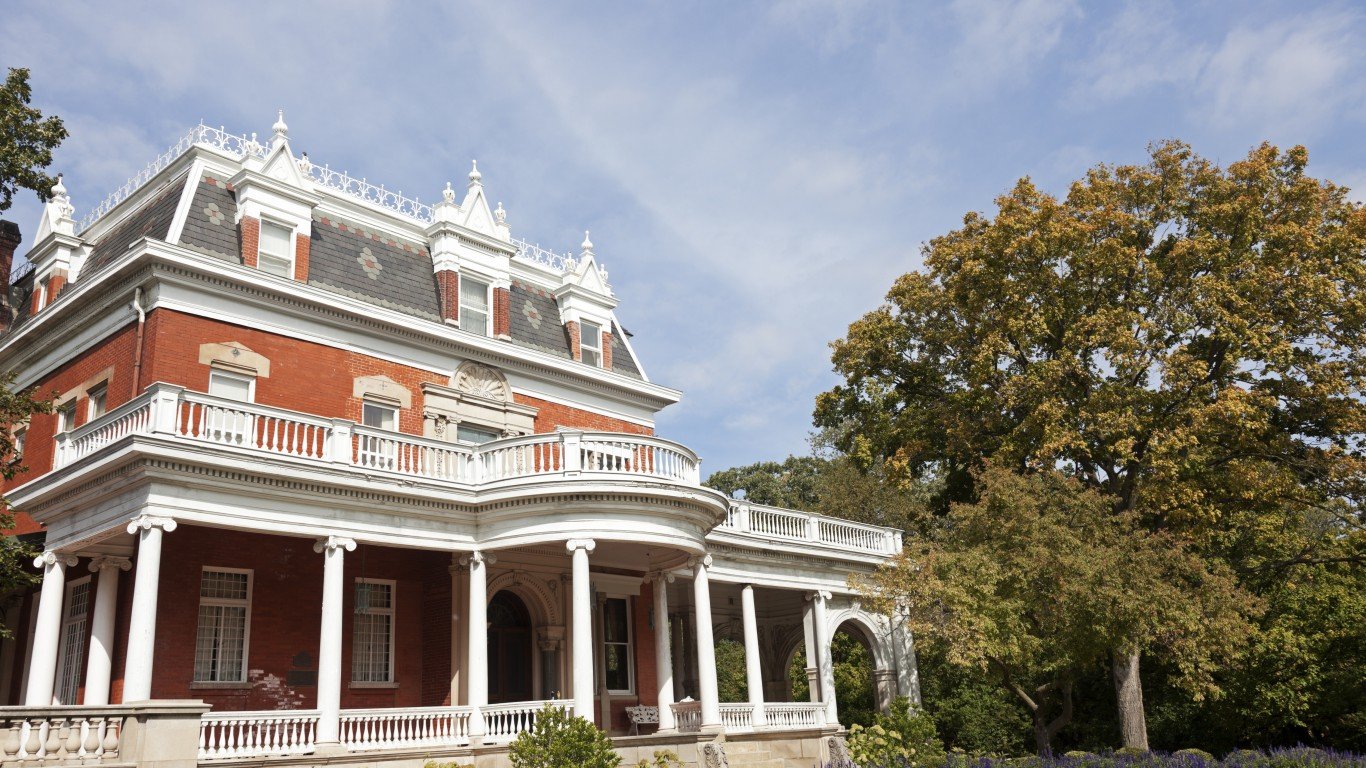
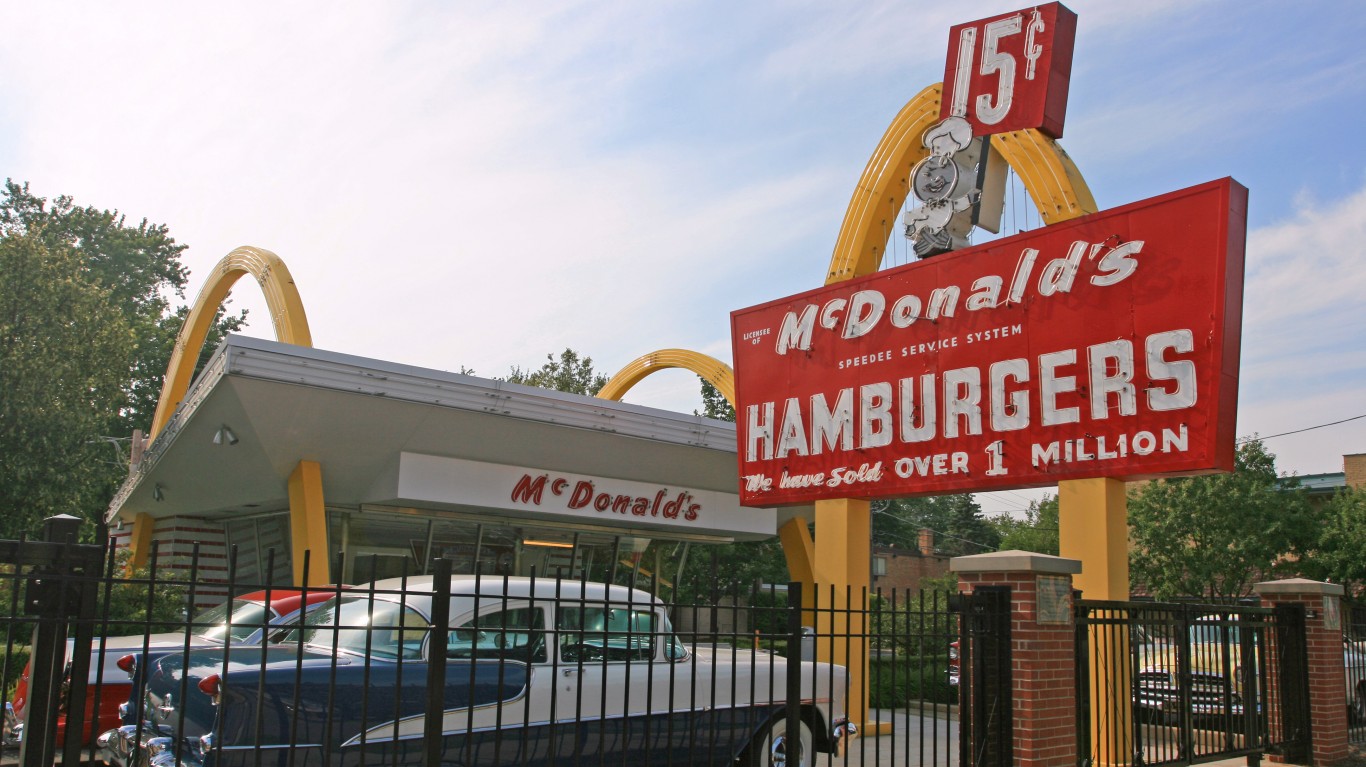
31. Normal
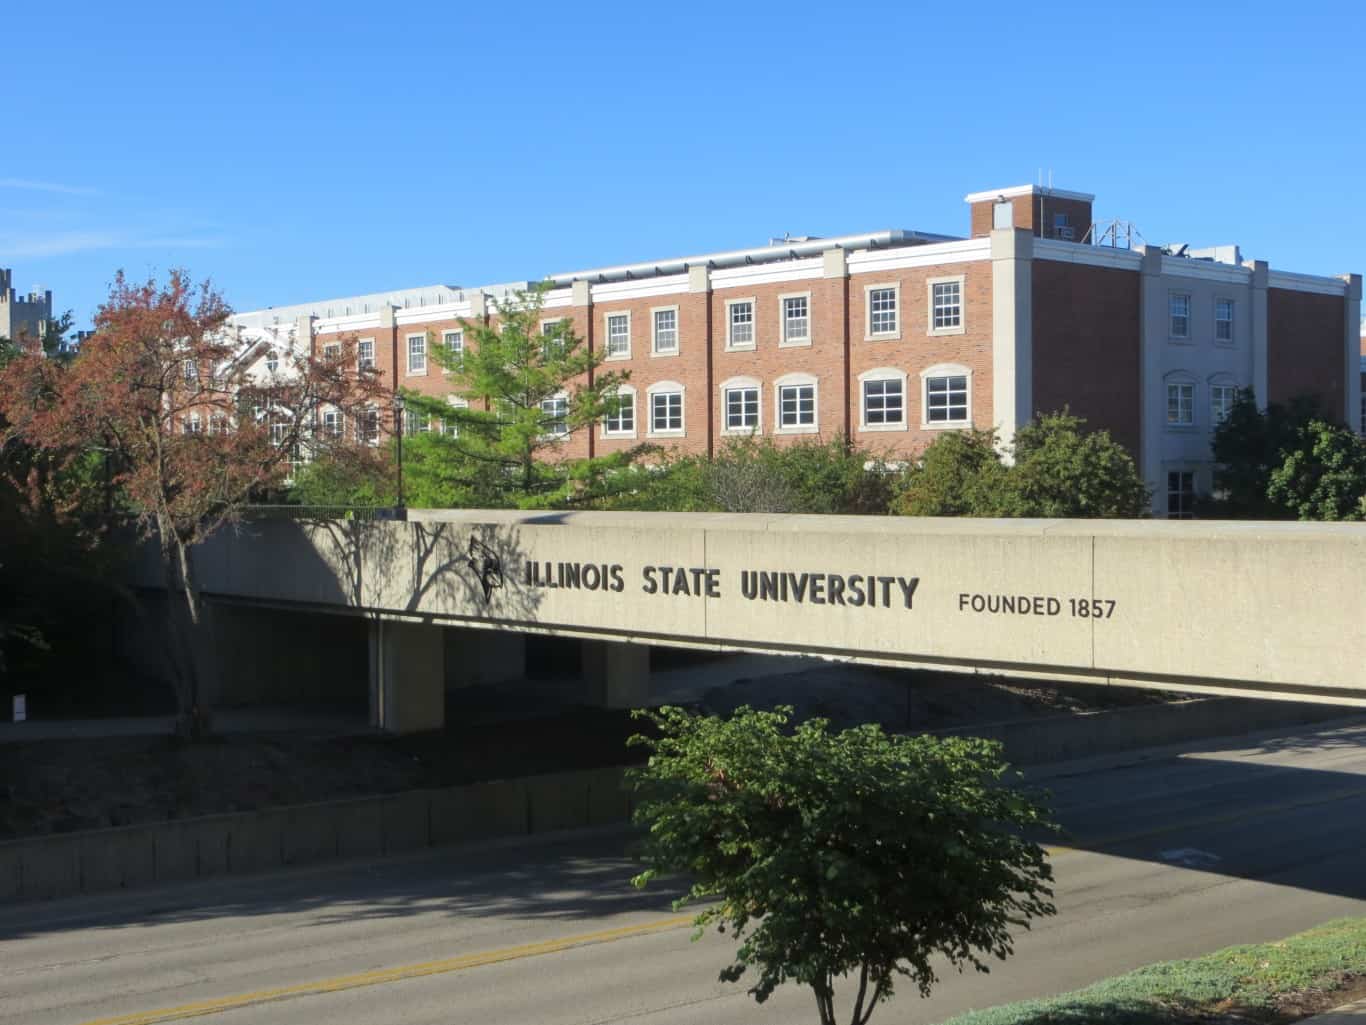
Source: davidwilson1949 / Flickr
- Median home value: $194,400
- Homes worth over $1 million: 0.6%
- Homeownership rate: 55.8%
- Median household income: $63,965
- Total population: 52,920
30. Cicero
Source: pom-angers / Flickr
- Median home value: $224,300
- Homes worth over $1 million: 0.2%
- Homeownership rate: 54.6%
- Median household income: $64,325
- Total population: 84,189
29. Joliet

Source: DenisTangneyJr / iStock via Getty Images
- Median home value: $233,800
- Homes worth over $1 million: 0.5%
- Homeownership rate: 72.4%
- Median household income: $84,971
- Total population: 150,221
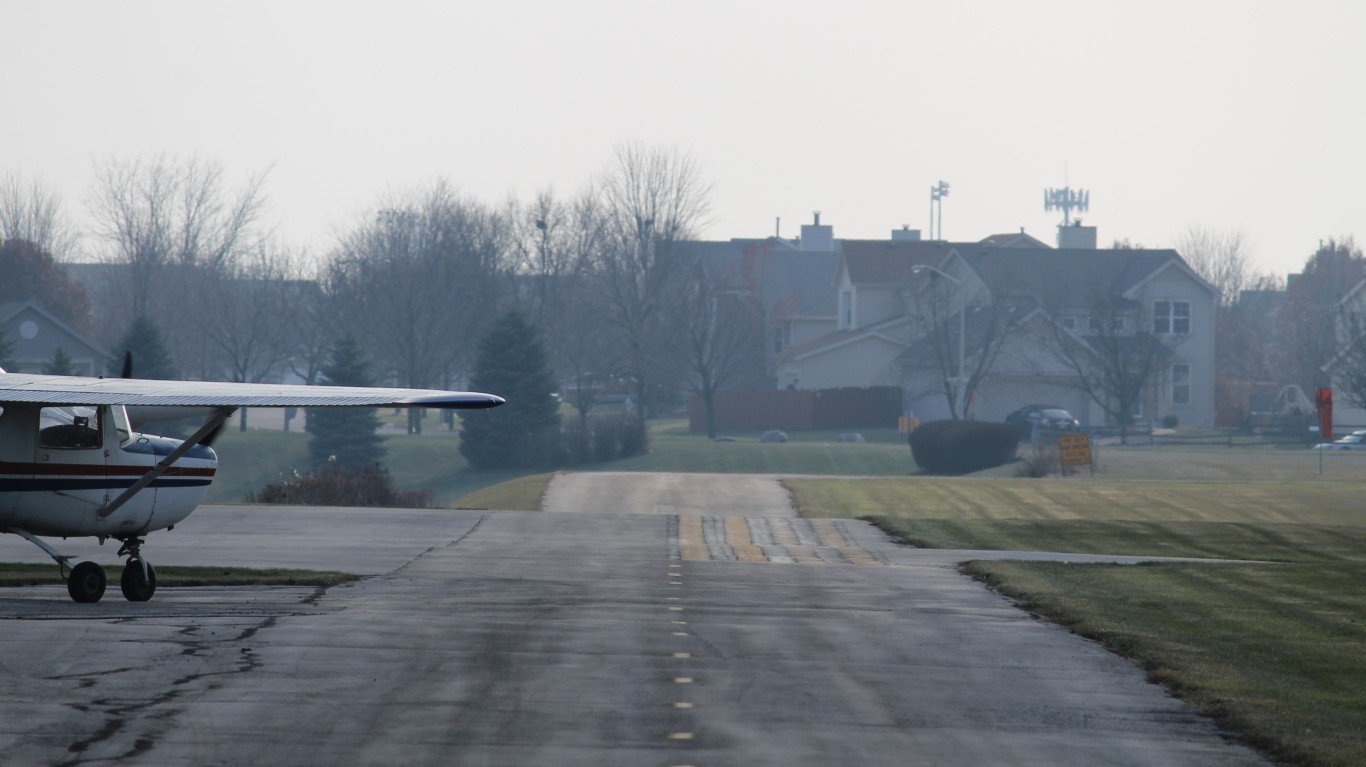
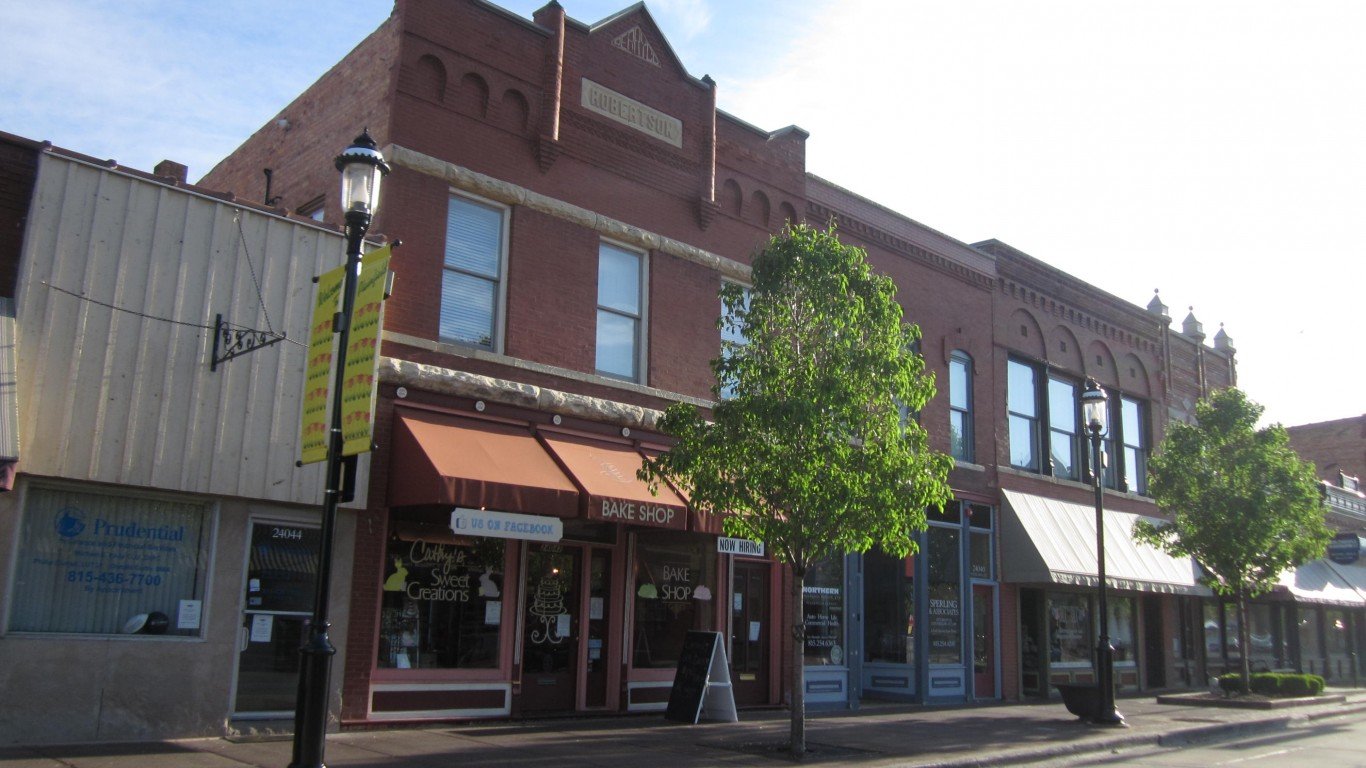
28. Romeoville
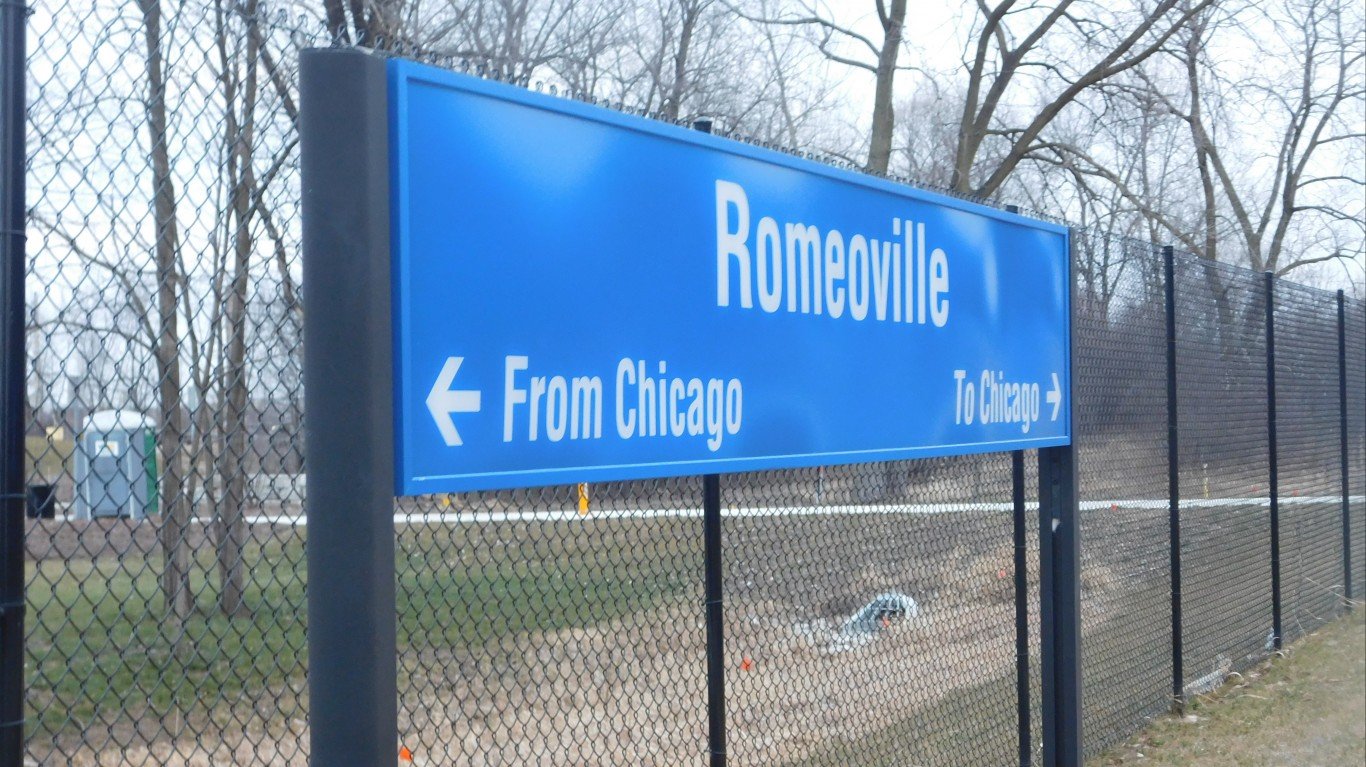
Source: roadgeek / Flickr
- Median home value: $233,900
- Homes worth over $1 million: 0.4%
- Homeownership rate: 83.8%
- Median household income: $96,409
- Total population: 40,132
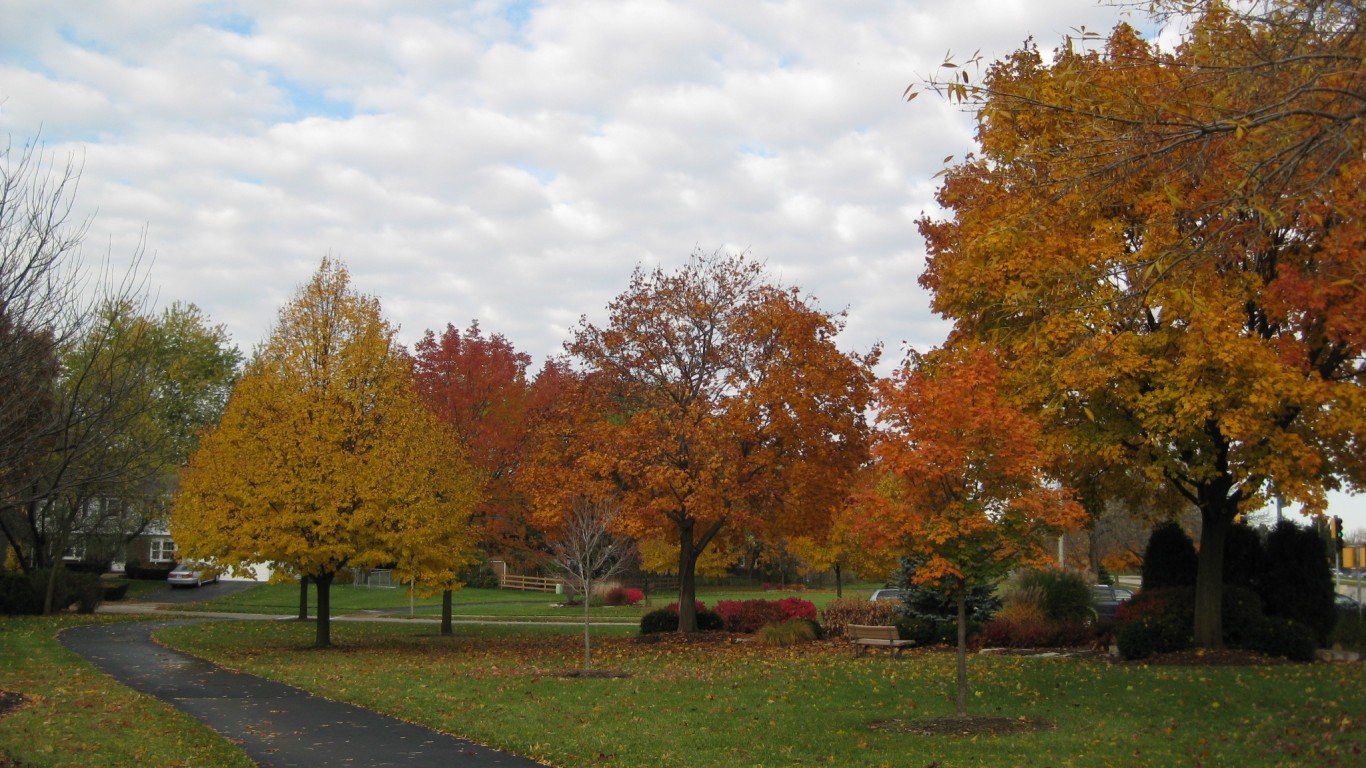
27. Aurora
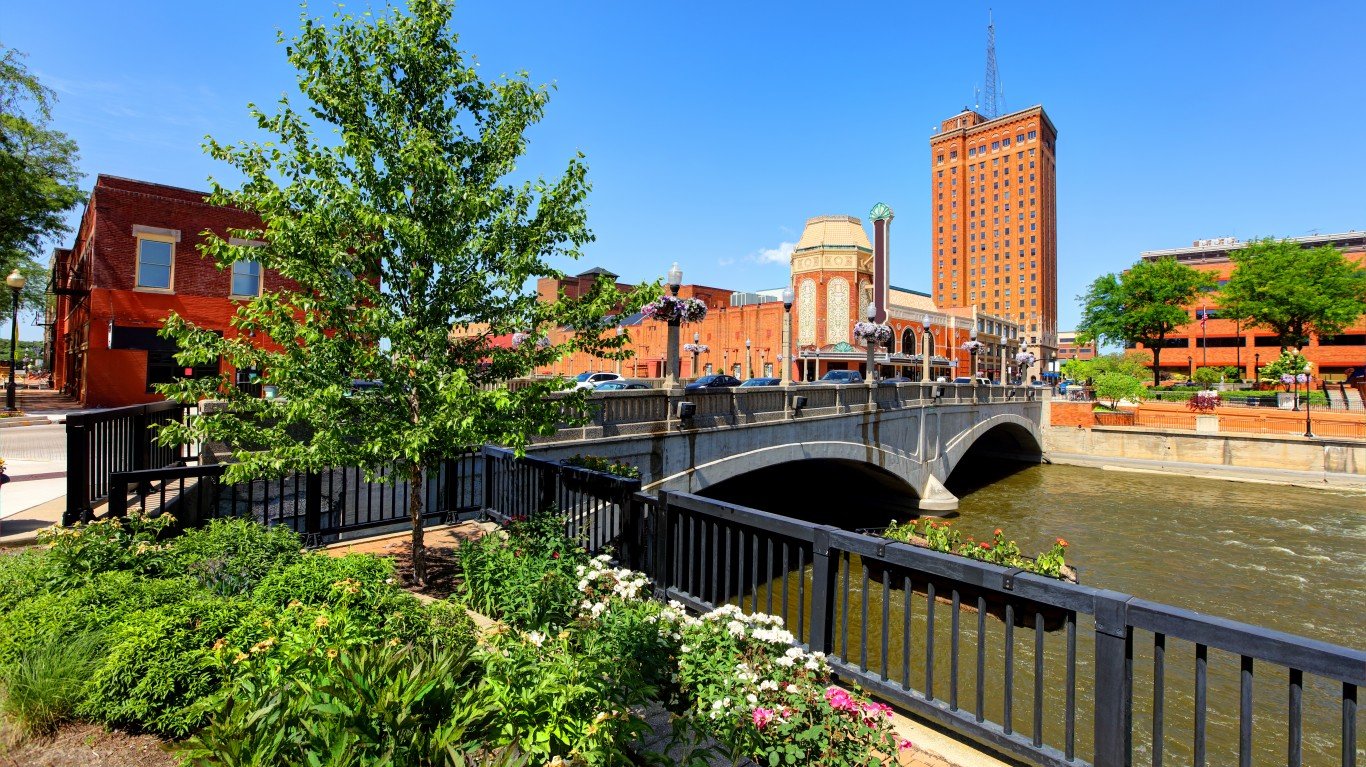
Source: DenisTangneyJr / iStock via Getty Images
- Median home value: $241,600
- Homes worth over $1 million: 0.8%
- Homeownership rate: 66.8%
- Median household income: $85,943
- Total population: 181,405
26. Elgin

Source: DenisTangneyJr / iStock via Getty Images
- Median home value: $242,500
- Homes worth over $1 million: 0.9%
- Homeownership rate: 71.2%
- Median household income: $85,998
- Total population: 114,190
25. Oak Lawn
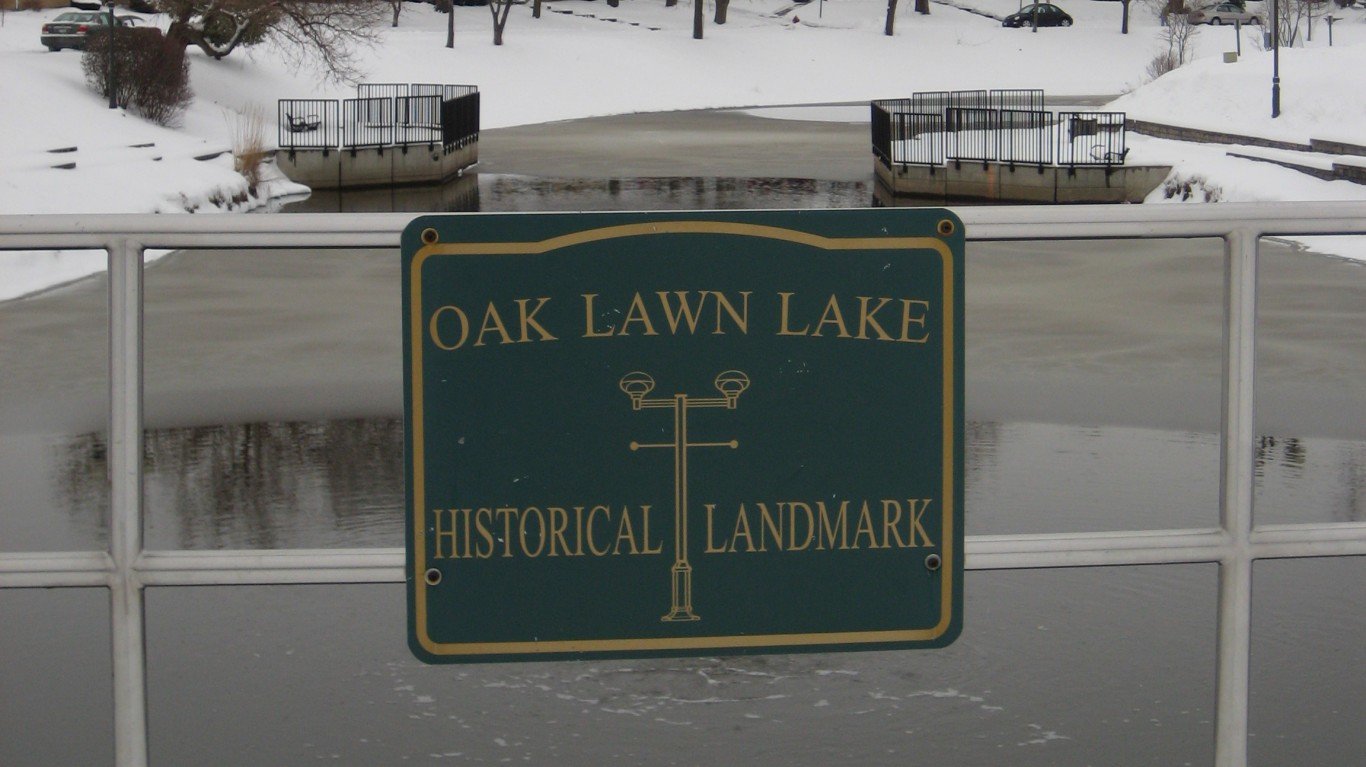
Source: oaklawnillinois / Flickr
- Median home value: $250,900
- Homes worth over $1 million: 0.2%
- Homeownership rate: 81.9%
- Median household income: $77,221
- Total population: 57,665
24. Crystal Lake
Source: Jacob Boomsma / iStock via Getty Images
- Median home value: $271,100
- Homes worth over $1 million: 0.3%
- Homeownership rate: 78.1%
- Median household income: $103,018
- Total population: 40,463
23. Berwyn
Source: davidwilson1949 / Flickr
- Median home value: $272,900
- Homes worth over $1 million: 0.6%
- Homeownership rate: 60.4%
- Median household income: $71,300
- Total population: 56,556
22. Bolingbrook
Source: vandervliet93 / Getty Images
- Median home value: $276,400
- Homes worth over $1 million: 0.8%
- Homeownership rate: 78.8%
- Median household income: $102,057
- Total population: 73,755
21. Tinley Park
Source: gnagel / iStock Editorial via Getty Images
- Median home value: $278,300
- Homes worth over $1 million: 0.8%
- Homeownership rate: 87.5%
- Median household income: $99,628
- Total population: 55,571
20. Schaumburg

Source: benkrut / Getty Images
- Median home value: $303,000
- Homes worth over $1 million: 0.4%
- Homeownership rate: 61.2%
- Median household income: $92,818
- Total population: 77,571
19. Des Plaines
Source: blanscape / iStock Editorial via Getty Images
- Median home value: $304,100
- Homes worth over $1 million: 0.4%
- Homeownership rate: 78.6%
- Median household income: $86,552
- Total population: 60,087
18. Chicago

Source: Sean Pavone / Shutterstock
- Median home value: $304,500
- Homes worth over $1 million: 5.6%
- Homeownership rate: 45.6%
- Median household income: $71,673
- Total population: 2,721,914
17. Lombard

- Median home value: $308,900
- Homes worth over $1 million: 0.3%
- Homeownership rate: 69.9%
- Median household income: $95,509
- Total population: 44,055
16. Hoffman Estates

- Median home value: $330,300
- Homes worth over $1 million: 0.5%
- Homeownership rate: 74.0%
- Median household income: $107,428
- Total population: 51,744
15. Bartlett
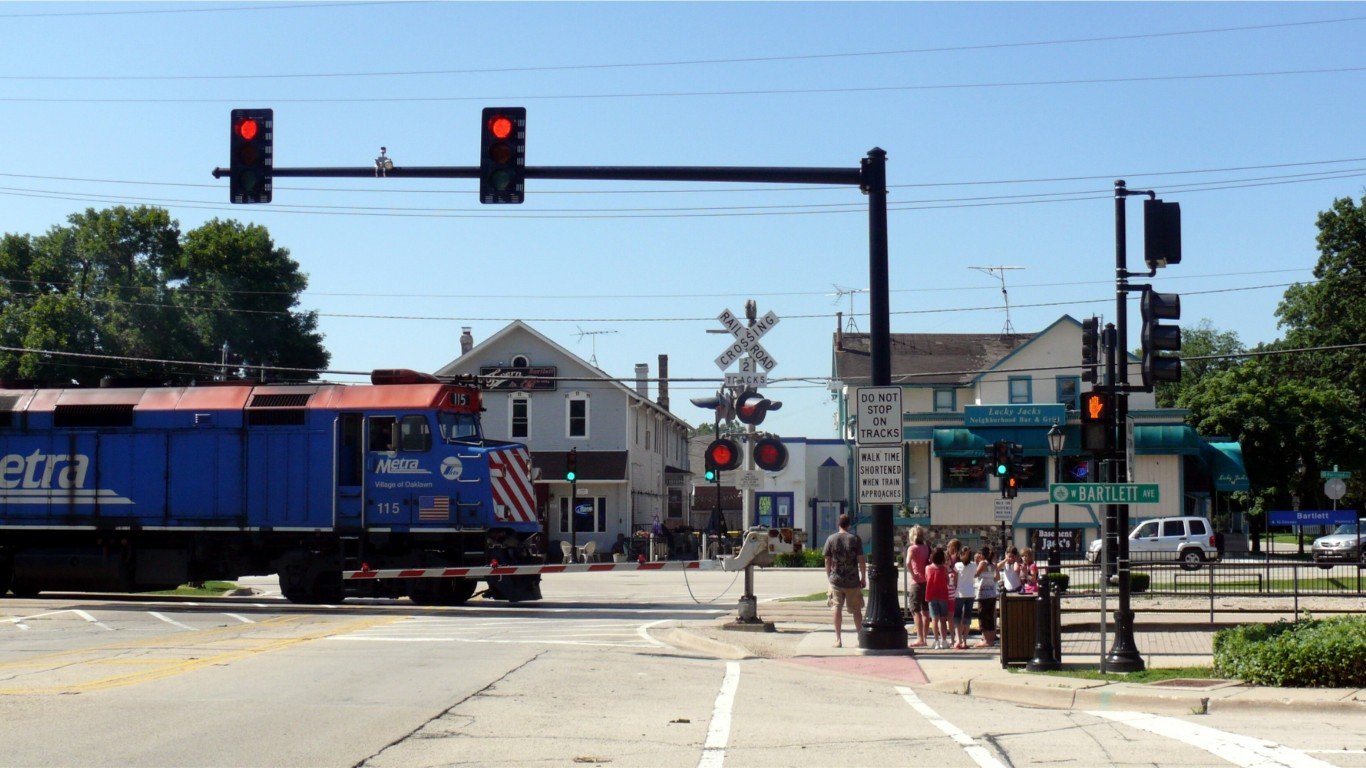
Source: davidwilson1949 / Flickr
- Median home value: $334,600
- Homes worth over $1 million: 0.2%
- Homeownership rate: 86.4%
- Median household income: $126,555
- Total population: 40,829
14. Palatine
Source: Mysterymanblue / Wikimedia Commons
- Median home value: $337,200
- Homes worth over $1 million: 0.3%
- Homeownership rate: 67.5%
- Median household income: $93,383
- Total population: 67,223
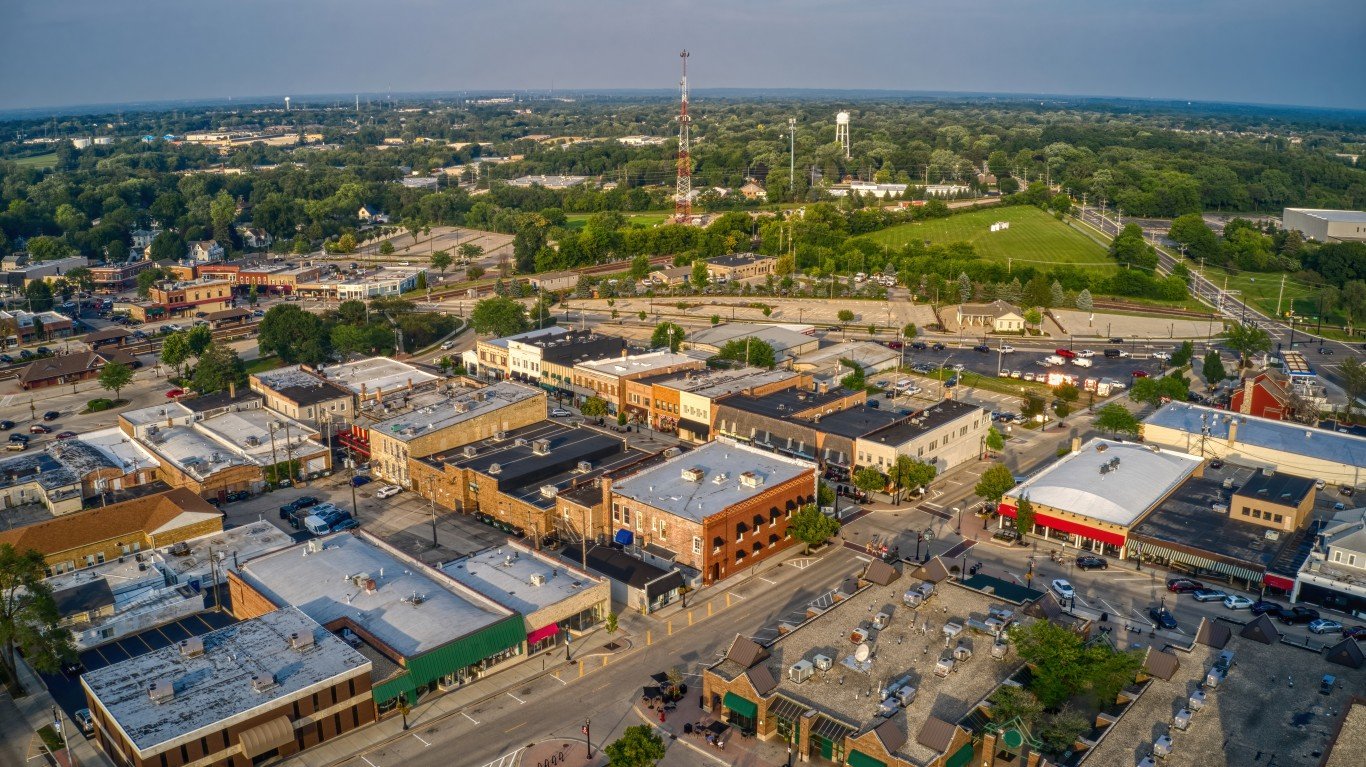
13. Orland Park
Source: roadgeek / Flickr
- Median home value: $337,800
- Homes worth over $1 million: 0.9%
- Homeownership rate: 85.9%
- Median household income: $97,365
- Total population: 58,345
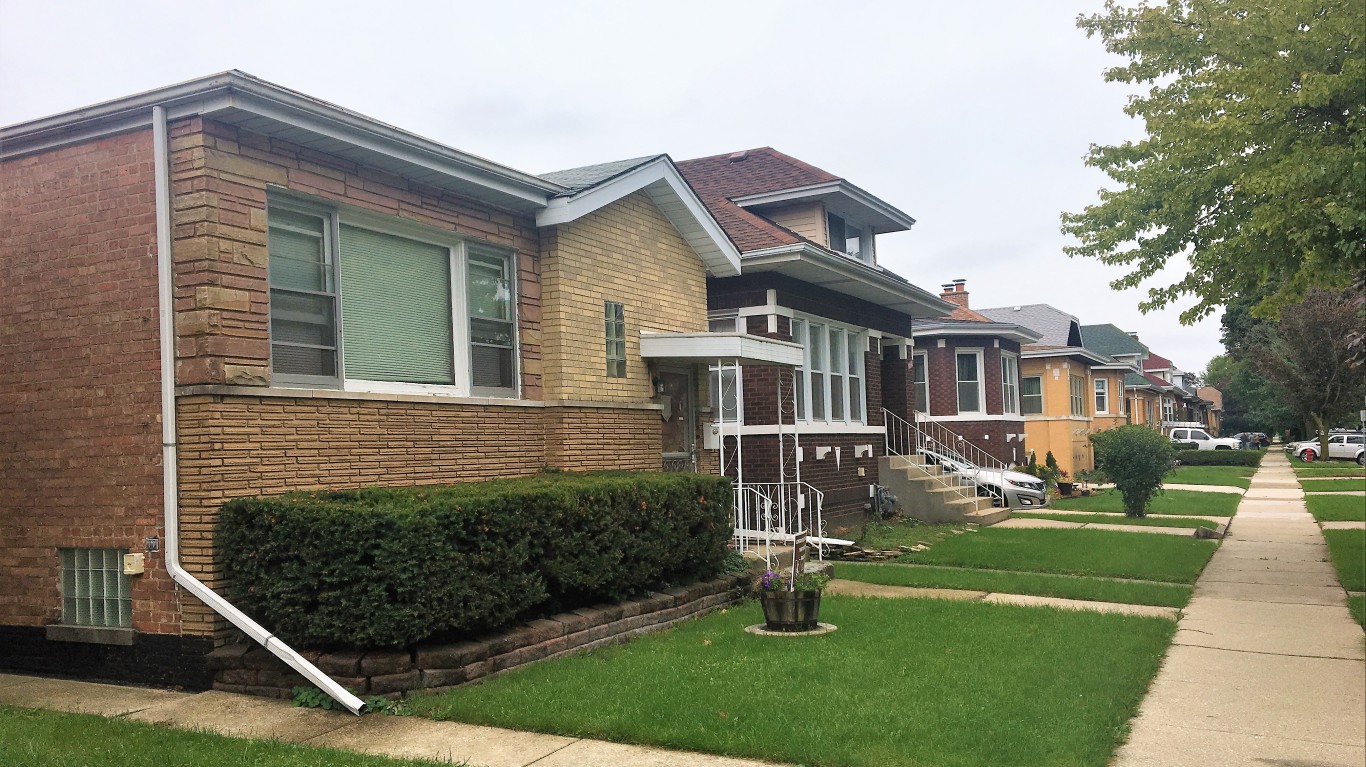
12. Skokie
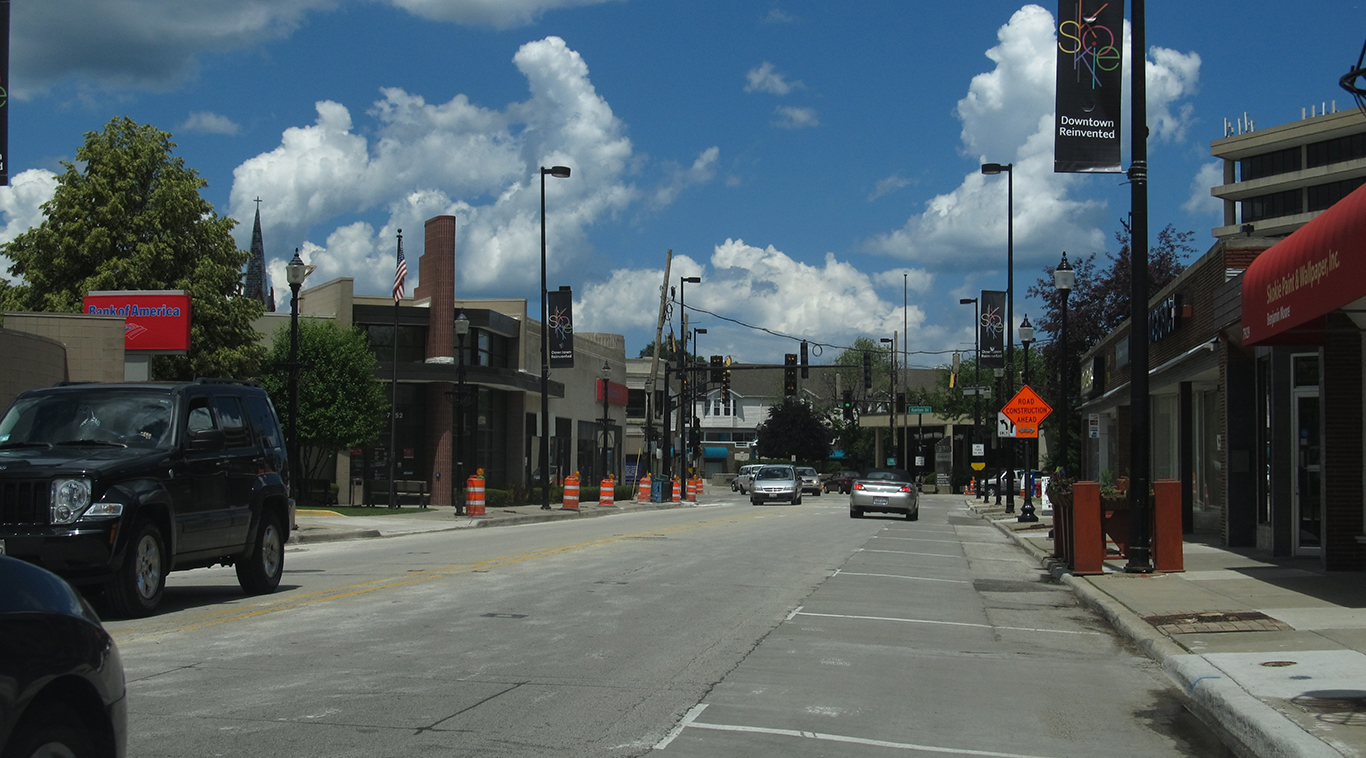
Source: Ken Lund / Wikimedia Commons
- Median home value: $362,500
- Homes worth over $1 million: 1.6%
- Homeownership rate: 74.6%
- Median household income: $91,892
- Total population: 67,076
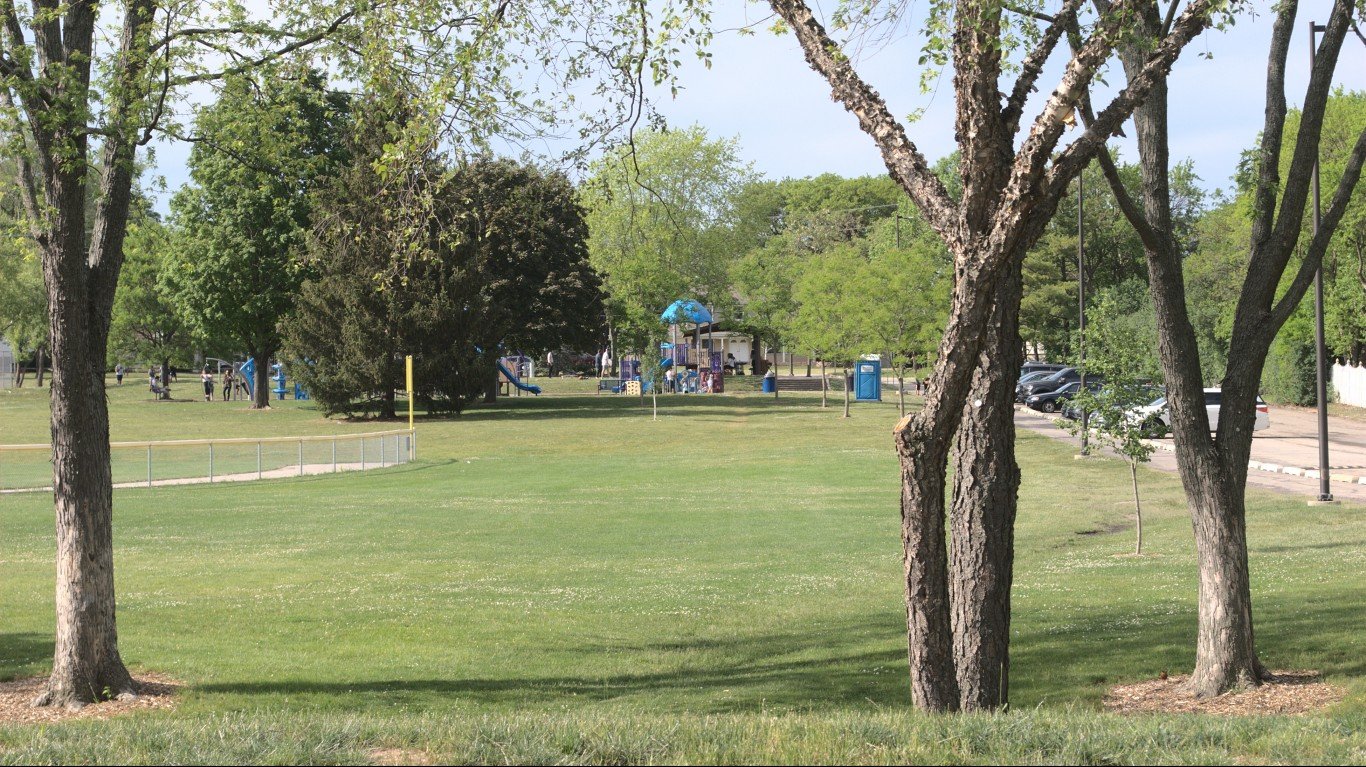
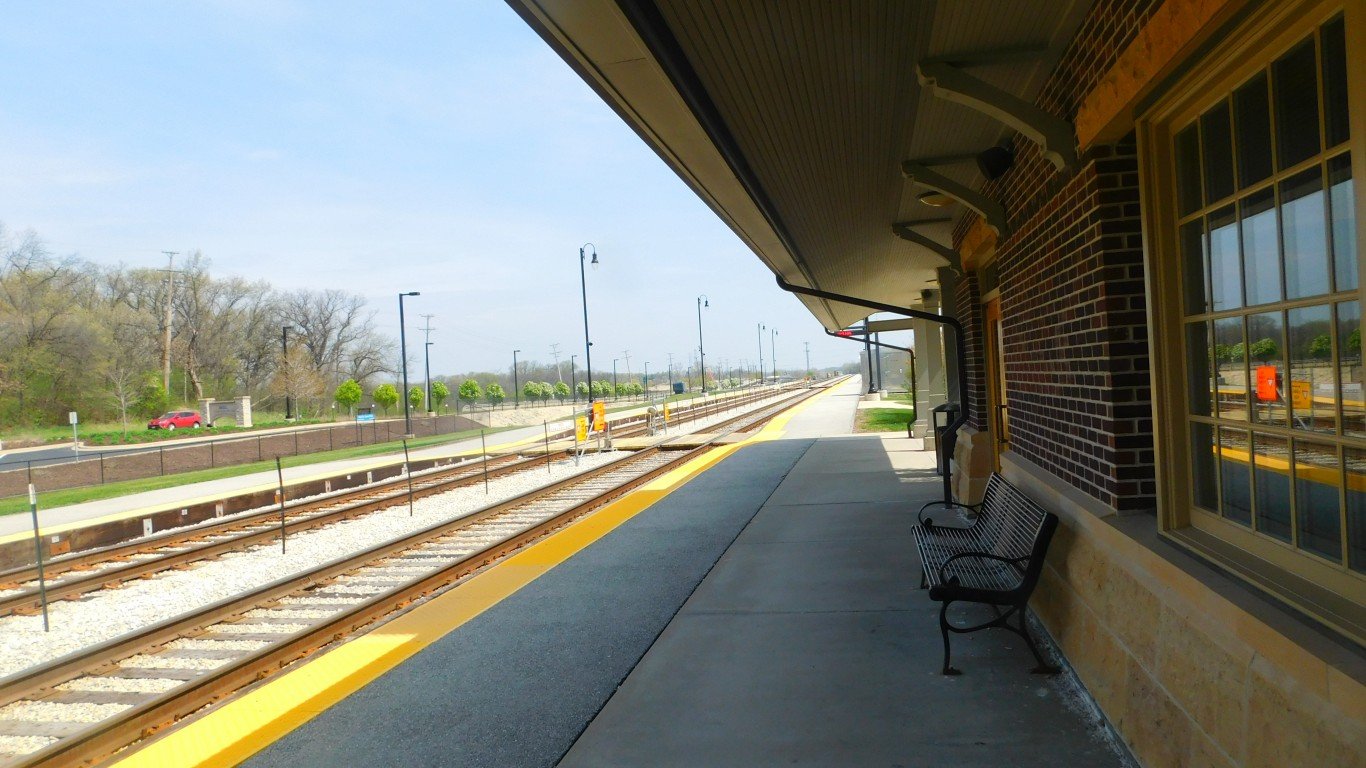
11. Mount Prospect
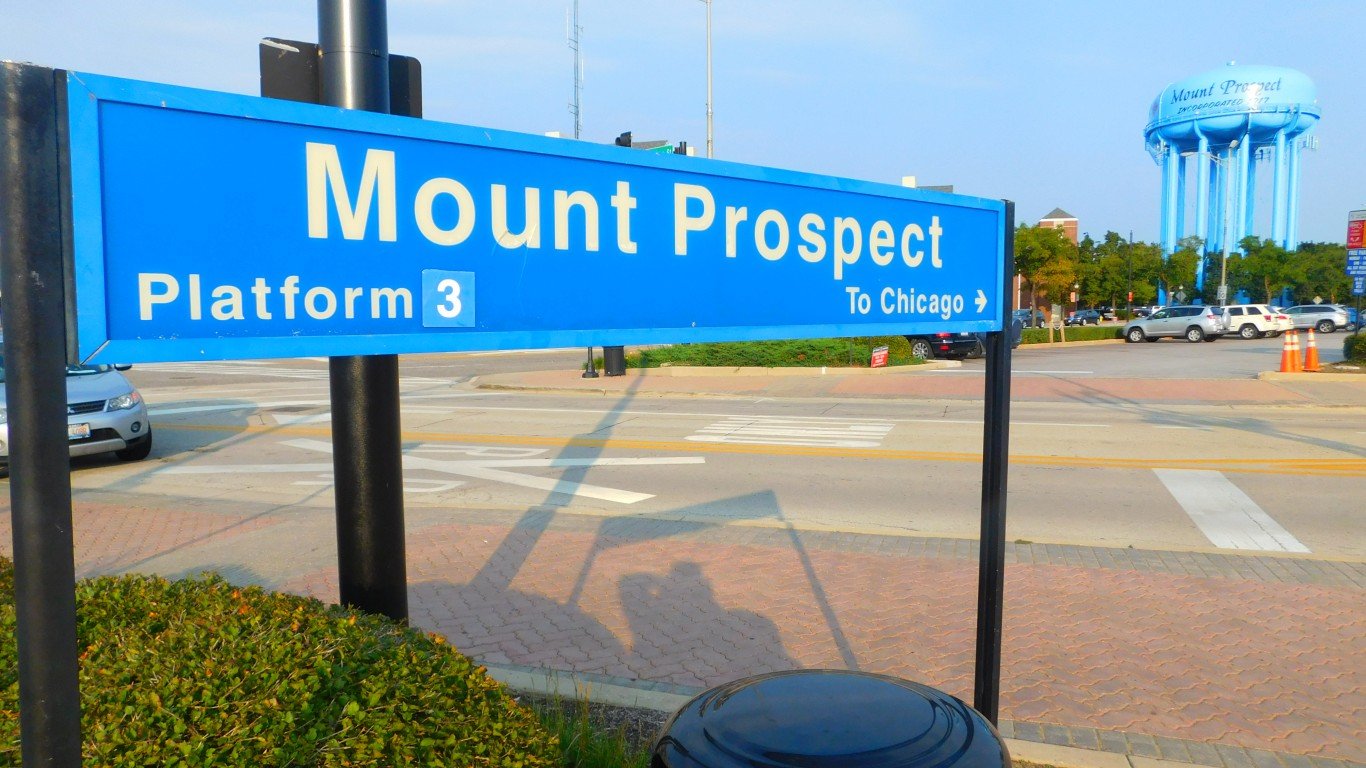
Source: roadgeek / Flickr
- Median home value: $367,900
- Homes worth over $1 million: 0.3%
- Homeownership rate: 69.9%
- Median household income: $100,526
- Total population: 56,191
10. Plainfield
Source: dougtone / Flickr
- Median home value: $377,200
- Homes worth over $1 million: 0.8%
- Homeownership rate: 89.7%
- Median household income: $143,064
- Total population: 44,941
9. Buffalo Grove
Source: plunkettb / Flickr
- Median home value: $380,700
- Homes worth over $1 million: 0.0%
- Homeownership rate: 83.2%
- Median household income: $127,553
- Total population: 42,934
8. Arlington Heights
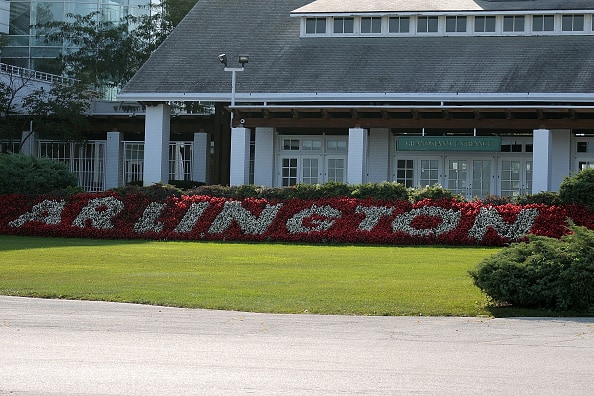
Source: 2021 Getty Images / Getty Images Sport via Getty Images
- Median home value: $396,500
- Homes worth over $1 million: 2.2%
- Homeownership rate: 72.7%
- Median household income: $113,502
- Total population: 76,794
7. Downers Grove
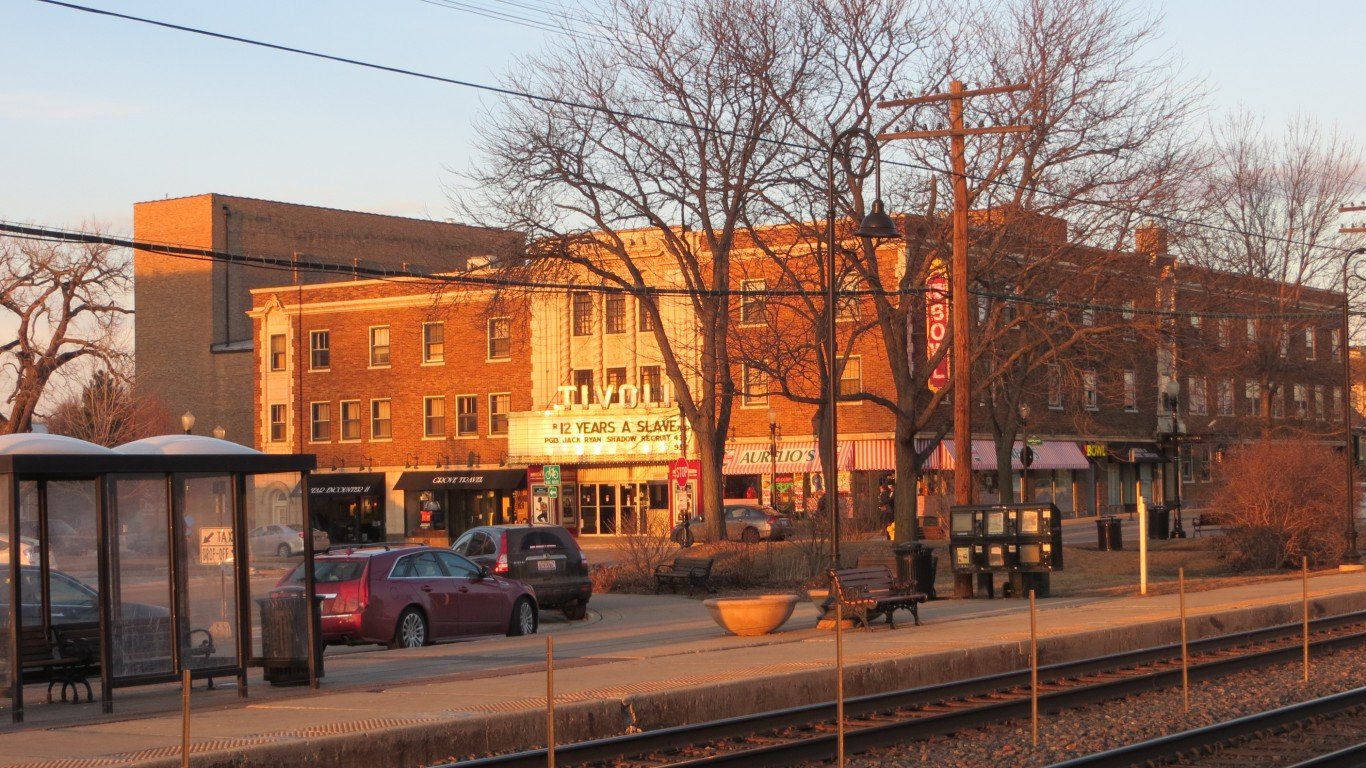
Source: davidwilson1949 / Flickr
- Median home value: $425,000
- Homes worth over $1 million: 3.9%
- Homeownership rate: 75.2%
- Median household income: $115,461
- Total population: 49,996
6. Wheaton
Source: davidwilson1949 / Flickr
- Median home value: $430,600
- Homes worth over $1 million: 2.8%
- Homeownership rate: 72.6%
- Median household income: $113,523
- Total population: 53,673
5. Oak Park
Source: crawfordbrian / Flickr
- Median home value: $440,500
- Homes worth over $1 million: 2.9%
- Homeownership rate: 59.5%
- Median household income: $103,264
- Total population: 53,834
4. Evanston
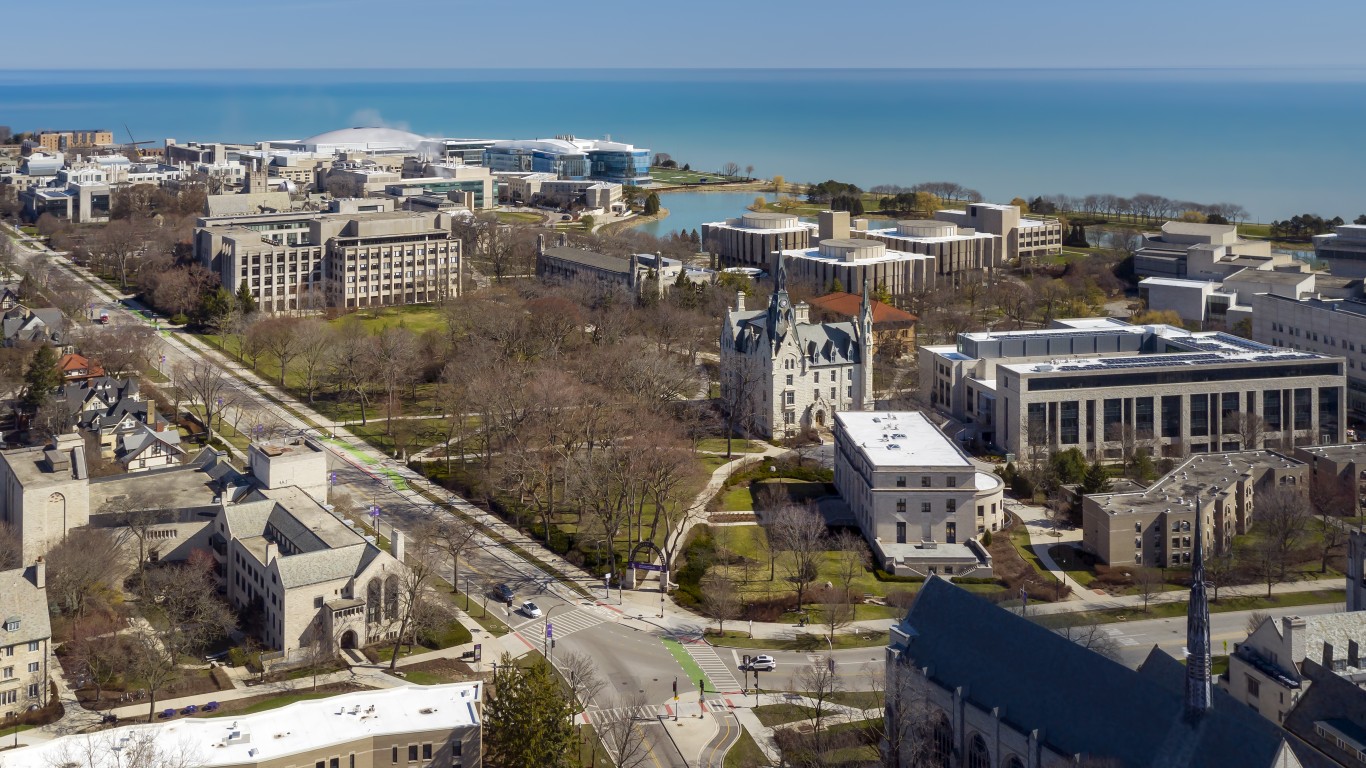
Source: pics721 / iStock via Getty Images
- Median home value: $454,600
- Homes worth over $1 million: 10.3%
- Homeownership rate: 55.9%
- Median household income: $93,188
- Total population: 77,181
3. Naperville

Source: EAGiven / iStock Editorial via Getty Images
- Median home value: $482,600
- Homes worth over $1 million: 4.4%
- Homeownership rate: 74.4%
- Median household income: $143,754
- Total population: 149,089
2. Elmhurst

Source: davidwilson1949 / Flickr
- Median home value: $516,900
- Homes worth over $1 million: 11.4%
- Homeownership rate: 79.8%
- Median household income: $143,492
- Total population: 45,648
1. Glenview

Source: Tim Boyle / Getty Images News via Getty Images
- Median home value: $590,600
- Homes worth over $1 million: 12.4%
- Homeownership rate: 77.8%
- Median household income: $134,910
- Total population: 47,896
| Rank | Places in Illinois with at least 40,000 residents | Median home value ($) | Homeownership rate (%) | Median household income ($) | Total Population |
|---|---|---|---|---|---|
| 1 | Glenview | 590,600 | 77.8 | 134,910 | 47,896 |
| 2 | Elmhurst | 516,900 | 79.8 | 143,492 | 45,648 |
| 3 | Naperville | 482,600 | 74.4 | 143,754 | 149,089 |
| 4 | Evanston | 454,600 | 55.9 | 93,188 | 77,181 |
| 5 | Oak Park | 440,500 | 59.5 | 103,264 | 53,834 |
| 6 | Wheaton | 430,600 | 72.6 | 113,523 | 53,673 |
| 7 | Downers Grove | 425,000 | 75.2 | 115,461 | 49,996 |
| 8 | Arlington Heights | 396,500 | 72.7 | 113,502 | 76,794 |
| 9 | Buffalo Grove | 380,700 | 83.2 | 127,553 | 42,934 |
| 10 | Plainfield | 377,200 | 89.7 | 143,064 | 44,941 |
| 11 | Mount Prospect | 367,900 | 69.9 | 100,526 | 56,191 |
| 12 | Skokie | 362,500 | 74.6 | 91,892 | 67,076 |
| 13 | Orland Park | 337,800 | 85.9 | 97,365 | 58,345 |
| 14 | Palatine | 337,200 | 67.5 | 93,383 | 67,223 |
| 15 | Bartlett | 334,600 | 86.4 | 126,555 | 40,829 |
| 16 | Hoffman Estates | 330,300 | 74.0 | 107,428 | 51,744 |
| 17 | Lombard | 308,900 | 69.9 | 95,509 | 44,055 |
| 18 | Chicago | 304,500 | 45.6 | 71,673 | 2,721,914 |
| 19 | Des Plaines | 304,100 | 78.6 | 86,552 | 60,087 |
| 20 | Schaumburg | 303,000 | 61.2 | 92,818 | 77,571 |
| 21 | Tinley Park | 278,300 | 87.5 | 99,628 | 55,571 |
| 22 | Bolingbrook | 276,400 | 78.8 | 102,057 | 73,755 |
| 23 | Berwyn | 272,900 | 60.4 | 71,300 | 56,556 |
| 24 | Crystal Lake | 271,100 | 78.1 | 103,018 | 40,463 |
| 25 | Oak Lawn | 250,900 | 81.9 | 77,221 | 57,665 |
| 26 | Elgin | 242,500 | 71.2 | 85,998 | 114,190 |
| 27 | Aurora | 241,600 | 66.8 | 85,943 | 181,405 |
| 28 | Romeoville | 233,900 | 83.8 | 96,409 | 40,132 |
| 29 | Joliet | 233,800 | 72.4 | 84,971 | 150,221 |
| 30 | Cicero | 224,300 | 54.6 | 64,325 | 84,189 |
| 31 | Normal | 194,400 | 55.8 | 63,965 | 52,920 |
| 32 | DeKalb | 192,200 | 42.1 | 47,410 | 40,697 |
| 33 | Champaign | 191,200 | 45.4 | 58,273 | 88,628 |
| 34 | Bloomington | 190,700 | 61.1 | 73,119 | 78,788 |
| 35 | Waukegan | 164,400 | 48.9 | 66,077 | 89,435 |
| 36 | Springfield | 147,700 | 62.4 | 62,419 | 114,214 |
| 37 | Peoria | 146,700 | 56.3 | 58,068 | 113,054 |
| 38 | Moline | 141,100 | 66.3 | 63,553 | 42,452 |
| 39 | Belleville | 122,700 | 62.5 | 60,573 | 42,155 |
| 40 | Rockford | 114,100 | 54.1 | 50,744 | 148,173 |
| 41 | Decatur | 96,800 | 61.2 | 49,039 | 70,975 |
Sponsored: Find a Qualified Financial Advisor
Finding a qualified financial advisor doesn’t have to be hard. SmartAsset’s free tool matches you with up to 3 fiduciary financial advisors in your area in 5 minutes. Each advisor has been vetted by SmartAsset and is held to a fiduciary standard to act in your best interests. If you’re ready to be matched with local advisors that can help you achieve your financial goals, get started now.
Thank you for reading! Have some feedback for us?
Contact the 24/7 Wall St. editorial team.
Editors' Picks