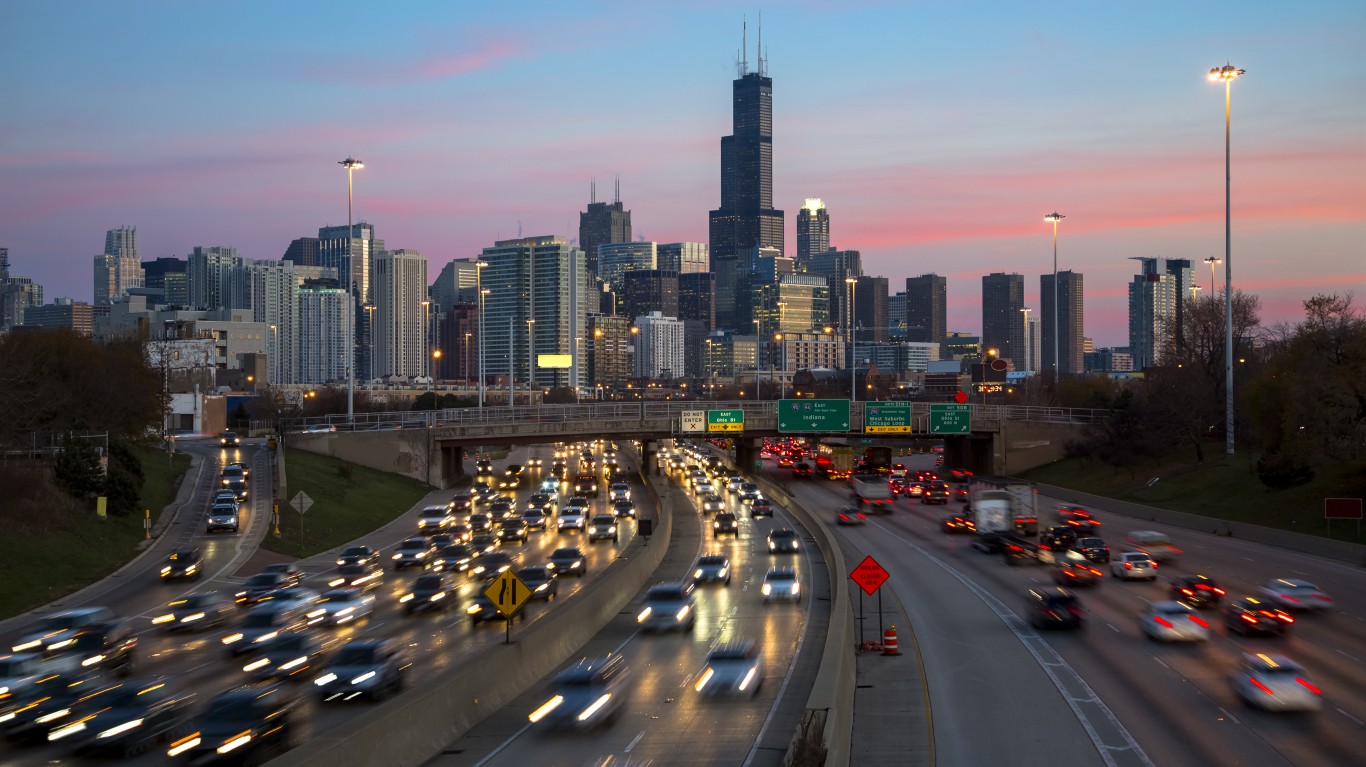
Incomes are rising rapidly in the United States. According to estimates from the U.S. Census Bureau, the national median household income was nearly $75,000 in 2022, up from about $69,700 in 2021. The 7.2% increase was the largest recorded year-over-year since at least the mid-1990s.
While the typical American household is earning more than ever before, incomes have not been rising fast enough to offset inflation. Throughout 2022, the average rate of inflation hit a 40-year high of 8%, four times the Federal Reserve’s 2% target rate. Accounting for the rising cost of living, real incomes in the U.S. fell by nearly 5% between 2019 and 2022.
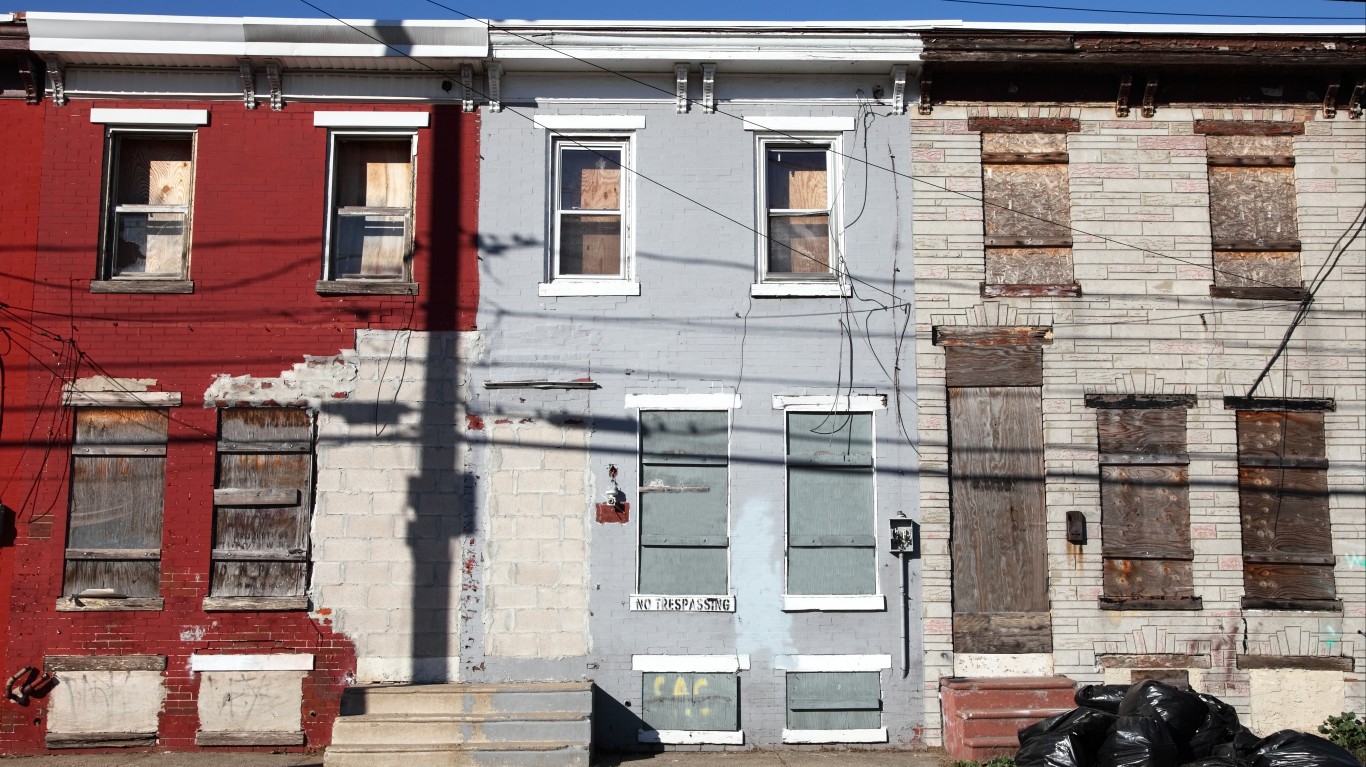
While no one has been spared from surging prices, Americans on the low end of the income spectrum have bore the brunt. During inflationary periods, higher-income Americans can cut back on spending and reduce the impact of rising costs. Meanwhile, lower earning Americans, who spend a larger share of their income on necessities such as food, housing, and gas, cannot.
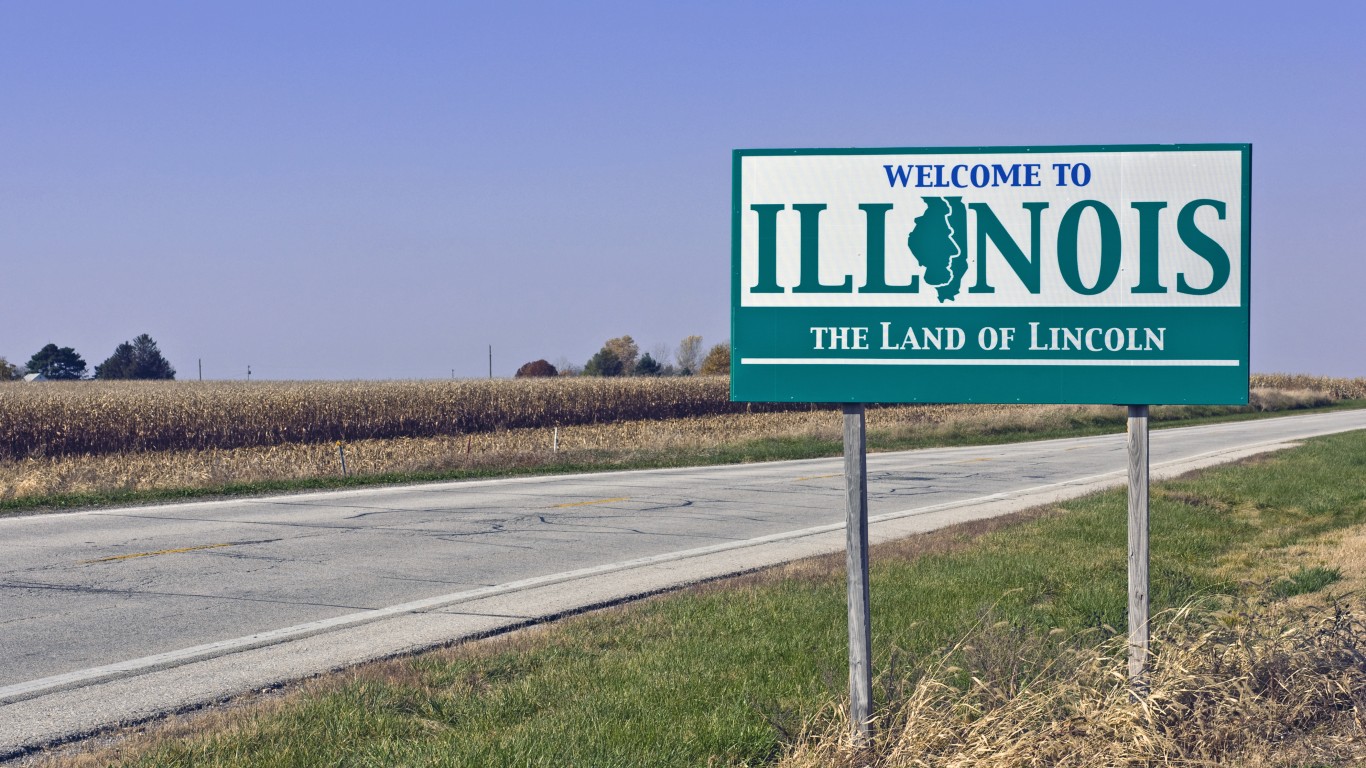
With a median household income of $78,433, Illinois has a relatively high-earning population. Still, there are many parts of the state where the typical household earns far less than the statewide median.
Using five-year estimates from the U.S. Census Bureau’s 2022 American Community Survey, 24/7 Wall St. identified the 35 poorest counties in Illinois. Counties in the state are ranked on median household income. Population, poverty, and unemployment data are also five-year estimates from the 2022 ACS.
Among the counties on this list, median household incomes are anywhere from about $18,100 to $38,100 below the statewide median. In many of these counties, levels of financial hardship are underscored by widespread poverty. In all but one county on this list, the share of residents living below the poverty line exceeds the 11.8% statewide poverty rate.
These are the poorest counties in Illinois.
35. Williamson County
- Median household income: $60,325
- Poverty rate: 13.2%
- 5-yr. avg. unemployment rate: 4.4%
- Population: 67,120
34. Macon County
- Median household income: $59,622
- Poverty rate: 15.5%
- 5-yr. avg. unemployment rate: 7.2%
- Population: 103,542
33. Marion County
- Median household income: $59,099
- Poverty rate: 17.0%
- 5-yr. avg. unemployment rate: 8.1%
- Population: 37,543
32. Ford County
- Median household income: $58,930
- Poverty rate: 12.1%
- 5-yr. avg. unemployment rate: 4.7%
- Population: 13,484
31. Greene County
- Median household income: $58,900
- Poverty rate: 13.7%
- 5-yr. avg. unemployment rate: 3.4%
- Population: 12,015
30. Bond County
- Median household income: $58,617
- Poverty rate: 14.9%
- 5-yr. avg. unemployment rate: 4.3%
- Population: 16,750
29. Mason County
- Median household income: $58,479
- Poverty rate: 13.7%
- 5-yr. avg. unemployment rate: 5.2%
- Population: 13,074
28. Jefferson County
- Median household income: $58,384
- Poverty rate: 14.1%
- 5-yr. avg. unemployment rate: 6.4%
- Population: 37,043
27. Stark County
- Median household income: $58,125
- Poverty rate: 12.5%
- 5-yr. avg. unemployment rate: 3.3%
- Population: 5,395
26. Clay County

- Median household income: $58,028
- Poverty rate: 15.7%
- 5-yr. avg. unemployment rate: 6.0%
- Population: 13,248
25. Pope County

- Median household income: $57,582
- Poverty rate: 18.7%
- 5-yr. avg. unemployment rate: 9.1%
- Population: 3,799
24. Stephenson County

- Median household income: $57,527
- Poverty rate: 13.3%
- 5-yr. avg. unemployment rate: 5.3%
- Population: 44,482
23. Massac County
- Median household income: $57,365
- Poverty rate: 13.8%
- 5-yr. avg. unemployment rate: 3.7%
- Population: 14,135
22. Fulton County
- Median household income: $57,223
- Poverty rate: 13.4%
- 5-yr. avg. unemployment rate: 6.8%
- Population: 33,691
21. Christian County
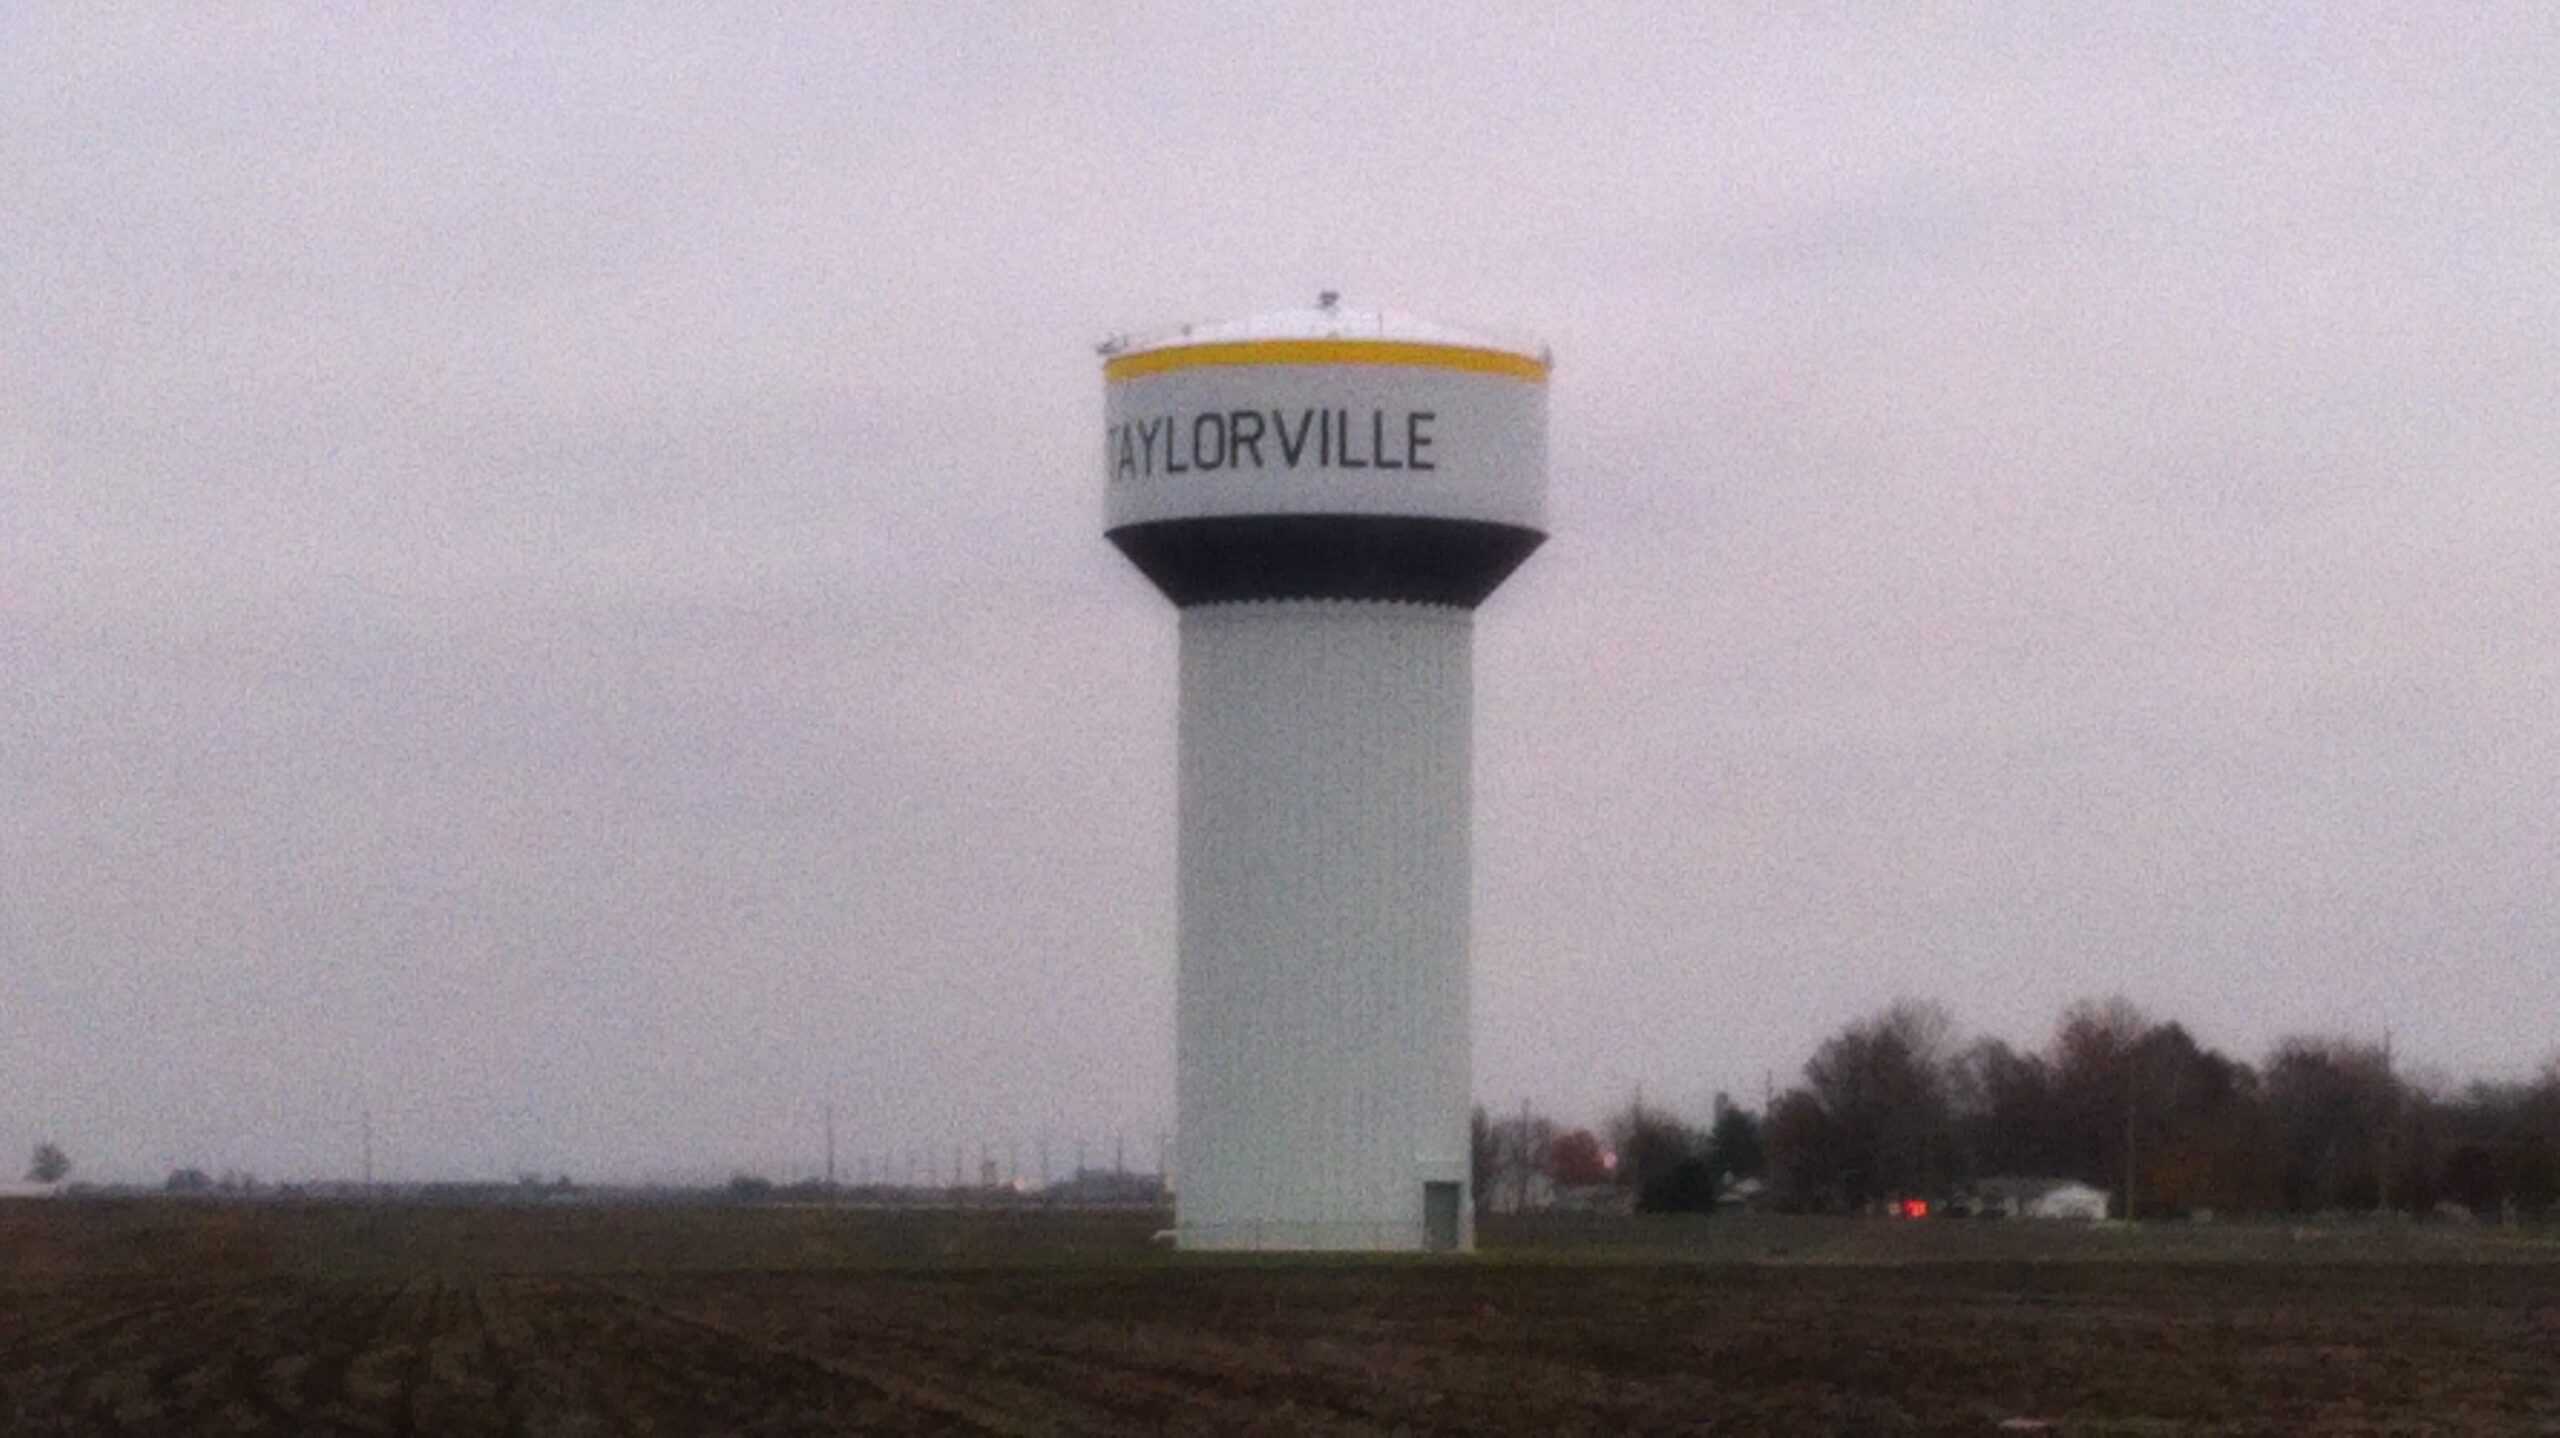
- Median household income: $56,933
- Poverty rate: 11.9%
- 5-yr. avg. unemployment rate: 4.4%
- Population: 33,893
20. Edgar County
- Median household income: $56,687
- Poverty rate: 11.8%
- 5-yr. avg. unemployment rate: 4.6%
- Population: 16,852
19. Perry County
- Median household income: $56,338
- Poverty rate: 17.5%
- 5-yr. avg. unemployment rate: 6.1%
- Population: 20,996
18. Lawrence County

- Median household income: $55,811
- Poverty rate: 13.7%
- 5-yr. avg. unemployment rate: 7.8%
- Population: 15,302
17. Pike County
- Median household income: $55,514
- Poverty rate: 13.5%
- 5-yr. avg. unemployment rate: 4.7%
- Population: 14,776
16. White County
- Median household income: $54,605
- Poverty rate: 15.3%
- 5-yr. avg. unemployment rate: 3.5%
- Population: 13,834
15. Union County
- Median household income: $54,090
- Poverty rate: 20.1%
- 5-yr. avg. unemployment rate: 6.3%
- Population: 17,122
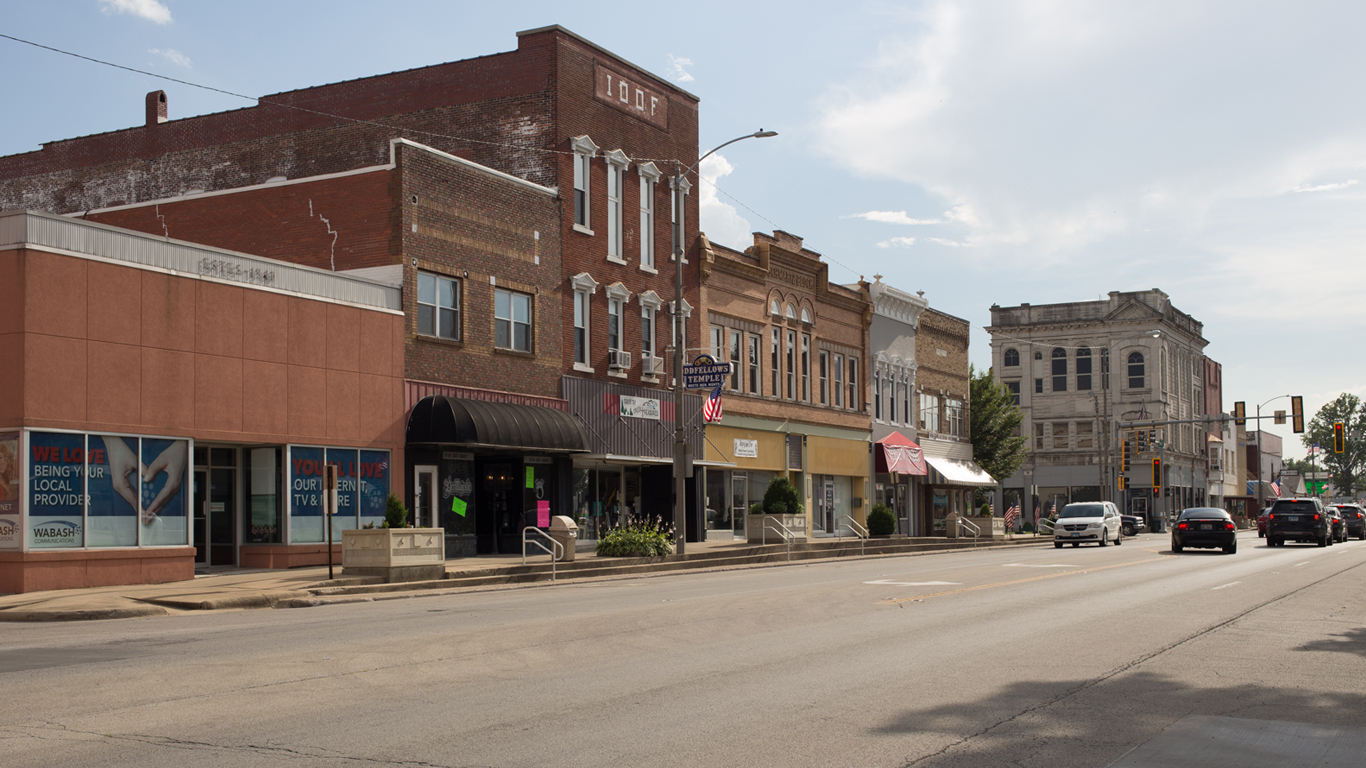
14. Wabash County
- Median household income: $54,074
- Poverty rate: 13.3%
- 5-yr. avg. unemployment rate: 4.4%
- Population: 11,321
13. Coles County
- Median household income: $53,732
- Poverty rate: 19.4%
- 5-yr. avg. unemployment rate: 6.9%
- Population: 47,076
12. Wayne County
- Median household income: $53,522
- Poverty rate: 13.9%
- 5-yr. avg. unemployment rate: 3.6%
- Population: 16,127
11. Hardin County
- Median household income: $53,026
- Poverty rate: 11.5%
- 5-yr. avg. unemployment rate: 2.6%
- Population: 3,665
10. Vermilion County

- Median household income: $52,787
- Poverty rate: 17.5%
- 5-yr. avg. unemployment rate: 6.7%
- Population: 74,113
9. Fayette County

- Median household income: $51,962
- Poverty rate: 14.7%
- 5-yr. avg. unemployment rate: 3.8%
- Population: 21,464
8. Gallatin County
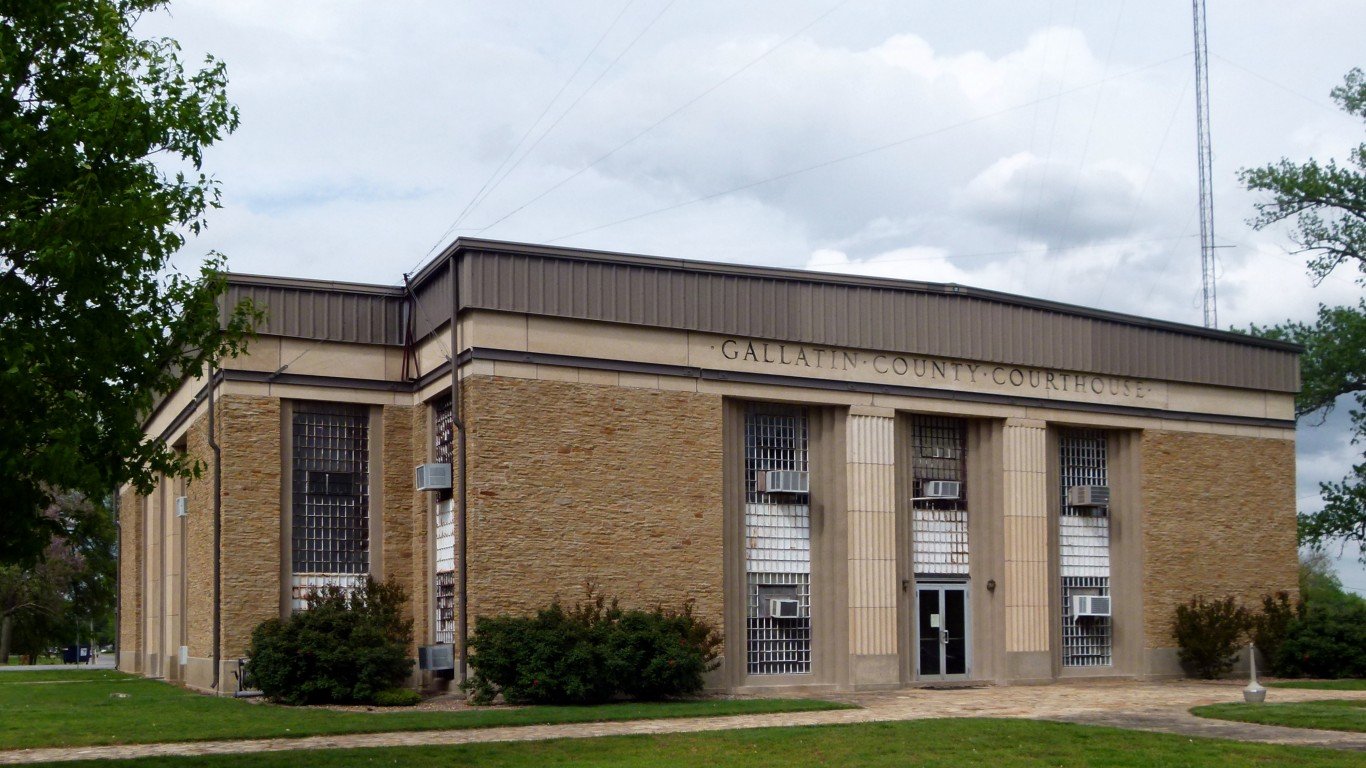
- Median household income: $51,868
- Poverty rate: 19.2%
- 5-yr. avg. unemployment rate: 7.8%
- Population: 4,967
7. Saline County

- Median household income: $51,710
- Poverty rate: 18.0%
- 5-yr. avg. unemployment rate: 5.9%
- Population: 23,662
6. Franklin County

- Median household income: $51,031
- Poverty rate: 17.8%
- 5-yr. avg. unemployment rate: 6.7%
- Population: 37,810
5. Knox County
- Median household income: $50,263
- Poverty rate: 16.3%
- 5-yr. avg. unemployment rate: 4.9%
- Population: 49,751
4. McDonough County

- Median household income: $48,904
- Poverty rate: 19.8%
- 5-yr. avg. unemployment rate: 8.0%
- Population: 27,370
3. Jackson County
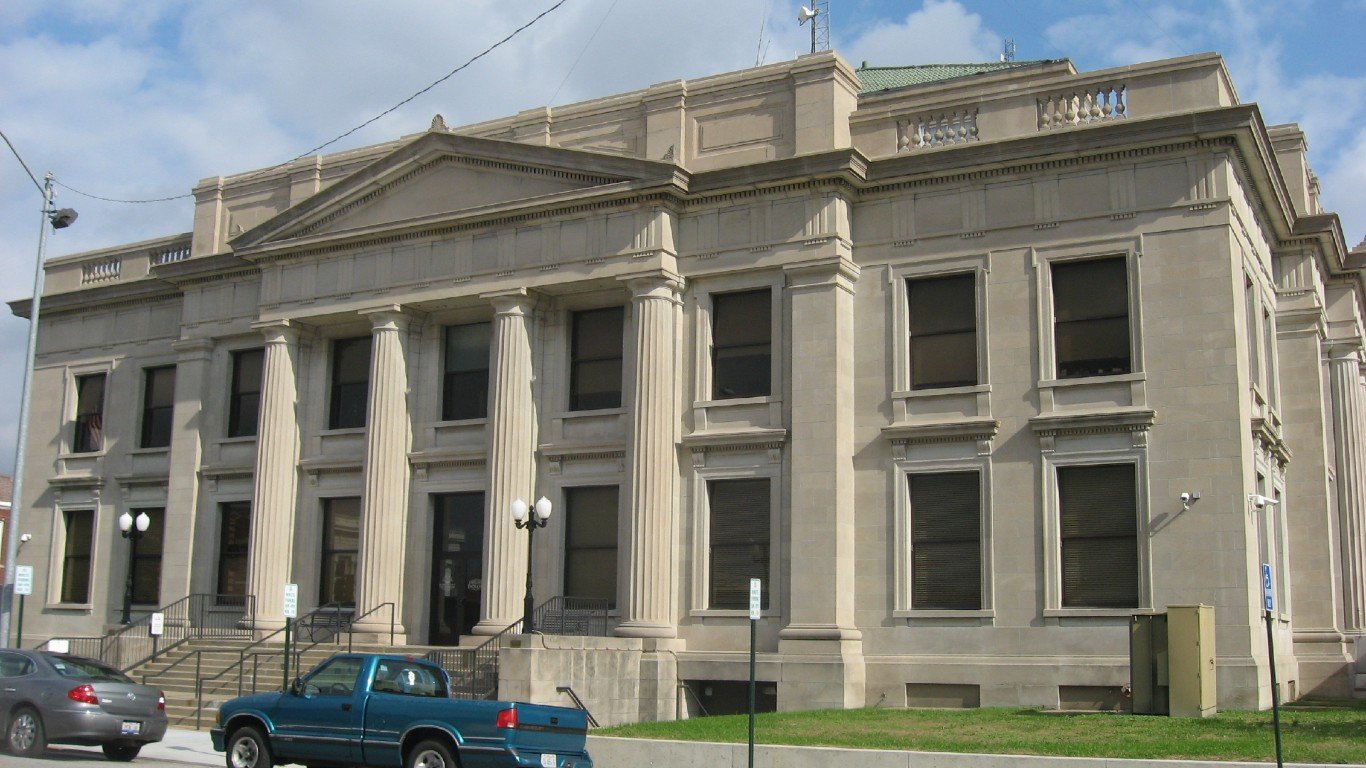
- Median household income: $44,847
- Poverty rate: 23.0%
- 5-yr. avg. unemployment rate: 8.1%
- Population: 53,176
2. Pulaski County
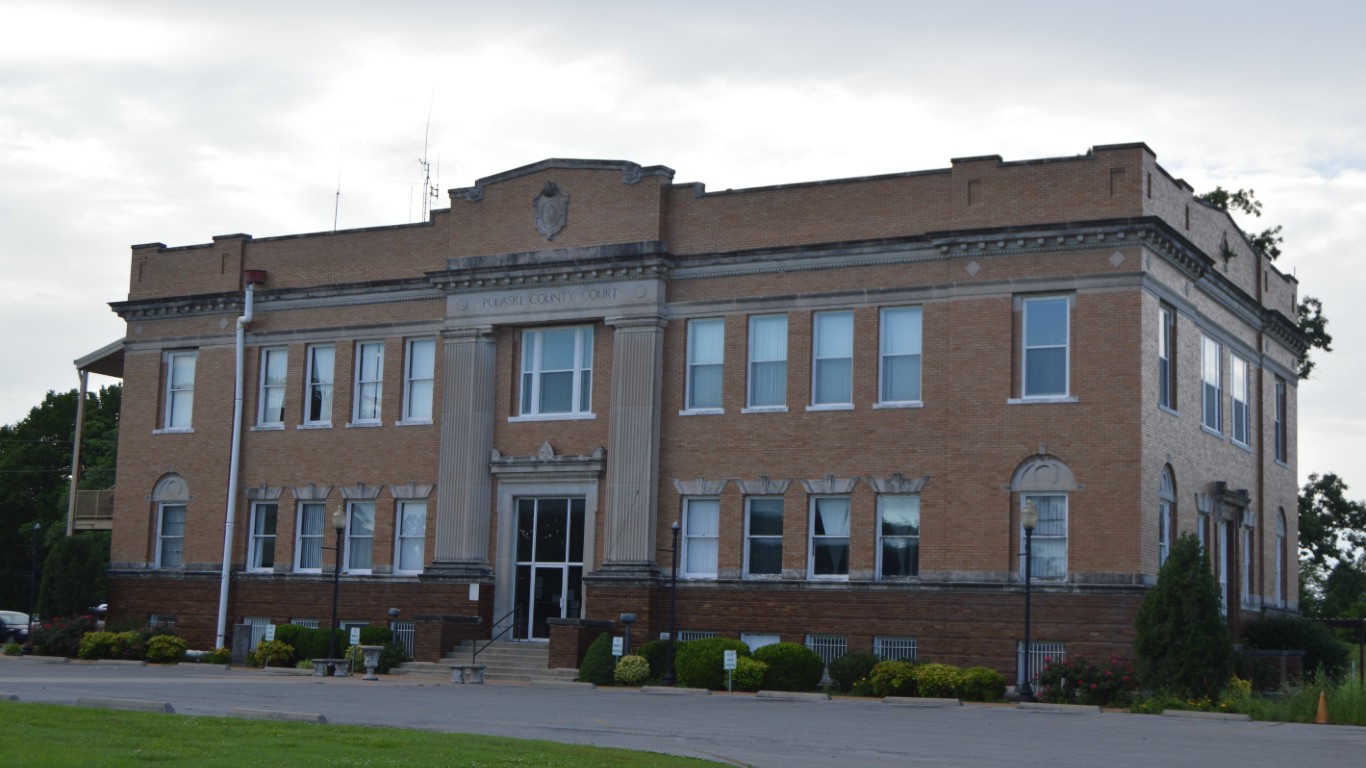
- Median household income: $41,038
- Poverty rate: 25.0%
- 5-yr. avg. unemployment rate: 4.2%
- Population: 5,177
1. Alexander County

- Median household income: $40,365
- Poverty rate: 21.4%
- 5-yr. avg. unemployment rate: 9.3%
- Population: 5,261
| Rank | County | Median household income ($) | Poverty rate (%) | 5-yr. avg. unemployment rate (%) |
|---|---|---|---|---|
| 1 | Alexander, Illinois | 40,365 | 21.4 | 9.3 |
| 2 | Pulaski, Illinois | 41,038 | 25.0 | 4.2 |
| 3 | Jackson, Illinois | 44,847 | 23.0 | 8.1 |
| 4 | McDonough, Illinois | 48,904 | 19.8 | 8.0 |
| 5 | Knox, Illinois | 50,263 | 16.3 | 4.9 |
| 6 | Franklin, Illinois | 51,031 | 17.8 | 6.7 |
| 7 | Saline, Illinois | 51,710 | 18.0 | 5.9 |
| 8 | Gallatin, Illinois | 51,868 | 19.2 | 7.8 |
| 9 | Fayette, Illinois | 51,962 | 14.7 | 3.8 |
| 10 | Vermilion, Illinois | 52,787 | 17.5 | 6.7 |
| 11 | Hardin, Illinois | 53,026 | 11.5 | 2.6 |
| 12 | Wayne, Illinois | 53,522 | 13.9 | 3.6 |
| 13 | Coles, Illinois | 53,732 | 19.4 | 6.9 |
| 14 | Wabash, Illinois | 54,074 | 13.3 | 4.4 |
| 15 | Union, Illinois | 54,090 | 20.1 | 6.3 |
| 16 | White, Illinois | 54,605 | 15.3 | 3.5 |
| 17 | Pike, Illinois | 55,514 | 13.5 | 4.7 |
| 18 | Lawrence, Illinois | 55,811 | 13.7 | 7.8 |
| 19 | Perry, Illinois | 56,338 | 17.5 | 6.1 |
| 20 | Edgar, Illinois | 56,687 | 11.8 | 4.6 |
| 21 | Christian, Illinois | 56,933 | 11.9 | 4.4 |
| 22 | Fulton, Illinois | 57,223 | 13.4 | 6.8 |
| 23 | Massac, Illinois | 57,365 | 13.8 | 3.7 |
| 24 | Stephenson, Illinois | 57,527 | 13.3 | 5.3 |
| 25 | Pope, Illinois | 57,582 | 18.7 | 9.1 |
| 26 | Clay, Illinois | 58,028 | 15.7 | 6.0 |
| 27 | Stark, Illinois | 58,125 | 12.5 | 3.3 |
| 28 | Jefferson, Illinois | 58,384 | 14.1 | 6.4 |
| 29 | Mason, Illinois | 58,479 | 13.7 | 5.2 |
| 30 | Bond, Illinois | 58,617 | 14.9 | 4.3 |
| 31 | Greene, Illinois | 58,900 | 13.7 | 3.4 |
| 32 | Ford, Illinois | 58,930 | 12.1 | 4.7 |
| 33 | Marion, Illinois | 59,099 | 17.0 | 8.1 |
| 34 | Macon, Illinois | 59,622 | 15.5 | 7.2 |
| 35 | Williamson, Illinois | 60,325 | 13.2 | 4.4 |
Contact [email protected] for any questions or corrections.