
Incomes are rising rapidly in the United States. According to estimates from the U.S. Census Bureau, the national median household income was nearly $75,000 in 2022, up from about $69,700 in 2021. The 7.2% increase was the largest recorded year-over-year since at least the mid-1990s.
While the typical American household is earning more than ever before, incomes have not been rising fast enough to offset inflation. Throughout 2022, the average rate of inflation hit a 40-year high of 8%, four times the Federal Reserve’s 2% target rate. Accounting for the rising cost of living, real incomes in the U.S. fell by nearly 5% between 2019 and 2022.
While no one has been spared from surging prices, Americans on the low end of the income spectrum have bore the brunt. During inflationary periods, higher-income Americans can cut back on spending and reduce the impact of rising costs. Meanwhile, lower earning Americans, who spend a larger share of their income on necessities such as food, housing, and gas, cannot.
North Carolina has a median household income of $66,186. But in many parts of the state, the typical household earns far less than the statewide median.
Using five-year estimates from the U.S. Census Bureau’s 2022 American Community Survey, 24/7 Wall St. identified the 35 poorest counties in North Carolina. Counties in the state are ranked on median household income. Population, poverty, and unemployment data are also five-year estimates from the 2022 ACS.
Among the counties on this list, median household incomes are anywhere from about $13,400 to $27,500 below the statewide median. In many of these counties, levels of financial hardship are underscored by widespread poverty. In all but two counties on this list, the share of residents living below the poverty line exceeds the 13.3% statewide poverty rate.
These are the poorest counties in North Carolina.
35. Surry County

- Median household income: $52,743
- Poverty rate: 17.9%
- 5-yr. avg. unemployment rate: 4.8%
- Population: 71,429
34. Caldwell County
- Median household income: $52,362
- Poverty rate: 13.3%
- 5-yr. avg. unemployment rate: 5.8%
- Population: 80,716
33. Jackson County

- Median household income: $51,482
- Poverty rate: 19.3%
- 5-yr. avg. unemployment rate: 5.9%
- Population: 42,388
32. Chowan County

- Median household income: $51,188
- Poverty rate: 20.9%
- 5-yr. avg. unemployment rate: 4.3%
- Population: 13,835
31. Macon County

- Median household income: $51,042
- Poverty rate: 15.4%
- 5-yr. avg. unemployment rate: 3.5%
- Population: 37,088
30. Rockingham County
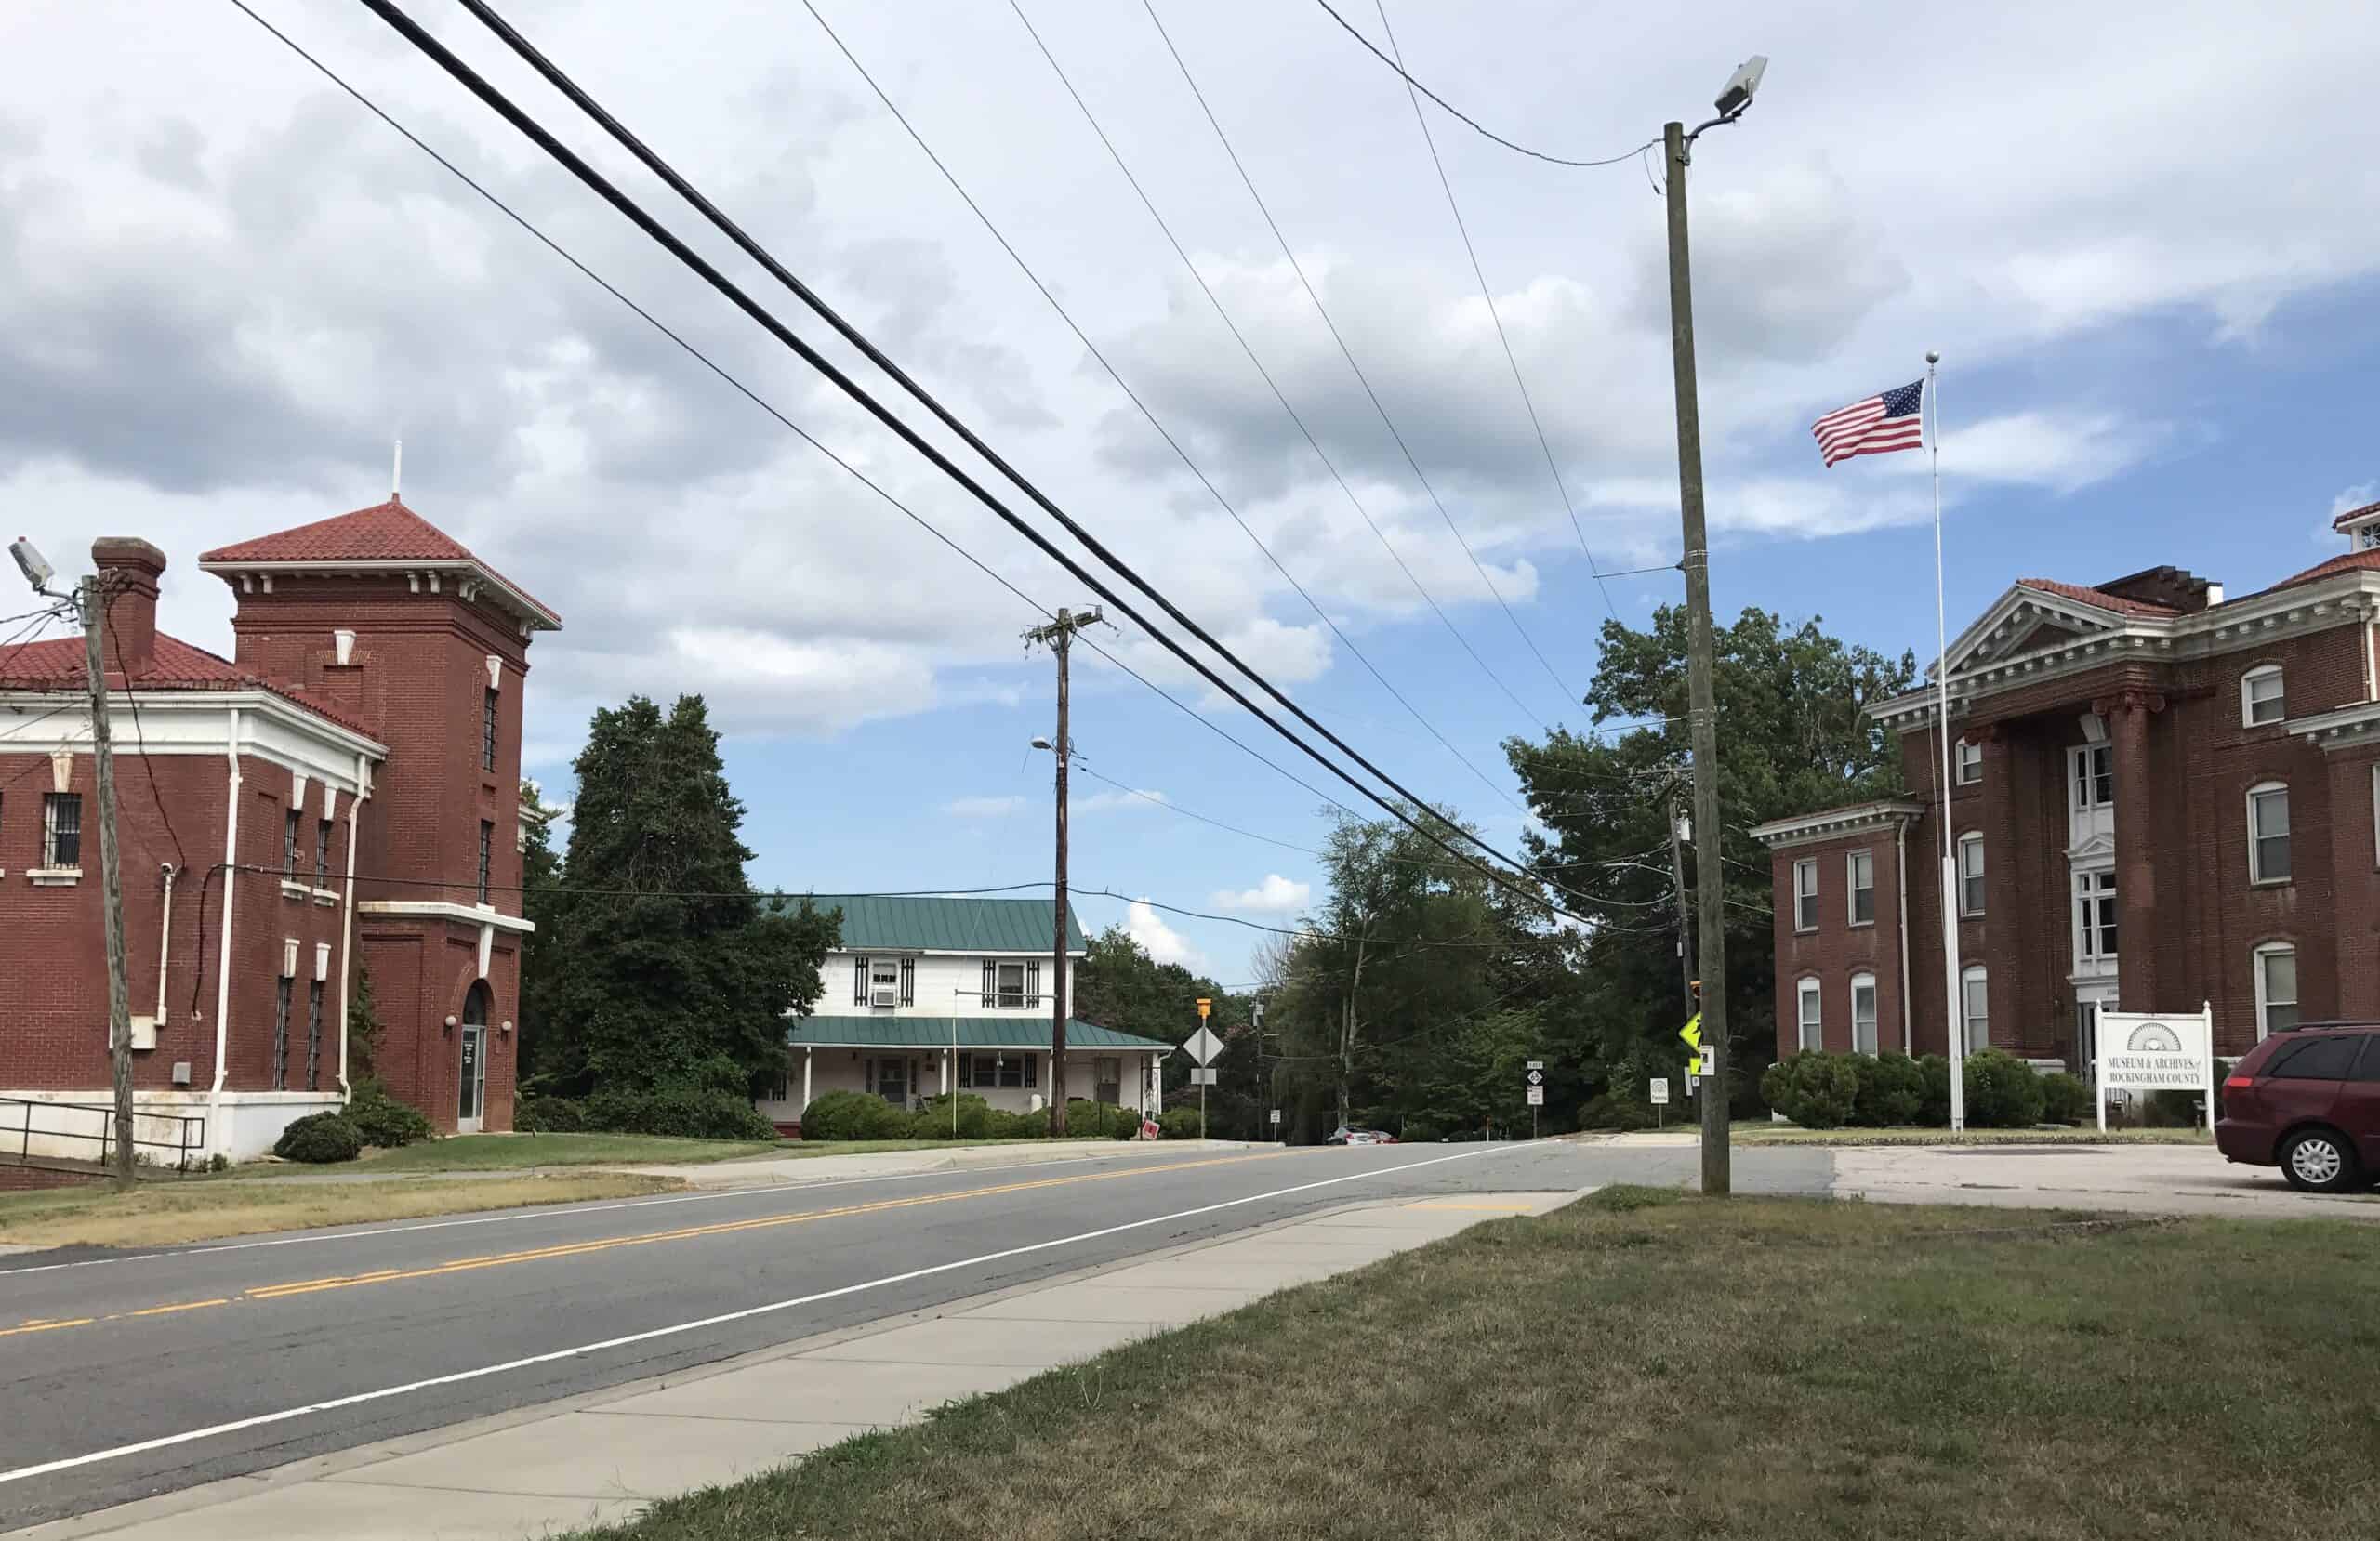
- Median household income: $50,737
- Poverty rate: 18.8%
- 5-yr. avg. unemployment rate: 6.5%
- Population: 91,209
29. Cleveland County
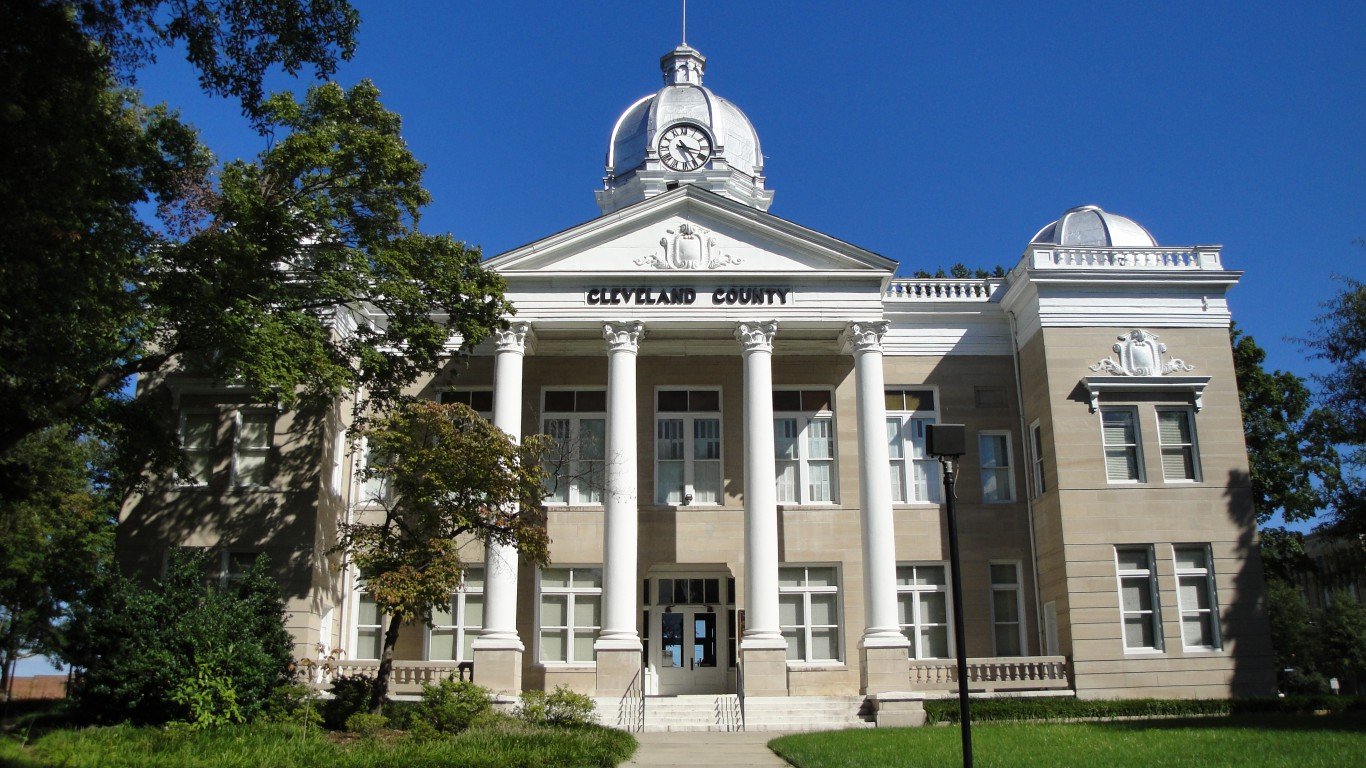
- Median household income: $50,723
- Poverty rate: 18.4%
- 5-yr. avg. unemployment rate: 6.4%
- Population: 99,527
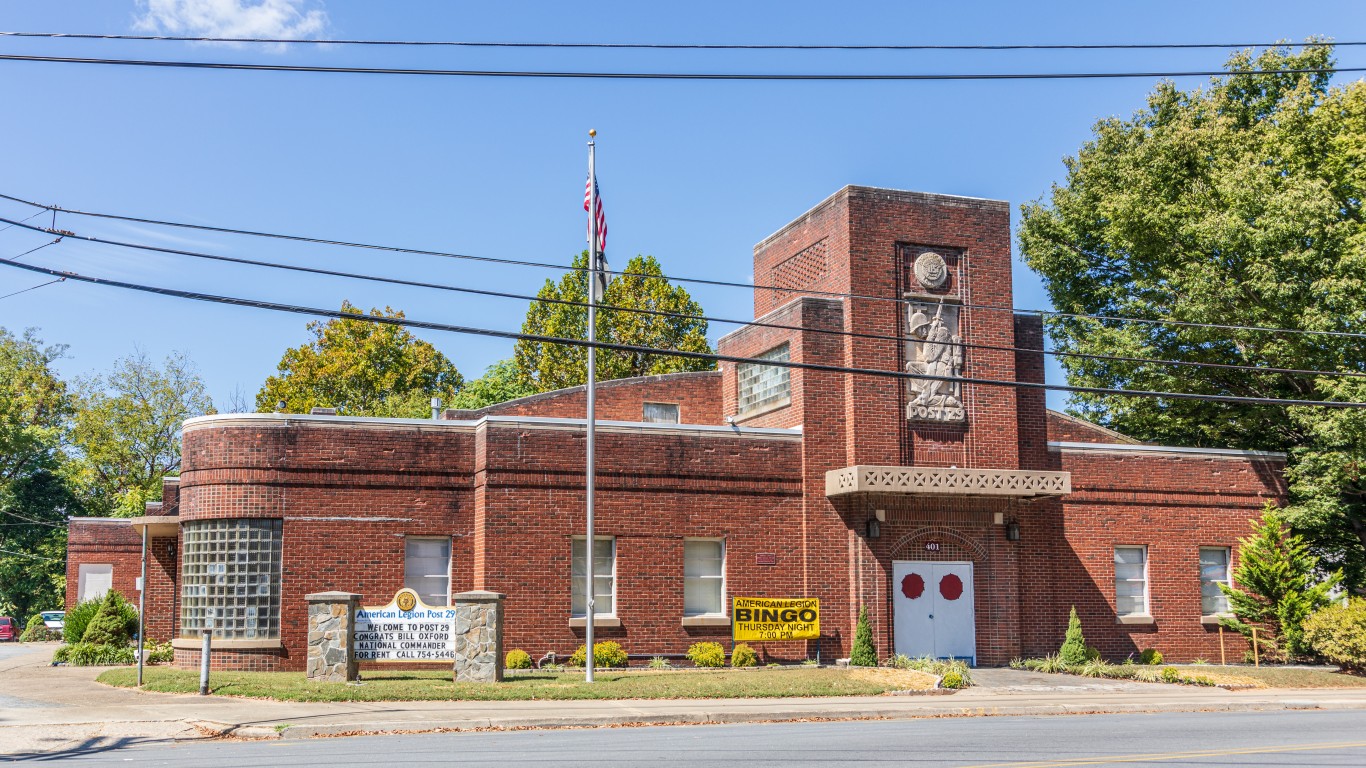
28. Rutherford County
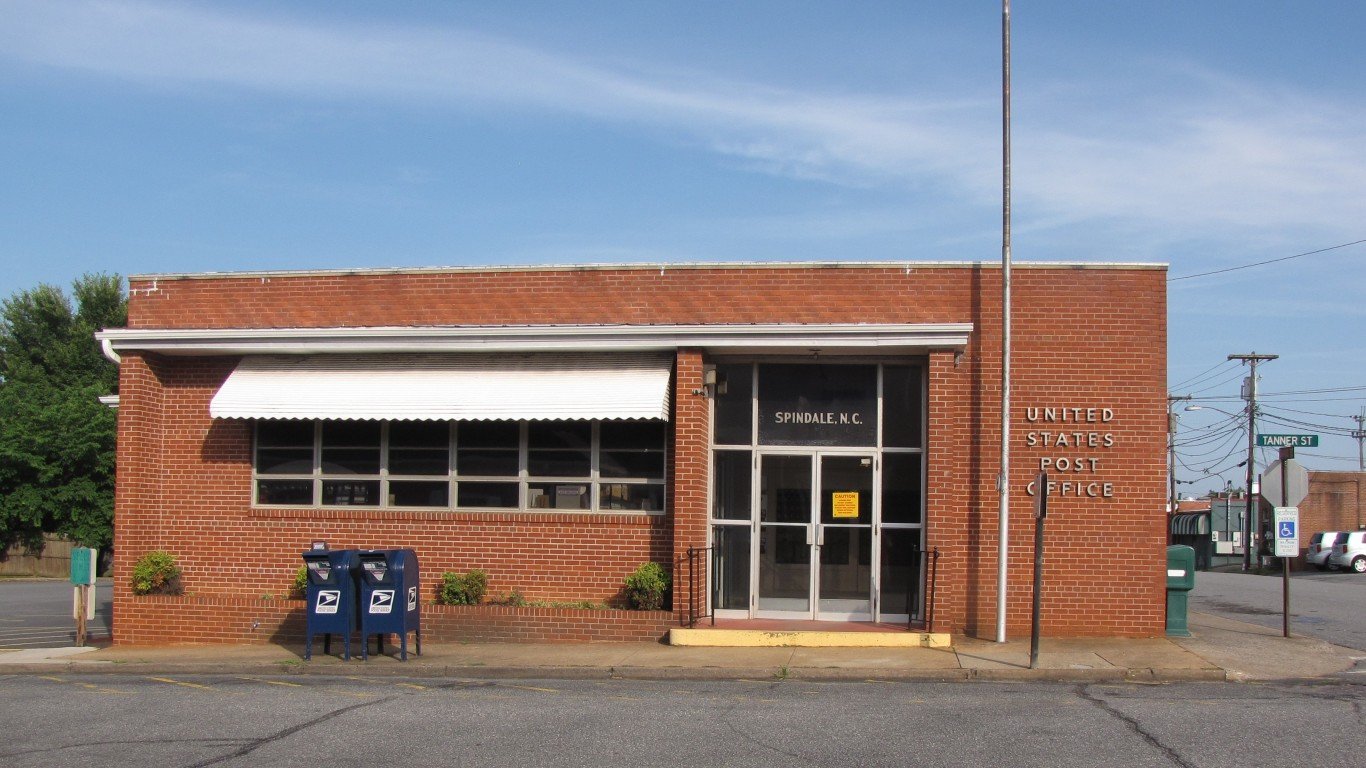
- Median household income: $50,512
- Poverty rate: 18.4%
- 5-yr. avg. unemployment rate: 6.0%
- Population: 64,680
27. Greene County

- Median household income: $50,320
- Poverty rate: 22.6%
- 5-yr. avg. unemployment rate: 5.5%
- Population: 20,407
26. Watauga County
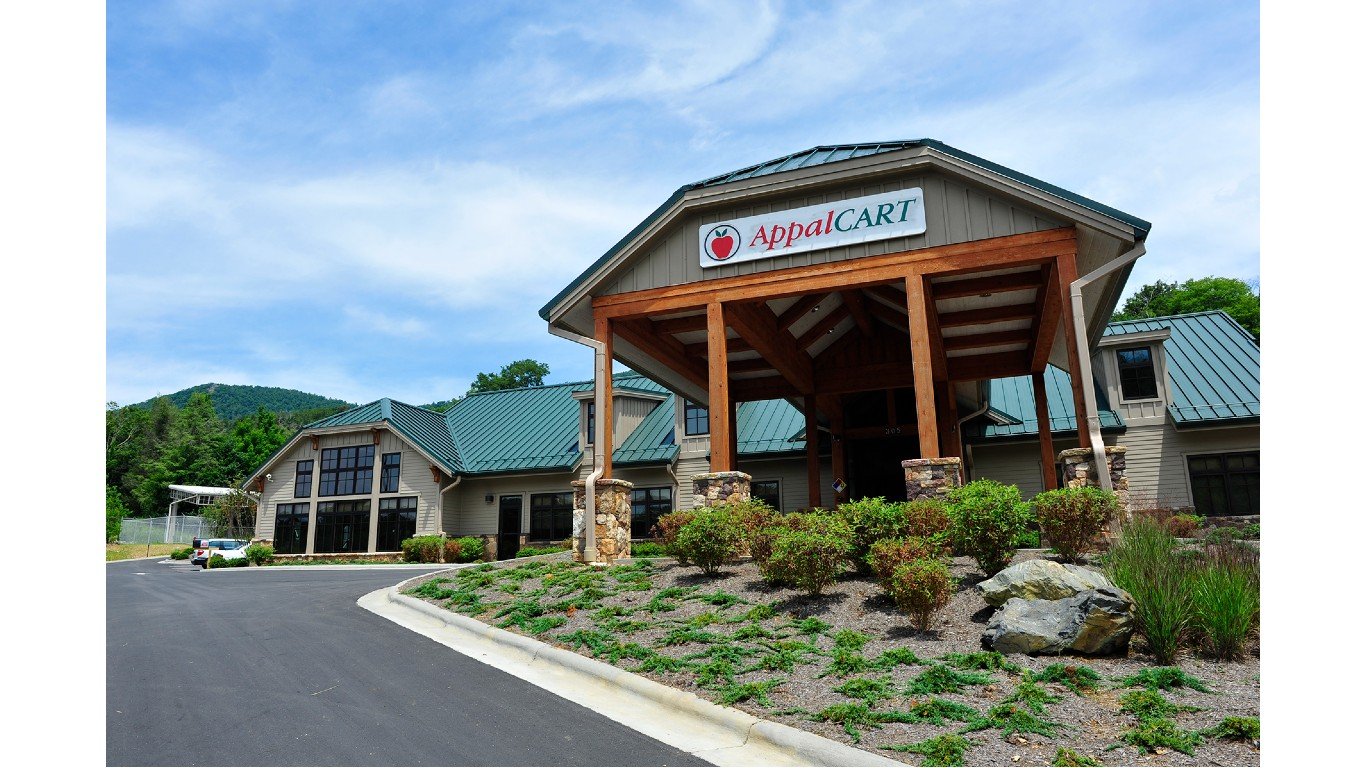
- Median household income: $50,034
- Poverty rate: 24.9%
- 5-yr. avg. unemployment rate: 9.3%
- Population: 54,540
25. Sampson County
- Median household income: $49,963
- Poverty rate: 22.3%
- 5-yr. avg. unemployment rate: 5.7%
- Population: 59,317
24. Wilson County

- Median household income: $49,827
- Poverty rate: 20.4%
- 5-yr. avg. unemployment rate: 6.6%
- Population: 78,667
23. Duplin County
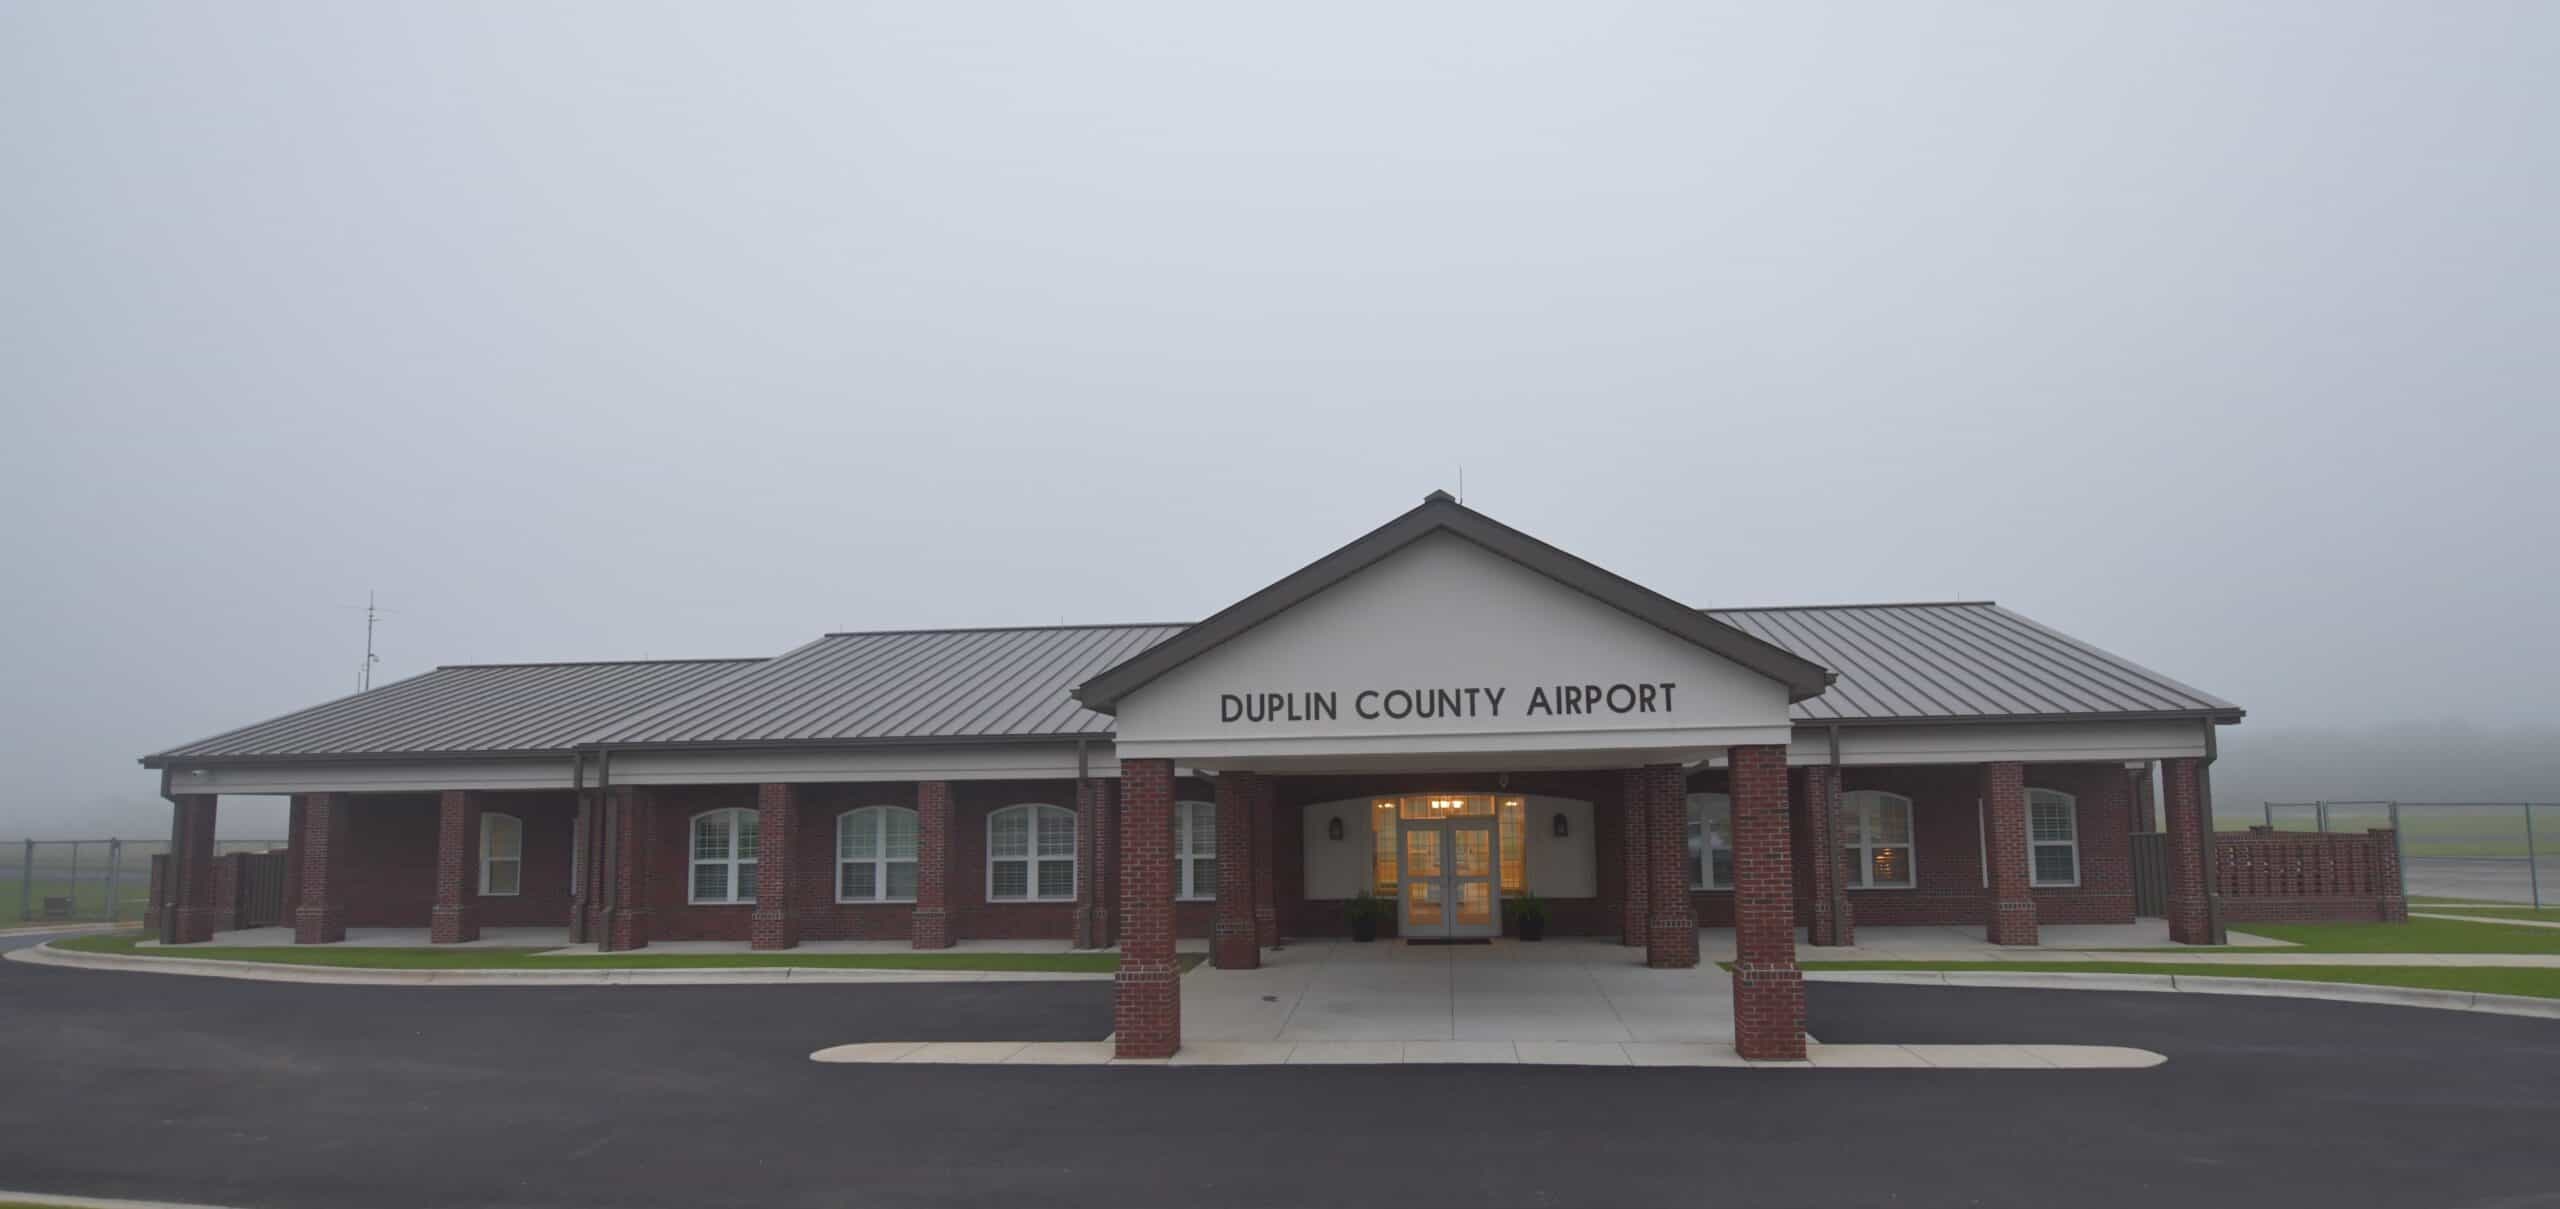
- Median household income: $49,376
- Poverty rate: 18.5%
- 5-yr. avg. unemployment rate: 5.4%
- Population: 49,312
22. Cherokee County

- Median household income: $49,254
- Poverty rate: 16.7%
- 5-yr. avg. unemployment rate: 4.9%
- Population: 28,868
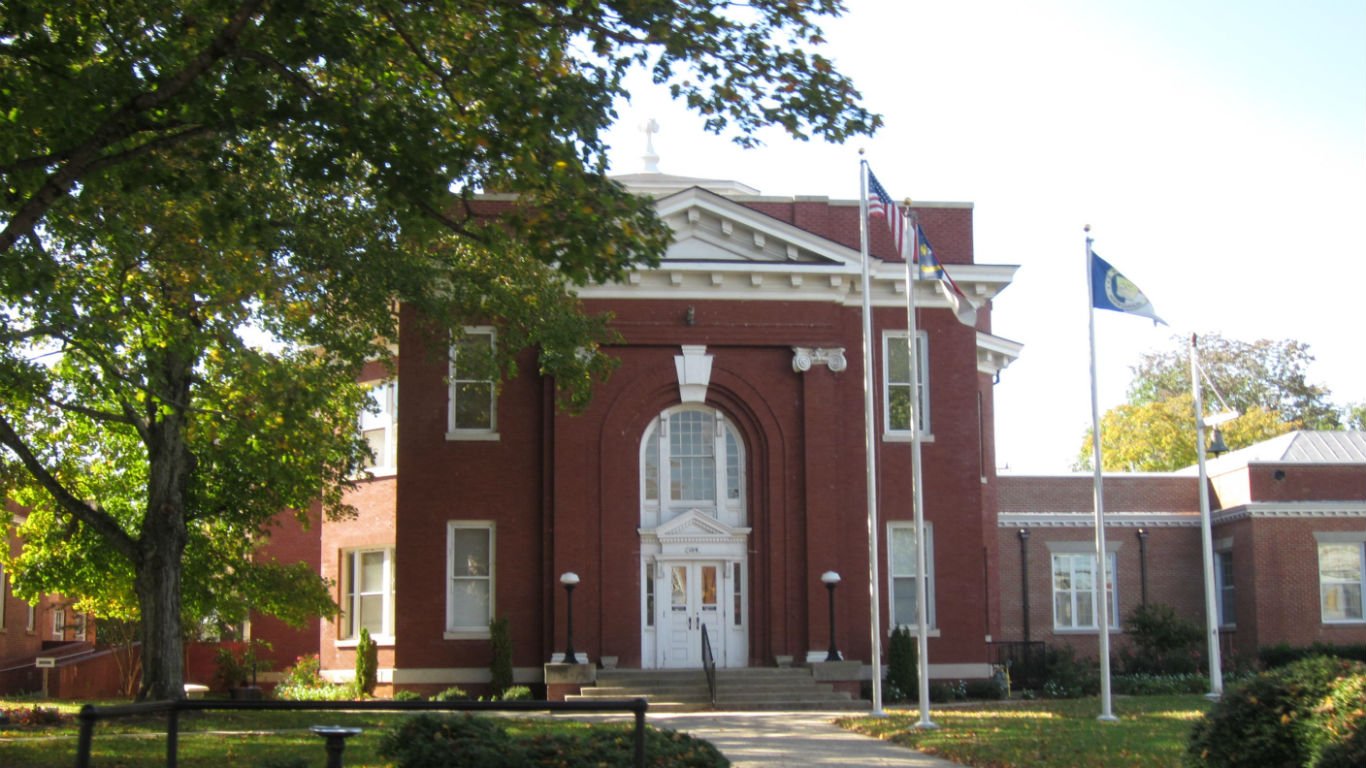
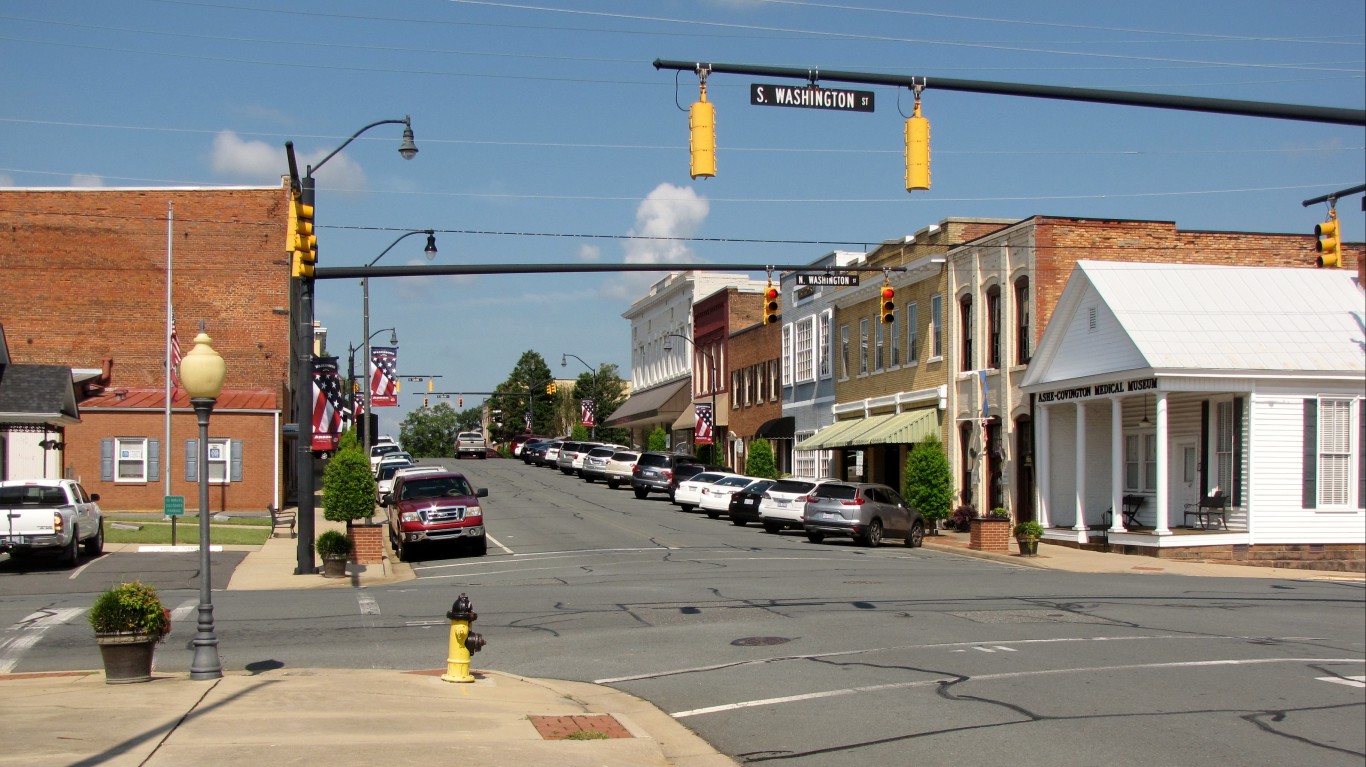
21. Ashe County

- Median household income: $49,176
- Poverty rate: 14.1%
- 5-yr. avg. unemployment rate: 5.1%
- Population: 26,759
20. Wilkes County

- Median household income: $49,119
- Poverty rate: 17.1%
- 5-yr. avg. unemployment rate: 6.0%
- Population: 66,125
19. Vance County

- Median household income: $48,340
- Poverty rate: 18.7%
- 5-yr. avg. unemployment rate: 7.0%
- Population: 42,492
18. Edgecombe County

- Median household income: $46,370
- Poverty rate: 22.0%
- 5-yr. avg. unemployment rate: 8.6%
- Population: 49,067
17. Hertford County
- Median household income: $46,196
- Poverty rate: 20.3%
- 5-yr. avg. unemployment rate: 7.1%
- Population: 21,633
16. Graham County

- Median household income: $46,010
- Poverty rate: 11.3%
- 5-yr. avg. unemployment rate: 7.7%
- Population: 8,047
15. Northampton County

- Median household income: $45,698
- Poverty rate: 18.7%
- 5-yr. avg. unemployment rate: 7.6%
- Population: 17,528
14. Martin County

- Median household income: $44,799
- Poverty rate: 20.5%
- 5-yr. avg. unemployment rate: 9.6%
- Population: 21,992
13. Hyde County

- Median household income: $43,724
- Poverty rate: 29.9%
- 5-yr. avg. unemployment rate: 8.7%
- Population: 4,636
12. Columbus County
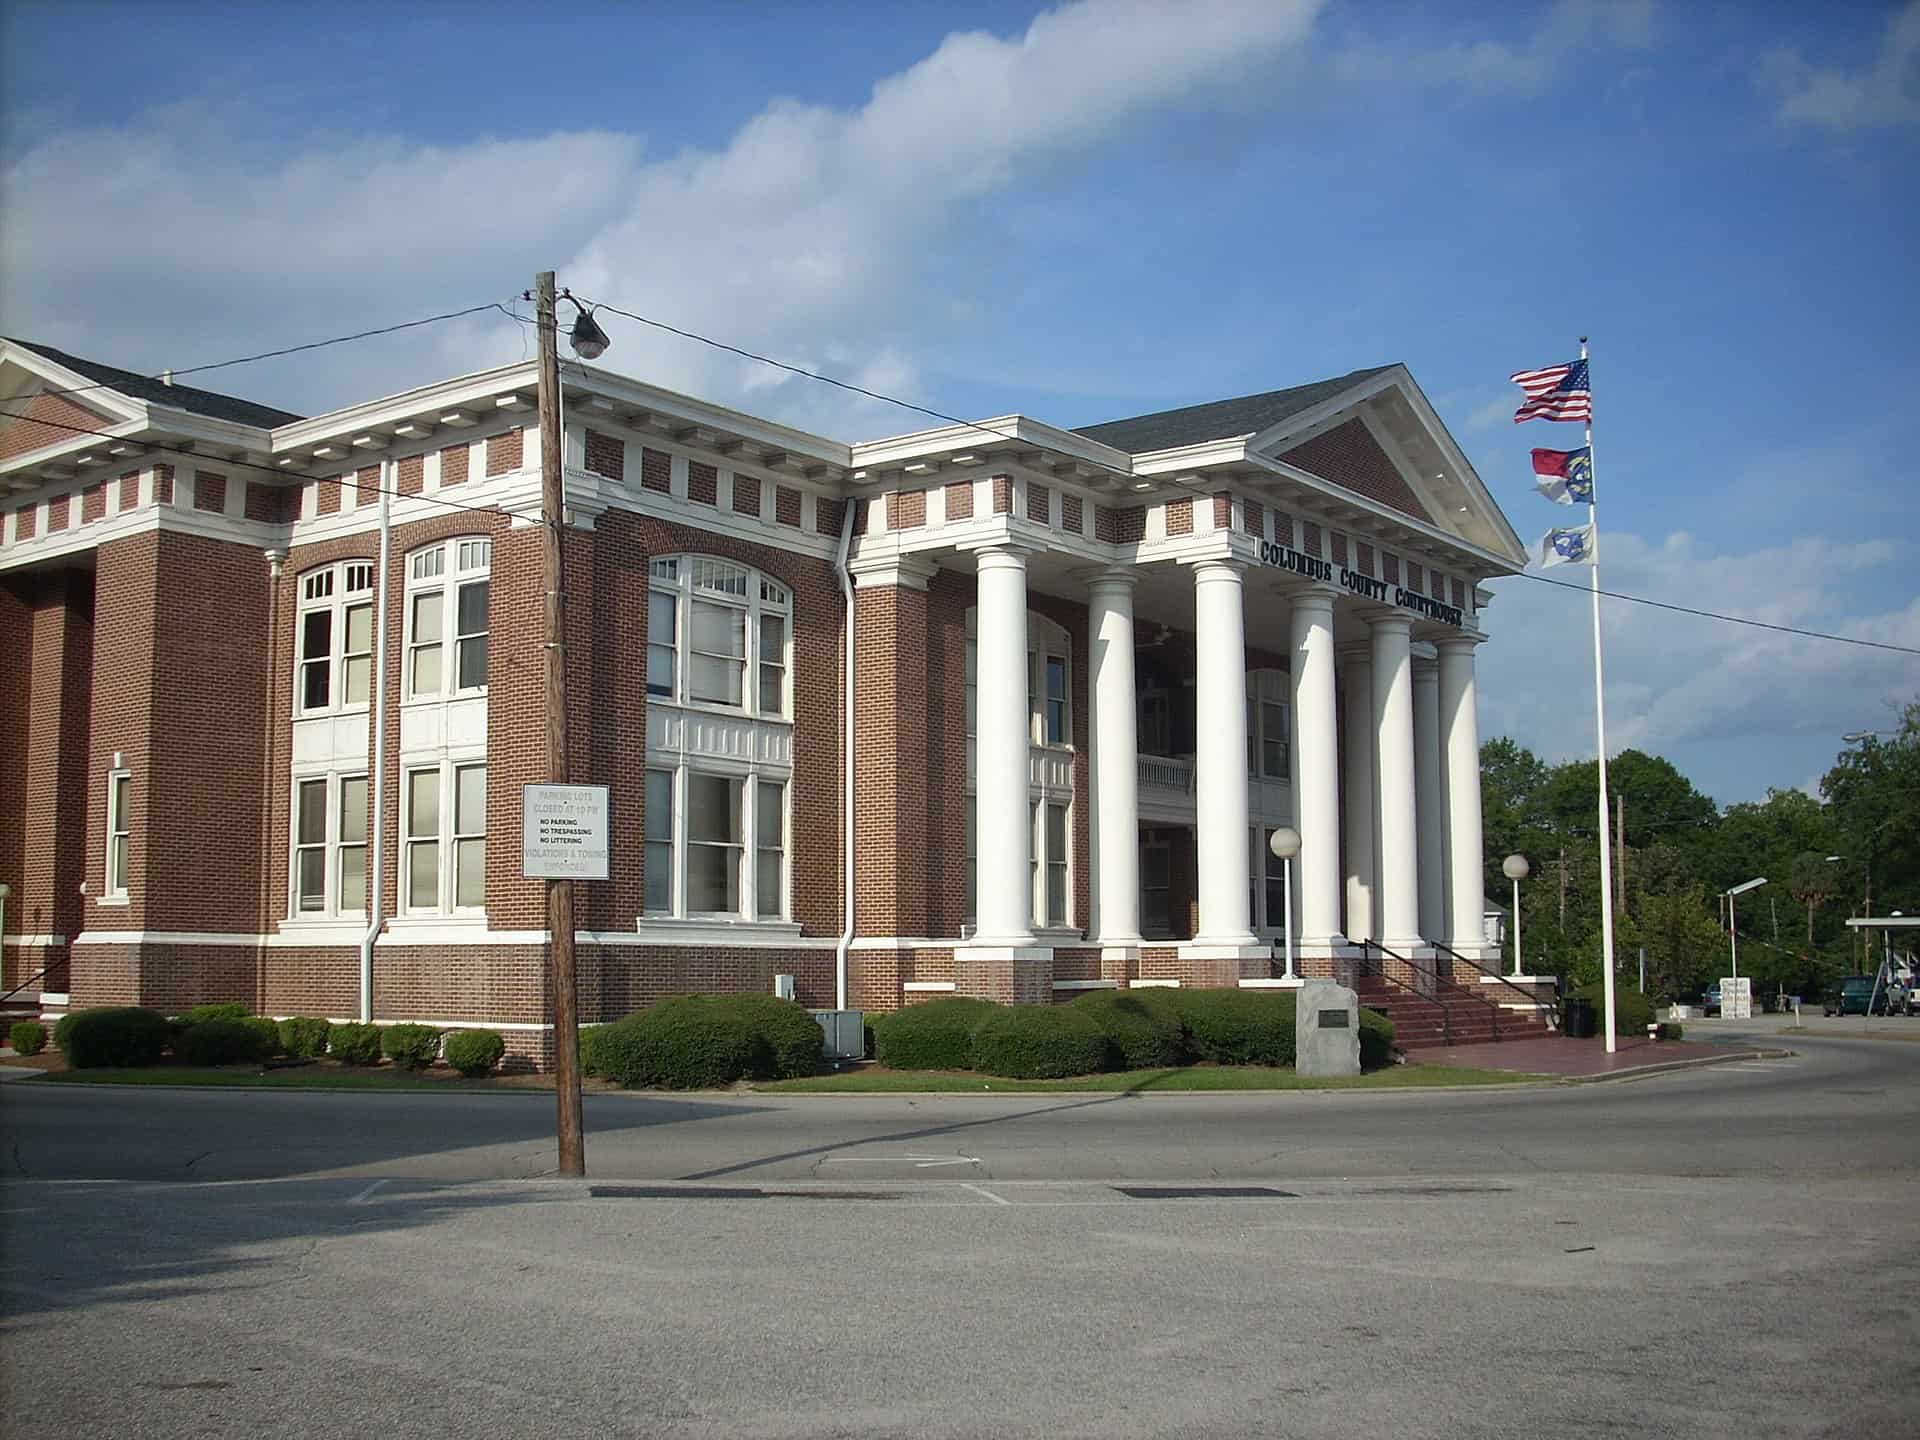
- Median household income: $43,206
- Poverty rate: 21.1%
- 5-yr. avg. unemployment rate: 5.8%
- Population: 50,827
11. Lenoir County

- Median household income: $43,063
- Poverty rate: 22.4%
- 5-yr. avg. unemployment rate: 7.1%
- Population: 55,071
10. Richmond County

- Median household income: $42,354
- Poverty rate: 23.0%
- 5-yr. avg. unemployment rate: 9.5%
- Population: 43,149
9. Warren County
- Median household income: $42,282
- Poverty rate: 21.2%
- 5-yr. avg. unemployment rate: 9.9%
- Population: 18,803
8. Alleghany County

- Median household income: $42,115
- Poverty rate: 19.5%
- 5-yr. avg. unemployment rate: 5.3%
- Population: 10,989
7. Anson County
- Median household income: $42,000
- Poverty rate: 19.3%
- 5-yr. avg. unemployment rate: 6.4%
- Population: 22,200
6. Scotland County
- Median household income: $41,948
- Poverty rate: 26.1%
- 5-yr. avg. unemployment rate: 10.8%
- Population: 34,222
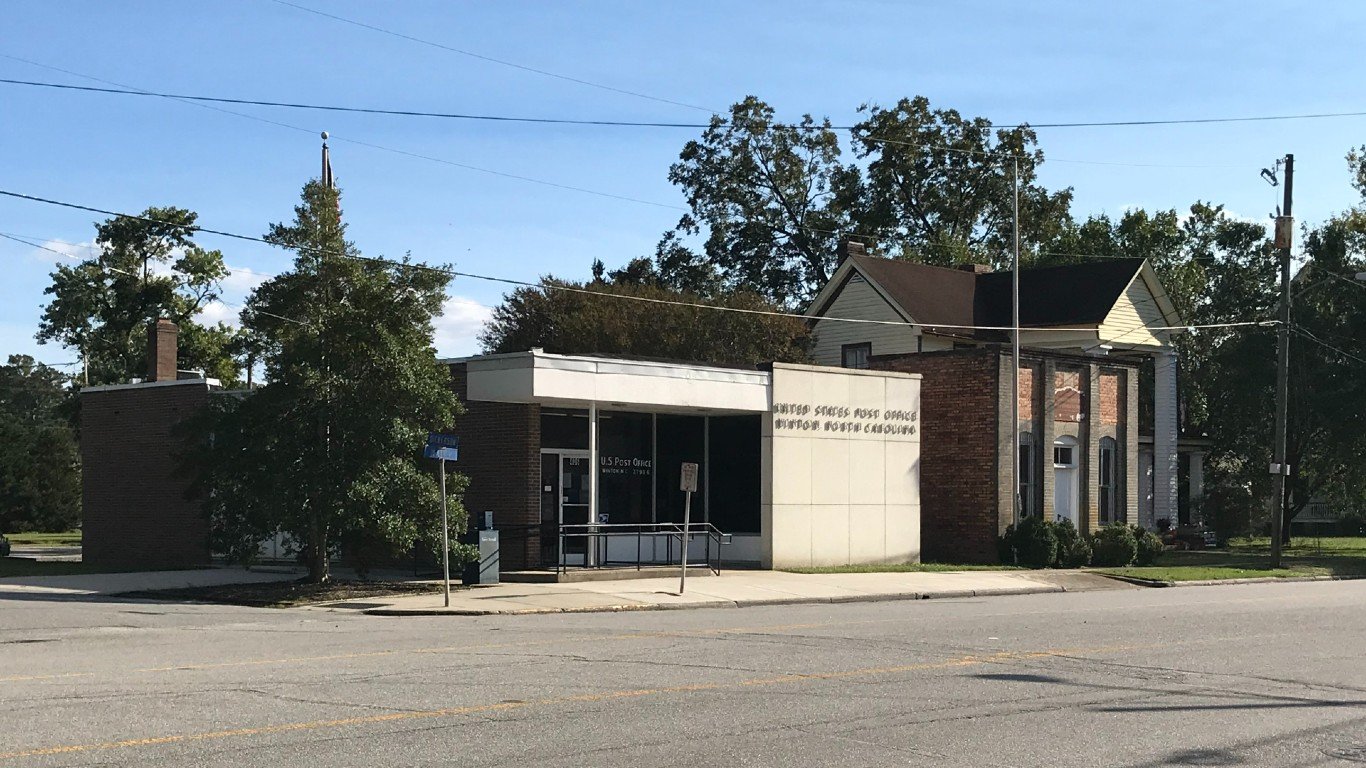
5. Bertie County

- Median household income: $41,652
- Poverty rate: 21.4%
- 5-yr. avg. unemployment rate: 6.4%
- Population: 17,818
4. Halifax County

- Median household income: $41,629
- Poverty rate: 23.9%
- 5-yr. avg. unemployment rate: 9.3%
- Population: 48,772
3. Bladen County
- Median household income: $40,476
- Poverty rate: 24.4%
- 5-yr. avg. unemployment rate: 5.5%
- Population: 29,807
2. Robeson County
- Median household income: $39,393
- Poverty rate: 27.1%
- 5-yr. avg. unemployment rate: 6.3%
- Population: 117,573
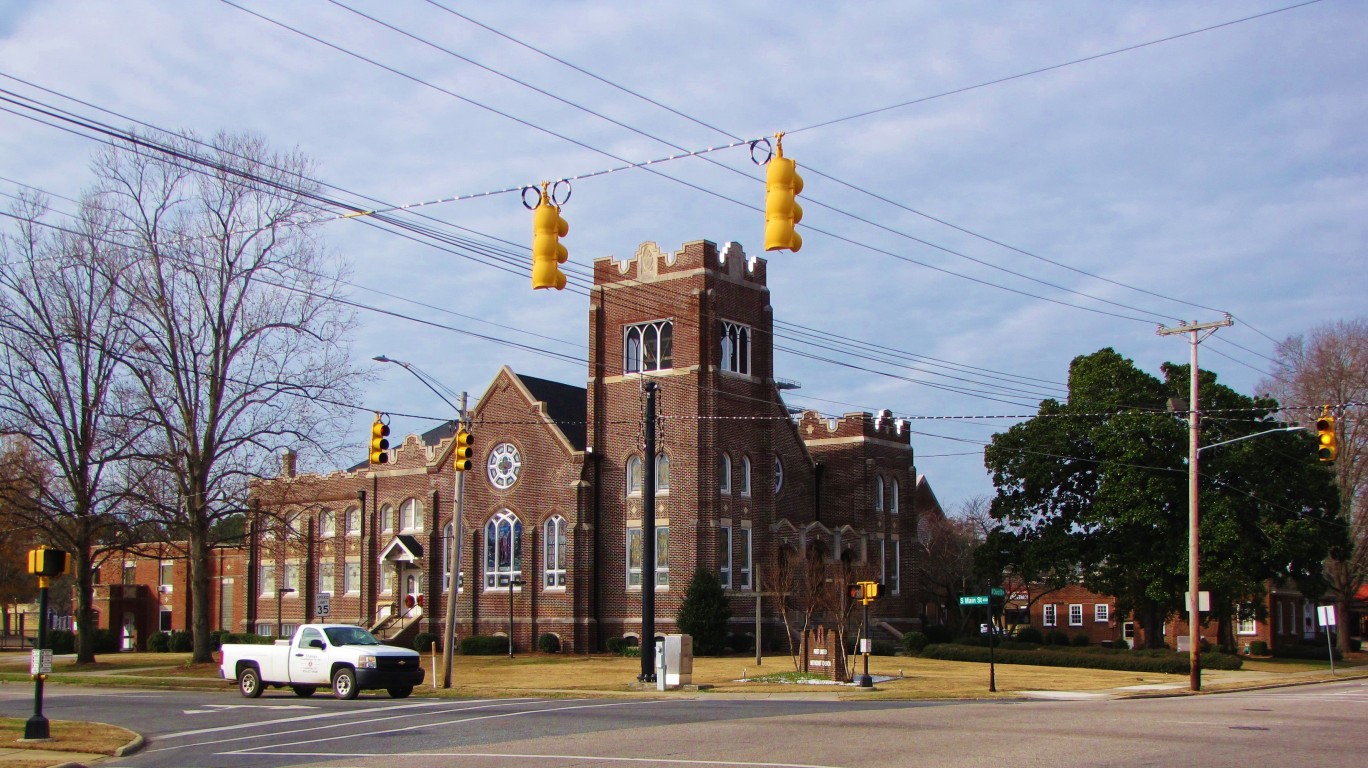
1. Washington County

- Median household income: $38,927
- Poverty rate: 21.6%
- 5-yr. avg. unemployment rate: 12.6%
- Population: 11,051
| Rank | County | Median household income ($) | Poverty rate (%) | 5-yr. avg. unemployment rate (%) |
|---|---|---|---|---|
| 1 | Washington, North Carolina | 38,927 | 21.6 | 12.6 |
| 2 | Robeson, North Carolina | 39,393 | 27.1 | 6.3 |
| 3 | Bladen, North Carolina | 40,476 | 24.4 | 5.5 |
| 4 | Halifax, North Carolina | 41,629 | 23.9 | 9.3 |
| 5 | Bertie, North Carolina | 41,652 | 21.4 | 6.4 |
| 6 | Scotland, North Carolina | 41,948 | 26.1 | 10.8 |
| 7 | Anson, North Carolina | 42,000 | 19.3 | 6.4 |
| 8 | Alleghany, North Carolina | 42,115 | 19.5 | 5.3 |
| 9 | Warren, North Carolina | 42,282 | 21.2 | 9.9 |
| 10 | Richmond, North Carolina | 42,354 | 23.0 | 9.5 |
| 11 | Lenoir, North Carolina | 43,063 | 22.4 | 7.1 |
| 12 | Columbus, North Carolina | 43,206 | 21.1 | 5.8 |
| 13 | Hyde, North Carolina | 43,724 | 29.9 | 8.7 |
| 14 | Martin, North Carolina | 44,799 | 20.5 | 9.6 |
| 15 | Northampton, North Carolina | 45,698 | 18.7 | 7.6 |
| 16 | Graham, North Carolina | 46,010 | 11.3 | 7.7 |
| 17 | Hertford, North Carolina | 46,196 | 20.3 | 7.1 |
| 18 | Edgecombe, North Carolina | 46,370 | 22.0 | 8.6 |
| 19 | Vance, North Carolina | 48,340 | 18.7 | 7.0 |
| 20 | Wilkes, North Carolina | 49,119 | 17.1 | 6.0 |
| 21 | Ashe, North Carolina | 49,176 | 14.1 | 5.1 |
| 22 | Cherokee, North Carolina | 49,254 | 16.7 | 4.9 |
| 23 | Duplin, North Carolina | 49,376 | 18.5 | 5.4 |
| 24 | Wilson, North Carolina | 49,827 | 20.4 | 6.6 |
| 25 | Sampson, North Carolina | 49,963 | 22.3 | 5.7 |
| 26 | Watauga, North Carolina | 50,034 | 24.9 | 9.3 |
| 27 | Greene, North Carolina | 50,320 | 22.6 | 5.5 |
| 28 | Rutherford, North Carolina | 50,512 | 18.4 | 6.0 |
| 29 | Cleveland, North Carolina | 50,723 | 18.4 | 6.4 |
| 30 | Rockingham, North Carolina | 50,737 | 18.8 | 6.5 |
| 31 | Macon, North Carolina | 51,042 | 15.4 | 3.5 |
| 32 | Chowan, North Carolina | 51,188 | 20.9 | 4.3 |
| 33 | Jackson, North Carolina | 51,482 | 19.3 | 5.9 |
| 34 | Caldwell, North Carolina | 52,362 | 13.3 | 5.8 |
| 35 | Surry, North Carolina | 52,743 | 17.9 | 4.8 |
Contact [email protected] for any questions or corrections.