During the first year of the pandemic, only about 27 million Americans moved to a new home. That figure represents a 9% decline from the previous year and is the continuation of a multi-year trend in decreasing mobility rates.
The prevailing narrative is that many of those who moved during the pandemic, did so to leave major cities, partially to reduce their risk of exposure to COVID-19. According to the latest population data from the U.S. Census Bureau, some of the largest cities in the country, including New York, Los Angeles, and Chicago, reported population decline last year – counting both net migration as well as births and deaths.
However, not all cities suffered from population decline in the first year of the pandemic. Many major metropolitan areas have reported substantial population growth during 2020 and 2021.
In the Wilmington metro area, located in North Carolina, the population climbed from 286,623 in July 2020 to 291,833 in July 2021. The 1.8% increase ranks as the 38th highest among all U.S. metro areas.
The local population growth was driven by net migration, as about 5,870 more people moved into the metro area than moved out over the past year. Natural change, meanwhile, detracted from overall growth, as 620 more people died in the metro area than were born over the same period.
| Rank | Metro area | Pop. increase, July 2020 – July 2021 (%) | 2021 population | Net migration, 1-yr. | Natural pop. change, 1-yr. |
|---|---|---|---|---|---|
| 1 | St. George, UT | 5.1 | 191,226 | 9,204 | 237 |
| 2 | Coeur d’Alene, ID | 4.1 | 179,789 | 7,283 | -33 |
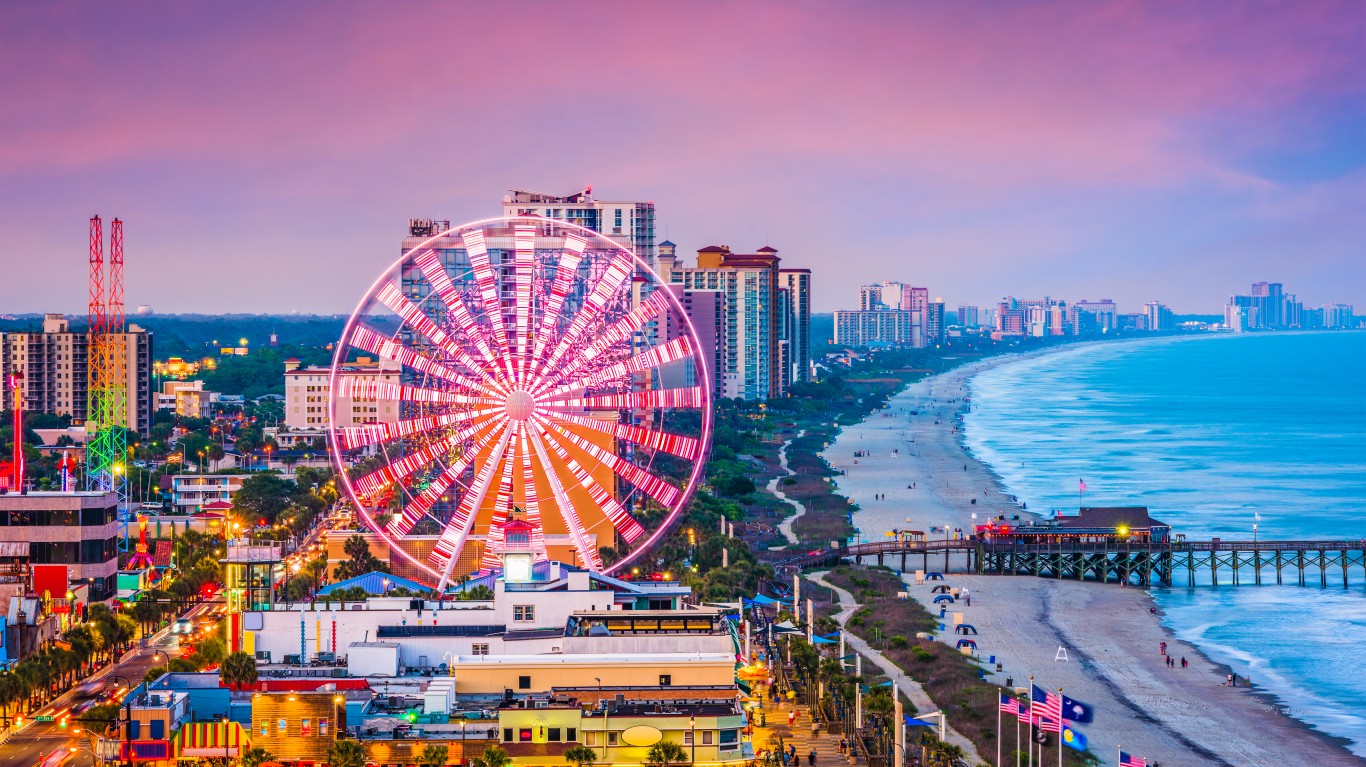
| 3 | Myrtle Beach-Conway-North Myrtle Beach, SC-NC | 3.7 | 509,794 | 21,921 | -3,421 |
| 4 | Punta Gorda, FL | 3.7 | 194,843 | 9,526 | -2,498 |
| 5 | The Villages, FL | 3.6 | 135,638 | 7,105 | -2,253 |
| 6 | Boise City, ID | 3.3 | 795,268 | 24,261 | 1,697 |
| 7 | Lakeland-Winter Haven, FL | 3.3 | 753,520 | 25,517 | -876 |
| 8 | Provo-Orem, UT | 3.3 | 697,141 | 13,912 | 8,332 |
| 9 | Cape Coral-Fort Myers, FL | 3.0 | 787,976 | 26,813 | -3,184 |
| 10 | Logan, UT-ID | 2.9 | 152,083 | 2,846 | 1,458 |
| 11 | Idaho Falls, ID | 2.9 | 162,786 | 3,644 | 921 |
| 12 | Port St. Lucie, FL | 2.8 | 503,521 | 16,645 | -2,698 |
| 13 | Bend, OR | 2.7 | 204,801 | 5,638 | -124 |
| 14 | North Port-Sarasota-Bradenton, FL | 2.7 | 859,760 | 29,691 | -6,643 |
| 15 | Panama City, FL | 2.7 | 179,168 | 5,105 | -330 |
| 16 | Daphne-Fairhope-Foley, AL | 2.6 | 239,294 | 6,843 | -607 |
| 17 | Greeley, CO | 2.6 | 340,036 | 6,730 | 1,993 |
| 18 | Hilton Head Island-Bluffton, SC | 2.4 | 222,072 | 5,757 | -394 |
| 19 | Sherman-Denison, TX | 2.4 | 139,336 | 3,669 | -306 |
| 20 | Homosassa Springs, FL | 2.4 | 158,083 | 5,977 | -2,204 |
| 21 | Naples-Marco Island, FL | 2.4 | 385,980 | 10,724 | -1,725 |
| 22 | Salisbury, MD-DE | 2.3 | 429,223 | 11,748 | -1,803 |
| 23 | Austin-Round Rock-Georgetown, TX | 2.3 | 2,352,426 | 42,541 | 11,145 |
| 24 | Ocala, FL | 2.3 | 385,915 | 11,440 | -2,750 |
| 25 | Prescott Valley-Prescott, AZ | 2.2 | 242,253 | 7,268 | -1,989 |
| 26 | Deltona-Daytona Beach-Ormond Beach, FL | 2.2 | 685,344 | 19,414 | -4,701 |
| 27 | Twin Falls, ID | 2.1 | 116,905 | 2,146 | 268 |
| 28 | Clarksville, TN-KY | 2.1 | 328,304 | 4,596 | 2,150 |
| 29 | Sebastian-Vero Beach, FL | 2.1 | 163,662 | 4,695 | -1,326 |
| 30 | Sebring-Avon Park, FL | 2.0 | 103,296 | 3,213 | -1,096 |
| 31 | Fayetteville-Springdale-Rogers, AR | 2.0 | 560,709 | 9,123 | 2,038 |
| 32 | Raleigh-Cary, NC | 2.0 | 1,448,411 | 23,279 | 4,943 |
| 33 | Spartanburg, SC | 2.0 | 335,864 | 6,632 | -79 |
| 34 | Crestview-Fort Walton Beach-Destin, FL | 2.0 | 293,324 | 5,441 | 260 |
| 35 | Killeen-Temple, TX | 2.0 | 486,101 | 6,112 | 3,182 |
| 36 | Rapid City, SD | 1.9 | 141,979 | 2,469 | 196 |
| 37 | Gainesville, GA | 1.9 | 207,369 | 3,304 | 481 |
| 38 | Wilmington, NC | 1.8 | 291,833 | 5,873 | -621 |
| 39 | Madera, CA | 1.8 | 159,410 | 2,033 | 767 |
| 40 | Huntsville, AL | 1.8 | 502,728 | 8,832 | -70 |
| 41 | Lake Havasu City-Kingman, AZ | 1.7 | 217,692 | 6,045 | -2,350 |
| 42 | Merced, CA | 1.7 | 286,461 | 3,220 | 1,513 |
| 43 | Hinesville, GA | 1.7 | 82,863 | 237 | 1,126 |
| 44 | Jacksonville, FL | 1.6 | 1,637,666 | 25,857 | 621 |
| 45 | Sioux Falls, SD | 1.6 | 281,958 | 3,174 | 1,310 |
| 46 | Winchester, VA-WV | 1.6 | 145,155 | 2,476 | -147 |
| 47 | Phoenix-Mesa-Chandler, AZ | 1.6 | 4,946,145 | 70,097 | 8,142 |
| 48 | Warner Robins, GA | 1.5 | 195,246 | 2,617 | 357 |
| 49 | Barnstable Town, MA | 1.5 | 232,411 | 5,448 | -1,941 |
| 50 | Auburn-Opelika, AL | 1.5 | 177,218 | 2,277 | 330 |