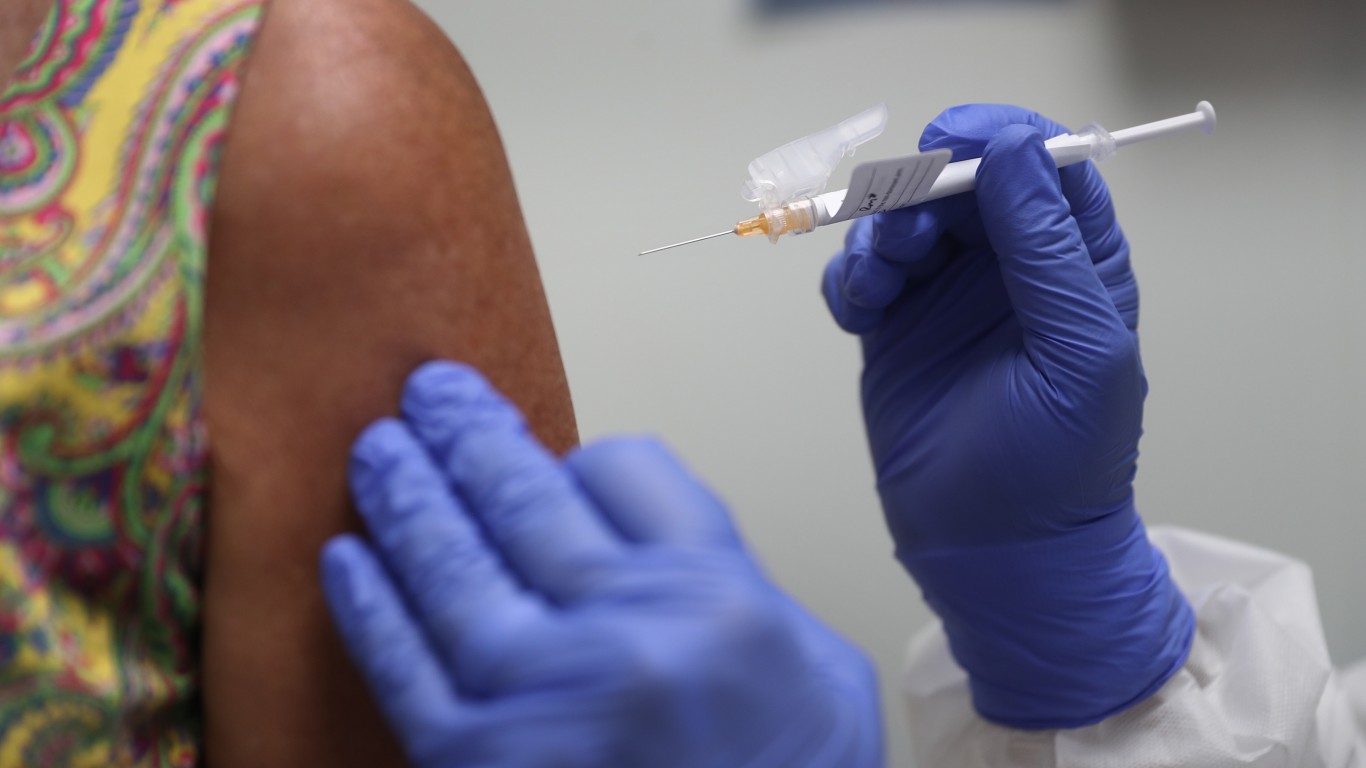

Despite the ongoing vaccination effort, new daily cases of COVID-19 are beginning to rise once again in parts of the United States. To date, 48,551,622 Americans have been infected with the virus — and 779,587 have died as a result. On a per capita basis, the U.S. has one of the highest known infections rates in the world.
In the New York-Newark-Jersey City metropolitan area, which covers parts of New York, New Jersey, and Pennsylvania, a total of 2,919,601 COVID-19 cases have been reported to date. Adjusted for population, there have been 14,605 reported infections for every 100,000 people in the area — in line with the national rate of 14,840 cases per 100,000 people.
Though per capita cases of COVID-19 are closely in line with the national per capita infection rate in New York-Newark-Jersey City, there are still parts of the metro area where the per capita infection rate is relatively low.
The broader New York metro area comprises 25 counties or county equivalents — and of them, Hunterdon County in New Jersey has the fewest COVID-19 cases per capita. So far, there have been a total of 13,103 infections in Hunterdon County, or 10,478 for every 100,000 people.
Not only does Hunterdon County have the lowest per capita infection rate in the New York metro area, it also has a relatively low per capita fatality rate.
There have been a total of 157 coronavirus-related deaths for every 100,000 people in Hunterdon County, below the 344 COVID-19 deaths per 100,000 across the entire New York-Newark-Jersey City metro area.
All COVID-19 data used in this story are current as of Dec. 6, 2021.
| Rank | Geography | COVID cases per 100,000 people | Total cases | Deaths per 100,000 people | Total deaths |
|---|---|---|---|---|---|
| 1 | Hunterdon County, NJ | 10,478 | 13,103 | 157 | 196 |
| 2 | New York County, NY | 10,884 | 177,677 | 286 | 4,667 |
| 3 | Pike County, PA | 11,031 | 6,122 | 126 | 70 |
| 4 | Somerset County, NJ | 11,100 | 36,651 | 269 | 888 |
| 5 | Morris County, NJ | 12,513 | 61,863 | 267 | 1,322 |
| 6 | Dutchess County, NY | 13,004 | 38,218 | 175 | 513 |
| 7 | Putnam County, NY | 13,373 | 13,249 | 102 | 101 |
| 8 | Middlesex County, NJ | 13,425 | 110,982 | 302 | 2,495 |
| 9 | Bergen County, NJ | 13,442 | 125,013 | 325 | 3,021 |
| 10 | Sussex County, NJ | 13,456 | 19,148 | 249 | 355 |
| 11 | Kings County, NY | 13,506 | 351,246 | 422 | 10,979 |
| 12 | Essex County, NJ | 13,893 | 110,247 | 401 | 3,180 |
| 13 | Queens County, NY | 14,272 | 328,046 | 453 | 10,423 |
| 14 | Bronx County, NY | 14,877 | 213,906 | 474 | 6,811 |
| 15 | Union County, NJ | 14,911 | 82,467 | 372 | 2,057 |
| 16 | Hudson County, NJ | 15,008 | 100,349 | 360 | 2,409 |
| 17 | Westchester County, NY | 15,355 | 148,765 | 243 | 2,356 |
| 18 | Monmouth County, NJ | 15,848 | 98,795 | 286 | 1,783 |
| 19 | Orange County, NY | 16,571 | 62,677 | 250 | 944 |
| 20 | Nassau County, NY | 16,782 | 227,654 | 246 | 3,336 |
| 21 | Passaic County, NJ | 16,816 | 84,762 | 404 | 2,038 |
| 22 | Rockland County, NY | 17,217 | 55,730 | 242 | 783 |
| 23 | Ocean County, NJ | 17,281 | 102,295 | 407 | 2,407 |
| 24 | Suffolk County, NY | 17,300 | 257,408 | 248 | 3,694 |
| 25 | Richmond County, NY | 19,664 | 93,228 | 416 | 1,974 |
Take This Retirement Quiz To Get Matched With A Financial Advisor (Sponsored)
Take the quiz below to get matched with a financial advisor today.
Each advisor has been vetted by SmartAsset and is held to a fiduciary standard to act in your best interests.
Here’s how it works:
1. Answer SmartAsset advisor match quiz
2. Review your pre-screened matches at your leisure. Check out the
advisors’ profiles.
3. Speak with advisors at no cost to you. Have an introductory call on the phone or introduction in person and choose whom to work with in the future
Take the retirement quiz right here.
Thank you for reading! Have some feedback for us?
Contact the 24/7 Wall St. editorial team.


