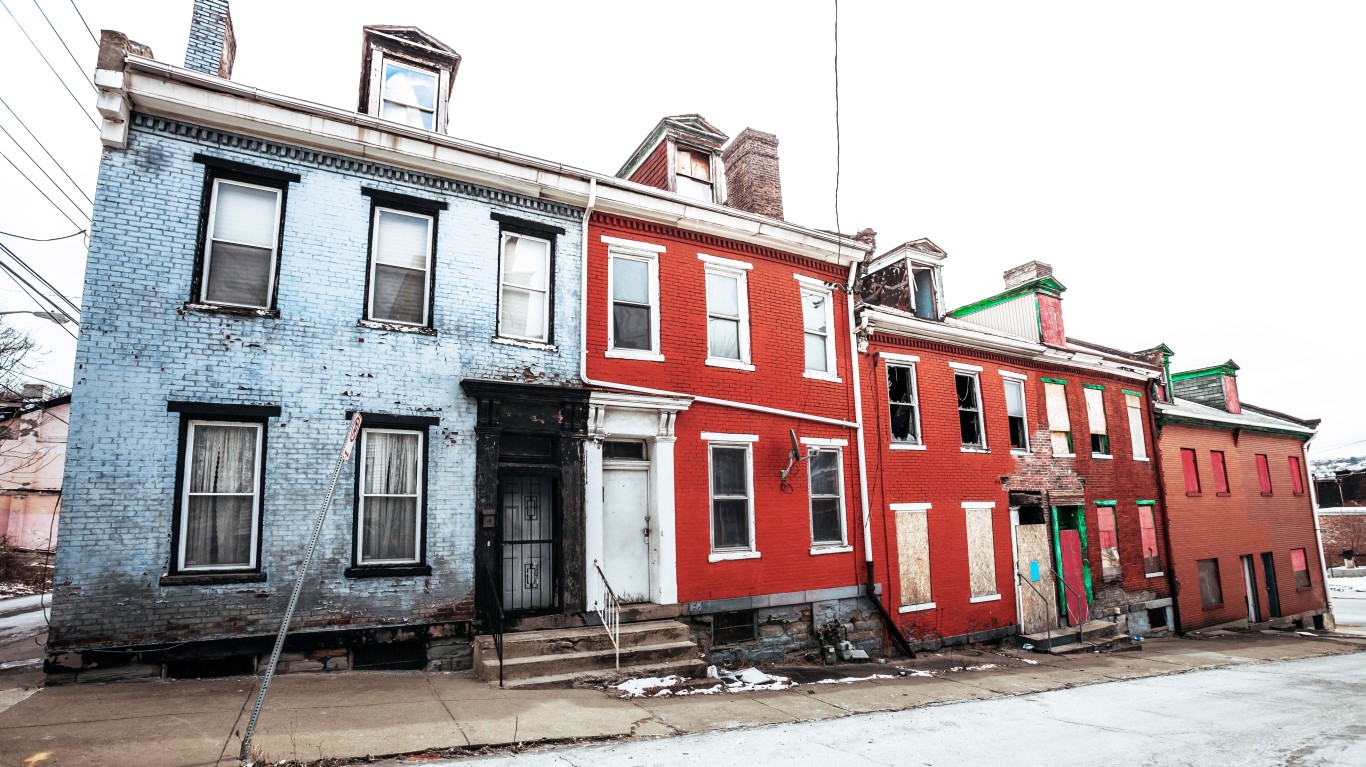
During the first two pandemic years, housing prices soared in many cities nationwide. Though interest rates began to rise in early 2022, somewhat cooling the U.S. housing market, housing prices in many markets remain high and often unaffordable, especially with high mortgage rates. So which cities have the most expensive houses?
To answer that, 24/7 Wall St. reviewed real estate listing website Realtor.com’s monthly inventory metro data. While Realtor.com has over 920 markets, we only considered cities with a population of 25,000 or more. Here we listed the 50 cities where homes had the highest median listing prices in February 2024. Median listing price in February 2023 and median listing price per square foot also came from Realtor.com. From the Census Bureau’s American Community Survey five-year estimates for 2022, we added median household income, the percentage of households earning more than $200,000 a year, and population.
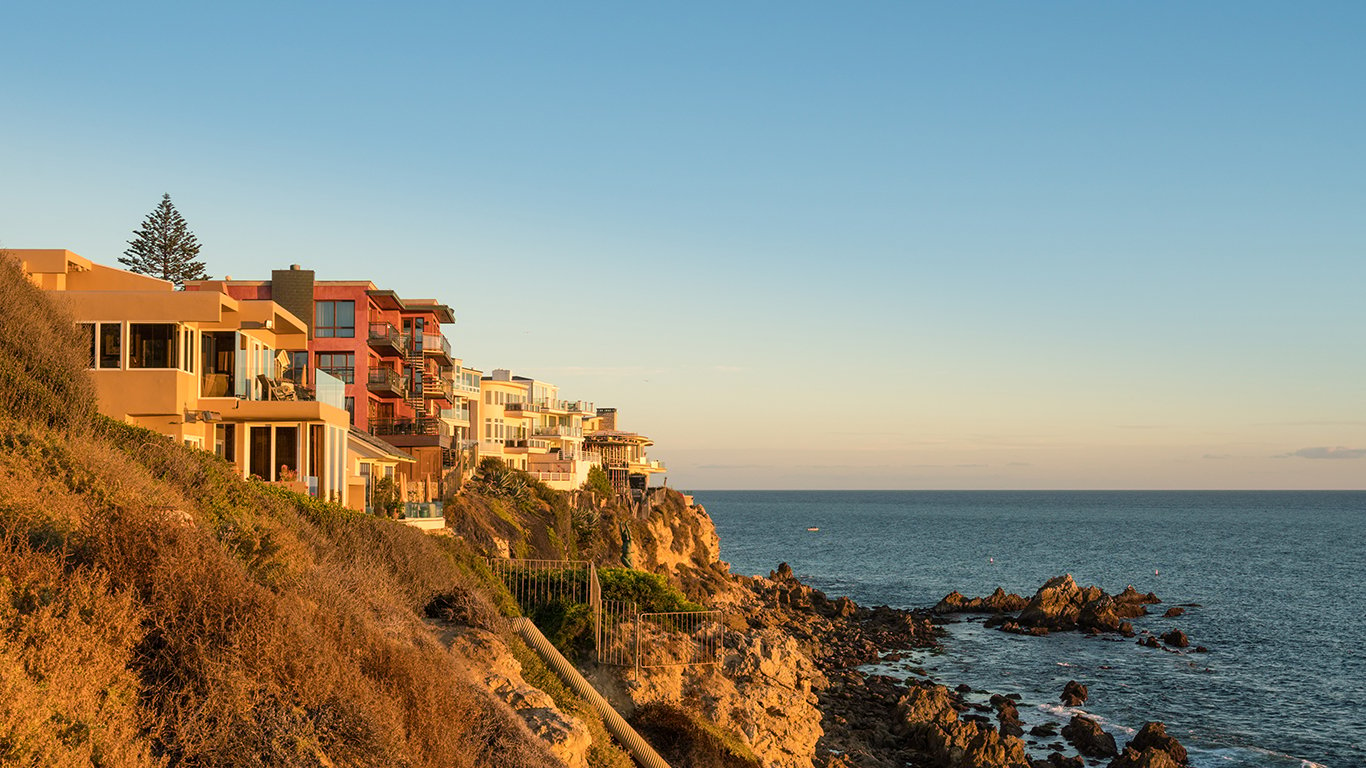
Because of our population threshold, the cities on the list do not include several small towns, such as Vineyard Haven, Massachusetts. The small city of less than 2,500 residents is located on the island of Martha’s Vineyard, known for its tourism and wealthy seasonal visitors. In contrast, the year-round residents are far less wealthy, though the median listing price there was over $2.7 million in February. This is the case in several cities, some on the list, that are seasonal vacation spots for wealthier visitors. (Also see: This Is the Hottest Housing Market in America.)
Among the cities on the list, the median listing price ranges from nearly $585,000 to over $1.7 million — well above the national median listing price of $415,500 in February. While the cities span the country, 13 are in California, including Los Angeles and San Francisco. Five cities in Washington state also made the list, as well as four in Montana, and three each in Hawaii, Colorado, Idaho, and Florida. Clearly, the West region is more represented. However, Boston and New York City are also on the list.
Despite how expensive housing is in the cities on the list, 13 have median household income lower than the comparable national median of $75,149. Also, in 21 markets, less than 11.4% of households earn $200,000 annually, the national average.
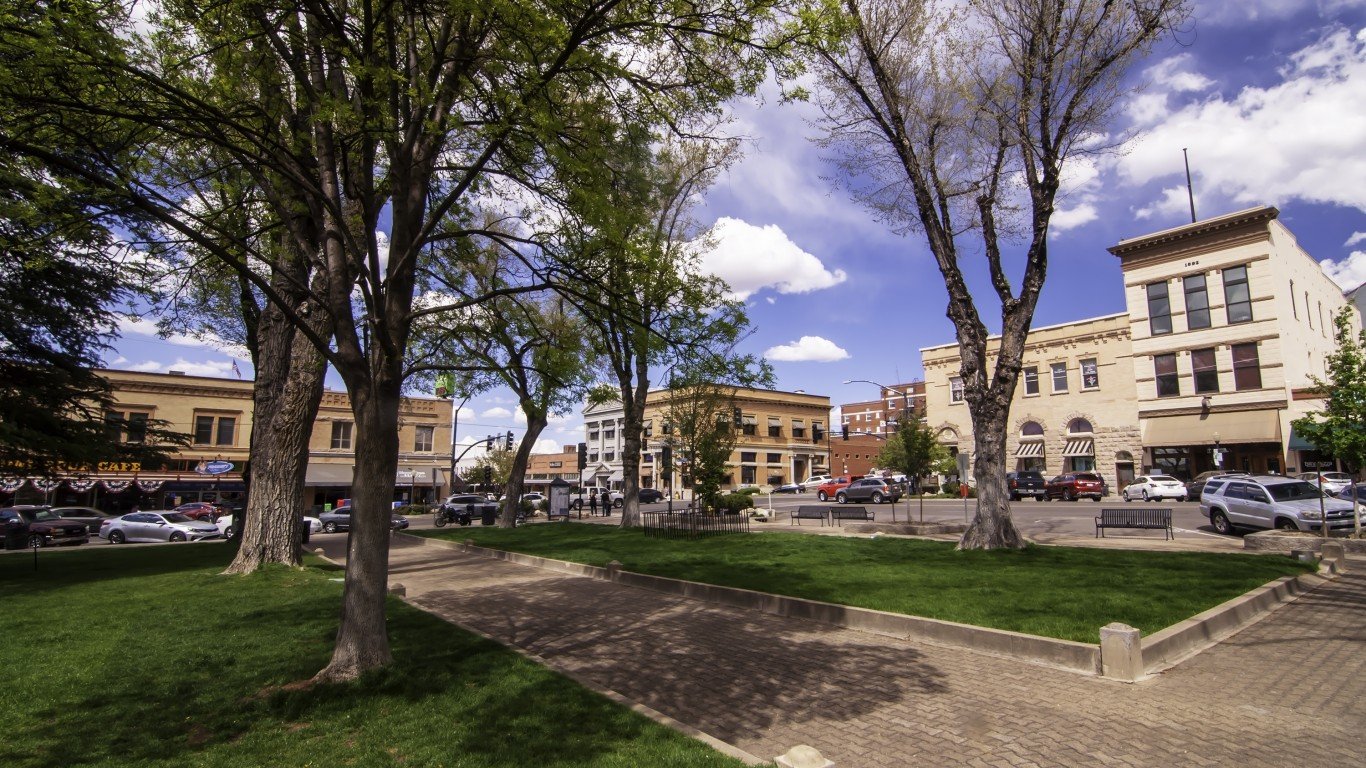
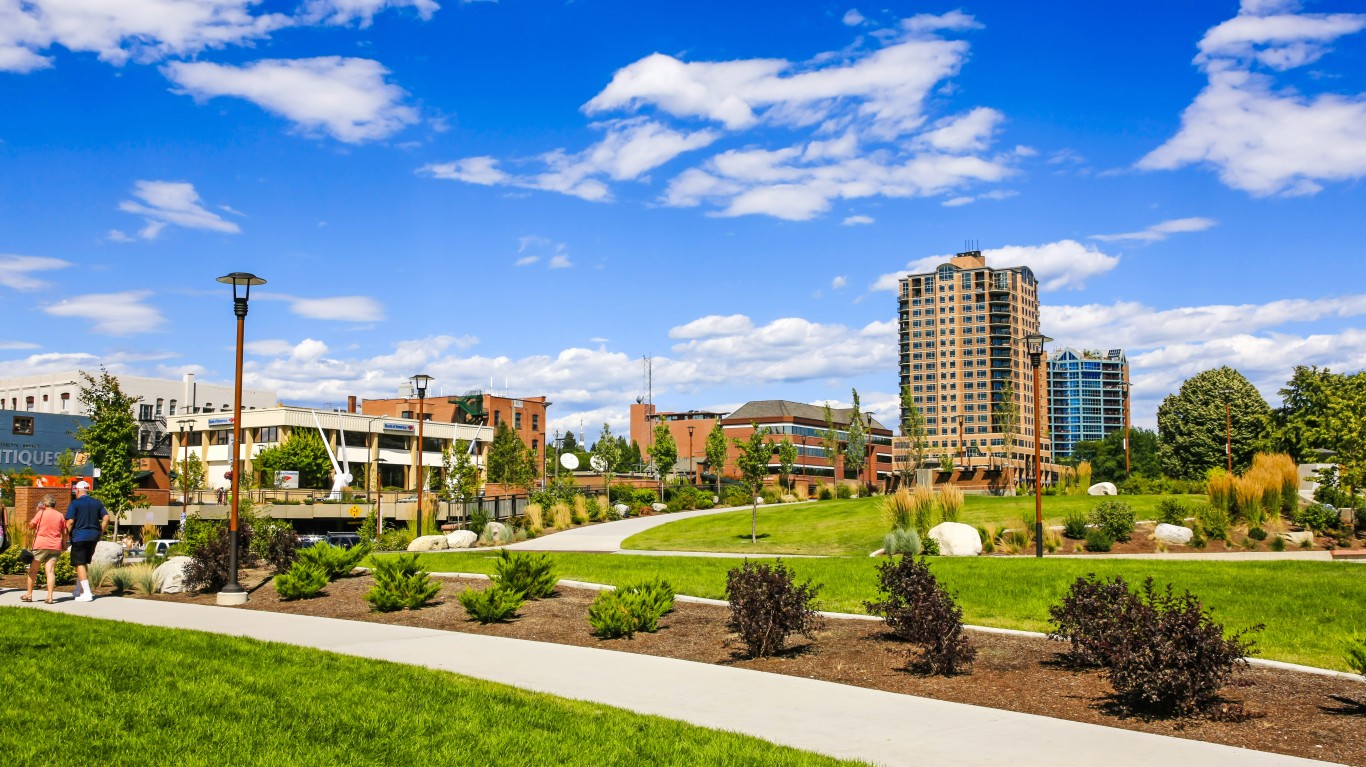
50. Helena, Montana

Source: Ultima_Gaina / iStock via Getty Images
- Median listing price, Feb 2024: $584,950 (+1.0% from Feb 2023)
- Median listing price, Feb 2023: $579,450 — #48 highest of 464 markets
- Median listing price per sq ft, Feb 2024: $291 — #59 highest of 464 markets
- Median households income, 2022: $64,798 — #247 highest of 464 markets
- Pct households making over $200,000: 7.7% (compared to 11.4% nationwide)
- Population, 2022: 32,529
49. Bremerton-Silverdale-Port Orchard, Washington

Source: jmoor17 / iStock via Getty Images
- Median listing price, Feb 2024: $588,598 (+6.1% from Feb 2023)
- Median listing price, Feb 2023: $555,000 — #57 highest of 464 markets
- Median listing price per sq ft, Feb 2024: $289 — #62 highest of 464 markets
- Median households income, 2022: $93,675 — #22 highest of 464 markets
- Pct households making over $200,000: 13.6% (compared to 11.4% nationwide)
- Population, 2022: 275,411
48. Boise City, Idaho

Source: Seibel Photography LLC / iStock via Getty Images
- Median listing price, Feb 2024: $589,900 (+6.8% from Feb 2023)
- Median listing price, Feb 2023: $552,495 — #59 highest of 464 markets
- Median listing price per sq ft, Feb 2024: $285 — #65 highest of 464 markets
- Median households income, 2022: $78,138 — #89 highest of 464 markets
- Pct households making over $200,000: 9.4% (compared to 11.4% nationwide)
- Population, 2022: 771,602
47. Corvallis, Oregon
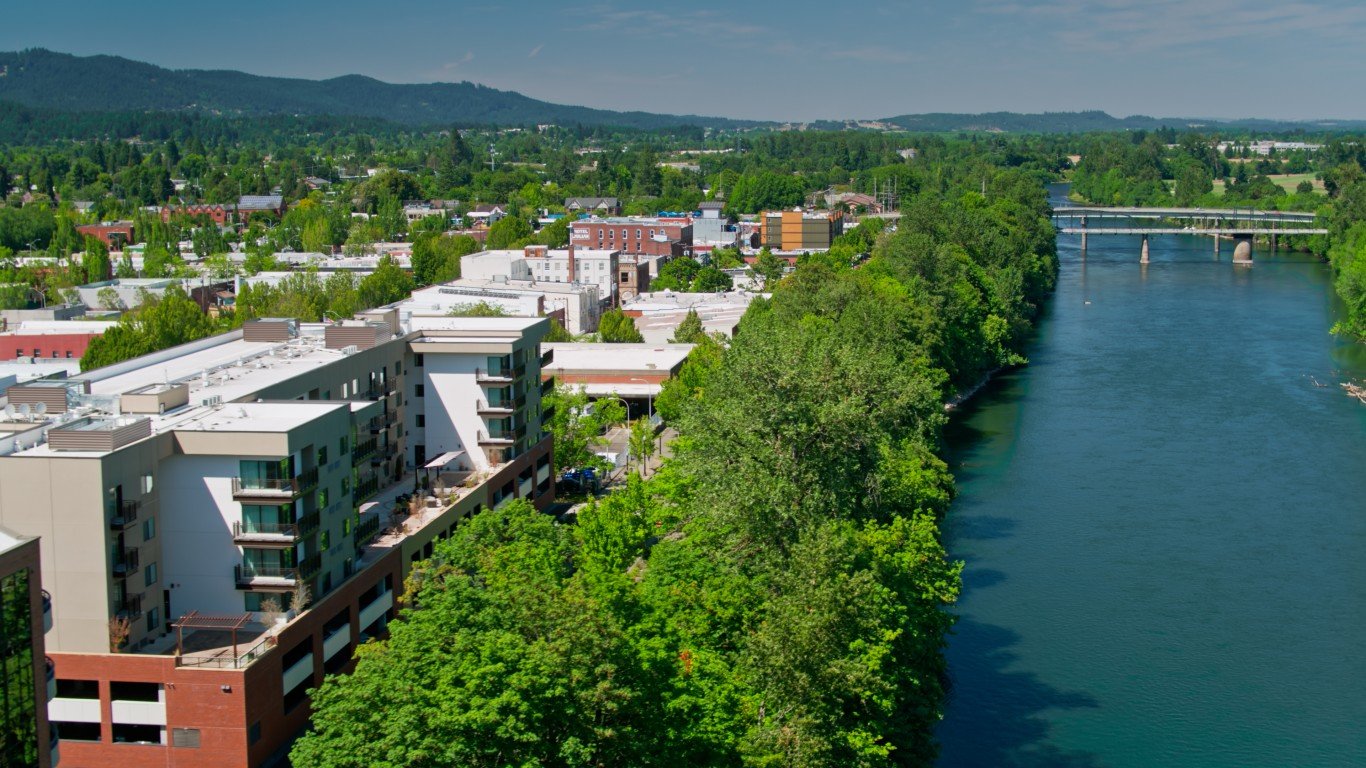
Source: halbergman / iStock via Getty Images
- Median listing price, Feb 2024: $591,728 (+4.7% from Feb 2023)
- Median listing price, Feb 2023: $565,001 — #52 highest of 464 markets
- Median listing price per sq ft, Feb 2024: $298 — #56 highest of 464 markets
- Median households income, 2022: $72,882 — #133 highest of 464 markets
- Pct households making over $200,000: 10.2% (compared to 11.4% nationwide)
- Population, 2022: 95,615
46. Riverside-San Bernardino-Ontario, California
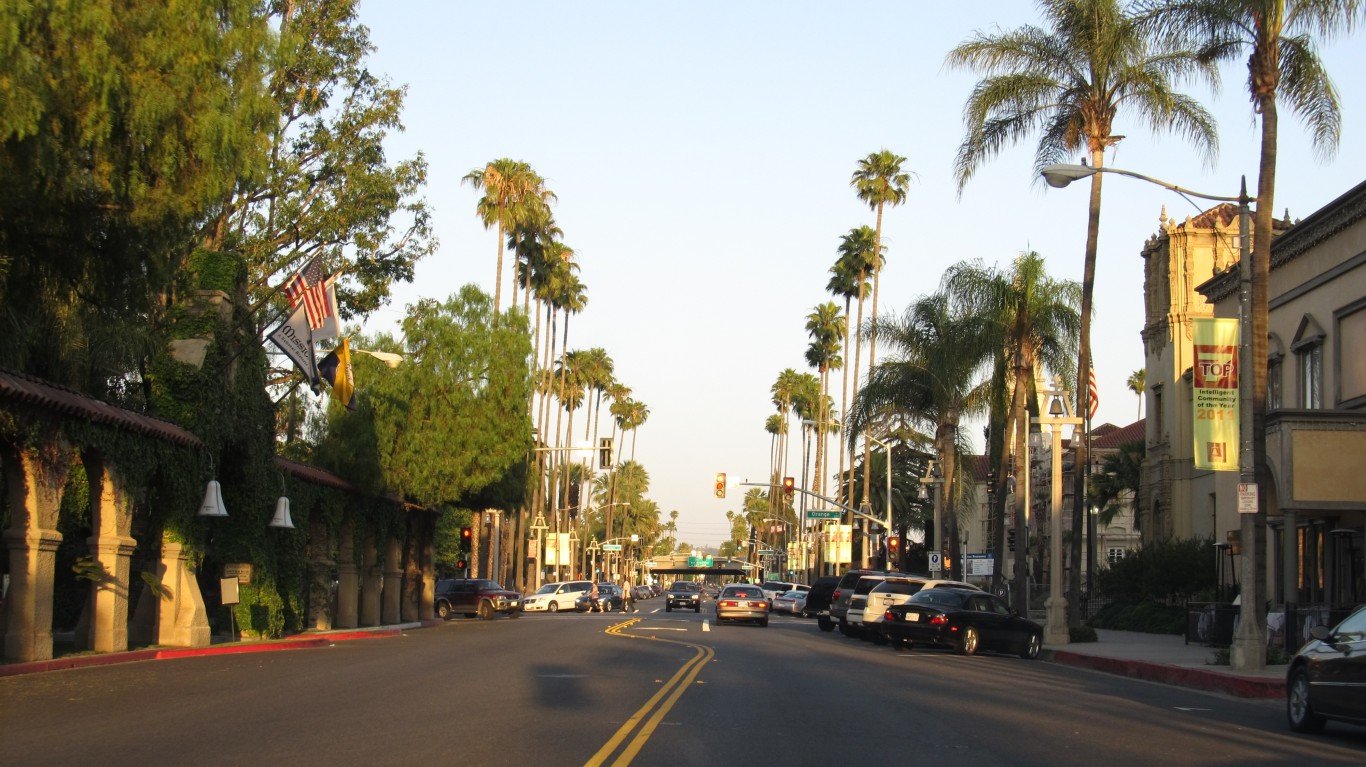
Source: kenlund / Flickr
- Median listing price, Feb 2024: $595,000 (+6.3% from Feb 2023)
- Median listing price, Feb 2023: $559,900 — #55 highest of 464 markets
- Median listing price per sq ft, Feb 2024: $339 — #40 highest of 464 markets
- Median households income, 2022: $81,041 — #72 highest of 464 markets
- Pct households making over $200,000: 11.0% (compared to 11.4% nationwide)
- Population, 2022: 4,610,050
45. Washington-Arlington-Alexandria, DC-VA-MD-WV

Source: LUNAMARINA / iStock via Getty Images
- Median listing price, Feb 2024: $599,000 (+2.5% from Feb 2023)
- Median listing price, Feb 2023: $584,681 — #46 highest of 464 markets
- Median listing price per sq ft, Feb 2024: $318 — #46 highest of 464 markets
- Median households income, 2022: $119,803 — #3 highest of 464 markets
- Pct households making over $200,000: 25.4% (compared to 11.4% nationwide)
- Population, 2022: 6,346,083
44. Torrington, Connecticut
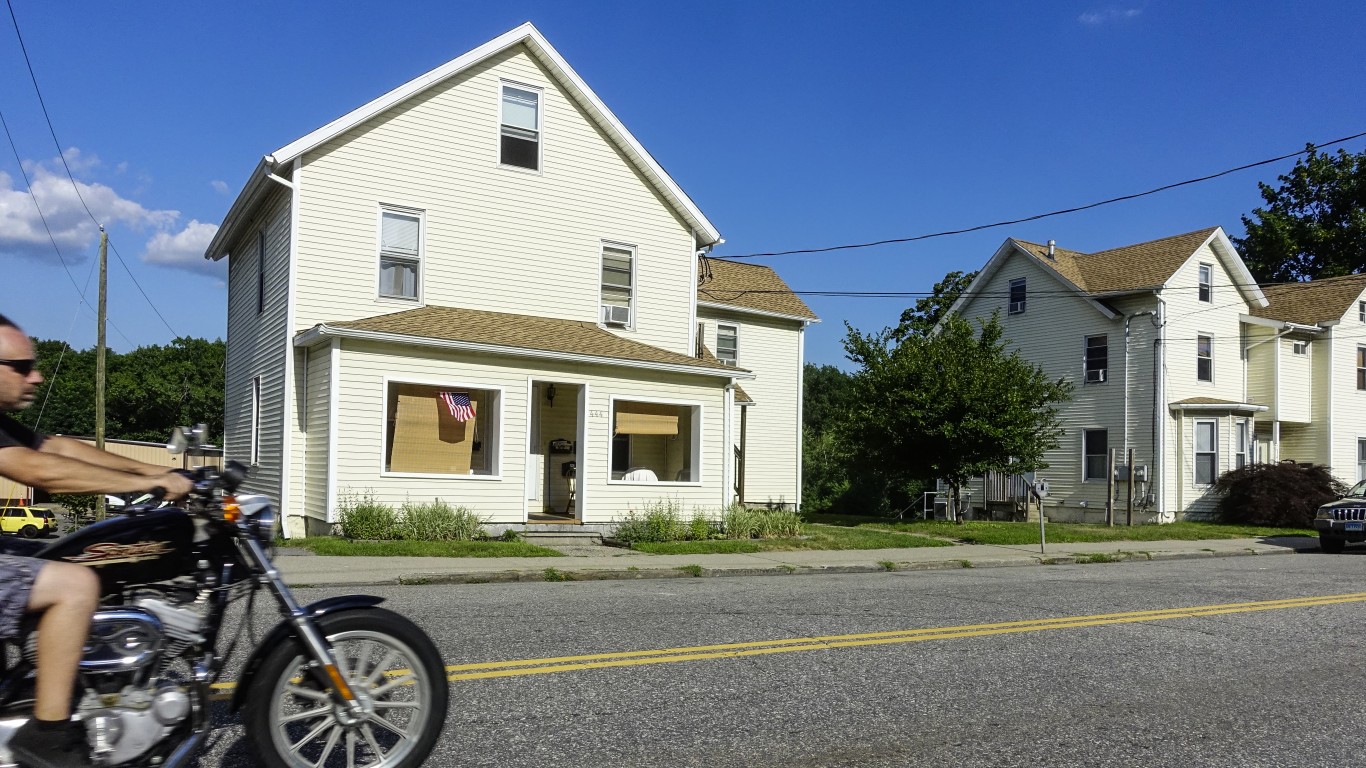
Source: Alexander Farnsworth / iStock Editorial via Getty Images
- Median listing price, Feb 2024: $599,975 (+0.3% from Feb 2023)
- Median listing price, Feb 2023: $598,500 — #44 highest of 464 markets
- Median listing price per sq ft, Feb 2024: $265 — #83 highest of 464 markets
- Median households income, 2022: $66,616 — #226 highest of 464 markets
- Pct households making over $200,000: 5.2% (compared to 11.4% nationwide)
- Population, 2022: 35,510
43. Portland-Vancouver-Hillsboro, OR-WA
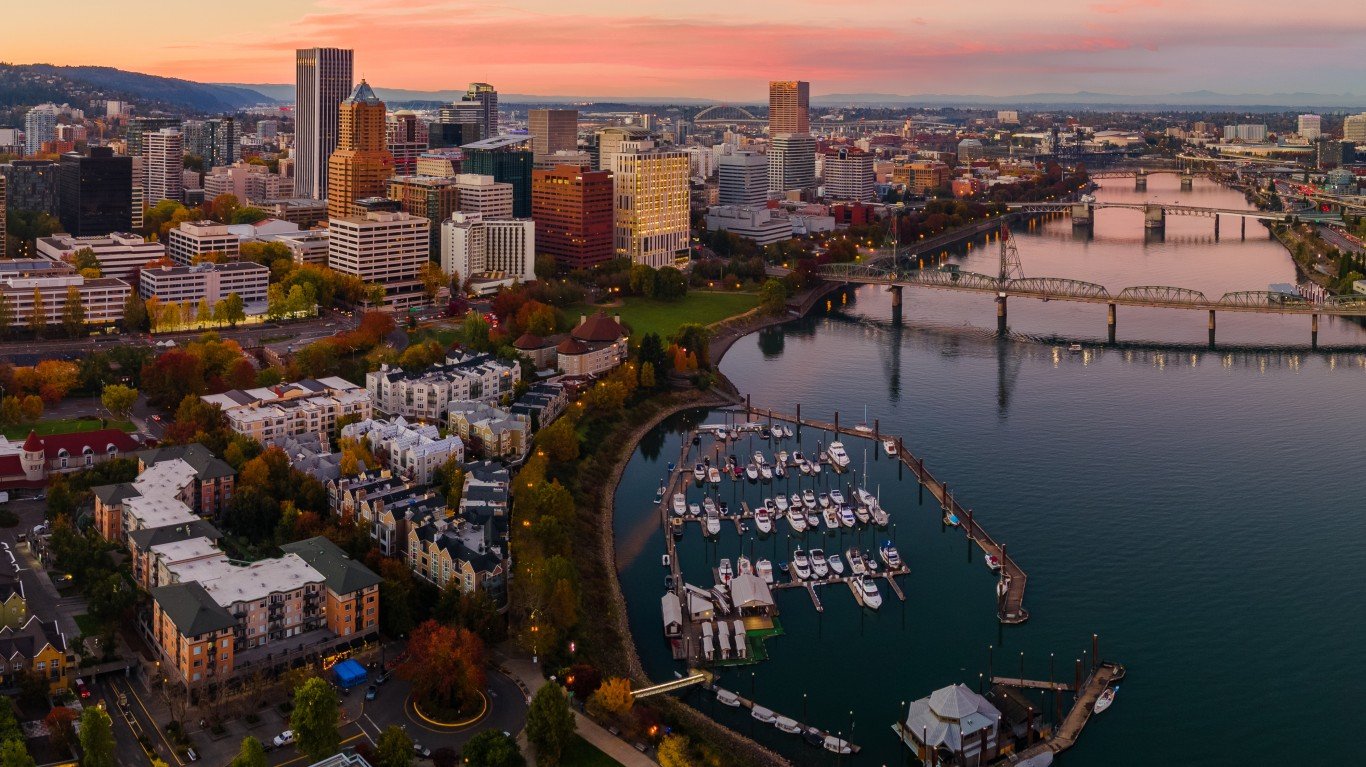
Source: jbentley09 / iStock via Getty Images
- Median listing price, Feb 2024: $600,000 (-1.2% from Feb 2023)
- Median listing price, Feb 2023: $607,050 — #37 highest of 464 markets
- Median listing price per sq ft, Feb 2024: $321 — #45 highest of 464 markets
- Median households income, 2022: $90,451 — #33 highest of 464 markets
- Pct households making over $200,000: 14.1% (compared to 11.4% nationwide)
- Population, 2022: 2,505,312
42. Moscow, Idaho
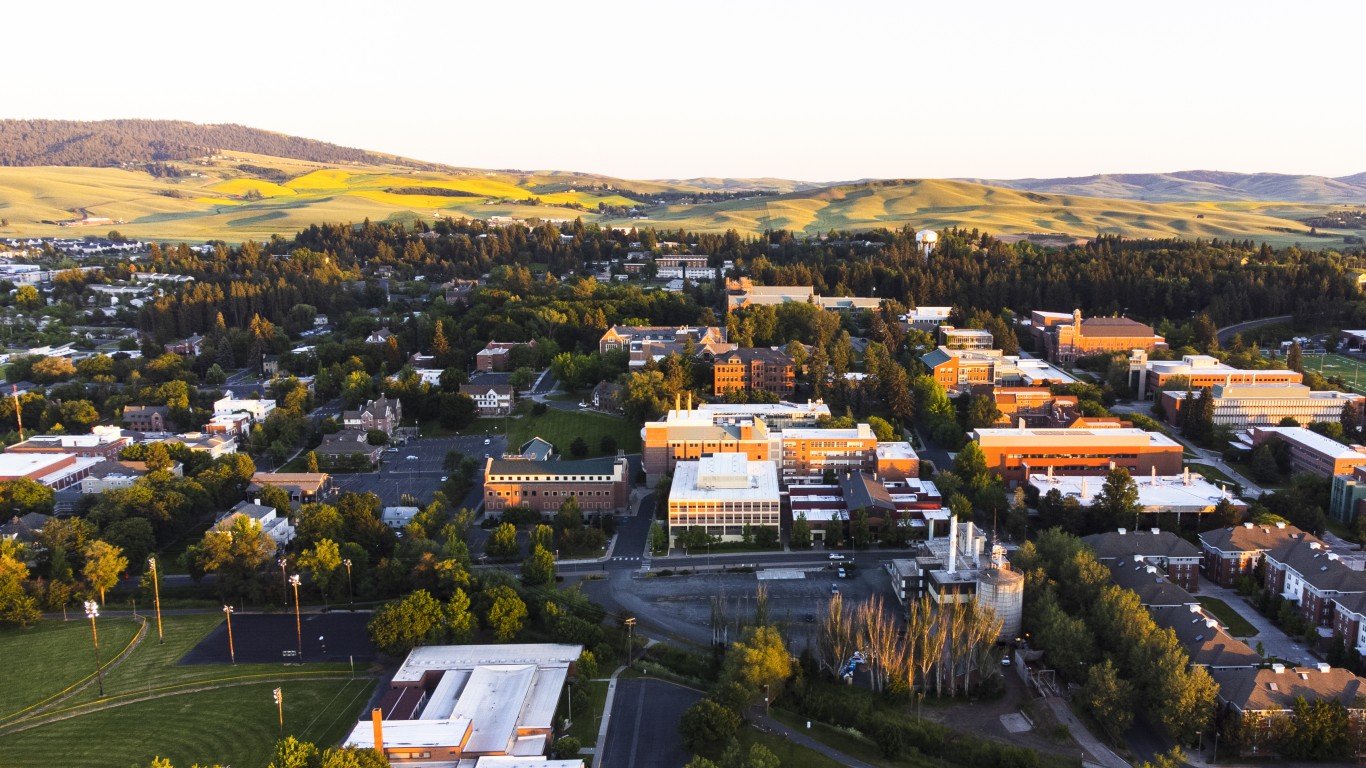
Source: Shunyu Fan / iStock via Getty Images
- Median listing price, Feb 2024: $601,500 (+20.4% from Feb 2023)
- Median listing price, Feb 2023: $499,750 — #75 highest of 464 markets
- Median listing price per sq ft, Feb 2024: $271 — #77 highest of 464 markets
- Median households income, 2022: $53,679 — #405 highest of 464 markets
- Pct households making over $200,000: 4.1% (compared to 11.4% nationwide)
- Population, 2022: 25,616
41. Portland-South Portland, Maine
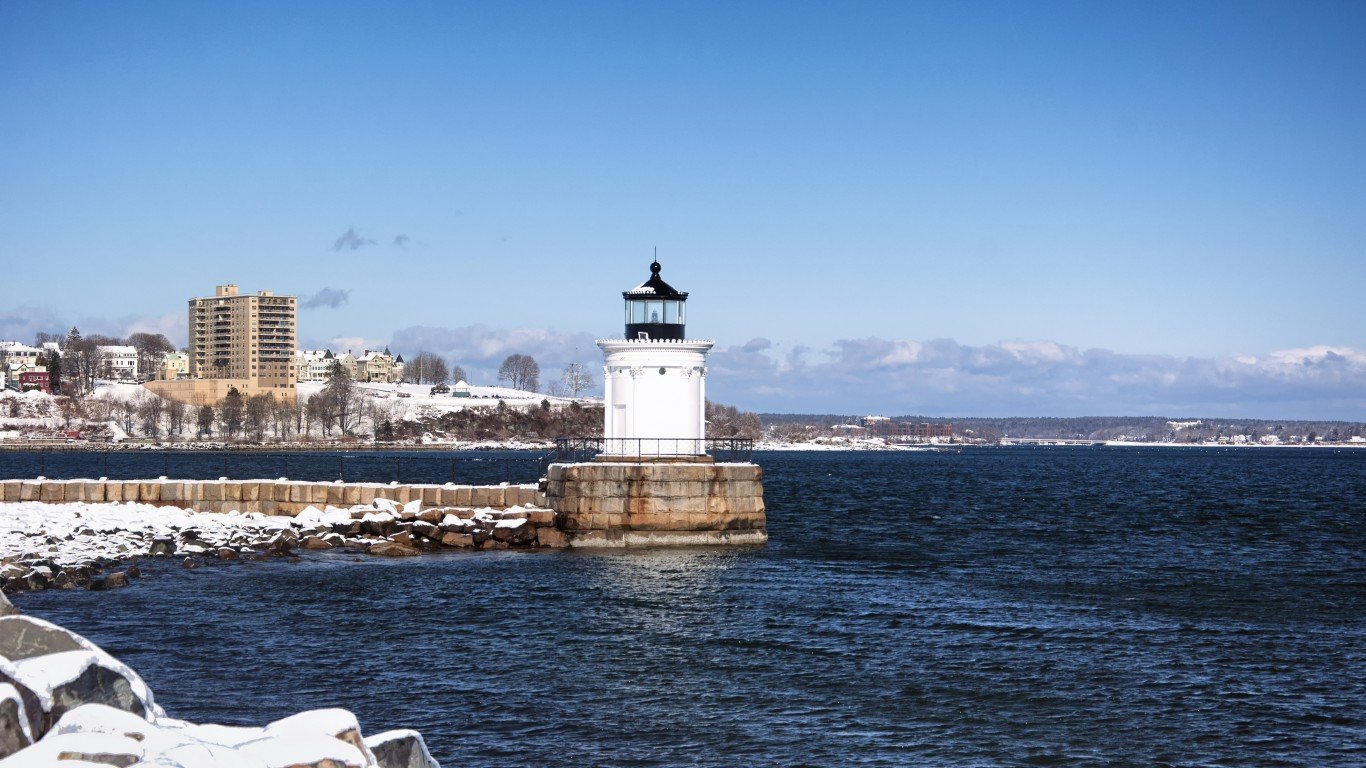
Source: Daniel Hanscom / iStock via Getty Images
- Median listing price, Feb 2024: $604,900 (+2.5% from Feb 2023)
- Median listing price, Feb 2023: $590,000 — #45 highest of 464 markets
- Median listing price per sq ft, Feb 2024: $363 — #32 highest of 464 markets
- Median households income, 2022: $84,095 — #53 highest of 464 markets
- Pct households making over $200,000: 11.0% (compared to 11.4% nationwide)
- Population, 2022: 552,916
40. Denver-Aurora-Lakewood, Colorado
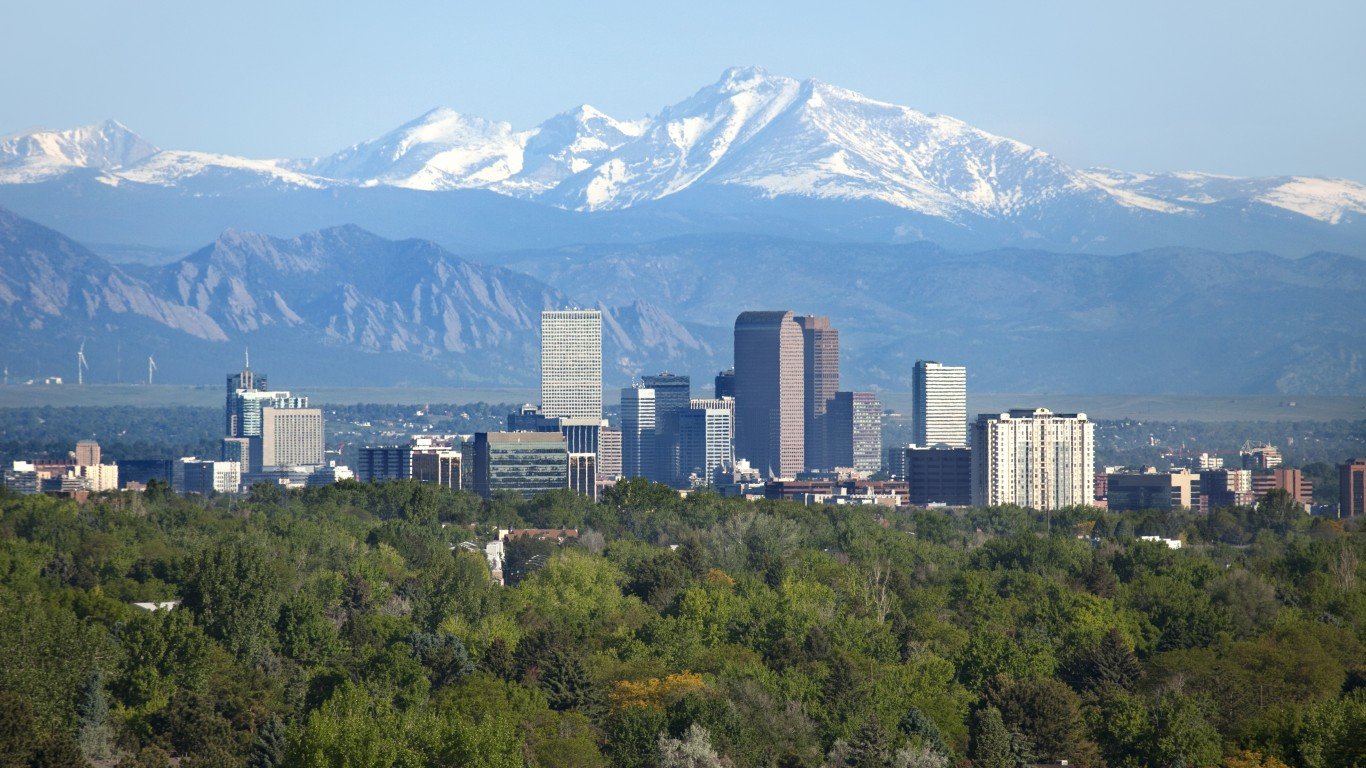
Source: milehightraveler / iStock via Getty Images
- Median listing price, Feb 2024: $609,625 (-3.6% from Feb 2023)
- Median listing price, Feb 2023: $632,475 — #34 highest of 464 markets
- Median listing price per sq ft, Feb 2024: $310 — #48 highest of 464 markets
- Median households income, 2022: $96,920 — #16 highest of 464 markets
- Pct households making over $200,000: 16.5% (compared to 11.4% nationwide)
- Population, 2022: 2,959,386
39. Fort Collins, Colorado
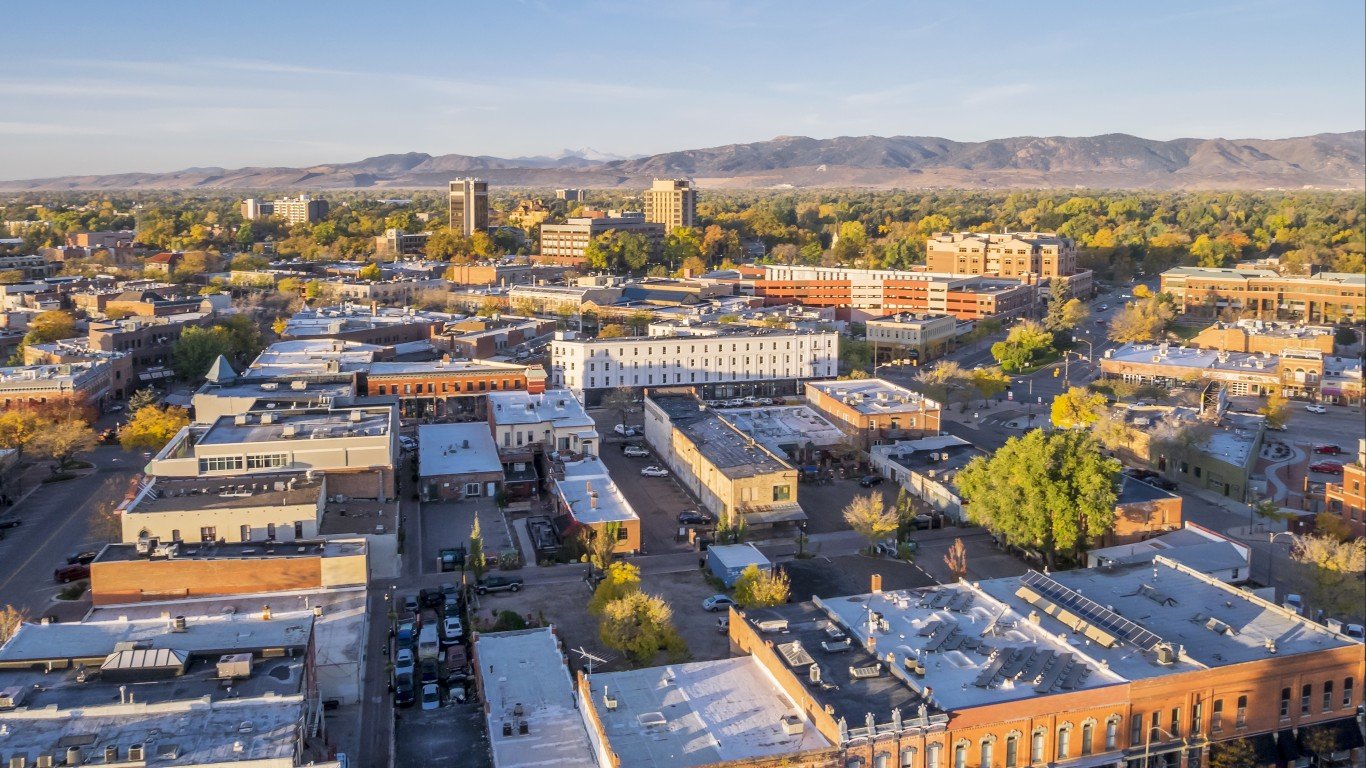
Source: marekuliasz / iStock via Getty Images
- Median listing price, Feb 2024: $618,985 (+6.0% from Feb 2023)
- Median listing price, Feb 2023: $583,906 — #47 highest of 464 markets
- Median listing price per sq ft, Feb 2024: $279 — #69 highest of 464 markets
- Median households income, 2022: $87,199 — #44 highest of 464 markets
- Pct households making over $200,000: 13.0% (compared to 11.4% nationwide)
- Population, 2022: 359,363
38. Sacramento-Roseville-Folsom, California

Source: Manny Chavez / iStock via Getty Images
- Median listing price, Feb 2024: $633,034 (+4.4% from Feb 2023)
- Median listing price, Feb 2023: $606,442 — #38 highest of 464 markets
- Median listing price per sq ft, Feb 2024: $348 — #37 highest of 464 markets
- Median households income, 2022: $89,227 — #40 highest of 464 markets
- Pct households making over $200,000: 14.9% (compared to 11.4% nationwide)
- Population, 2022: 2,394,673
37. Hilo, Hawaii
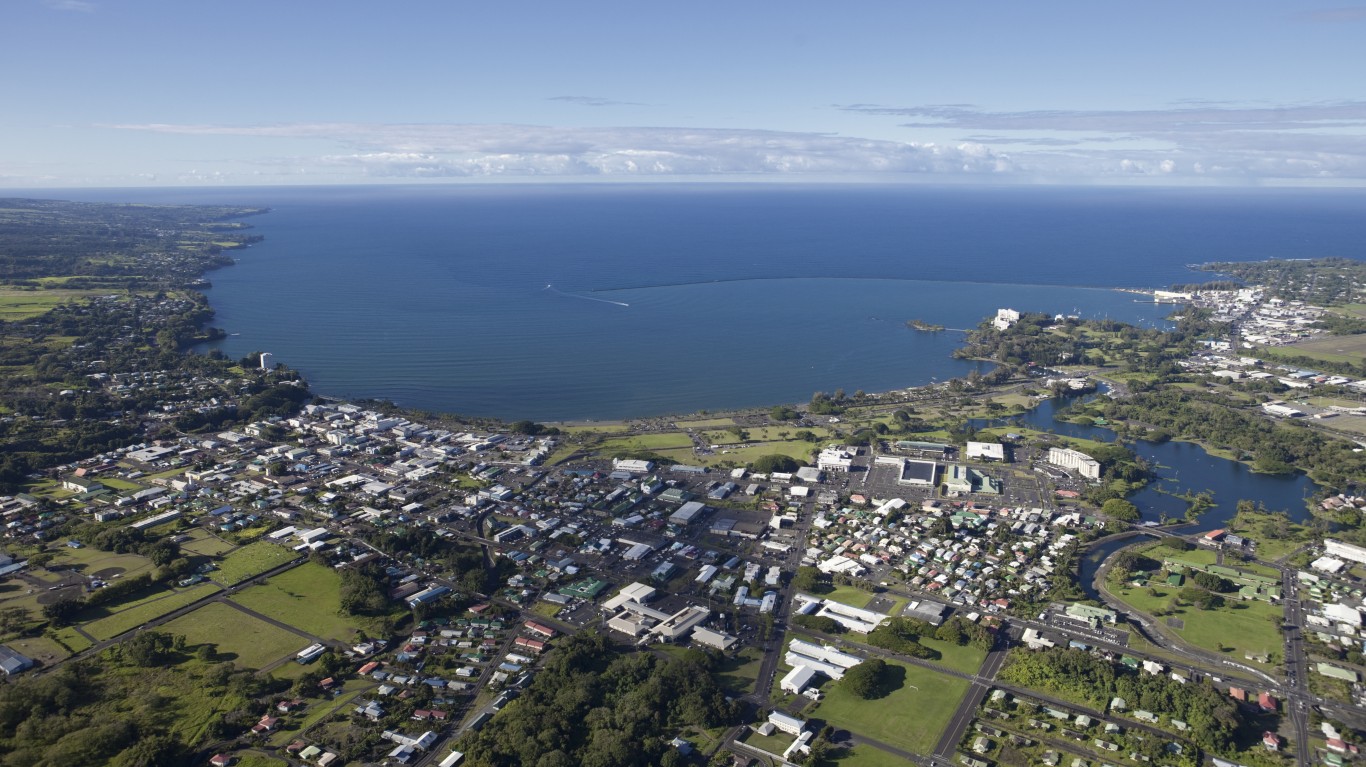
Source: steinphoto / iStock via Getty Images
- Median listing price, Feb 2024: $633,250 (+5.7% from Feb 2023)
- Median listing price, Feb 2023: $599,250 — #40 highest of 464 markets
- Median listing price per sq ft, Feb 2024: $492 — #20 highest of 464 markets
- Median households income, 2022: $75,589 — #107 highest of 464 markets
- Pct households making over $200,000: 9.3% (compared to 11.4% nationwide)
- Population, 2022: 47,627
36. Wenatchee, Washington
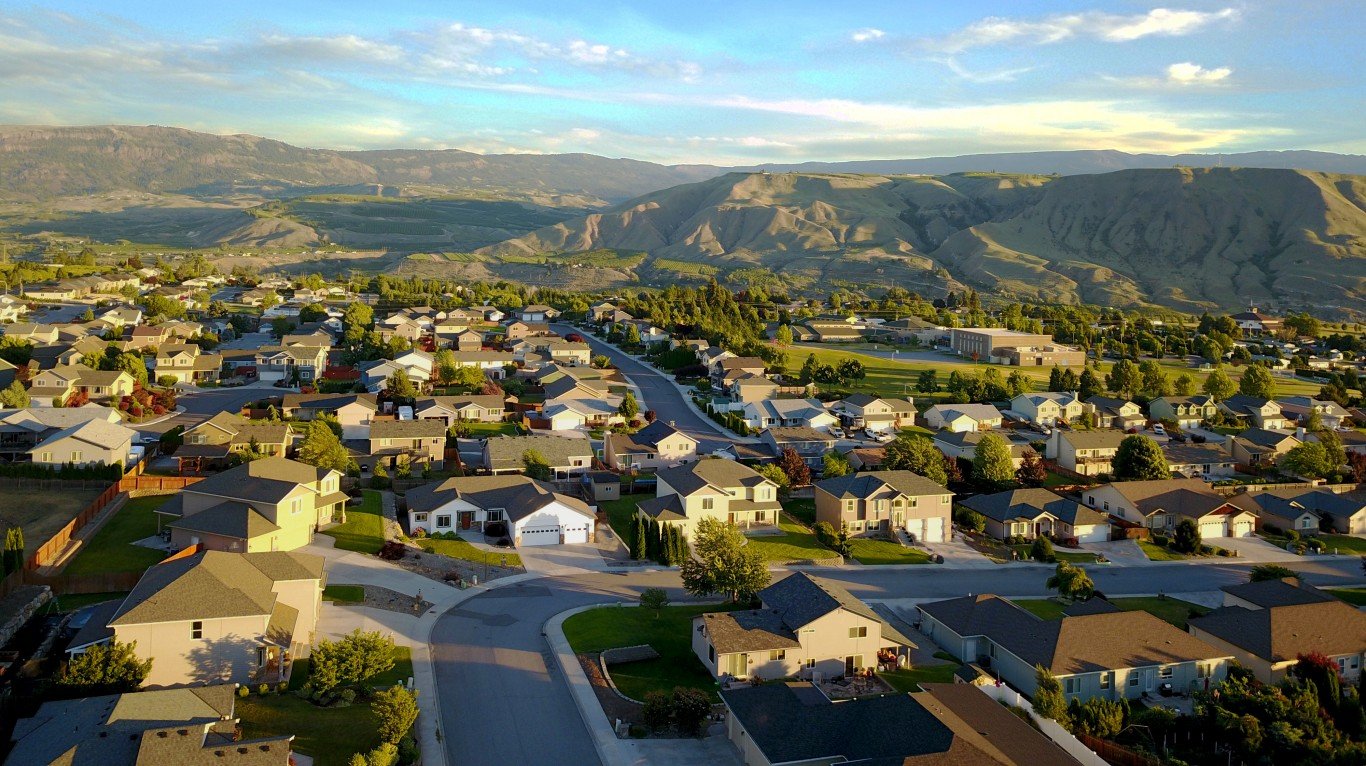
Source: Jaskaran Kooner / iStock via Getty Images
- Median listing price, Feb 2024: $641,100 (-5.0% from Feb 2023)
- Median listing price, Feb 2023: $674,998 — #29 highest of 464 markets
- Median listing price per sq ft, Feb 2024: $335 — #41 highest of 464 markets
- Median households income, 2022: $75,185 — #112 highest of 464 markets
- Pct households making over $200,000: 9.3% (compared to 11.4% nationwide)
- Population, 2022: 122,265
35. Crestview-Fort Walton Beach-Destin, Florida

Source: CampPhoto / Getty Images
- Median listing price, Feb 2024: $642,350 (+1.6% from Feb 2023)
- Median listing price, Feb 2023: $632,200 — #35 highest of 464 markets
- Median listing price per sq ft, Feb 2024: $468 — #22 highest of 464 markets
- Median households income, 2022: $74,279 — #116 highest of 464 markets
- Pct households making over $200,000: 9.6% (compared to 11.4% nationwide)
- Population, 2022: 288,639
34. Prescott Valley-Prescott, Arizona
Source: Althom / iStock Editorial via Getty Images
- Median listing price, Feb 2024: $647,100 (+2.3% from Feb 2023)
- Median listing price, Feb 2023: $632,483 — #33 highest of 464 markets
- Median listing price per sq ft, Feb 2024: $324 — #44 highest of 464 markets
- Median households income, 2022: $62,430 — #286 highest of 464 markets
- Pct households making over $200,000: 6.1% (compared to 11.4% nationwide)
- Population, 2022: 237,830
33. Reno, Nevada
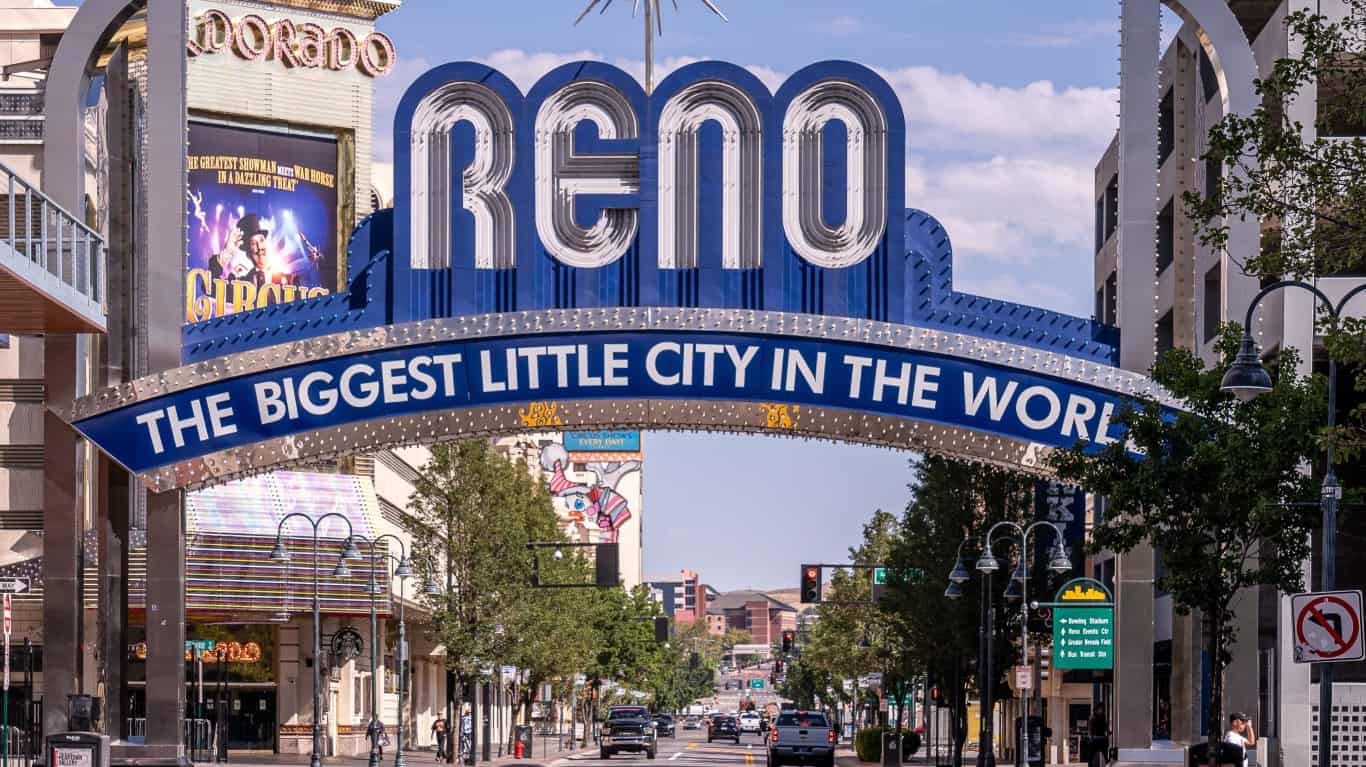
Source: mobili / Flickr
- Median listing price, Feb 2024: $652,000 (+3.5% from Feb 2023)
- Median listing price, Feb 2023: $630,000 — #36 highest of 464 markets
- Median listing price per sq ft, Feb 2024: $326 — #43 highest of 464 markets
- Median households income, 2022: $81,576 — #67 highest of 464 markets
- Pct households making over $200,000: 10.9% (compared to 11.4% nationwide)
- Population, 2022: 490,769
32. Mount Vernon-Anacortes, Washington
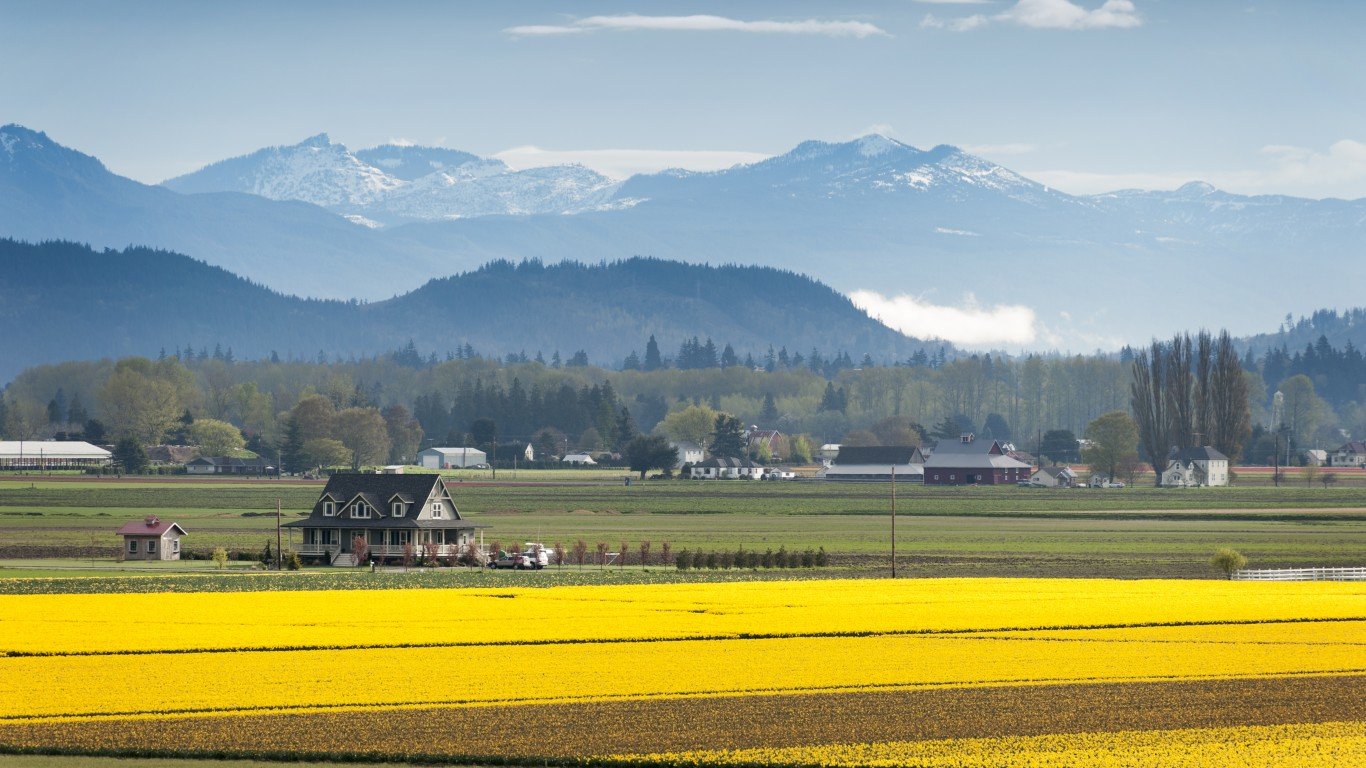
Source: LoweStock / iStock via Getty Images
- Median listing price, Feb 2024: $669,963 (+10.9% from Feb 2023)
- Median listing price, Feb 2023: $604,325 — #39 highest of 464 markets
- Median listing price per sq ft, Feb 2024: $359 — #33 highest of 464 markets
- Median households income, 2022: $82,029 — #63 highest of 464 markets
- Pct households making over $200,000: 9.4% (compared to 11.4% nationwide)
- Population, 2022: 129,480
31. Coeur d’Alene, Idaho
Source: csfotoimages / Getty Images
- Median listing price, Feb 2024: $672,469 (-6.0% from Feb 2023)
- Median listing price, Feb 2023: $715,219 — #27 highest of 464 markets
- Median listing price per sq ft, Feb 2024: $341 — #39 highest of 464 markets
- Median households income, 2022: $71,949 — #145 highest of 464 markets
- Pct households making over $200,000: 6.5% (compared to 11.4% nationwide)
- Population, 2022: 173,396
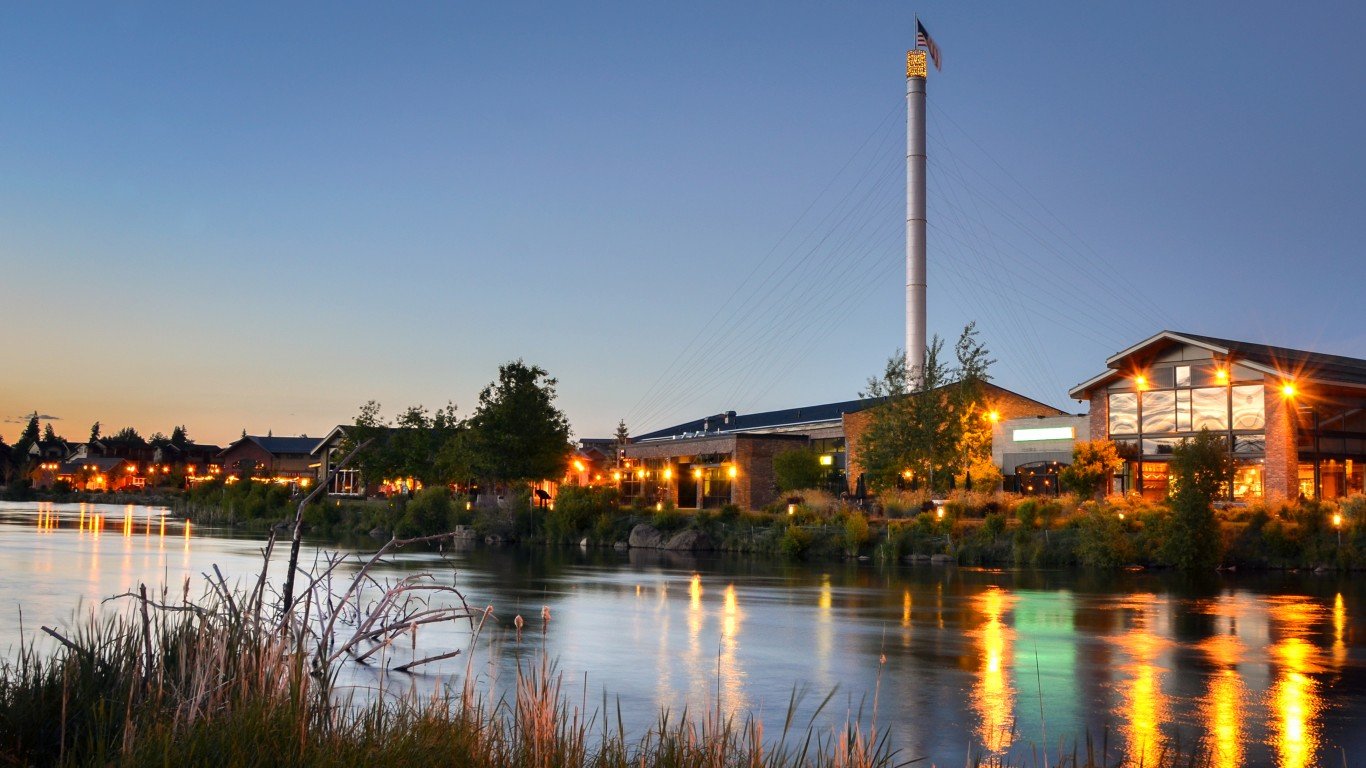
30. Bend, Oregon
Source: AlbertPego / iStock via Getty Images
- Median listing price, Feb 2024: $691,270 (+4.8% from Feb 2023)
- Median listing price, Feb 2023: $659,425 — #30 highest of 464 markets
- Median listing price per sq ft, Feb 2024: $377 — #29 highest of 464 markets
- Median households income, 2022: $82,042 — #62 highest of 464 markets
- Pct households making over $200,000: 12.4% (compared to 11.4% nationwide)
- Population, 2022: 199,352
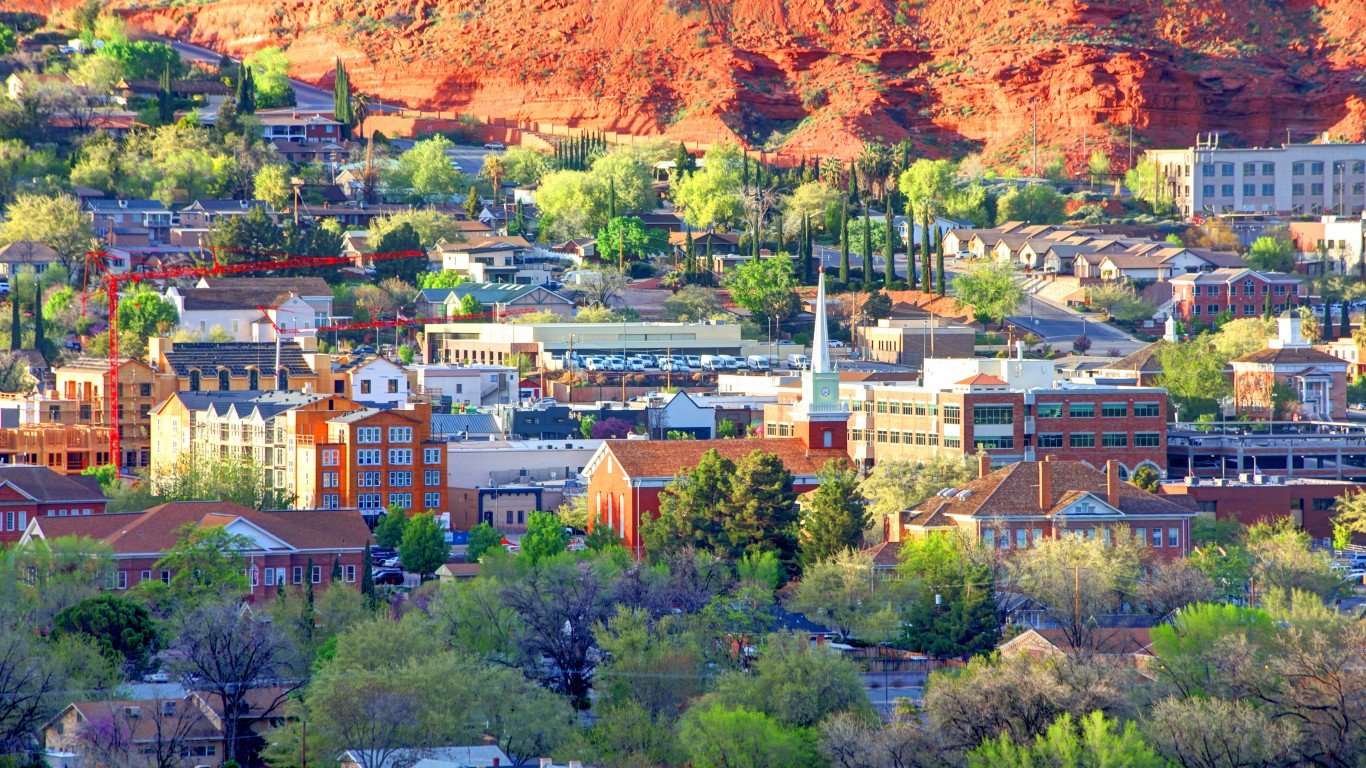
29. St. George, Utah
Source: DenisTangneyJr / iStock via Getty Images
- Median listing price, Feb 2024: $696,073 (+5.6% from Feb 2023)
- Median listing price, Feb 2023: $659,000 — #31 highest of 464 markets
- Median listing price per sq ft, Feb 2024: $303 — #50 highest of 464 markets
- Median households income, 2022: $71,976 — #144 highest of 464 markets
- Pct households making over $200,000: 8.1% (compared to 11.4% nationwide)
- Population, 2022: 183,297
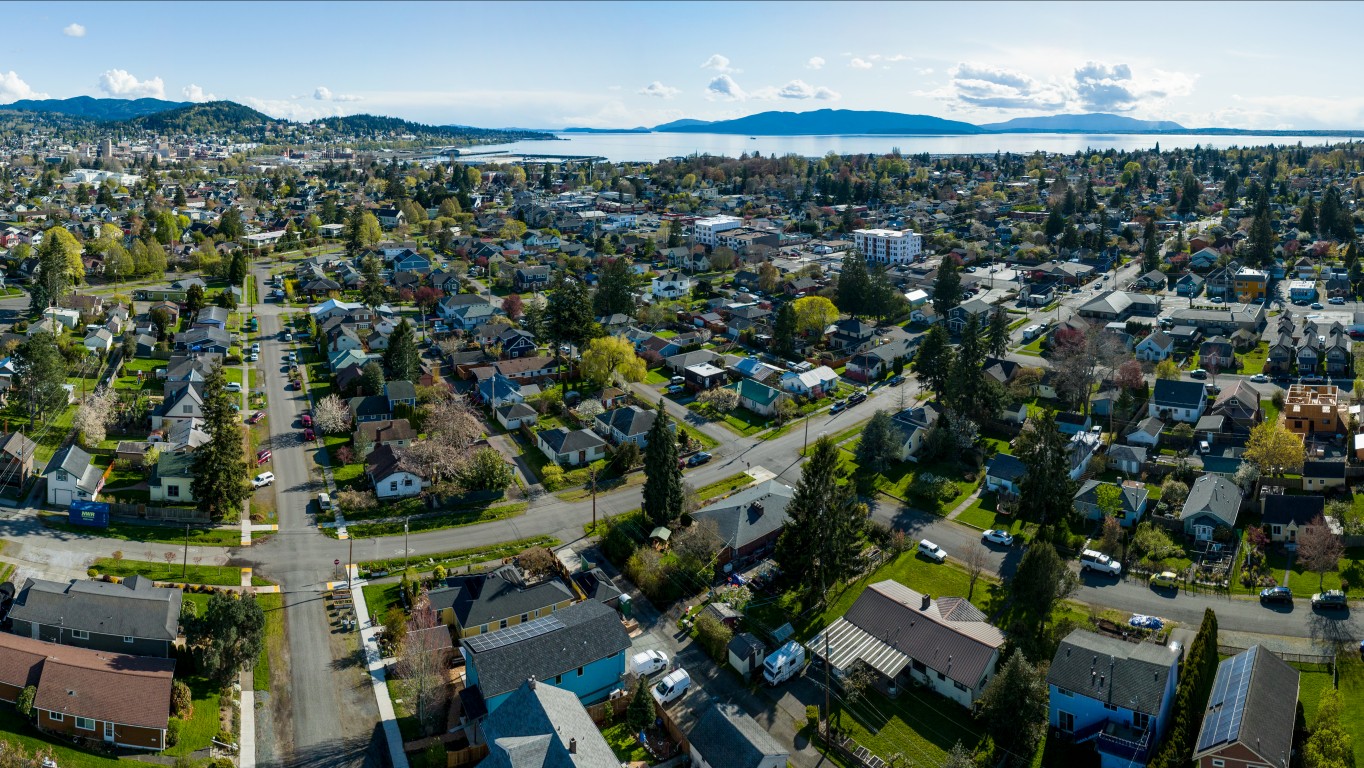
28. Bellingham, Washington
Source: SEASTOCK / iStock via Getty Images
- Median listing price, Feb 2024: $697,475 (+16.4% from Feb 2023)
- Median listing price, Feb 2023: $599,000 — #41 highest of 464 markets
- Median listing price per sq ft, Feb 2024: $371 — #30 highest of 464 markets
- Median households income, 2022: $77,581 — #92 highest of 464 markets
- Pct households making over $200,000: 8.8% (compared to 11.4% nationwide)
- Population, 2022: 226,523
27. Missoula, Montana
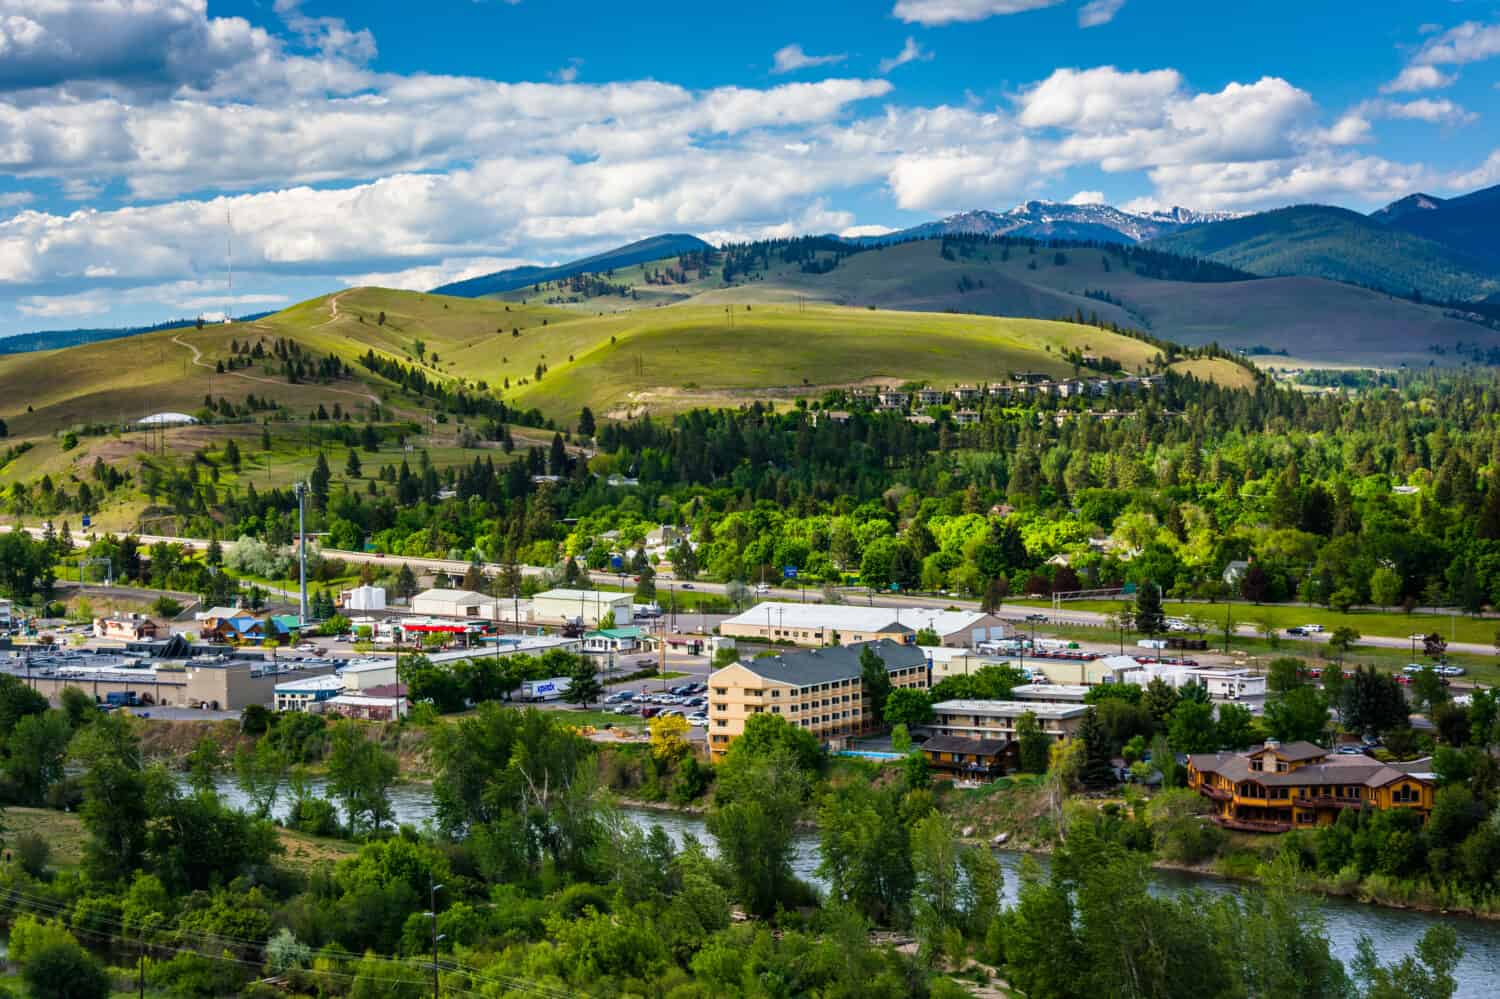
Source: Jon Bilous / Shutterstock.com
- Median listing price, Feb 2024: $711,238 (-5.1% from Feb 2023)
- Median listing price, Feb 2023: $749,250 — #24 highest of 464 markets
- Median listing price per sq ft, Feb 2024: $364 — #31 highest of 464 markets
- Median households income, 2022: $66,840 — #217 highest of 464 markets
- Pct households making over $200,000: 7.8% (compared to 11.4% nationwide)
- Population, 2022: 118,541
26. Flagstaff, Arizona
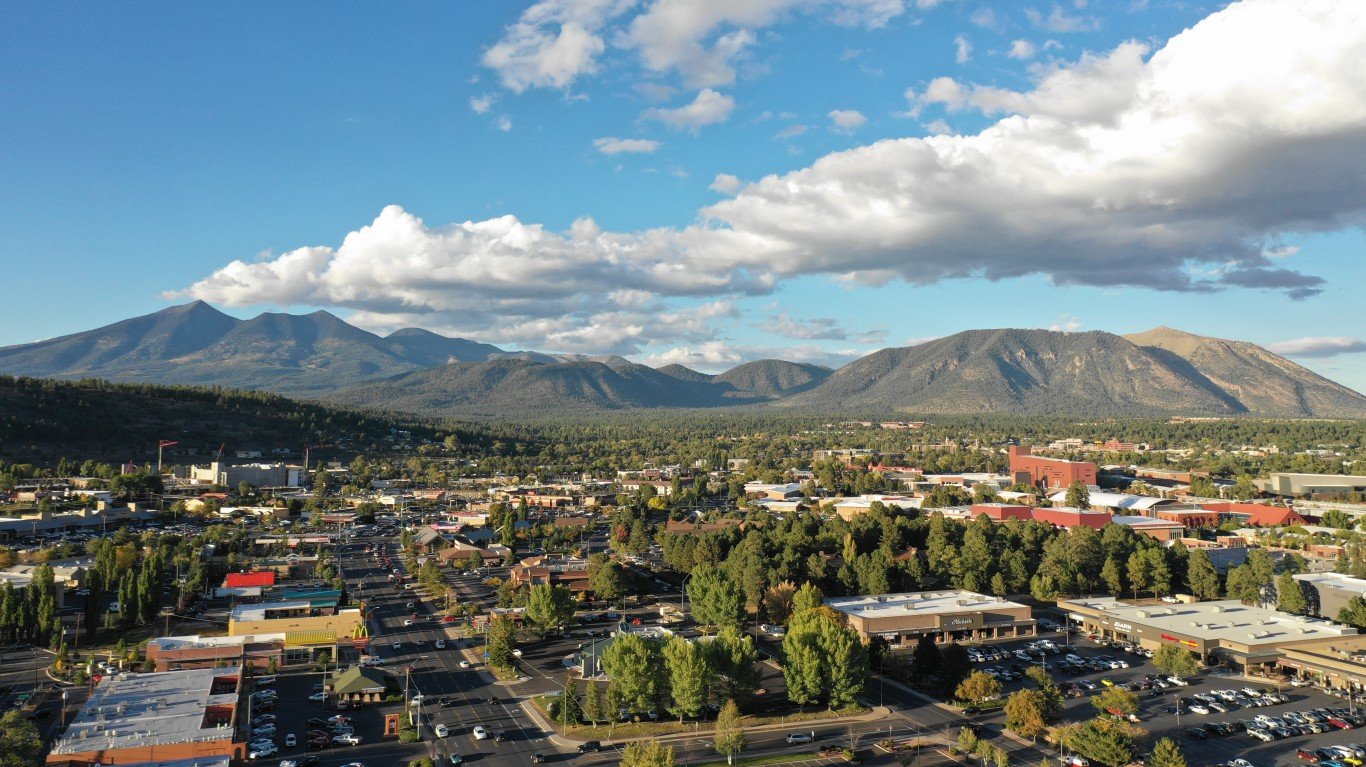
Source: Md Esharuzzaman Emu / iStock via Getty Images
- Median listing price, Feb 2024: $741,200 (+0.4% from Feb 2023)
- Median listing price, Feb 2023: $738,250 — #26 highest of 464 markets
- Median listing price per sq ft, Feb 2024: $397 — #26 highest of 464 markets
- Median households income, 2022: $67,266 — #211 highest of 464 markets
- Pct households making over $200,000: 8.2% (compared to 11.4% nationwide)
- Population, 2022: 144,705
25. New York-Newark-Jersey City, NY-NJ-PA

Source: TierneyMJ / Shutterstock.com
- Median listing price, Feb 2024: $749,500 (+10.2% from Feb 2023)
- Median listing price, Feb 2023: $679,950 — #28 highest of 464 markets
- Median listing price per sq ft, Feb 2024: $549 — #16 highest of 464 markets
- Median households income, 2022: $93,610 — #23 highest of 464 markets
- Pct households making over $200,000: 19.8% (compared to 11.4% nationwide)
- Population, 2022: 19,908,595
24. Seattle-Tacoma-Bellevue, Washington
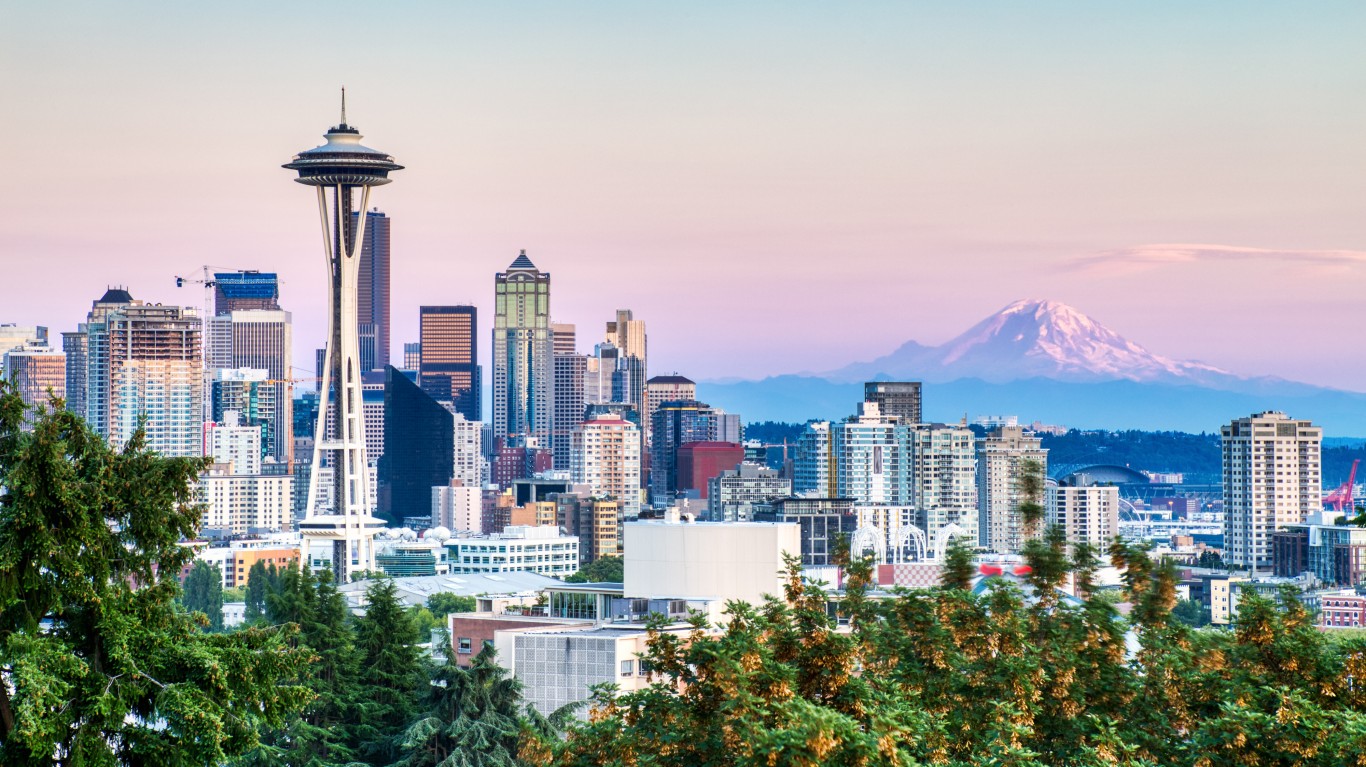
Source: roman_slavik / iStock via Getty Images
- Median listing price, Feb 2024: $765,000 (+2.0% from Feb 2023)
- Median listing price, Feb 2023: $749,950 — #23 highest of 464 markets
- Median listing price per sq ft, Feb 2024: $439 — #24 highest of 464 markets
- Median households income, 2022: $107,206 — #6 highest of 464 markets
- Pct households making over $200,000: 21.2% (compared to 11.4% nationwide)
- Population, 2022: 4,001,701
23. Urban Honolulu, Hawaii

Source: Art Wager / iStock via Getty Images
- Median listing price, Feb 2024: $789,750 (+1.1% from Feb 2023)
- Median listing price, Feb 2023: $781,250 — #22 highest of 464 markets
- Median listing price per sq ft, Feb 2024: $673 — #9 highest of 464 markets
- Median households income, 2022: $99,816 — #11 highest of 464 markets
- Pct households making over $200,000: 17.3% (compared to 11.4% nationwide)
- Population, 2022: 1,010,100
22. Santa Fe, New Mexico
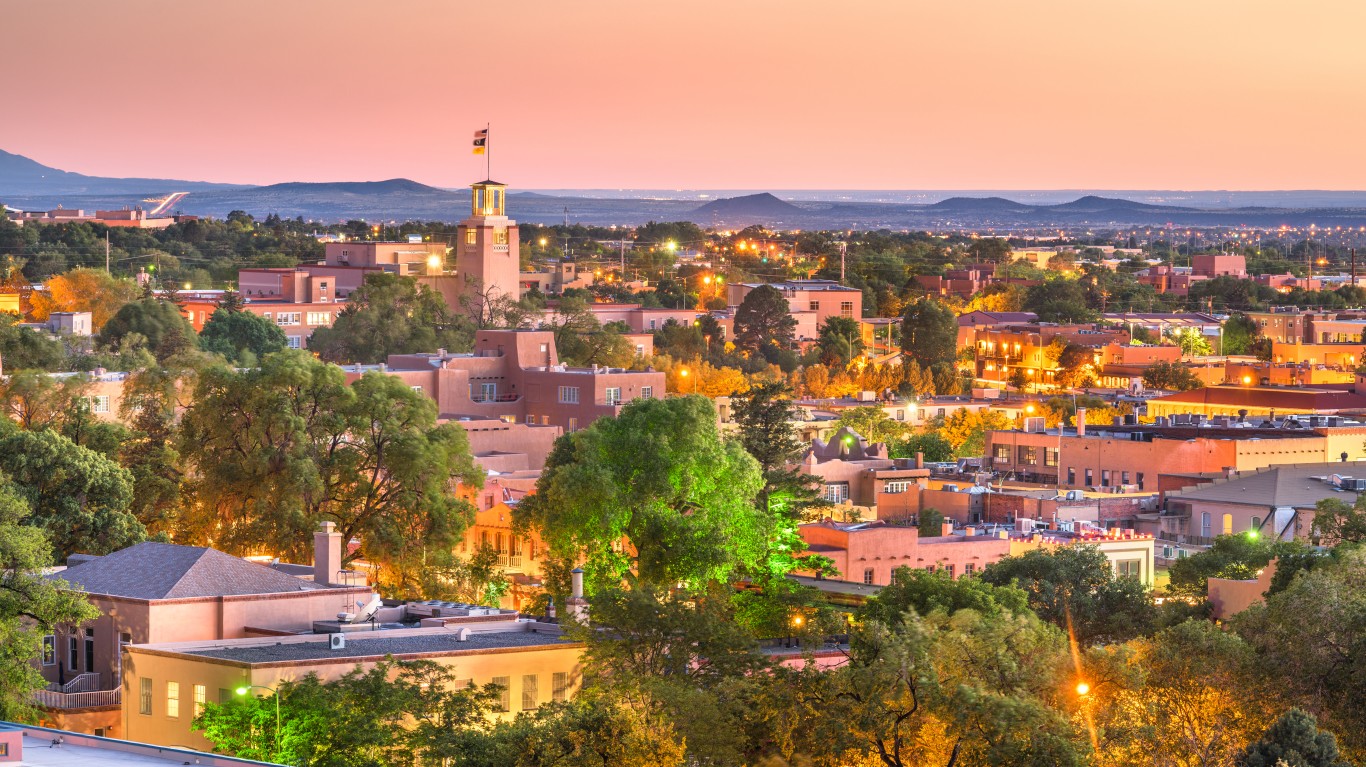
Source: Sean Pavone / iStock via Getty Images
- Median listing price, Feb 2024: $799,450 (+8.0% from Feb 2023)
- Median listing price, Feb 2023: $739,975 — #25 highest of 464 markets
- Median listing price per sq ft, Feb 2024: $381 — #28 highest of 464 markets
- Median households income, 2022: $70,522 — #162 highest of 464 markets
- Pct households making over $200,000: 10.0% (compared to 11.4% nationwide)
- Population, 2022: 154,481
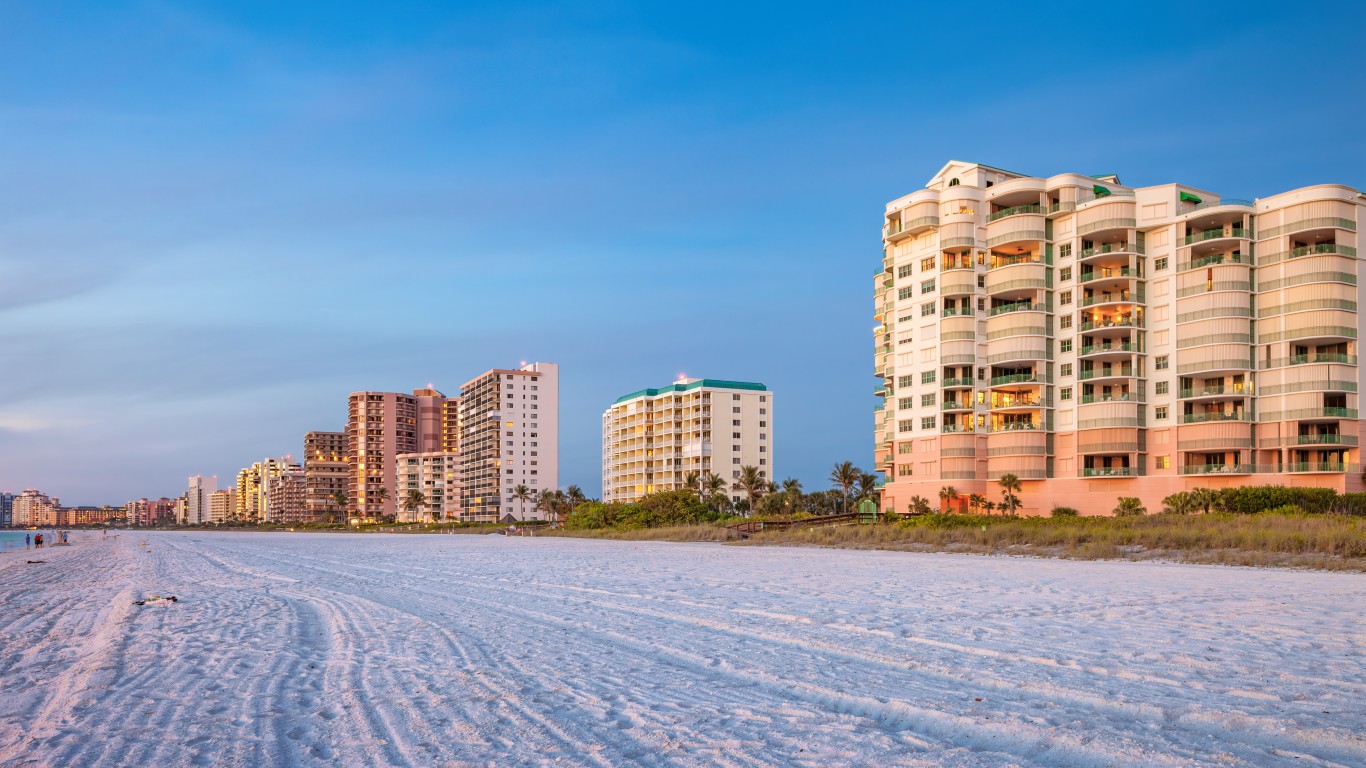
21. Naples-Marco Island, Florida
Source: benedek / iStock via Getty Images
- Median listing price, Feb 2024: $849,950 (-3.4% from Feb 2023)
- Median listing price, Feb 2023: $879,500 — #17 highest of 464 markets
- Median listing price per sq ft, Feb 2024: $500 — #19 highest of 464 markets
- Median households income, 2022: $82,011 — #64 highest of 464 markets
- Pct households making over $200,000: 15.7% (compared to 11.4% nationwide)
- Population, 2022: 380,221
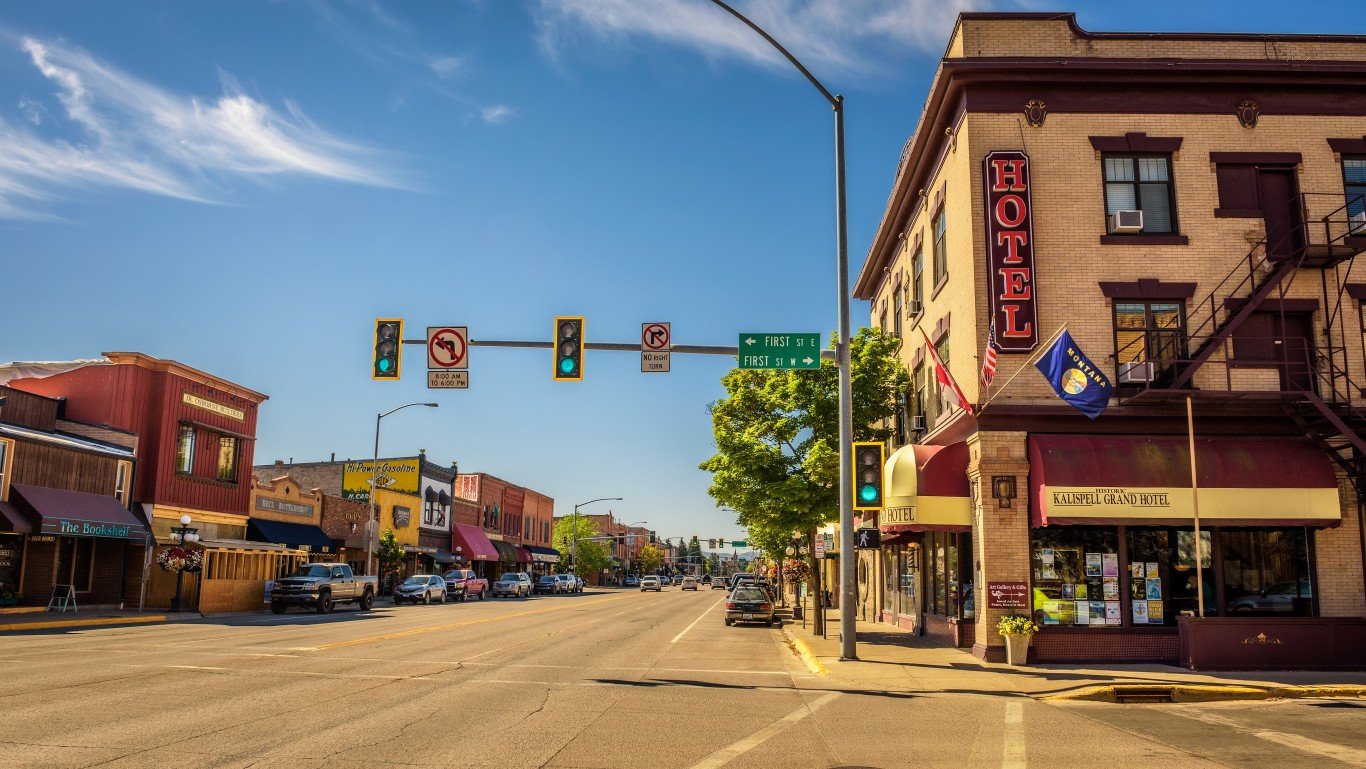
20. Kalispell, Montana
Source: miroslav_1 / Getty Images
- Median listing price, Feb 2024: $850,000 (+8.0% from Feb 2023)
- Median listing price, Feb 2023: $786,950 — #21 highest of 464 markets
- Median listing price per sq ft, Feb 2024: $418 — #25 highest of 464 markets
- Median households income, 2022: $57,123 — #362 highest of 464 markets
- Pct households making over $200,000: 4.6% (compared to 11.4% nationwide)
- Population, 2022: 25,473
19. Boston-Cambridge-Newton, MA-NH

Source: Sean Pavone/Shutterstock
- Median listing price, Feb 2024: $854,450 (+6.9% from Feb 2023)
- Median listing price, Feb 2023: $799,000 — #20 highest of 464 markets
- Median listing price per sq ft, Feb 2024: $474 — #21 highest of 464 markets
- Median households income, 2022: $107,117 — #7 highest of 464 markets
- Pct households making over $200,000: 22.7% (compared to 11.4% nationwide)
- Population, 2022: 4,912,449
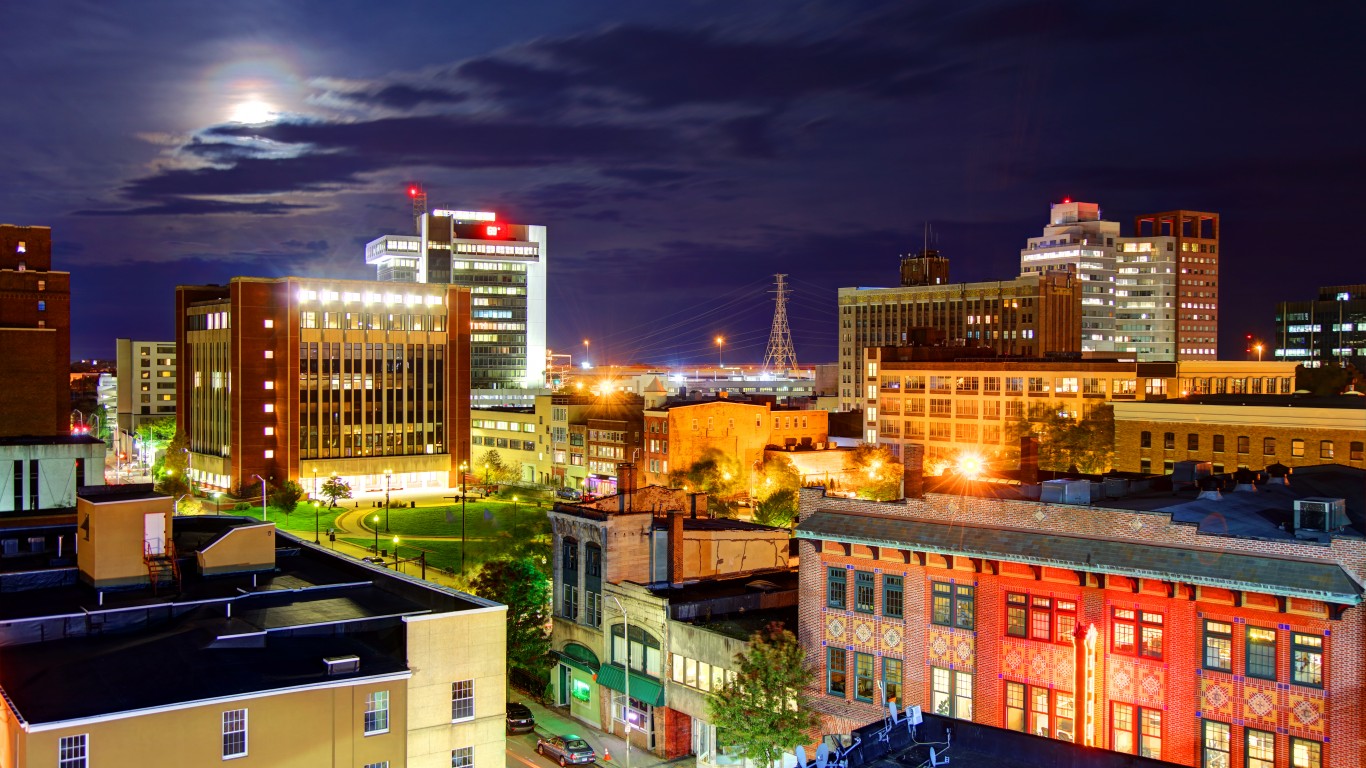
18. Bridgeport-Stamford-Norwalk, Connecticut
Source: DenisTangneyJr / Getty Images
- Median listing price, Feb 2024: $869,450 (-9.8% from Feb 2023)
- Median listing price, Feb 2023: $963,450 — #11 highest of 464 markets
- Median listing price per sq ft, Feb 2024: $357 — #34 highest of 464 markets
- Median households income, 2022: $107,351 — #5 highest of 464 markets
- Pct households making over $200,000: 26.1% (compared to 11.4% nationwide)
- Population, 2022: 958,371
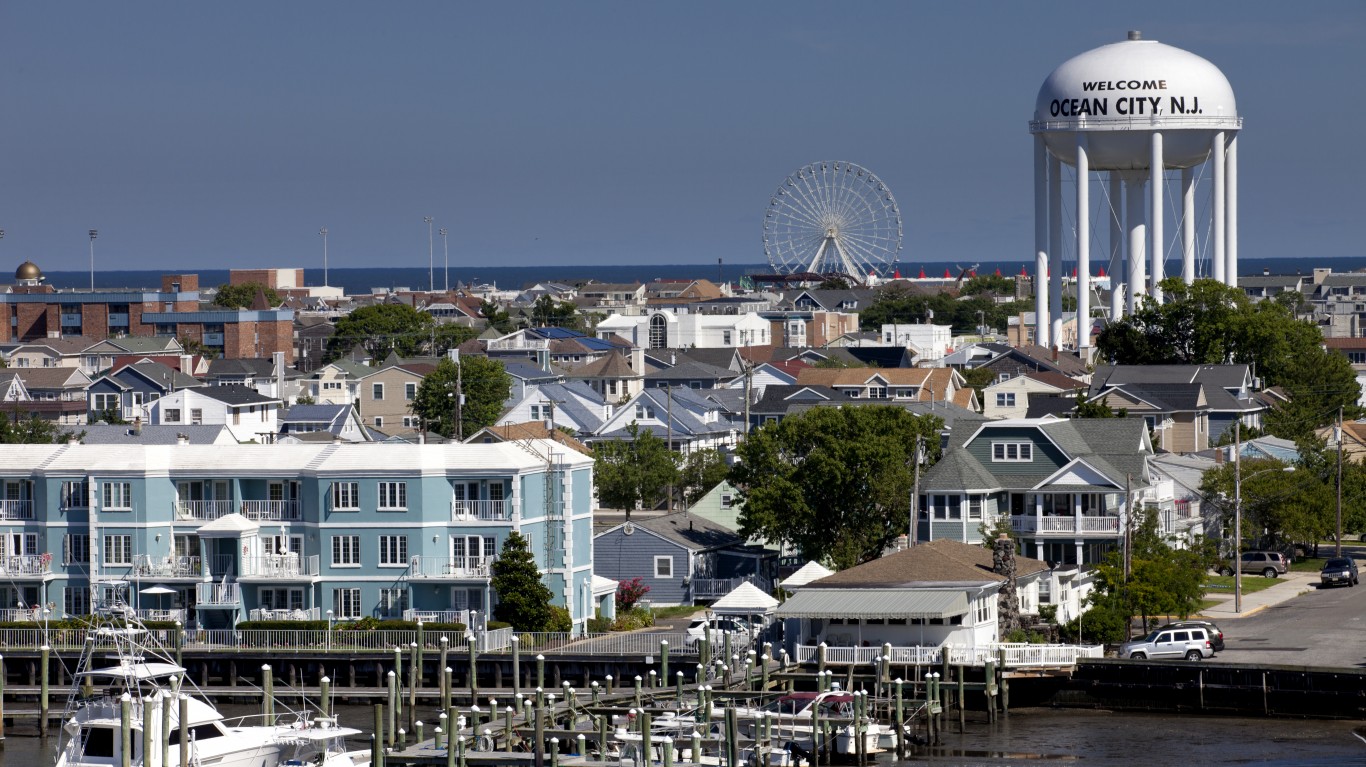
17. Ocean City, New Jersey
Source: Aneese / iStock via Getty Images
- Median listing price, Feb 2024: $899,900 (+1.2% from Feb 2023)
- Median listing price, Feb 2023: $889,500 — #16 highest of 464 markets
- Median listing price per sq ft, Feb 2024: $625 — #12 highest of 464 markets
- Median households income, 2022: $83,870 — #54 highest of 464 markets
- Pct households making over $200,000: 12.9% (compared to 11.4% nationwide)
- Population, 2022: 95,456
16. Boulder, Colorado
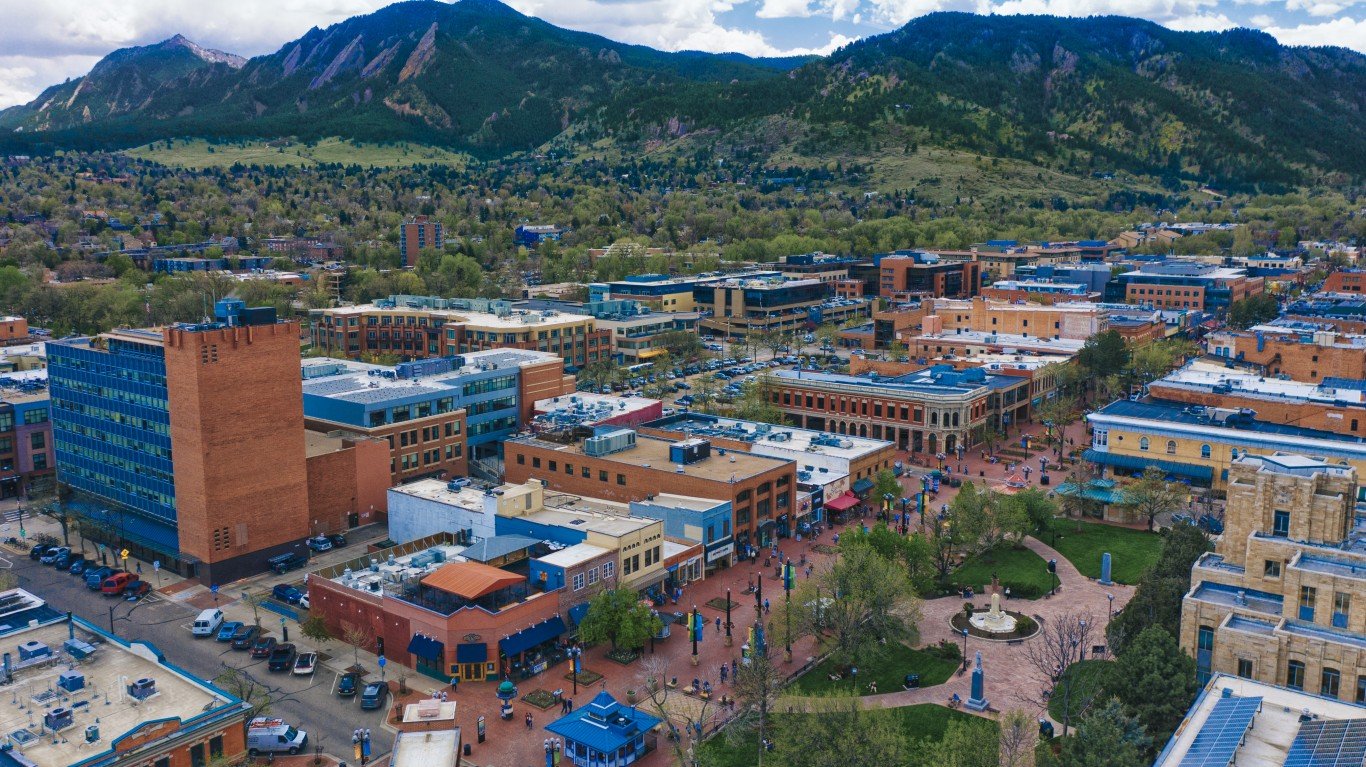
Source: pawel.gaul / iStock via Getty Images
- Median listing price, Feb 2024: $914,441 (+4.5% from Feb 2023)
- Median listing price, Feb 2023: $875,000 — #18 highest of 464 markets
- Median listing price per sq ft, Feb 2024: $440 — #23 highest of 464 markets
- Median households income, 2022: $99,770 — #12 highest of 464 markets
- Pct households making over $200,000: 20.5% (compared to 11.4% nationwide)
- Population, 2022: 328,658
15. Barnstable Town, Massachusetts
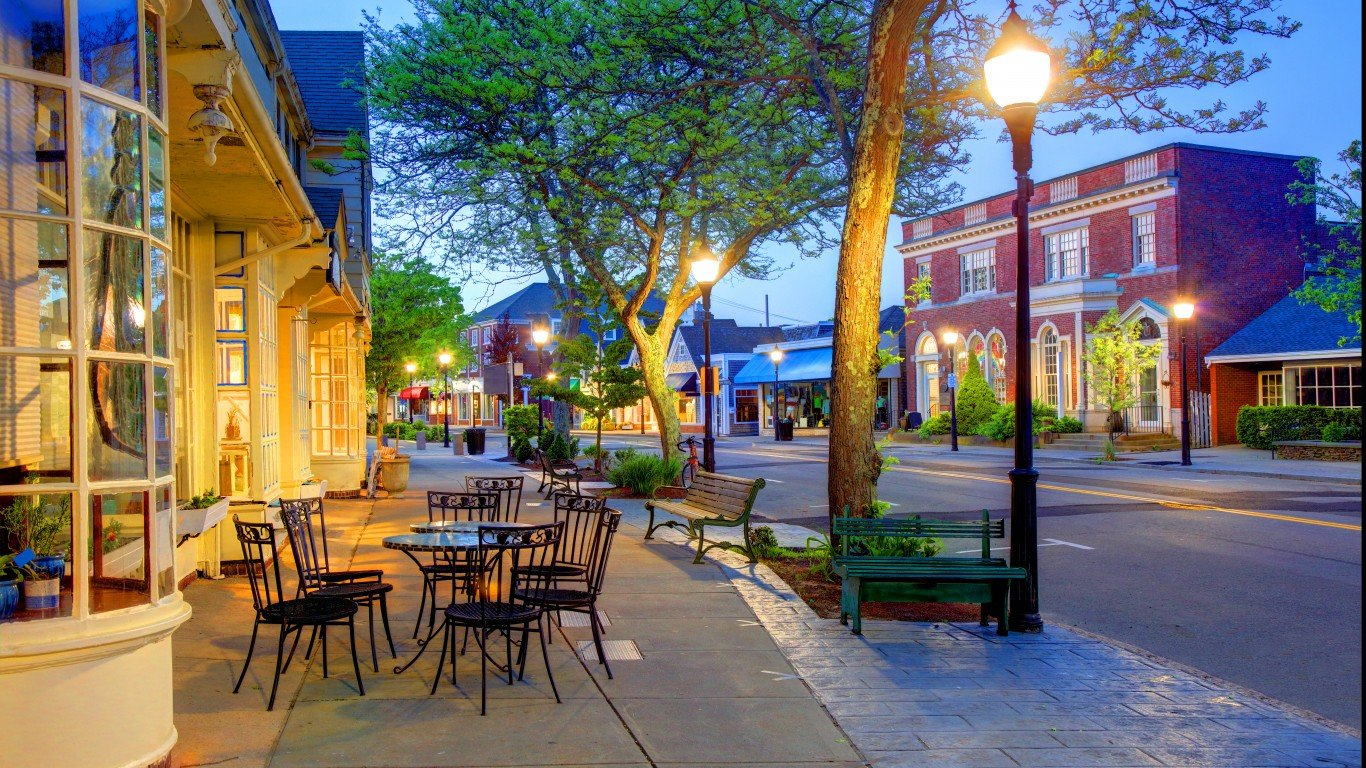
Source: DenisTangneyJr / iStock via Getty Images
- Median listing price, Feb 2024: $915,725 (+4.7% from Feb 2023)
- Median listing price, Feb 2023: $874,975 — #19 highest of 464 markets
- Median listing price per sq ft, Feb 2024: $546 — #17 highest of 464 markets
- Median households income, 2022: $90,447 — #34 highest of 464 markets
- Pct households making over $200,000: 15.4% (compared to 11.4% nationwide)
- Population, 2022: 229,436
14. Santa Rosa-Petaluma, California

Source: peterleabo / iStock via Getty Images
- Median listing price, Feb 2024: $970,000 (+2.0% from Feb 2023)
- Median listing price, Feb 2023: $951,225 — #12 highest of 464 markets
- Median listing price per sq ft, Feb 2024: $537 — #18 highest of 464 markets
- Median households income, 2022: $99,266 — #13 highest of 464 markets
- Pct households making over $200,000: 17.4% (compared to 11.4% nationwide)
- Population, 2022: 488,436
13. San Francisco-Oakland-Berkeley, California

Source: bluejayphoto / iStock via Getty Images
- Median listing price, Feb 2024: $989,444 (-1.3% from Feb 2023)
- Median listing price, Feb 2023: $1,002,500 — #9 highest of 464 markets
- Median listing price per sq ft, Feb 2024: $700 — #8 highest of 464 markets
- Median households income, 2022: $129,315 — #2 highest of 464 markets
- Pct households making over $200,000: 31.4% (compared to 11.4% nationwide)
- Population, 2022: 4,692,242
12. San Diego-Chula Vista-Carlsbad, California
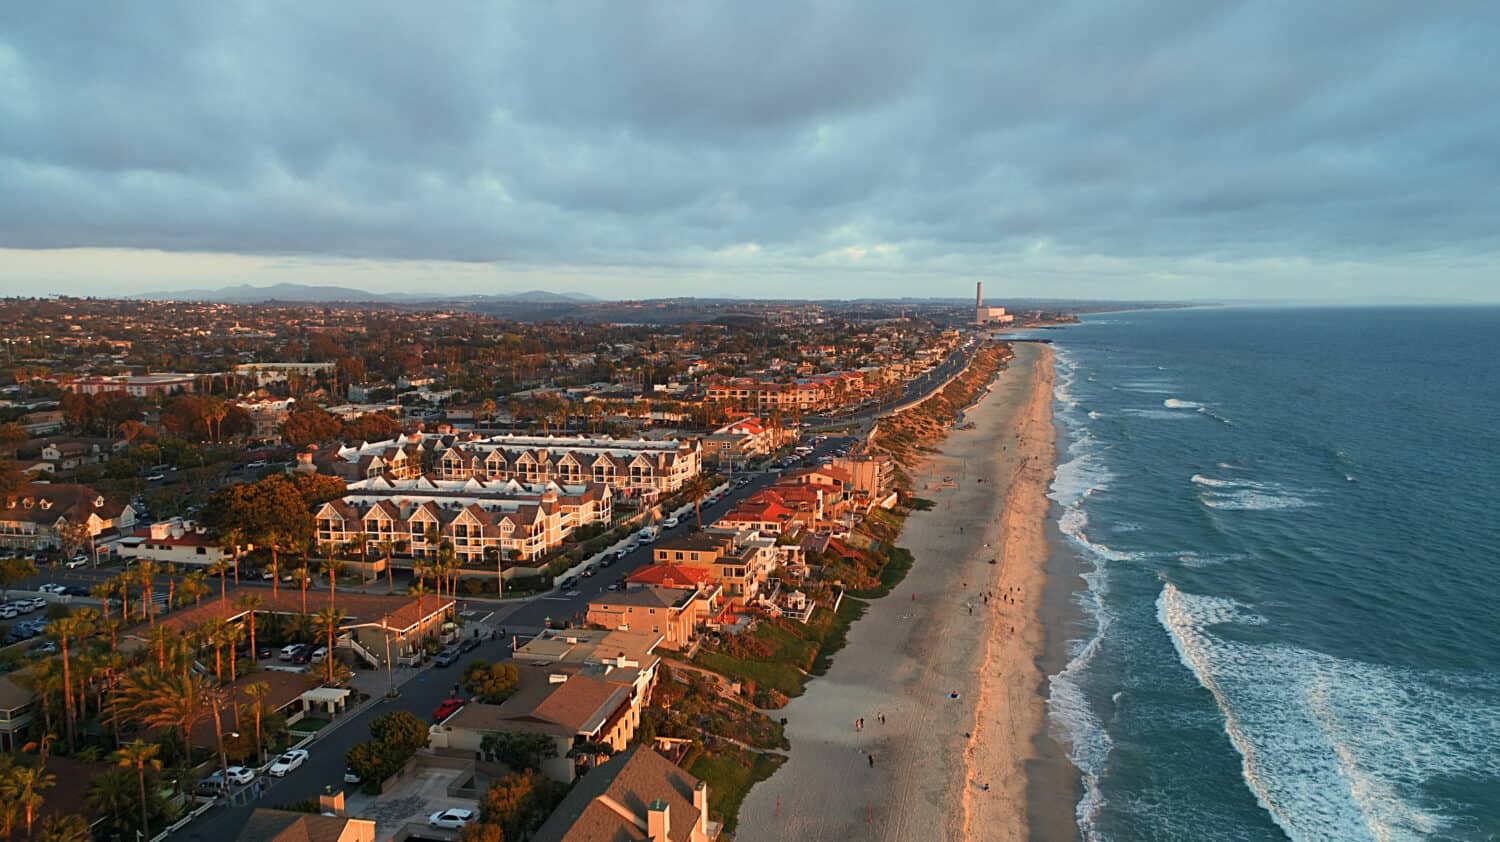
Source: Kyle Sprague / Shutterstock.com
- Median listing price, Feb 2024: $996,500 (+6.9% from Feb 2023)
- Median listing price, Feb 2023: $931,999 — #15 highest of 464 markets
- Median listing price per sq ft, Feb 2024: $637 — #11 highest of 464 markets
- Median households income, 2022: $96,974 — #15 highest of 464 markets
- Pct households making over $200,000: 17.7% (compared to 11.4% nationwide)
- Population, 2022: 3,289,701
11. San Luis Obispo-Paso Robles, California
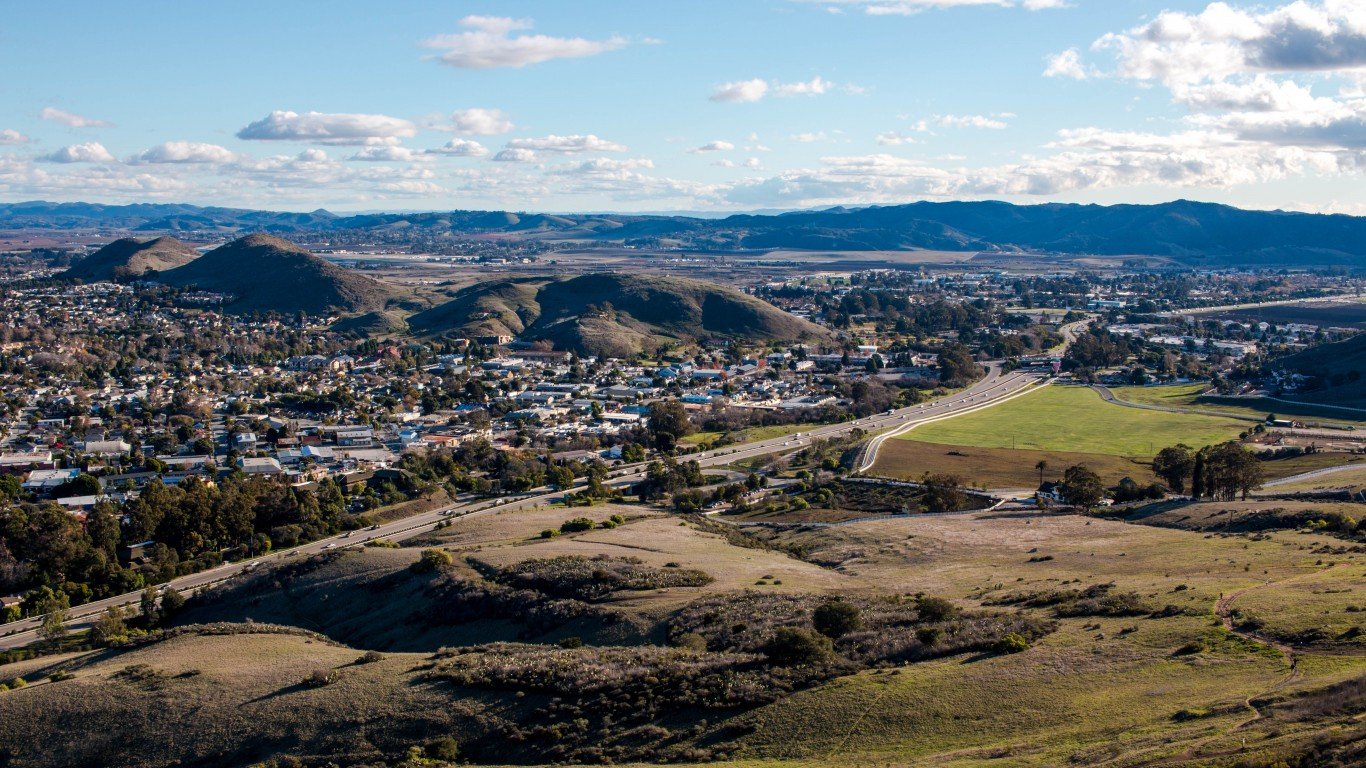
Source: russokm1105 / iStock via Getty Images
- Median listing price, Feb 2024: $1,029,250 (+8.5% from Feb 2023)
- Median listing price, Feb 2023: $949,000 — #13 highest of 464 markets
- Median listing price per sq ft, Feb 2024: $600 — #13 highest of 464 markets
- Median households income, 2022: $90,158 — #37 highest of 464 markets
- Pct households making over $200,000: 14.3% (compared to 11.4% nationwide)
- Population, 2022: 281,712
10. Santa Cruz-Watsonville, California

Source: Sundry Photography / iStock via Getty Images
- Median listing price, Feb 2024: $1,074,850 (-18.3% from Feb 2023)
- Median listing price, Feb 2023: $1,316,250 — #6 highest of 464 markets
- Median listing price per sq ft, Feb 2024: $735 — #5 highest of 464 markets
- Median households income, 2022: $104,409 — #9 highest of 464 markets
- Pct households making over $200,000: 22.4% (compared to 11.4% nationwide)
- Population, 2022: 268,571
9. Oxnard-Thousand Oaks-Ventura, California
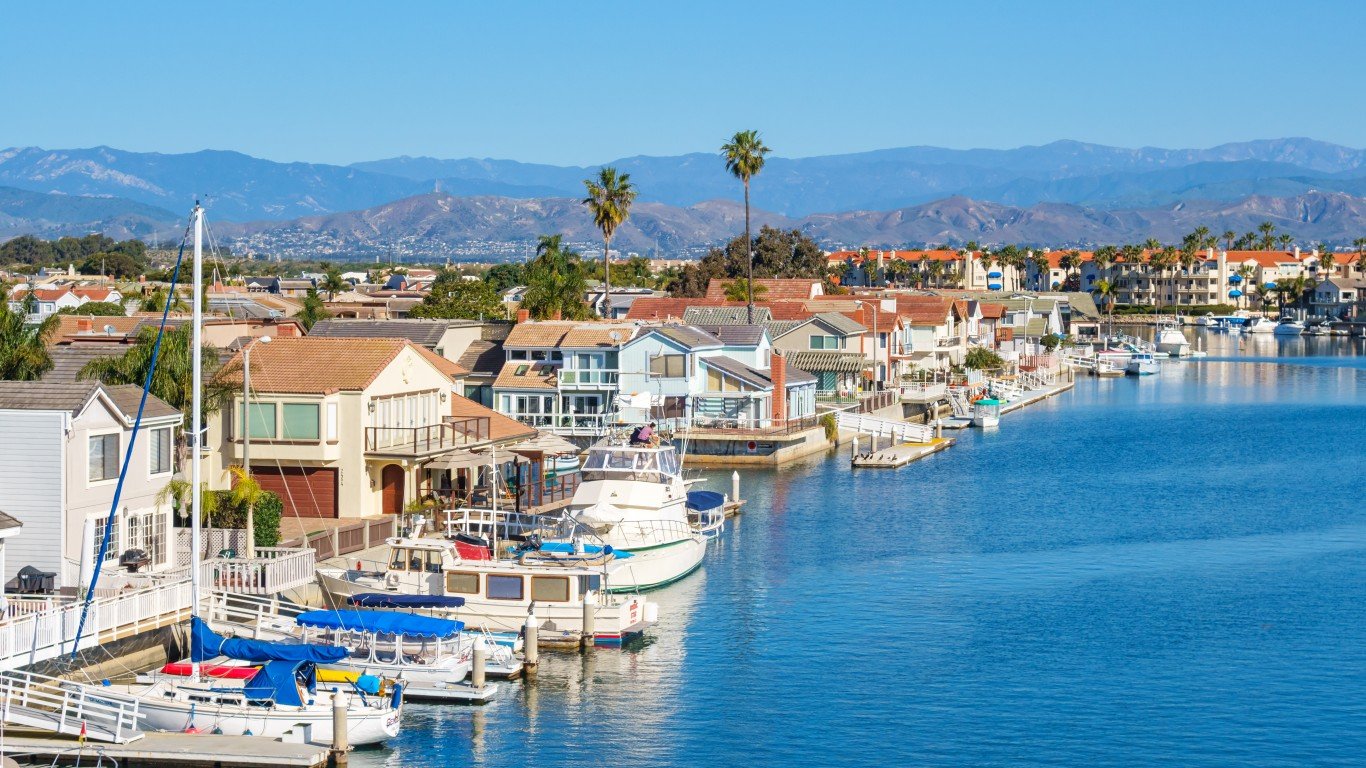
Source: benedek / iStock Unreleased via Getty Images
- Median listing price, Feb 2024: $1,095,750 (+17.5% from Feb 2023)
- Median listing price, Feb 2023: $932,500 — #14 highest of 464 markets
- Median listing price per sq ft, Feb 2024: $564 — #15 highest of 464 markets
- Median households income, 2022: $102,141 — #10 highest of 464 markets
- Pct households making over $200,000: 18.9% (compared to 11.4% nationwide)
- Population, 2022: 842,009
8. Los Angeles-Long Beach-Anaheim, California
Source: trekandshoot / iStock via Getty Images
- Median listing price, Feb 2024: $1,137,000 (+16.8% from Feb 2023)
- Median listing price, Feb 2023: $973,500 — #10 highest of 464 markets
- Median listing price per sq ft, Feb 2024: $672 — #10 highest of 464 markets
- Median households income, 2022: $89,105 — #42 highest of 464 markets
- Pct households making over $200,000: 16.7% (compared to 11.4% nationwide)
- Population, 2022: 13,111,917
7. Bozeman, Montana
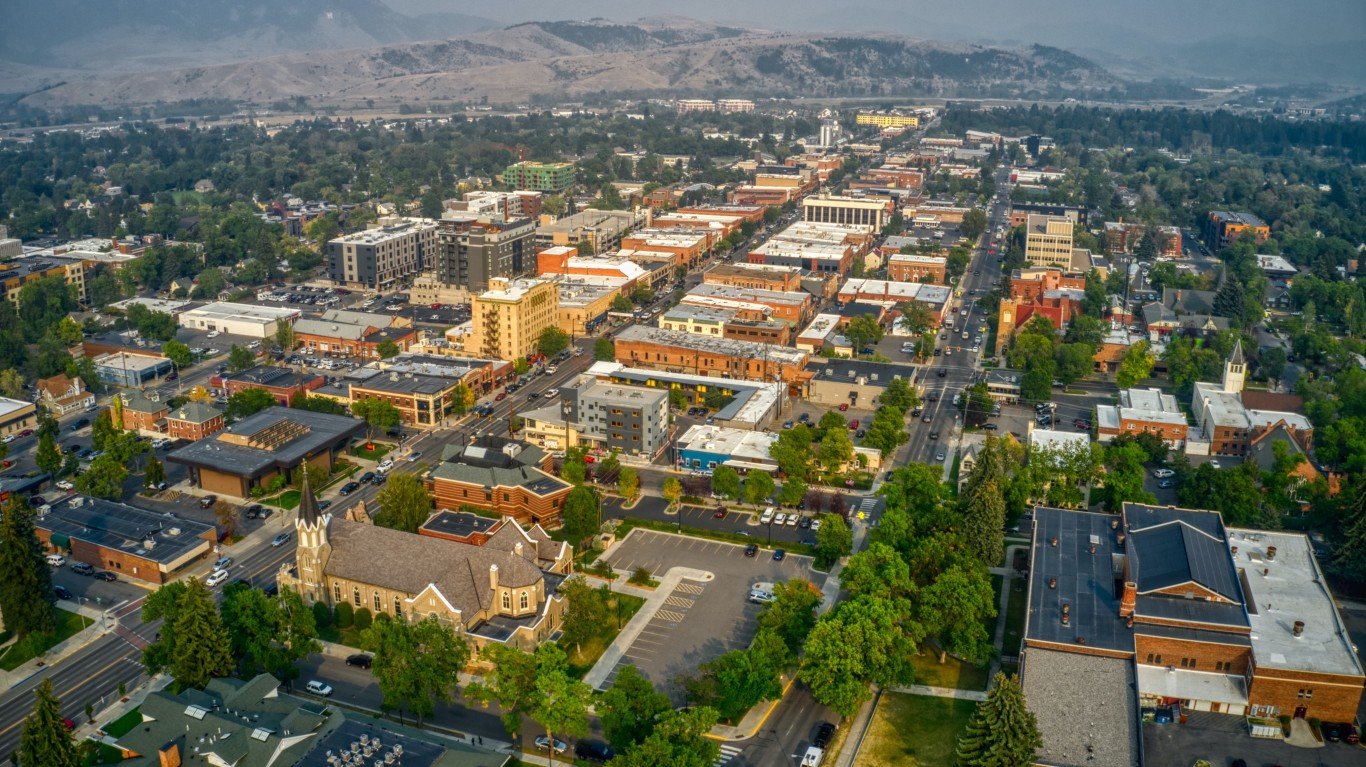
Source: Jacob Boomsma / iStock via Getty Images
- Median listing price, Feb 2024: $1,197,000 (-2.5% from Feb 2023)
- Median listing price, Feb 2023: $1,227,250 — #8 highest of 464 markets
- Median listing price per sq ft, Feb 2024: $596 — #14 highest of 464 markets
- Median households income, 2022: $74,113 — #119 highest of 464 markets
- Pct households making over $200,000: 10.9% (compared to 11.4% nationwide)
- Population, 2022: 53,500
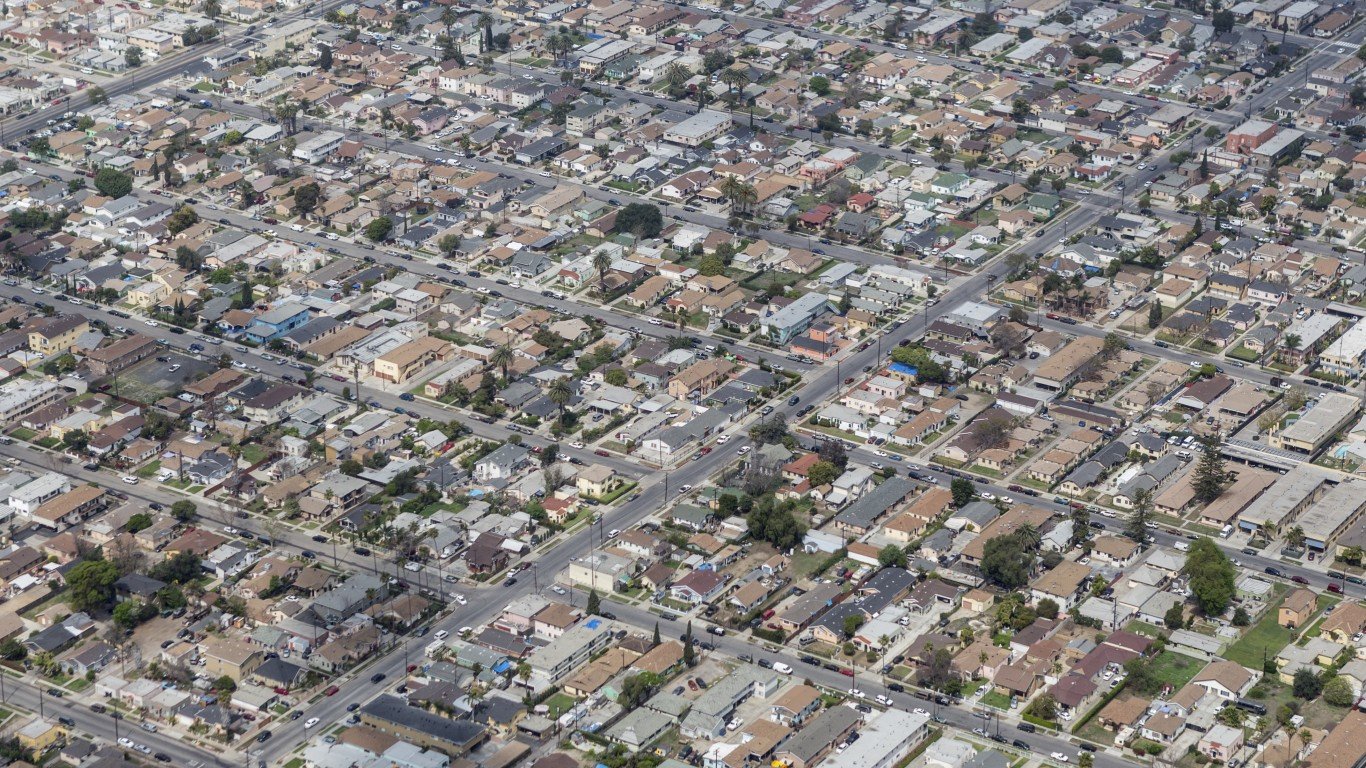
6. Salinas, California
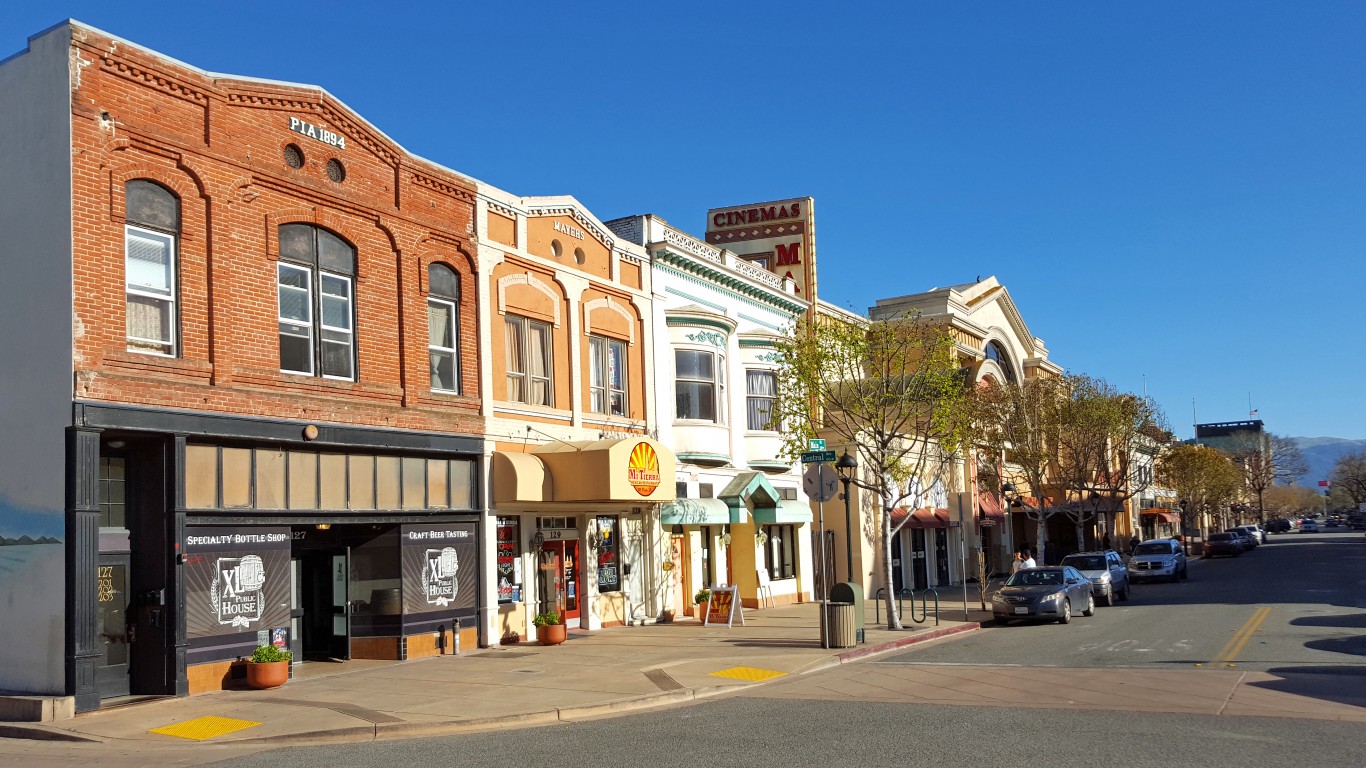
Source: Solidago / iStock Unreleased via Getty Images
- Median listing price, Feb 2024: $1,229,892 (-0.3% from Feb 2023)
- Median listing price, Feb 2023: $1,233,500 — #7 highest of 464 markets
- Median listing price per sq ft, Feb 2024: $709 — #6 highest of 464 markets
- Median households income, 2022: $91,043 — #31 highest of 464 markets
- Pct households making over $200,000: 14.8% (compared to 11.4% nationwide)
- Population, 2022: 437,609
5. San Jose-Sunnyvale-Santa Clara, California
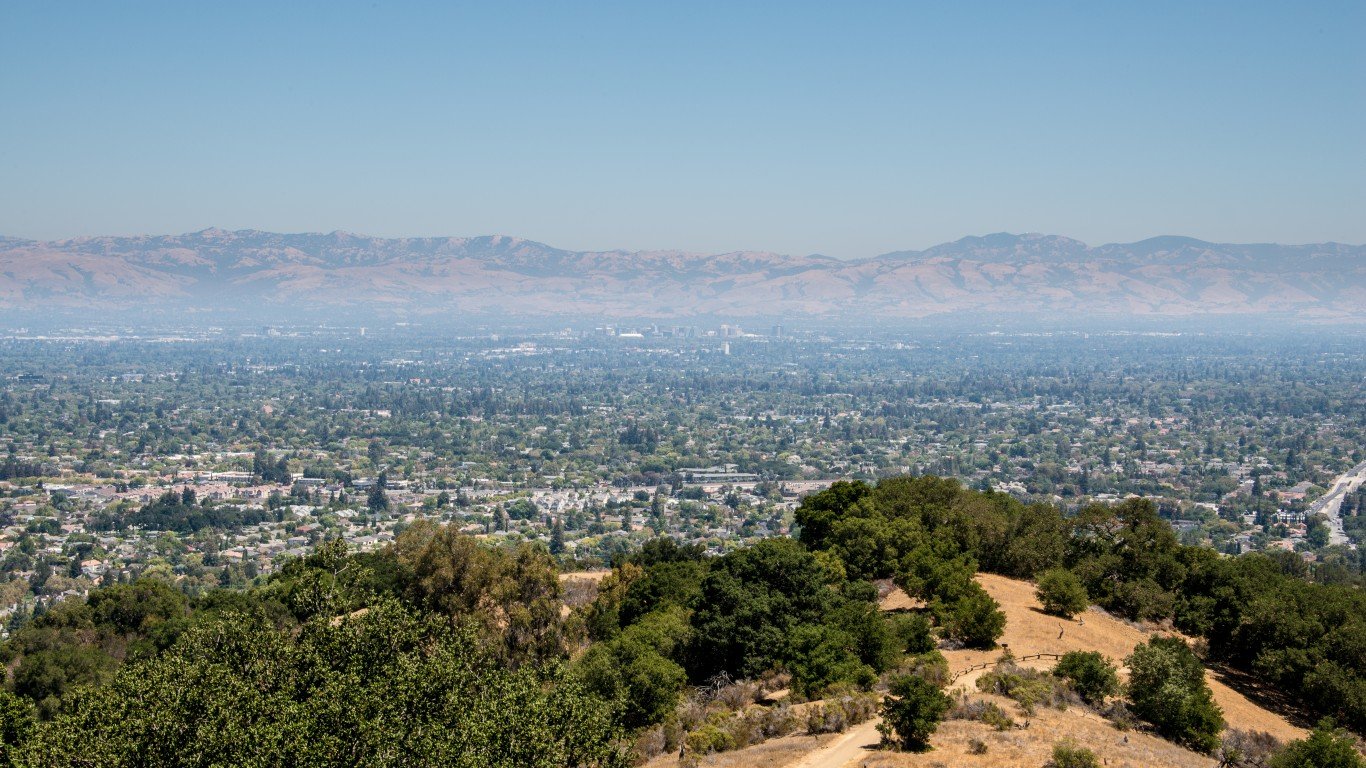
Source: Bill_Dally / iStock via Getty Images
- Median listing price, Feb 2024: $1,366,944 (-2.3% from Feb 2023)
- Median listing price, Feb 2023: $1,399,500 — #3 highest of 464 markets
- Median listing price per sq ft, Feb 2024: $838 — #4 highest of 464 markets
- Median households income, 2022: $151,713 — #1 highest of 464 markets
- Pct households making over $200,000: 37.4% (compared to 11.4% nationwide)
- Population, 2022: 1,981,584
4. Key West, Florida

Source: sergesegal / Flickr
- Median listing price, Feb 2024: $1,384,085 (-6.0% from Feb 2023)
- Median listing price, Feb 2023: $1,472,500 — #1 highest of 464 markets
- Median listing price per sq ft, Feb 2024: $948 — #2 highest of 464 markets
- Median households income, 2022: $80,828 — #74 highest of 464 markets
- Pct households making over $200,000: 13.5% (compared to 11.4% nationwide)
- Population, 2022: 26,078
3. Kahului-Wailuku-Lahaina, Hawaii
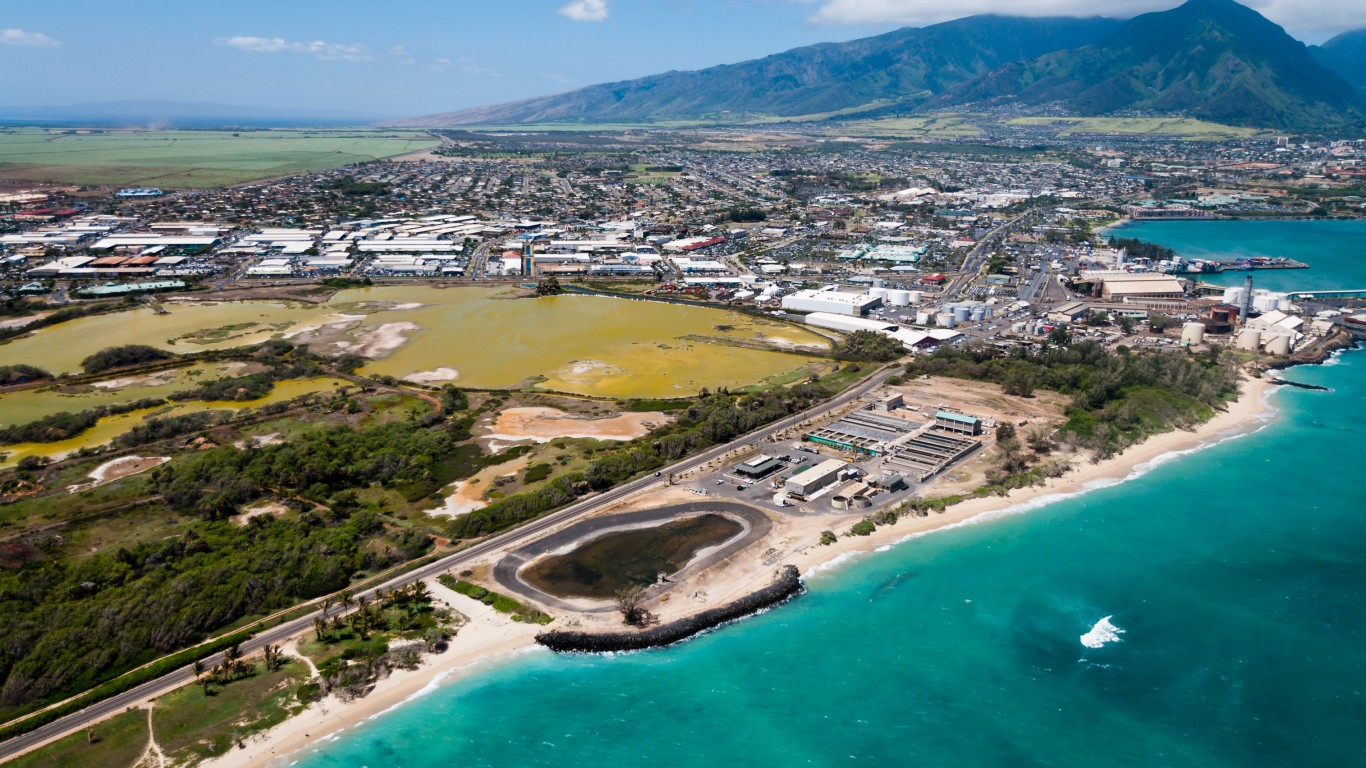
Source: unclegene / iStock via Getty Images
- Median listing price, Feb 2024: $1,412,500 (+1.3% from Feb 2023)
- Median listing price, Feb 2023: $1,395,000 — #4 highest of 464 markets
- Median listing price per sq ft, Feb 2024: $1,279 — #1 highest of 464 markets
- Median households income, 2022: $95,379 — #18 highest of 464 markets
- Pct households making over $200,000: 15.8% (compared to 11.4% nationwide)
- Population, 2022: 164,765
2. Napa, California
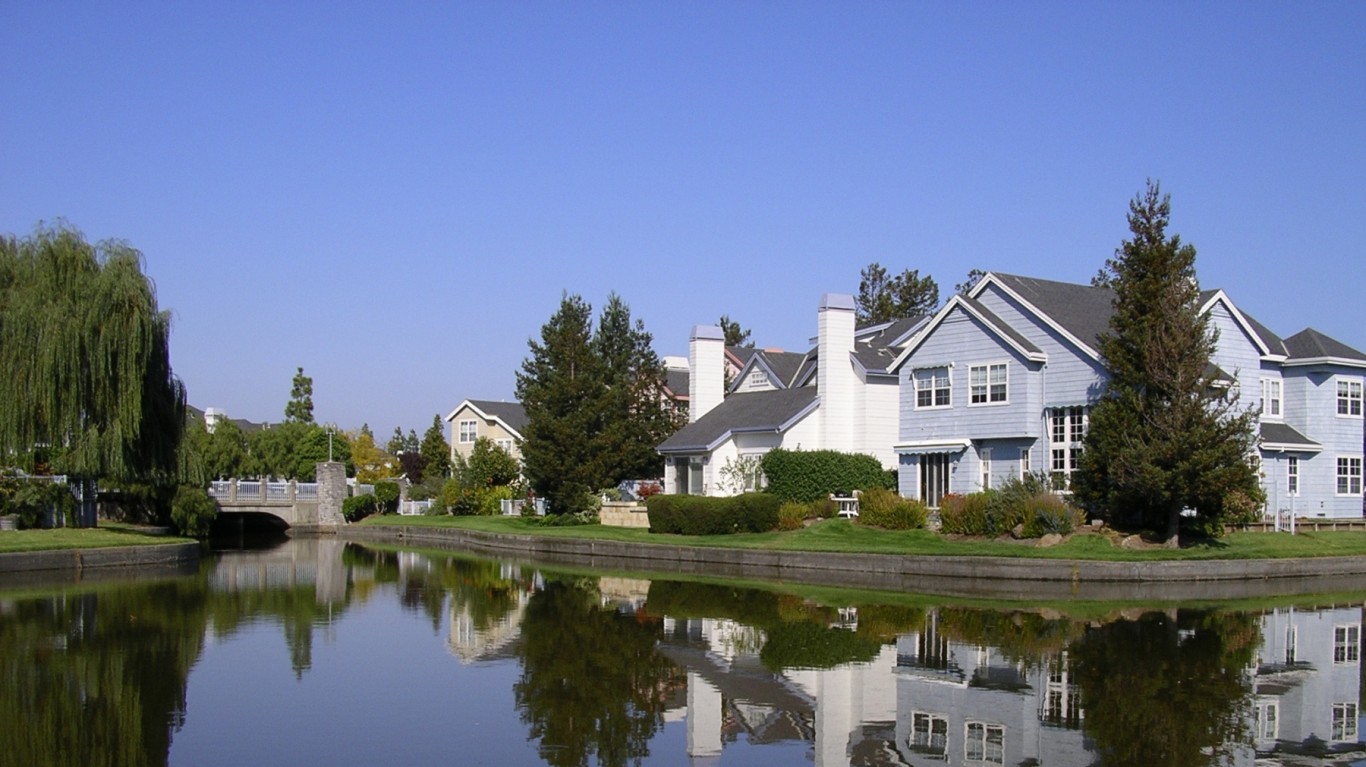
Source: ejs9 / iStock via Getty Images
- Median listing price, Feb 2024: $1,449,500 (+2.9% from Feb 2023)
- Median listing price, Feb 2023: $1,409,250 — #2 highest of 464 markets
- Median listing price per sq ft, Feb 2024: $706 — #7 highest of 464 markets
- Median households income, 2022: $105,809 — #8 highest of 464 markets
- Pct households making over $200,000: 20.6% (compared to 11.4% nationwide)
- Population, 2022: 137,384
1. Santa Maria-Santa Barbara, California
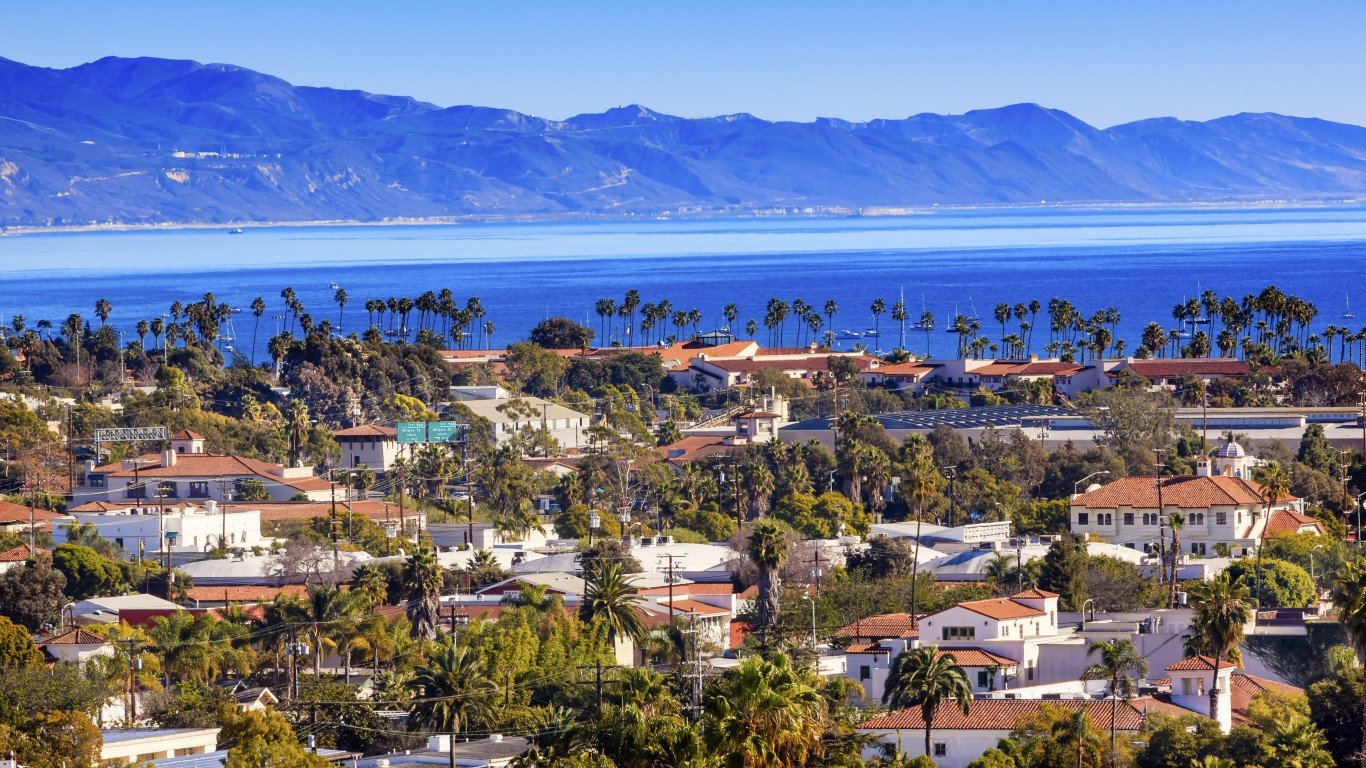
Source: bpperry / iStock via Getty Images
- Median listing price, Feb 2024: $1,779,750 (+32.5% from Feb 2023)
- Median listing price, Feb 2023: $1,343,750 — #5 highest of 464 markets
- Median listing price per sq ft, Feb 2024: $919 — #3 highest of 464 markets
- Median households income, 2022: $92,332 — #28 highest of 464 markets
- Pct households making over $200,000: 18.0% (compared to 11.4% nationwide)
- Population, 2022: 445,213
Sponsored: Attention Savvy Investors: Speak to 3 Financial Experts – FREE
Ever wanted an extra set of eyes on an investment you’re considering? Now you can speak with up to 3 financial experts in your area for FREE. By simply
clicking here you can begin to match with financial professionals who can help guide you through the financial decisions you’re making. And the best part? The first conversation with them is free.
Click here to match with up to 3 financial pros who would be excited to help you make financial decisions.
Thank you for reading! Have some feedback for us?
Contact the 24/7 Wall St. editorial team.
Editors' Picks