
The federal government of the United States has carried some level of debt every year since George Washington’s first term as president. But while the national debt is as old as the country itself, levels of government borrowing have recently reached unsustainable levels. The U.S. has not had a balanced budget in over two decades, and the federal debt is now growing faster than the economy. Currently, the government owes nearly $34.6 trillion, a 100% increase from only 10 years ago.
With the national debt at unprecedented highs, 2024 will be the first year since at least 1940 that borrowing costs will exceed defense spending. According to the Congressional Budget Office, interest payments on the national debt are projected to hit $870 billion this year, compared to a planned $822 billion defense budget. Over the next decade, interest payments are expected to total a staggering $12.4 trillion.
Fundamentally, the national debt is driven by a mismatch between revenue and spending. Wars in the Middle East and Afghanistan, stimulus payments during the Great Recession and the COVID-19 pandemic, and rising Medicare costs have sent government spending soaring in recent years. Meanwhile, tax cuts under multiple presidential administrations have reduced government revenue. And while calls for fiscal responsibility and debt reduction are common in Washington D.C., they have rarely been matched with a demonstrated commitment to achieving those goals.
Using data from the U.S. Treasury Department, 24/7 Wall St. determined how the national debt changed under each of the 21 U.S. presidents who took the oath of office in the 20th or 21st centuries. For each presidential administration, we calculated the compound annual growth rate of the national debt, from their first year in office to their last. Annual debt measurements used in these calculations are for the end of each government fiscal year and are not adjusted for inflation. Presidents are ranked from the largest average annual decrease to the national debt, to the largest increase.
While American presidents have mandatory spending obligations, such as Social Security and Medicare, they have some level of control over discretionary budgets, as well as taxes. Still, a president’s budget, as well as any proposed changes to the tax code, must receive congressional approval. As a result, a president’s relationship with lawmakers on Capitol Hill matters. Other factors, such as GDP growth, can also either help or hinder a president’s budgetary goals. (Here is a look at the sitting U.S. Senators doing the most in office.)
Of the 21 presidents on this list — from Theodore Roosevelt to Joe Biden — only two led during a period of debt reduction, and both held office in the 1920s, an era of rapid economic expansion. Meanwhile, the debt increased by an average annual rate of anywhere from 0.4% to 30.1% during every other president’s time in office. (Here is a look at the federal agencies wasting the most taxpayer money.)
Among the five presidents who oversaw the largest average annual increase in the national debt, two were Democrats and three were Republicans. The highest ranking president on this list served during America’s entry into World War I, an event that sent government spending soaring. The second highest ranking president on this list served during the Great Depression and America’s entry into World War II.
Why It Matters

Source: 2024 Getty Images / Getty Images News via Getty Images
The federal budget and the U.S. economy are among the chief responsibilities of Congress and the President. But as decades of deficit spending have sent the national debt soaring, borrowing costs stand at all-time highs. Higher interest payments mean less money for investment in public services, like infrastructure, education and research. Additionally, at current levels, the national debt reduces the government’s ability to effectively respond to crises and also jeopardizes the long-term viability of social safety net programs.
21. Calvin Coolidge (in office from 1923–1929)

Source: Public Domain / Wikimedia Commons
- Avg. annual change in national debt, fiscal 1923-1929: -4.5% (-$903.1 million)
- Total change in national debt, fiscal 1923-1929: -24.2% (-$5.4 billion)
- National debt at the end of fiscal 1929: $16.9 billion
- National debt at the end of fiscal 1923: $22.3 billion
- Party affiliation: Republican
20. Warren G. Harding (in office from 1921–1923)
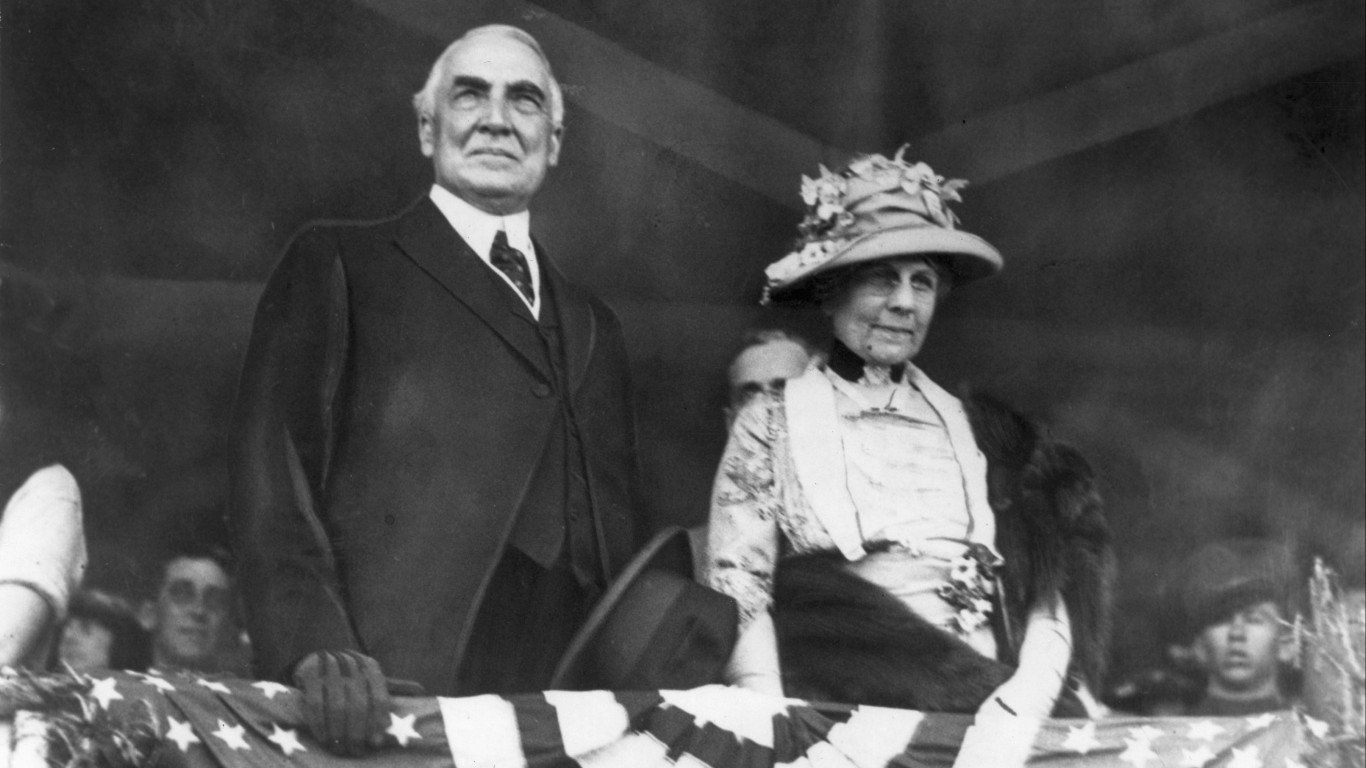
Source: Hulton Archive / Archive Photos via Getty Images
- Avg. annual change in national debt, fiscal 1921-1923: -3.5% (-$813.9 million)
- Total change in national debt, fiscal 1921-1923: -6.8% (-$1.6 billion)
- National debt at the end of fiscal 1923: $22.3 billion
- National debt at the end of fiscal 1921: $24.0 billion
- Party affiliation: Republican
19. Harry S. Truman (in office from 1945–1953)

Source: Fotosearch / Archive Photos via Getty Images
- Avg. annual change in national debt, fiscal 1945-1953: +0.4% (+$923.6 million)
- Total change in national debt, fiscal 1945-1953: +2.9% (+$7.4 billion)
- National debt at the end of fiscal 1953: $266.1 billion
- National debt at the end of fiscal 1945: $258.7 billion
- Party affiliation: Democratic
18. Dwight D. Eisenhower (in office from 1953–1961)
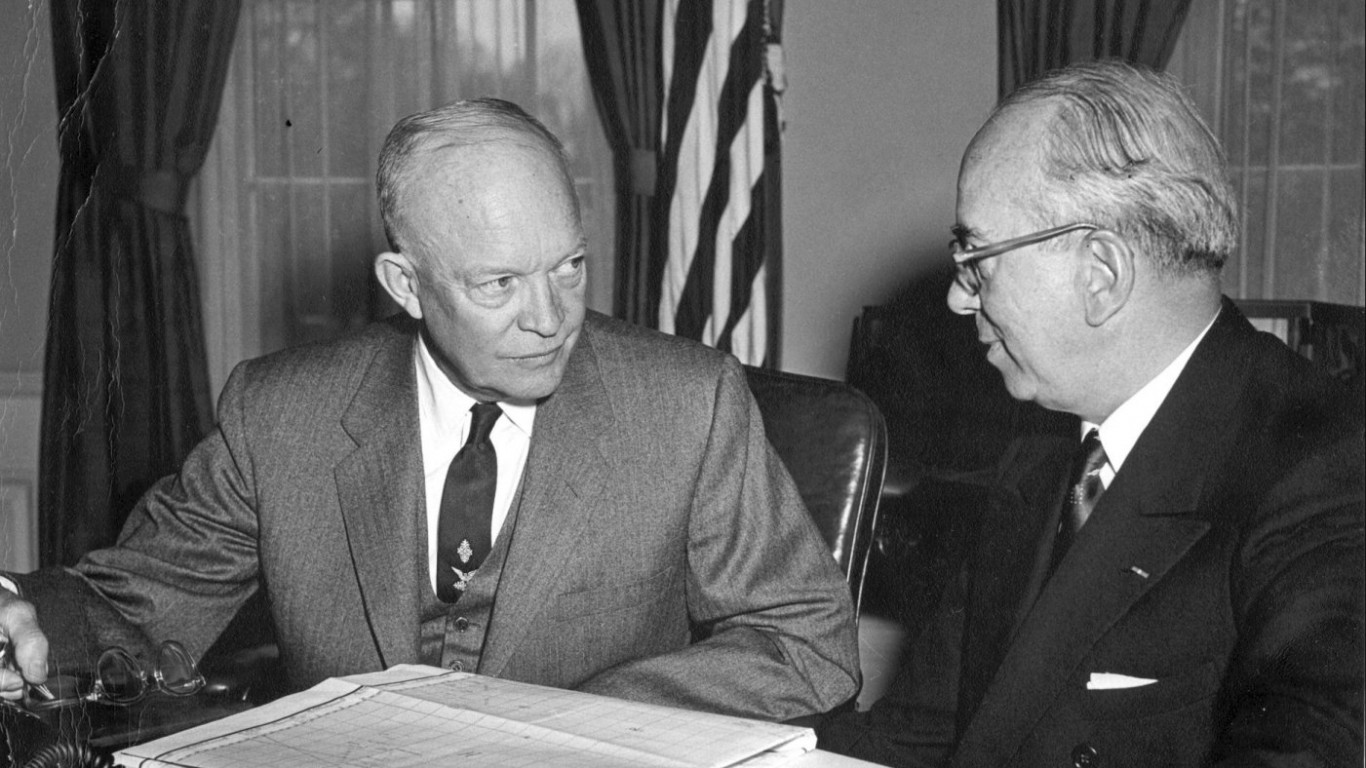
Source: Public Domain / Wikimedia Commons
- Avg. annual change in national debt, fiscal 1953-1961: +1.0% (+$2.9 billion)
- Total change in national debt, fiscal 1953-1961: +8.6% (+$22.9 billion)
- National debt at the end of fiscal 1961: $289.0 billion
- National debt at the end of fiscal 1953: $266.1 billion
- Party affiliation: Republican
17. Lyndon B. Johnson (in office from 1963–1969)
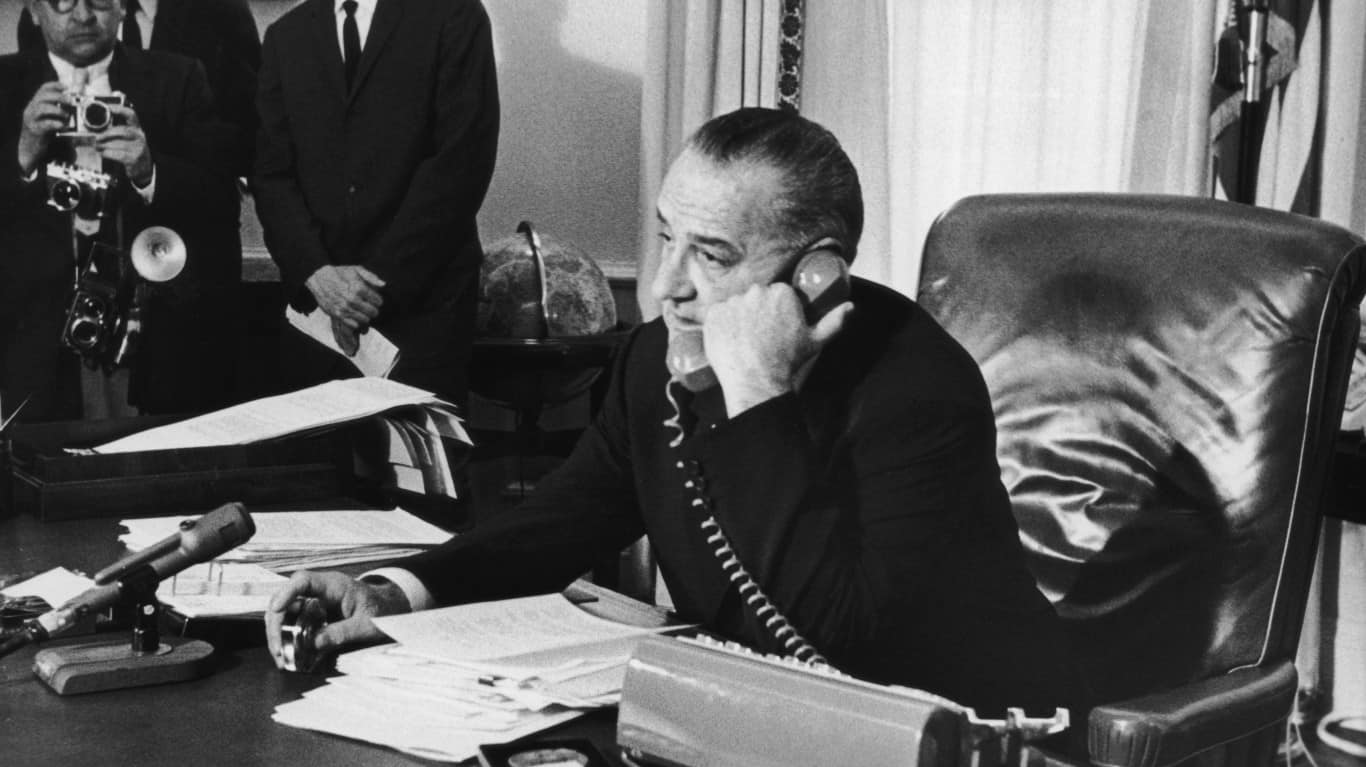
Source: Gene Forte / Hulton Archive via Getty Images
- Avg. annual change in national debt, fiscal 1963-1969: +2.5% (+$8.0 billion)
- Total change in national debt, fiscal 1963-1969: +15.6% (+$47.9 billion)
- National debt at the end of fiscal 1969: $353.7 billion
- National debt at the end of fiscal 1963: $305.9 billion
- Party affiliation: Democratic
16. William Howard Taft (in office from 1909–1913)

Source: Public Domain / Wikimedia Commons
- Avg. annual change in national debt, fiscal 1909-1913: +2.5% (+$69.2 million)
- Total change in national debt, fiscal 1909-1913: +10.5% (+$276.7 million)
- National debt at the end of fiscal 1913: $2.9 billion
- National debt at the end of fiscal 1909: $2.6 billion
- Party affiliation: Republican
15. Theodore Roosevelt (in office from 1901–1909)

Source: Photos.com / PHOTOS.com>> via Getty Images
- Avg. annual change in national debt, fiscal 1901-1909: +2.6% (+$62.0 million)
- Total change in national debt, fiscal 1901-1909: +23.2% (+$496.2 million)
- National debt at the end of fiscal 1909: $2.6 billion
- National debt at the end of fiscal 1901: $2.1 billion
- Party affiliation: Republican
14. John F. Kennedy (in office from 1961–1963)

Source: Public Domain / Wikimedia Commons
- Avg. annual change in national debt, fiscal 1961-1963: +2.9% (+$8.4 billion)
- Total change in national debt, fiscal 1961-1963: +5.8% (+$16.9 billion)
- National debt at the end of fiscal 1963: $305.9 billion
- National debt at the end of fiscal 1961: $289.0 billion
- Party affiliation: Democratic
13. William J. Clinton (in office from 1993–2001)

Source: Public Domain / Wikimedia Commons
- Avg. annual change in national debt, fiscal 1993-2001: +3.5% (+$174.5 billion)
- Total change in national debt, fiscal 1993-2001: +31.6% (+$1.4 trillion)
- National debt at the end of fiscal 2001: $5.8 trillion
- National debt at the end of fiscal 1993: $4.4 trillion
- Party affiliation: Democratic
12. Richard M. Nixon (in office from 1969–1974)
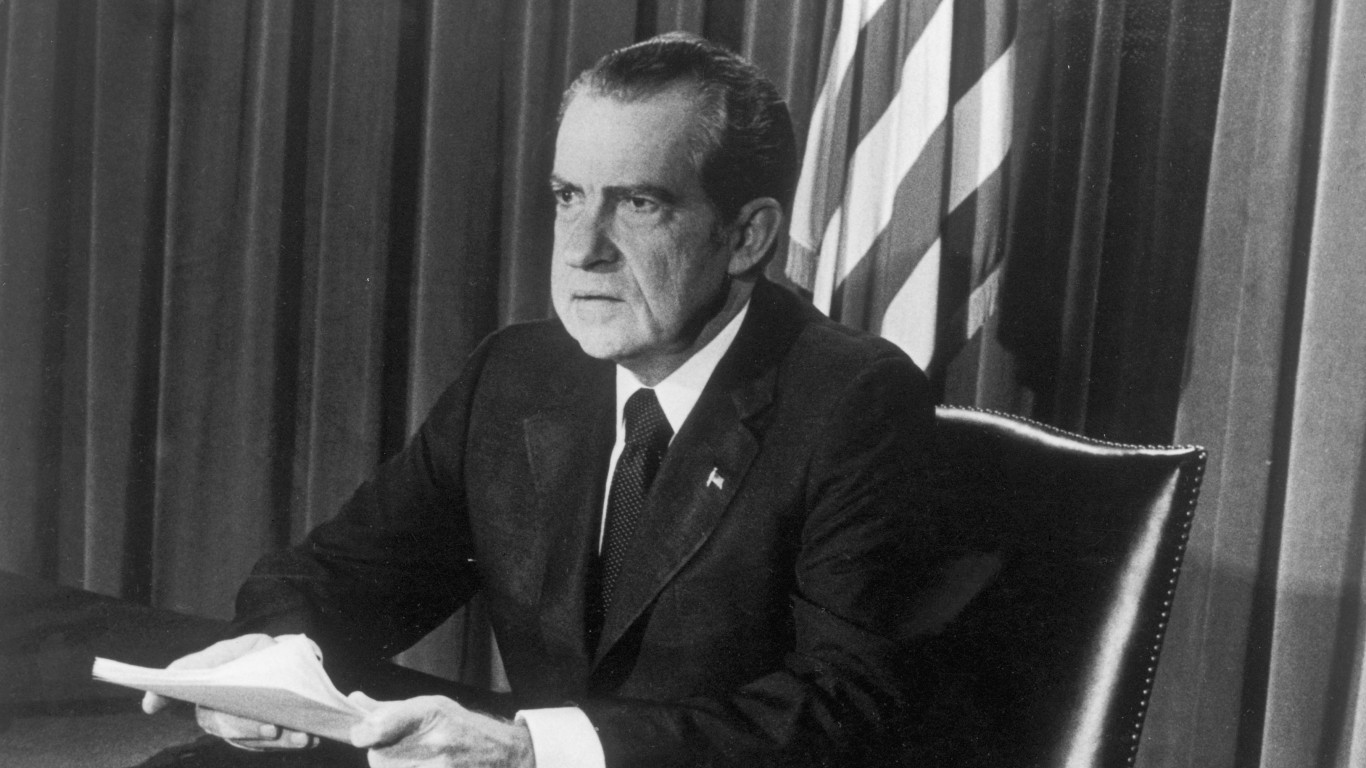
Source: Hulton Archive / Archive Photos via Getty Images
- Avg. annual change in national debt, fiscal 1969-1974: +6.1% (+$24.3 billion)
- Total change in national debt, fiscal 1969-1974: +34.3% (+$121.3 billion)
- National debt at the end of fiscal 1974: $475.1 billion
- National debt at the end of fiscal 1969: $353.7 billion
- Party affiliation: Republican
11. Barack Obama (in office from 2009–2017)

Source: Win McNamee / Getty Images News via Getty Images
- Avg. annual change in national debt, fiscal 2009-2017: +6.9% (+$1.0 trillion)
- Total change in national debt, fiscal 2009-2017: +70.0% (+$8.3 trillion)
- National debt at the end of fiscal 2017: $20.2 trillion
- National debt at the end of fiscal 2009: $11.9 trillion
- Party affiliation: Democratic
10. Herbert Hoover (in office from 1929–1933)
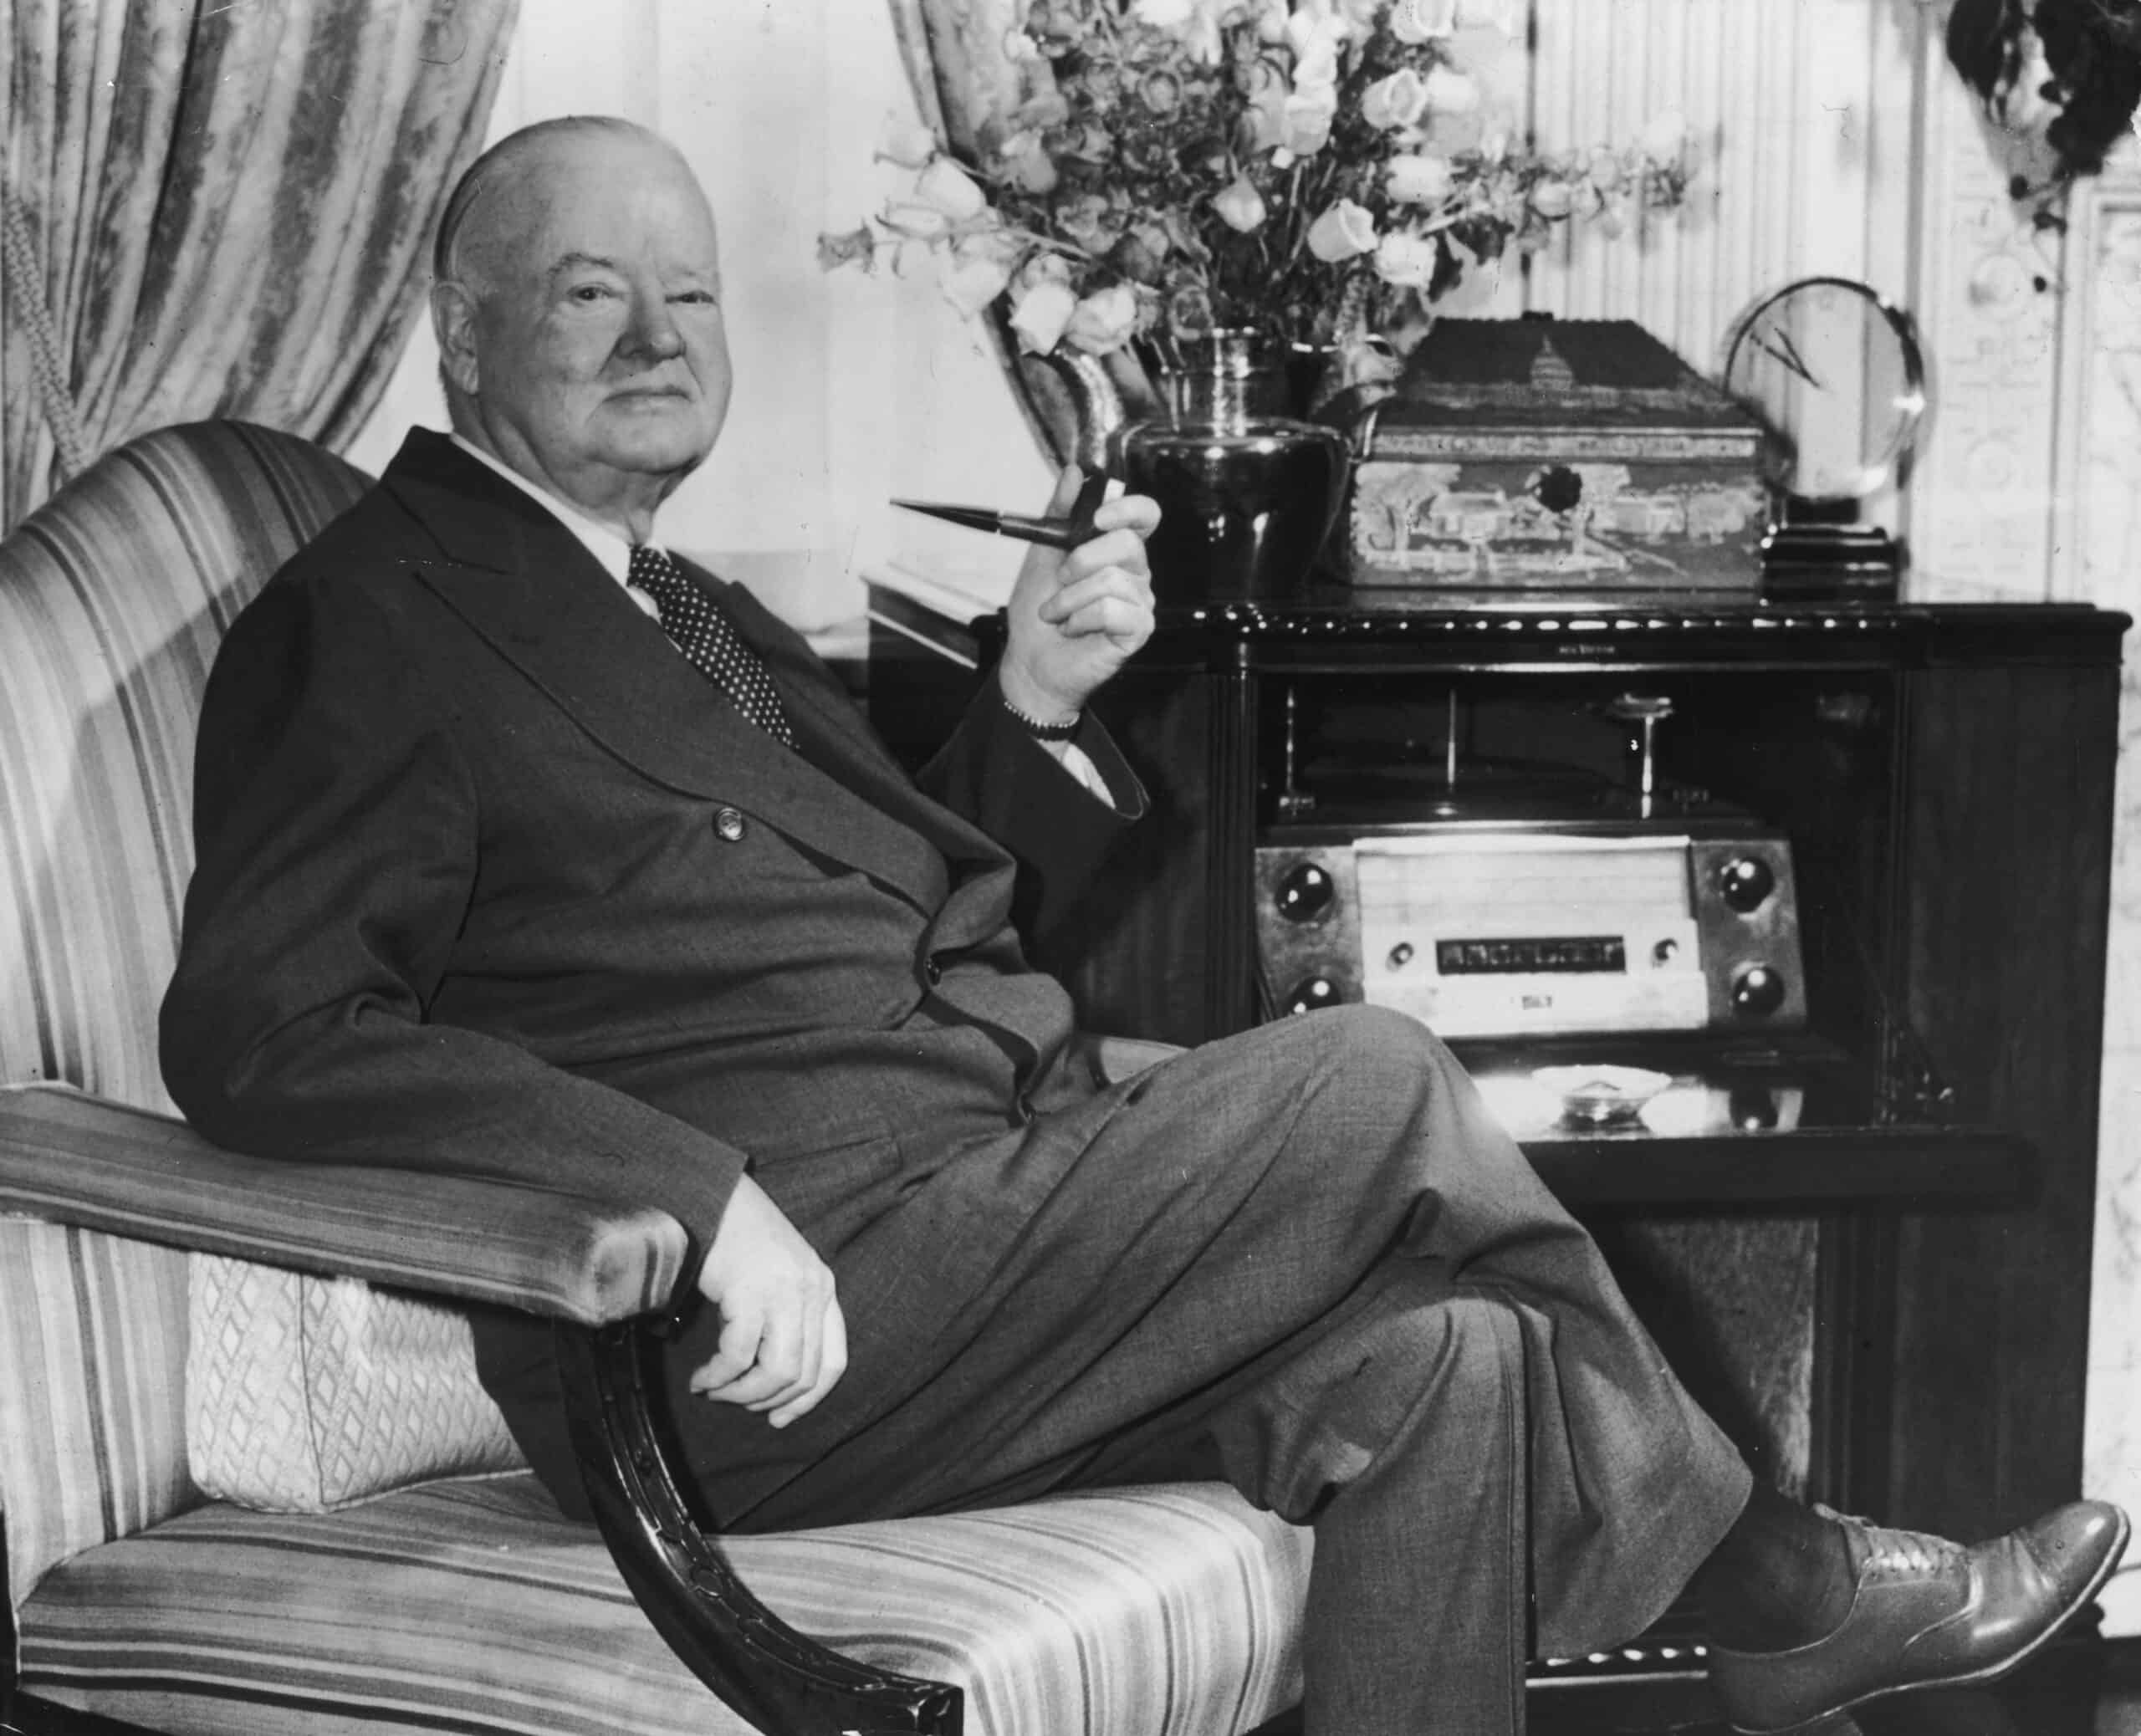
Source: Hulton Archive / Archive Photos via Getty Images
- Avg. annual change in national debt, fiscal 1929-1933: +7.4% (+$1.4 billion)
- Total change in national debt, fiscal 1929-1933: +33.1% (+$5.6 billion)
- National debt at the end of fiscal 1933: $22.5 billion
- National debt at the end of fiscal 1929: $16.9 billion
- Party affiliation: Republican
9. Joseph R. Biden Jr. (in office from 2021–present)
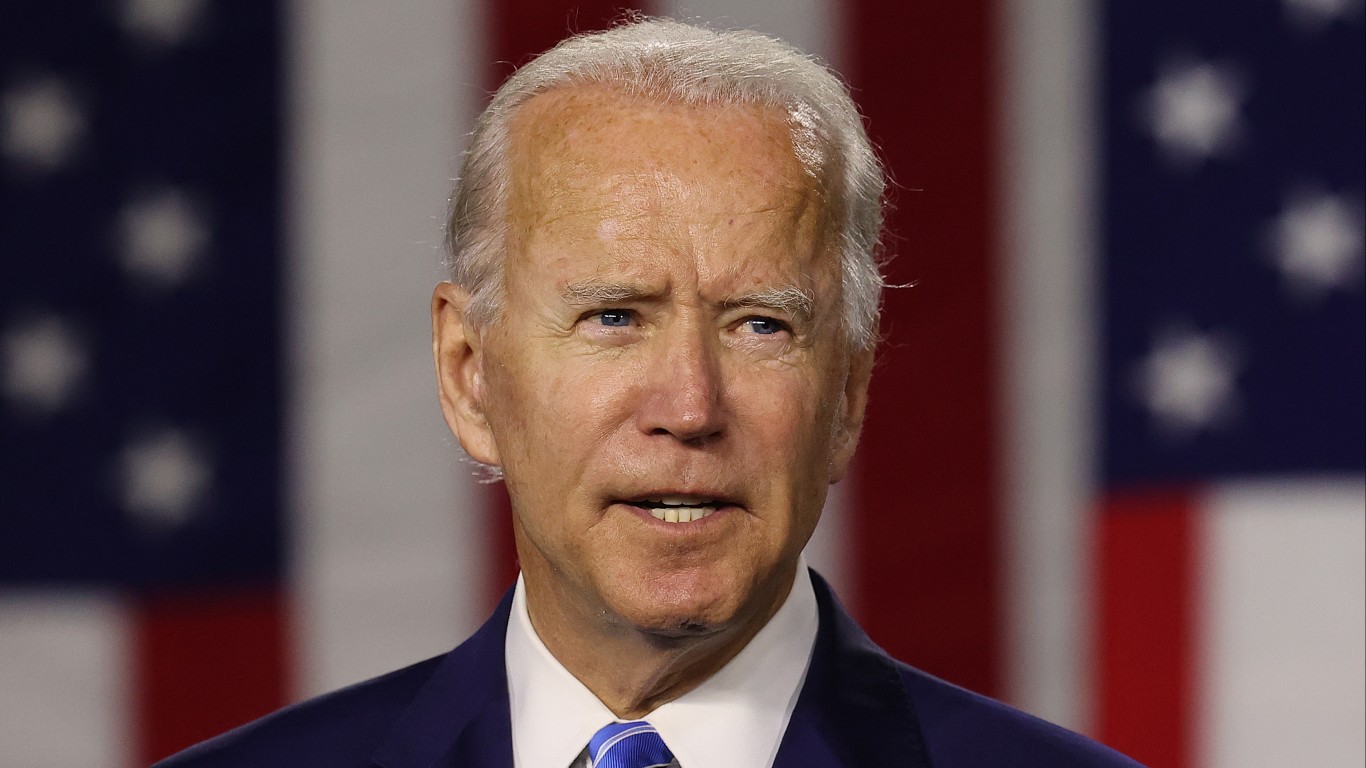
Source: Chip Somodevilla / Getty Images News via Getty Images
- Avg. annual change in national debt, fiscal 2021-2023: +8.0% (+$2.4 trillion)
- Total change in national debt, fiscal 2021-2023: +16.7% (+$4.7 trillion)
- National debt at the end of fiscal 2023: $33.2 trillion
- National debt at the end of fiscal 2021: $28.4 trillion
- Party affiliation: Democratic
8. Donald J. Trump (in office from 2017–2021)

Source: Public Domain / Wikimedia Commons
- Avg. annual change in national debt, fiscal 2017-2021: +8.9% (+$2.0 trillion)
- Total change in national debt, fiscal 2017-2021: +40.4% (+$8.2 trillion)
- National debt at the end of fiscal 2021: $28.4 trillion
- National debt at the end of fiscal 2017: $20.2 trillion
- Party affiliation: Republican
7. Jimmy Carter (in office from 1977–1981)
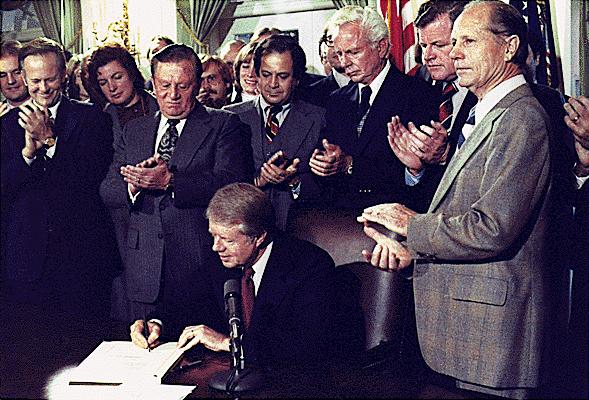
Source: Public Domain / Wikimedia Commons
- Avg. annual change in national debt, fiscal 1977-1981: +9.3% (+$74.8 billion)
- Total change in national debt, fiscal 1977-1981: +42.8% (+$299.0 billion)
- National debt at the end of fiscal 1981: $997.9 billion
- National debt at the end of fiscal 1977: $698.8 billion
- Party affiliation: Democratic
6. George W. Bush (in office from 2001–2009)
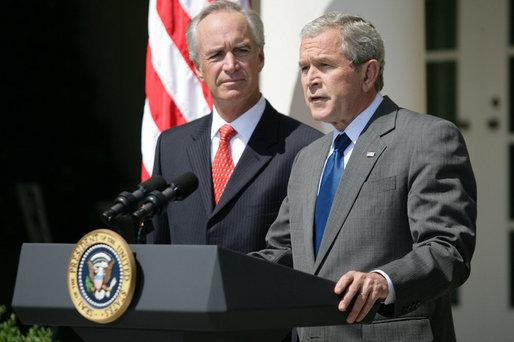
Source: Public Domain / Wikimedia Commons
- Avg. annual change in national debt, fiscal 2001-2009: +9.4% (+$762.8 billion)
- Total change in national debt, fiscal 2001-2009: +105.1% (+$6.1 trillion)
- National debt at the end of fiscal 2009: $11.9 trillion
- National debt at the end of fiscal 2001: $5.8 trillion
- Party affiliation: Republican
5. George H.W. Bush (in office from 1989–1993)
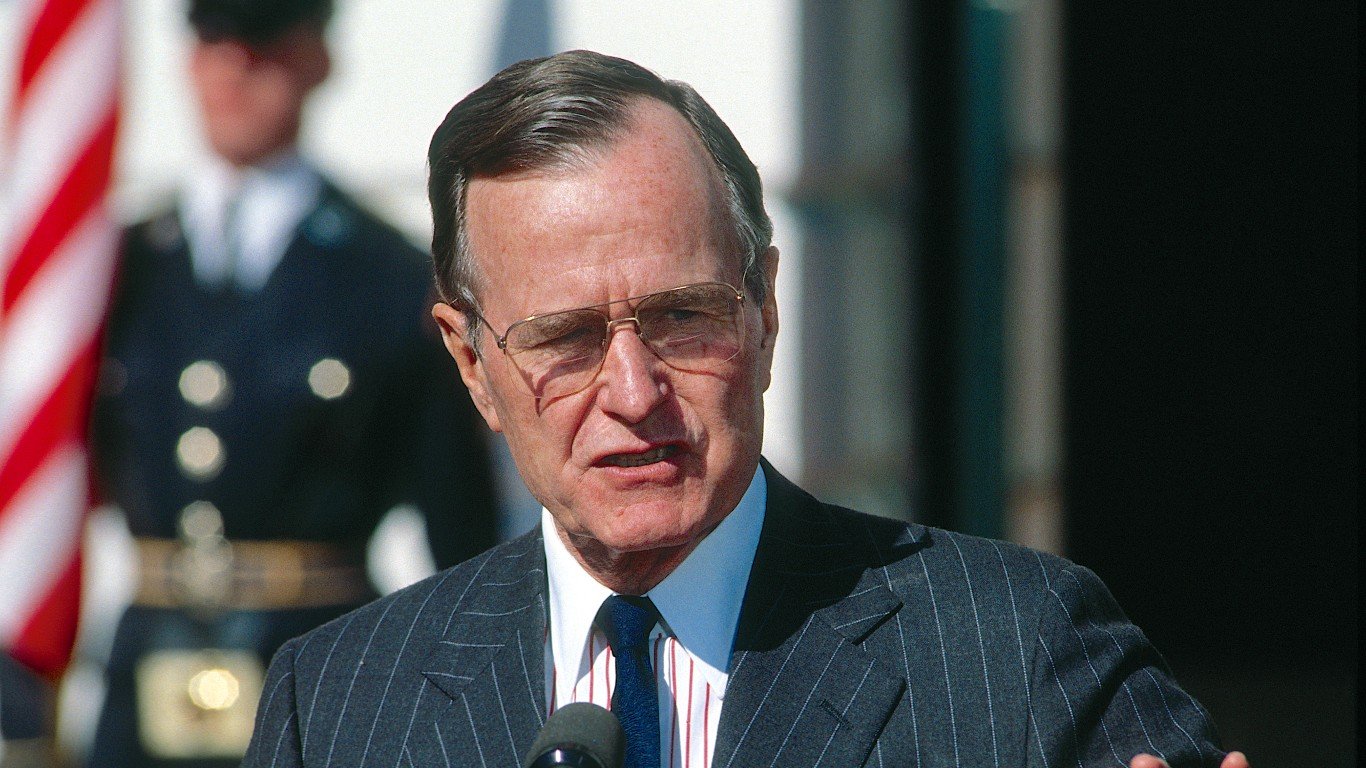
Source: Mark Reinstein / Getty Images
- Avg. annual change in national debt, fiscal 1989-1993: +11.5% (+$388.5 billion)
- Total change in national debt, fiscal 1989-1993: +54.4% (+$1.6 trillion)
- National debt at the end of fiscal 1993: $4.4 trillion
- National debt at the end of fiscal 1989: $2.9 trillion
- Party affiliation: Republican
4. Gerald R. Ford (in office from 1974–1977)
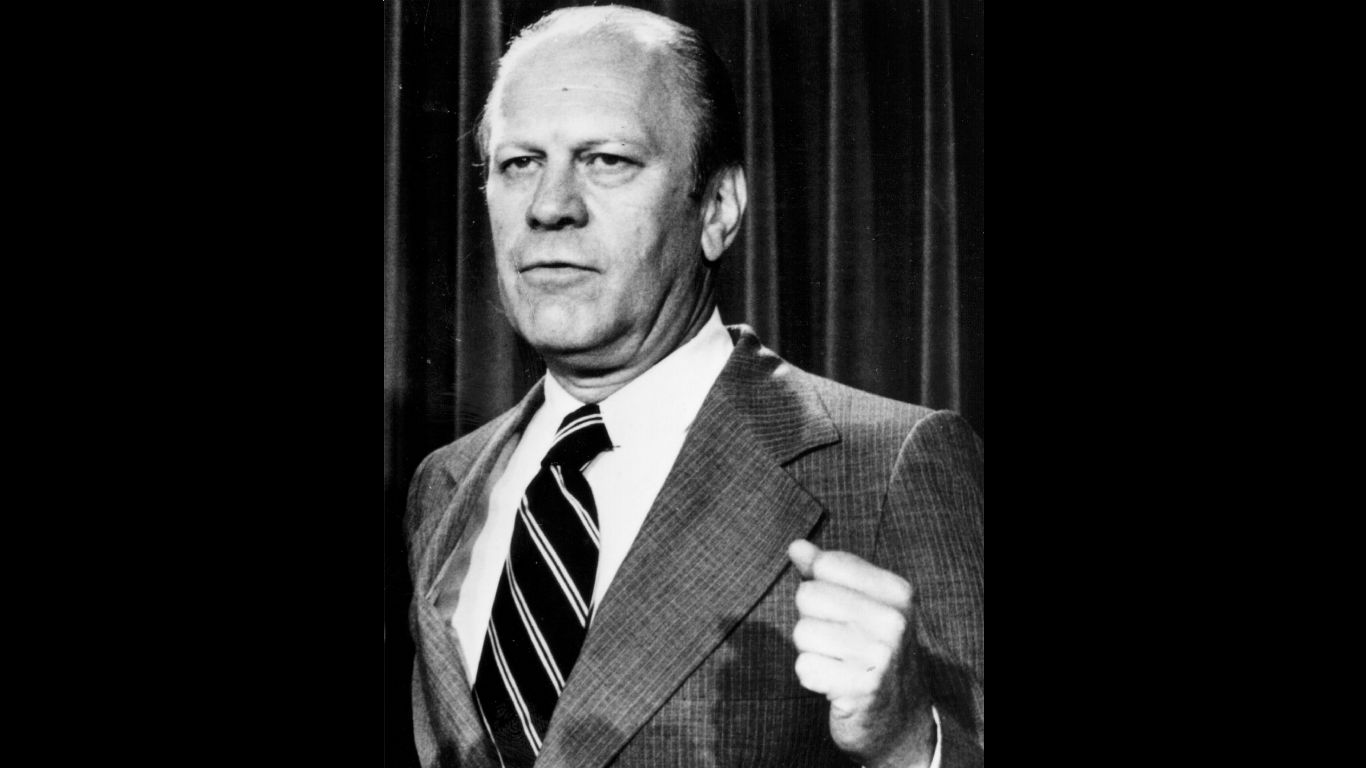
Source: Keystone / Getty Images
- Avg. annual change in national debt, fiscal 1974-1977: +13.7% (+$74.6 billion)
- Total change in national debt, fiscal 1974-1977: +47.1% (+$223.8 billion)
- National debt at the end of fiscal 1977: $698.8 billion
- National debt at the end of fiscal 1974: $475.1 billion
- Party affiliation: Republican
3. Ronald Reagan (in office from 1981–1989)

Source: Getty Images / Handout
- Avg. annual change in national debt, fiscal 1981-1989: +14.1% (+$232.4 billion)
- Total change in national debt, fiscal 1981-1989: +186.4% (+$1.9 trillion)
- National debt at the end of fiscal 1989: $2.9 trillion
- National debt at the end of fiscal 1981: $997.9 billion
- Party affiliation: Republican
2. Franklin D. Roosevelt (in office from 1933–1945)

Source: Fotosearch / Archive Photos via Getty Images
- Avg. annual change in national debt, fiscal 1933-1945: +22.6% (+$19.7 billion)
- Total change in national debt, fiscal 1933-1945: +1,047.7% (+$236.1 billion)
- National debt at the end of fiscal 1945: $258.7 billion
- National debt at the end of fiscal 1933: $22.5 billion
- Party affiliation: Democratic
1. Woodrow Wilson (in office from 1913–1921)
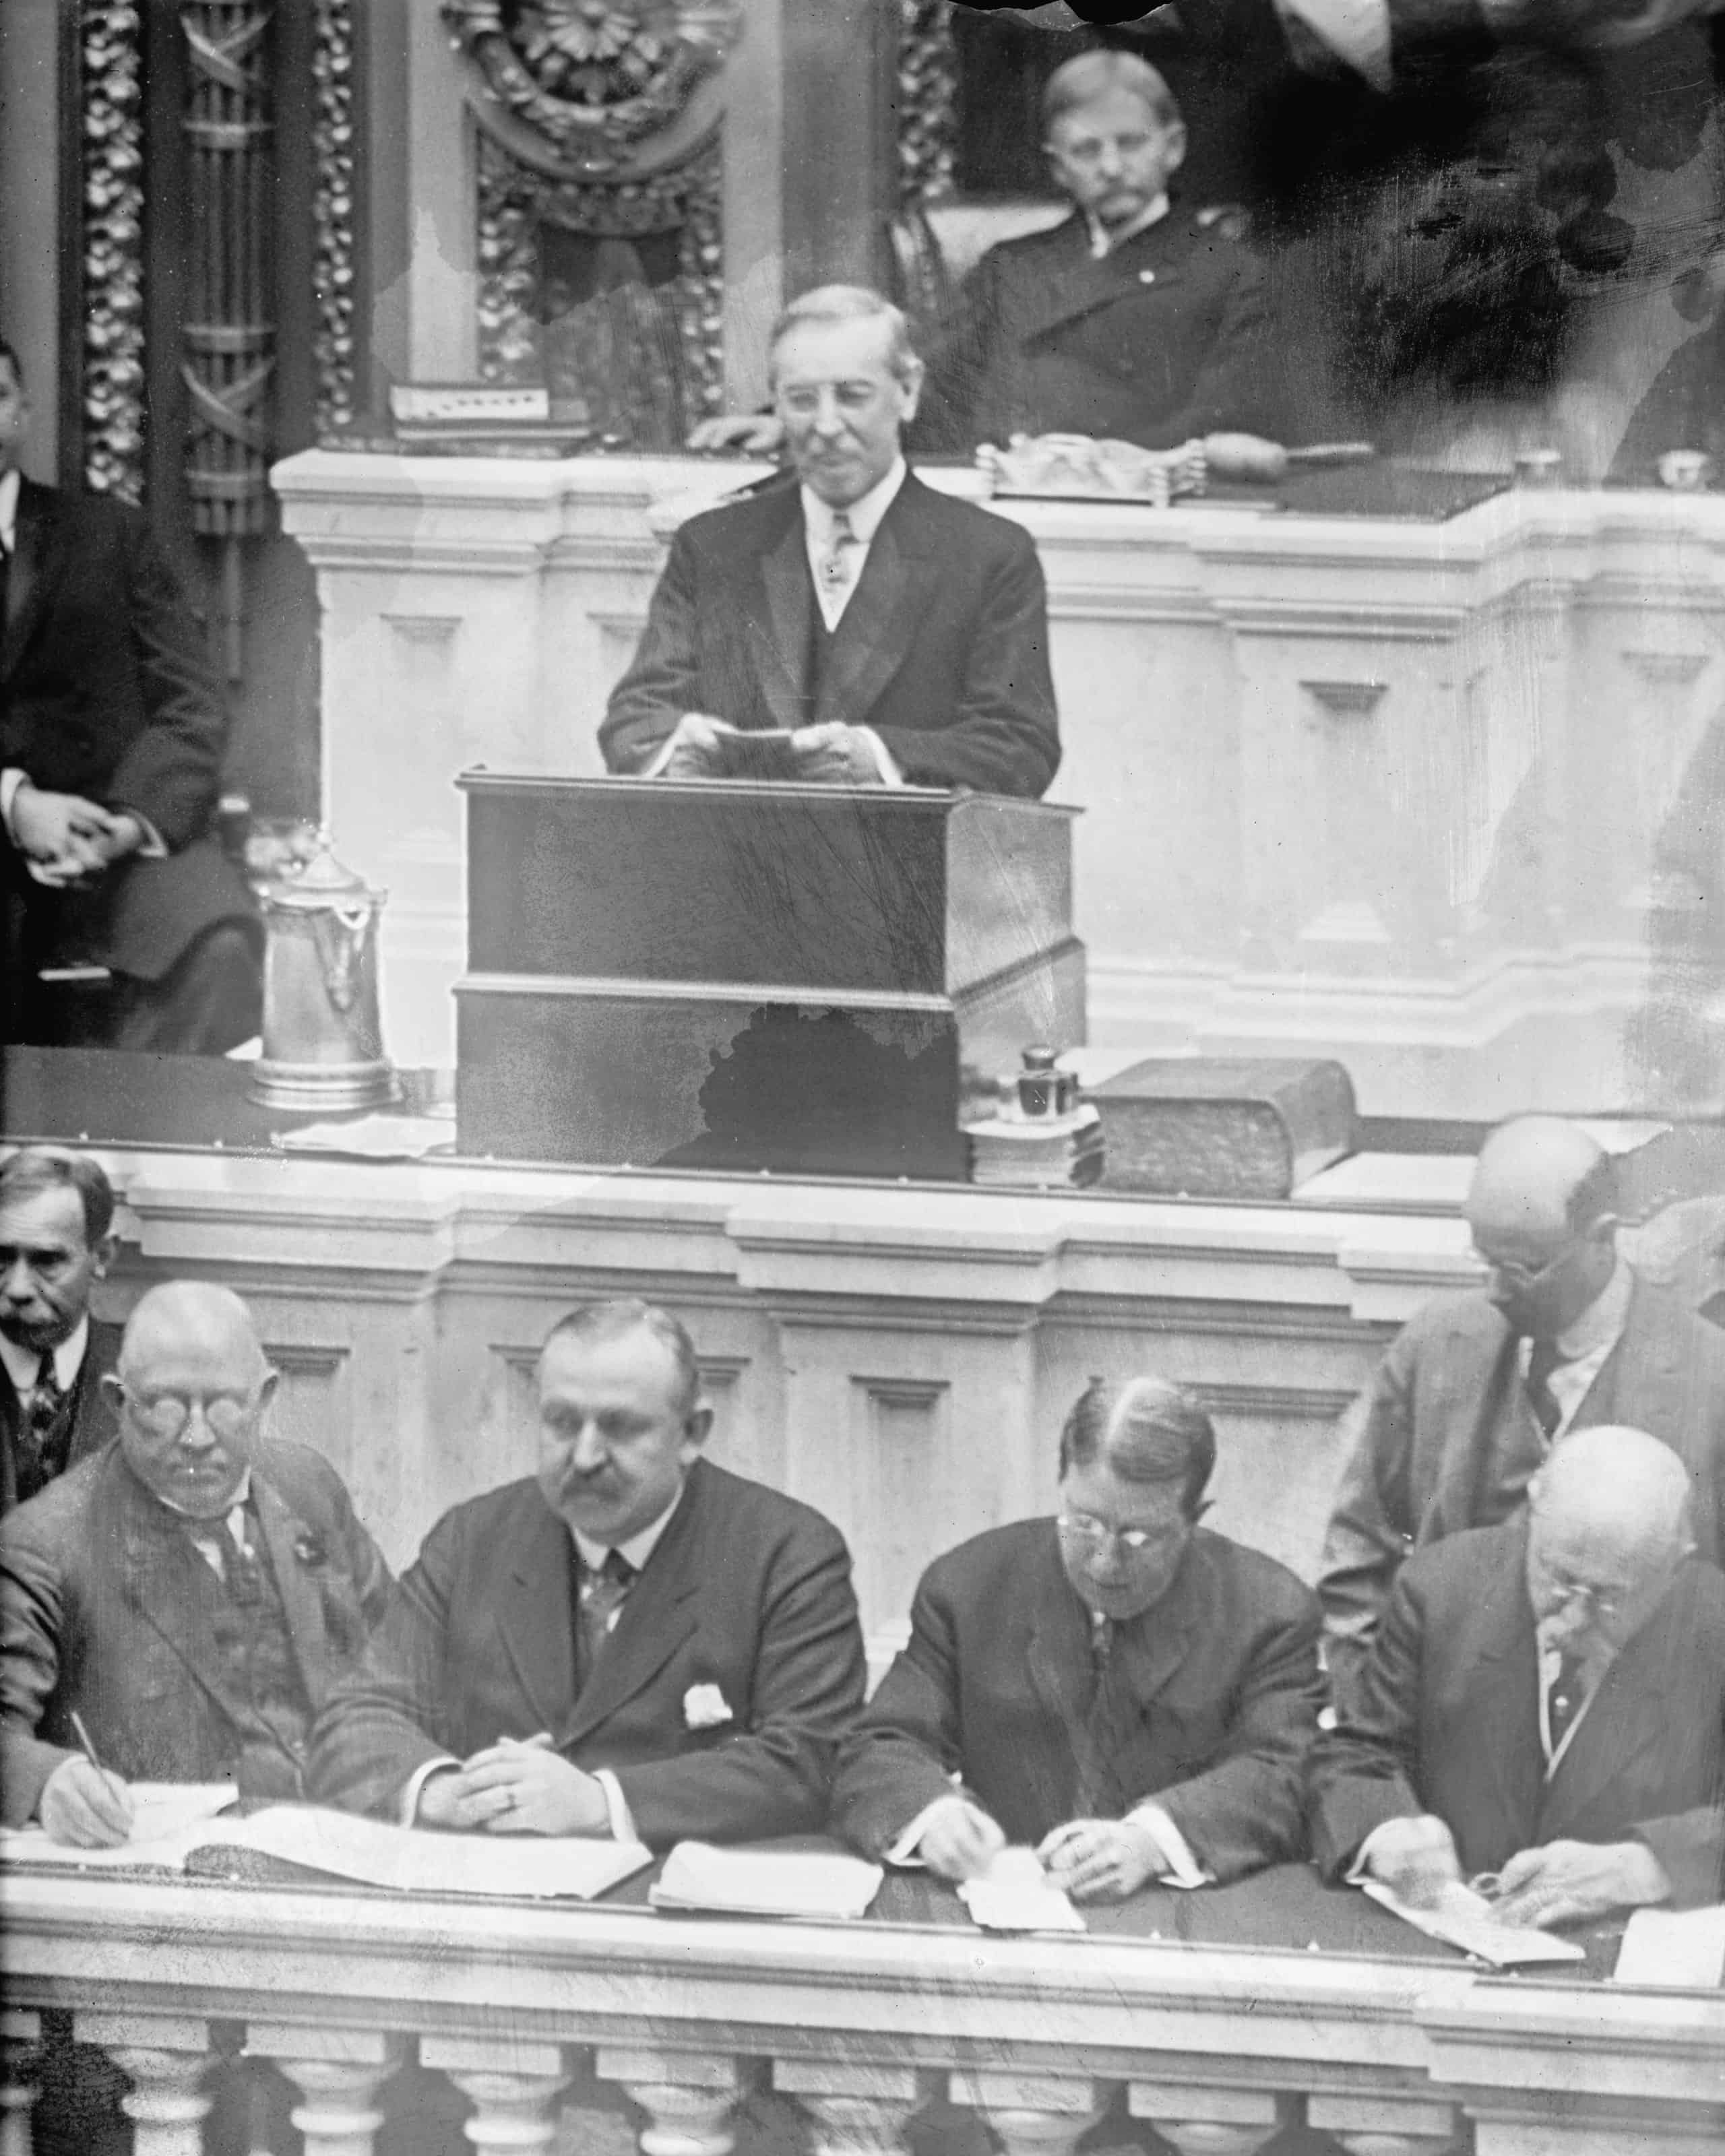
Source: Public Domain / Wikimedia Commons
- Avg. annual change in national debt, fiscal 1913-1921: +30.1% (+$2.6 billion)
- Total change in national debt, fiscal 1913-1921: +722.2% (+$21.1 billion)
- National debt at the end of fiscal 1921: $24.0 billion
- National debt at the end of fiscal 1913: $2.9 billion
- Party affiliation: Democratic
ALERT: Take This Retirement Quiz Now (Sponsored)
Take the quiz below to get matched with a financial advisor today.
Each advisor has been vetted by SmartAsset and is held to a fiduciary standard to act in your best interests.
Here’s how it works:
1. Answer SmartAsset advisor match quiz
2. Review your pre-screened matches at your leisure. Check out the advisors’ profiles.
3. Speak with advisors at no cost to you. Have an introductory call on the phone or introduction in person and choose whom to work with in the future
Take the retirement quiz right here.
Thank you for reading! Have some feedback for us?
Contact the 24/7 Wall St. editorial team.