“When you’re alone and life is making you lonely, You can always go downtown,” Petula Clark famously sang in Tony Hatch’s song “Downtown.” But of course, for that you need a booming and happening downtown, and not all cities have one.
To determine the 40 cities with booming downtowns, 24/7 Wall St. ranked cities based on the percentage change in population in their downtown census tracts from 2012 to 2022, using Census Bureau data.
Some Midwestern cities on the list have known decades of economic struggles and their populations have generally been declining — yet their downtowns are booming as the populations have been shifting to the downtown areas. For example, while the downtown census tracts of Cleveland and Detroit are growing (populations hae grown by 20% and 42%, respectively, in the past decade), the non-downtown tracts of these cities are shrinking.
On the other hand, some metropolitan areas are growing overall, and this is also being reflected in their downtown core, such as the case with Palm Coast, Florida. (Also see: America’s Most Dangerous City.)
Another indication of a booming downtown can be gleaned from the income per capita in these census tracts. In some of the downtown areas on the list, income per capita grew by more than 50%. In fact, in a few, income per capita in the downtown areas grew considerably more than in the non-downtown areas. For example, in Phoenix, income per capita in downtown rose by 74% in the past decade compared to 22% in the non-downtown areas. Similarly, in Nashville, down income per capita grew by 87% compared to a 25% growth in non-downtown areas.
Full methodology
To determine the cities with booming downtowns, 24/7 Wall St. reviewed five-year data on population change from the U.S. Census Bureau’s 2022 American Community Survey. Cities were ranked based on the percentage change in population in their downtown census tracts from 2012 to 2022. Downtown areas were defined as the census tracts that fall at least 50% within the 1.8-mile radius around a city hall. Non-downtown areas were defined as the census tracts that fall at least 50% within a city’s boundaries, yet less than 50% within the 1.8-mile radius around city hall. Boundary definitions are from the U.S. Census Bureau and are for 2022. Only principal cities of metropolitan statistical areas were considered. City hall coordinates as well as supplemental data on income are also from the Census Bureau.
40. Salinas, California
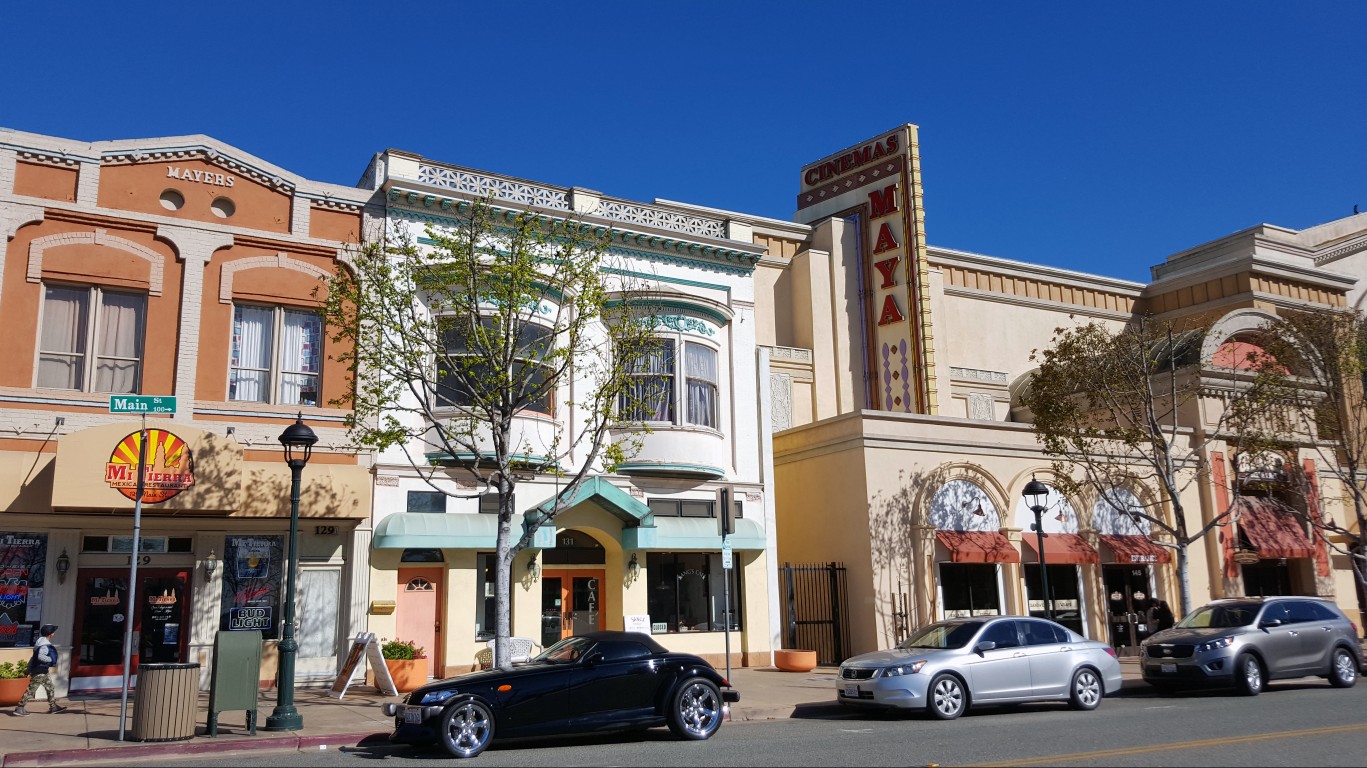
Source: Solidago / Getty Images
- Population change in downtown tracts, 2012 to 2022: +14.5%
- Population change of non-downtown tracts, 2012 to 2022: +5.9%
- Per capita income change in downtown tracts, 2012 to 2022: +7.8%
- Per capita income change in non-downtown tracts, 2012 to 2022: +21.5%
39. Longview, Washington
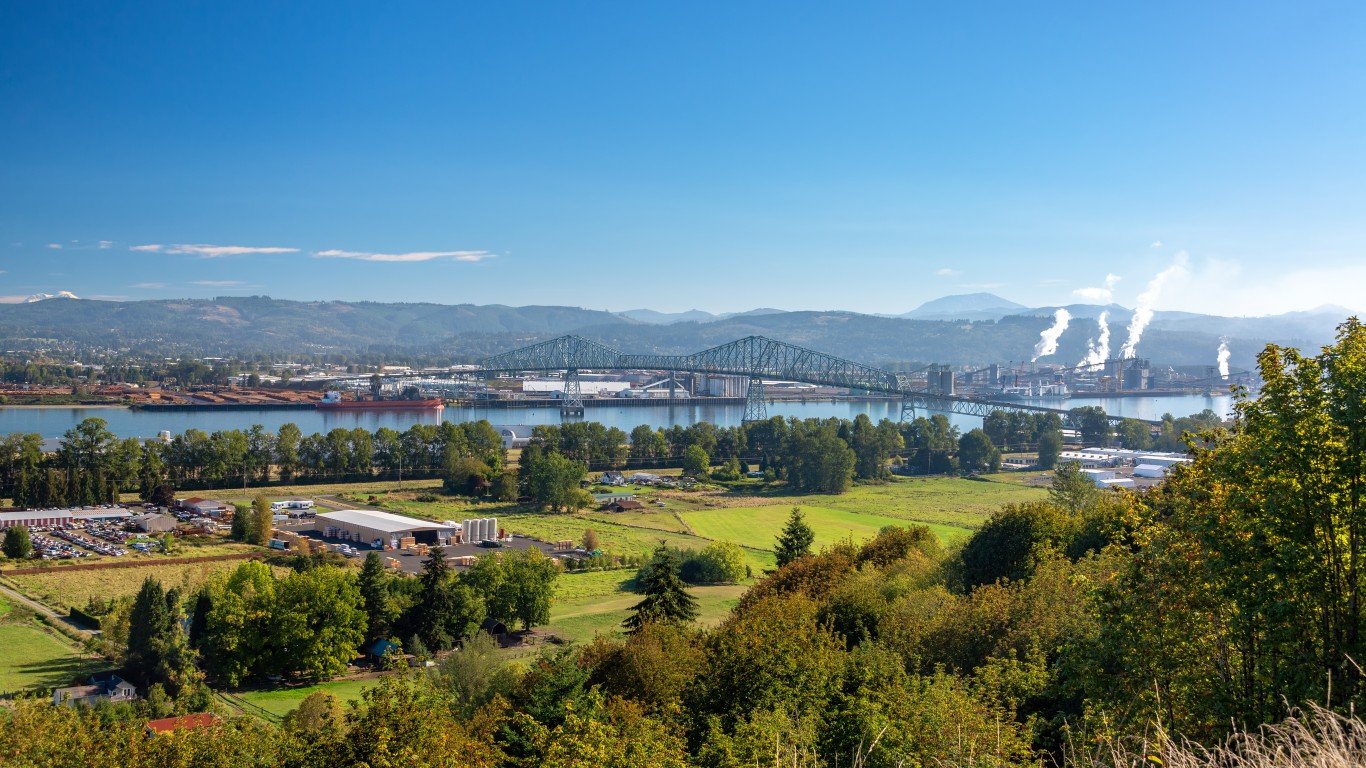
Source: DC_Colombia / iStock via Getty Images
- Population change in downtown tracts, 2012 to 2022: +14.7%
- Population change of non-downtown tracts, 2012 to 2022: -3.4%
- Per capita income change in downtown tracts, 2012 to 2022: +24.6%
- Per capita income change in non-downtown tracts, 2012 to 2022: +30.1%
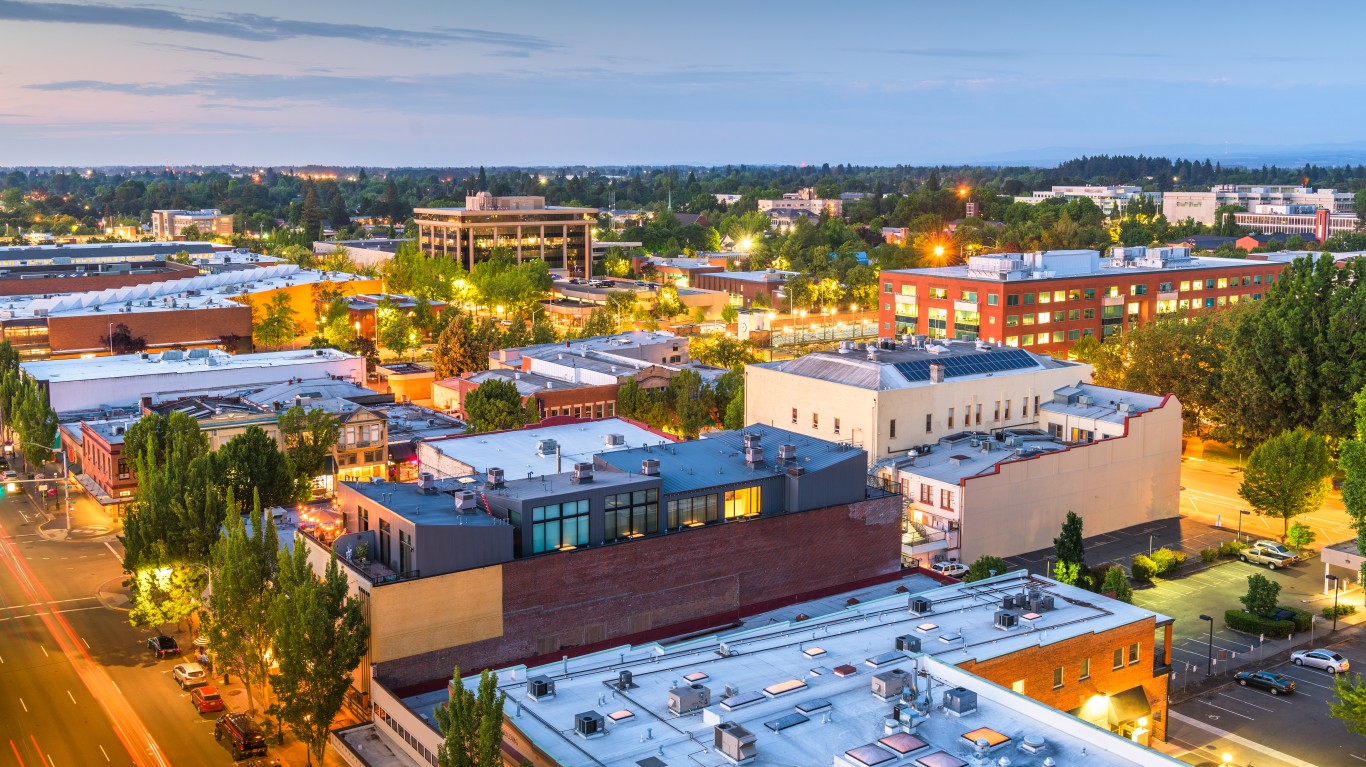
38. Eugene, Oregon
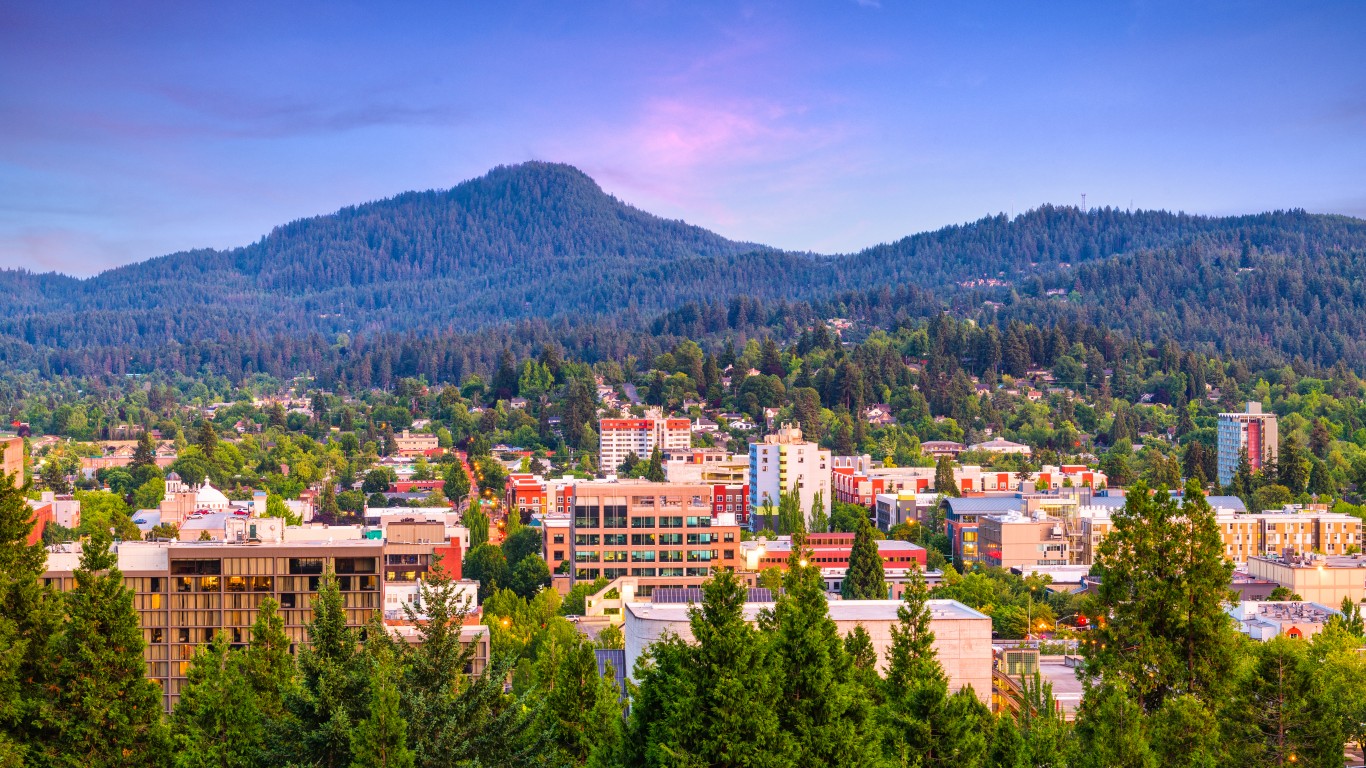
Source: Sean Pavone / iStock via Getty Images
- Population change in downtown tracts, 2012 to 2022: +14.8%
- Population change of non-downtown tracts, 2012 to 2022: +7.9%
- Per capita income change in downtown tracts, 2012 to 2022: +16.8%
- Per capita income change in non-downtown tracts, 2012 to 2022: +18.7%
37. Salem, Oregon
Source: Sean Pavone / iStock via Getty Images
- Population change in downtown tracts, 2012 to 2022: +15.4%
- Population change of non-downtown tracts, 2012 to 2022: +9.7%
- Per capita income change in downtown tracts, 2012 to 2022: +19.5%
- Per capita income change in non-downtown tracts, 2012 to 2022: +17.8%
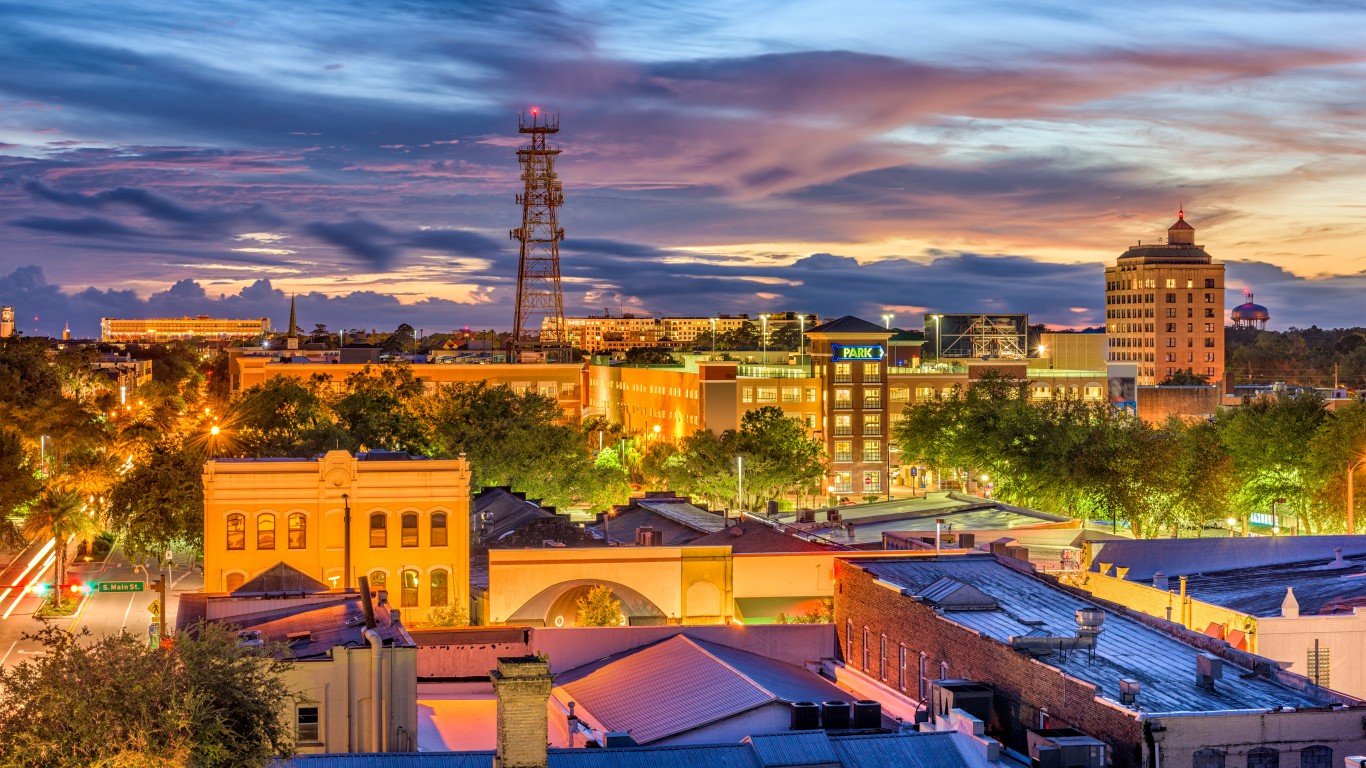
36. Gainesville, Florida
Source: Sean Pavone / iStock via Getty Images
- Population change in downtown tracts, 2012 to 2022: +15.4%
- Population change of non-downtown tracts, 2012 to 2022: +9.6%
- Per capita income change in downtown tracts, 2012 to 2022: +19.4%
- Per capita income change in non-downtown tracts, 2012 to 2022: +0.2%
35. Charlottesville, Virginia

Source: DenisTangneyJr / iStock via Getty Images
- Population change in downtown tracts, 2012 to 2022: +15.9%
- Population change of non-downtown tracts, 2012 to 2022: -5.7%
- Per capita income change in downtown tracts, 2012 to 2022: +31.0%
- Per capita income change in non-downtown tracts, 2012 to 2022: +49.1%
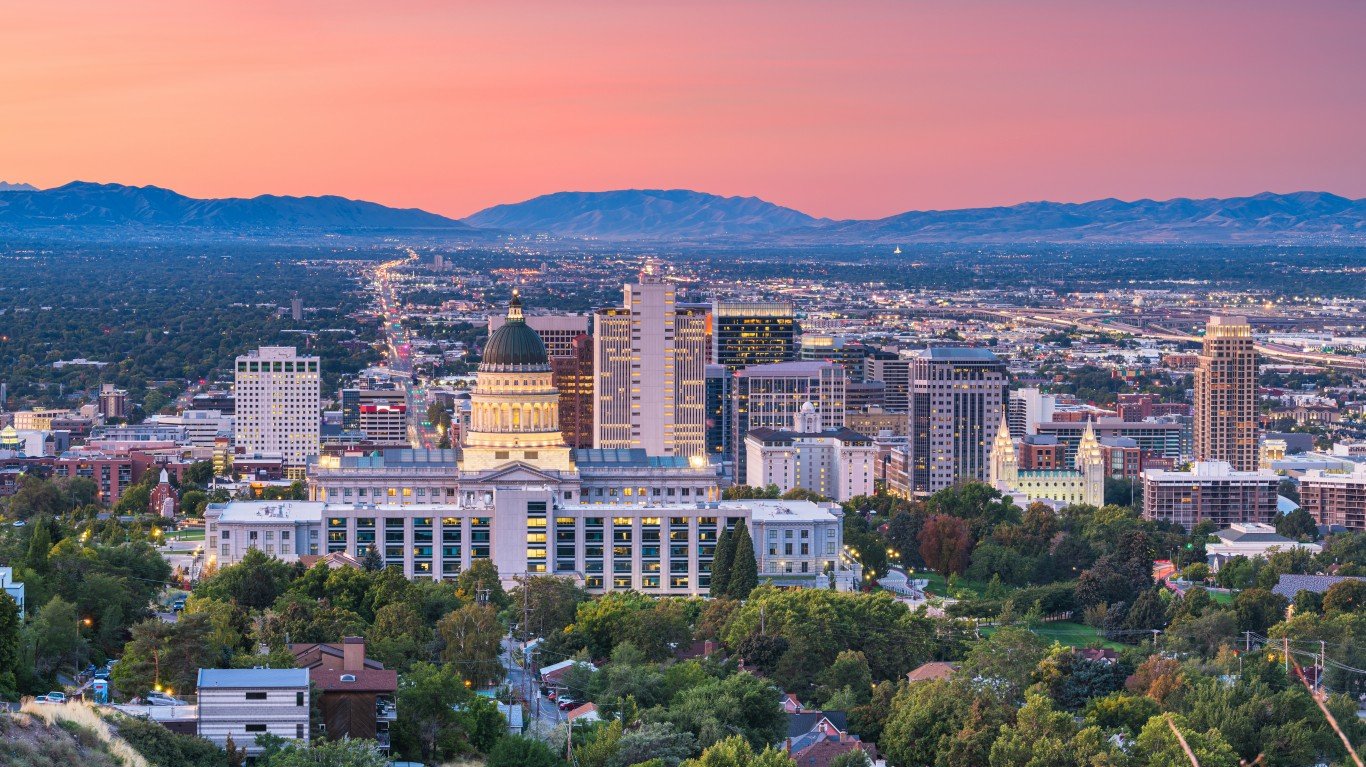
34. Salt Lake City, Utah
Source: Sean Pavone / iStock via Getty Images
- Population change in downtown tracts, 2012 to 2022: +16.0%
- Population change of non-downtown tracts, 2012 to 2022: +5.1%
- Per capita income change in downtown tracts, 2012 to 2022: +43.4%
- Per capita income change in non-downtown tracts, 2012 to 2022: +32.9%
33. Palm Coast, Florida
Source: SevenMaps / Shutterstock.com
- Population change in downtown tracts, 2012 to 2022: +16.4%
- Population change of non-downtown tracts, 2012 to 2022: +26.9%
- Per capita income change in downtown tracts, 2012 to 2022: +77.3%
- Per capita income change in non-downtown tracts, 2012 to 2022: +23.2%
32. Phoenix, Arizona
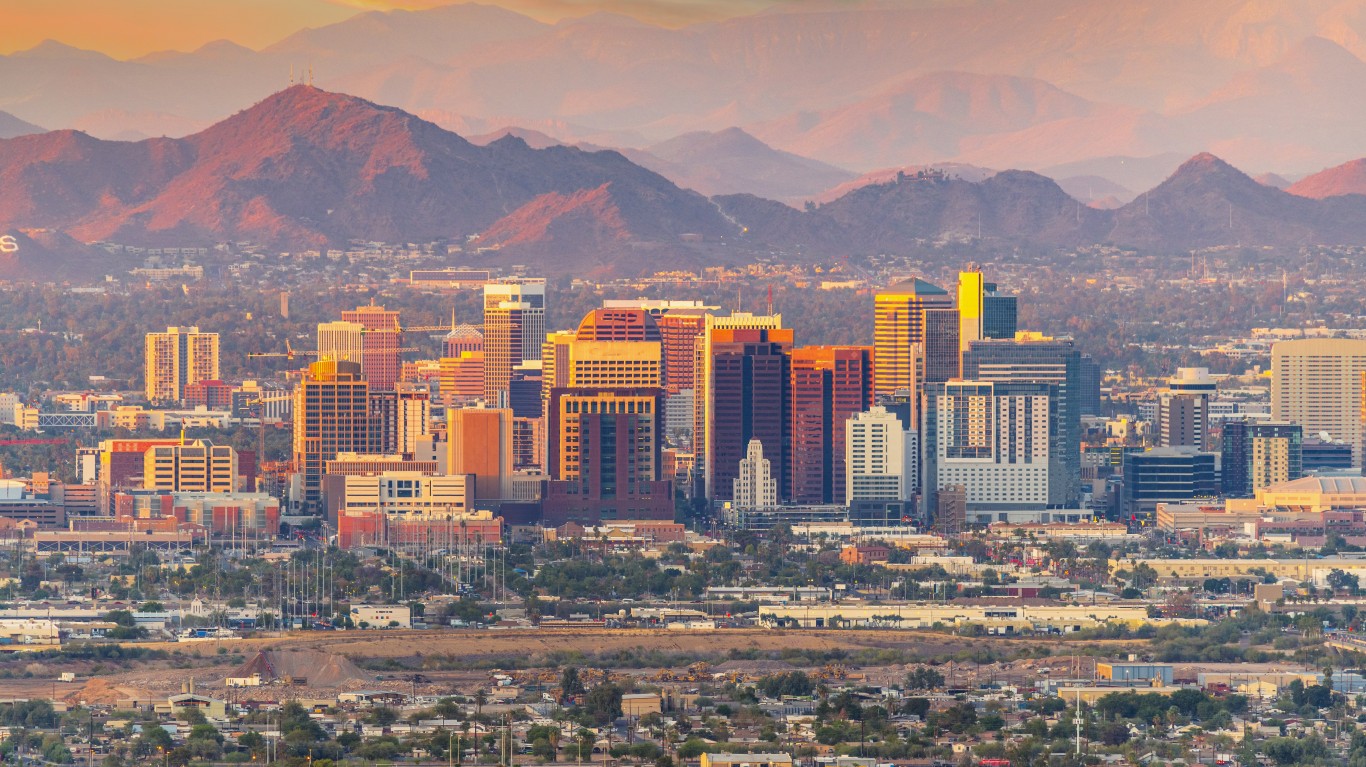
Source: 4kodiak / E+ via Getty Images
- Population change in downtown tracts, 2012 to 2022: +17.6%
- Population change of non-downtown tracts, 2012 to 2022: +7.1%
- Per capita income change in downtown tracts, 2012 to 2022: +74.4%
- Per capita income change in non-downtown tracts, 2012 to 2022: +21.6%
31. Philadelphia, Pennsylvania

Source: f11photo / iStock via Getty Images
- Population change in downtown tracts, 2012 to 2022: +17.8%
- Population change of non-downtown tracts, 2012 to 2022: +2.5%
- Per capita income change in downtown tracts, 2012 to 2022: +32.4%
- Per capita income change in non-downtown tracts, 2012 to 2022: +21.7%
30. Redding, California
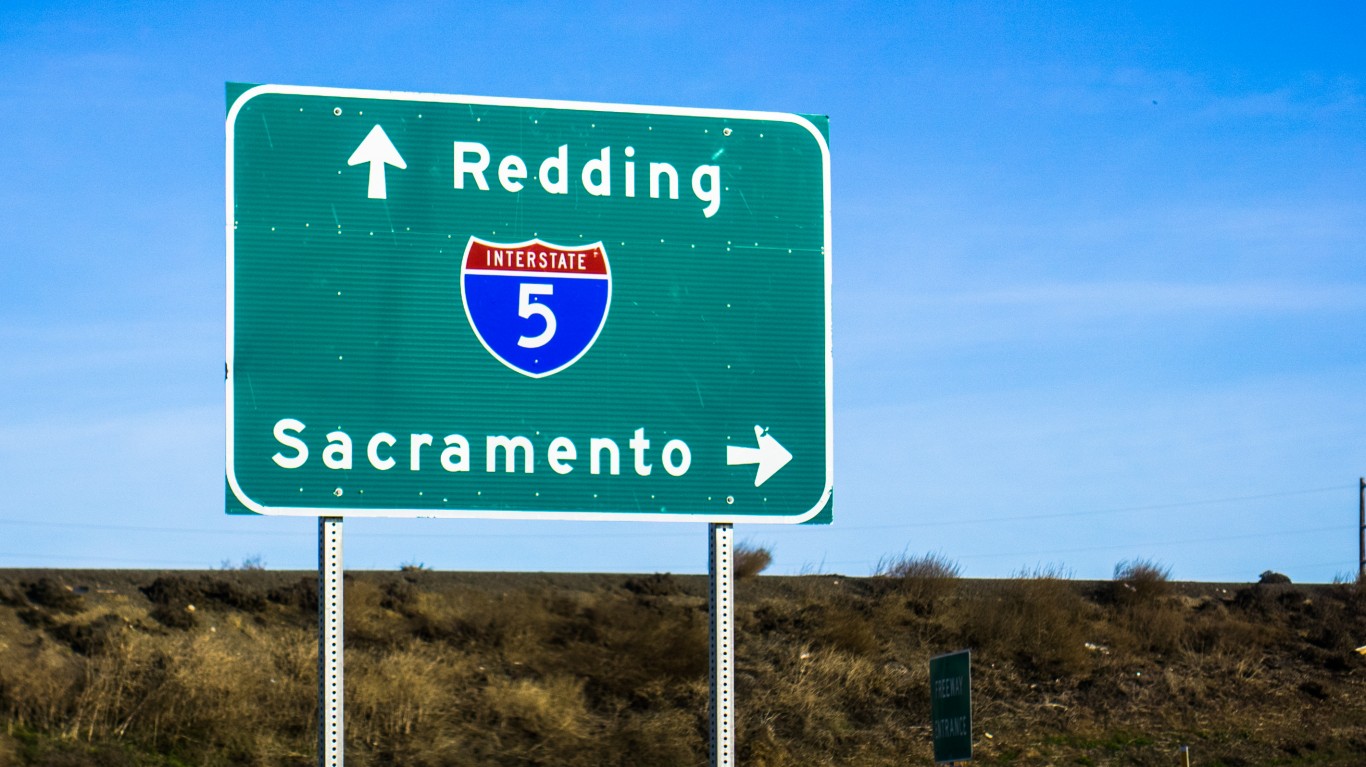
Source: Sundry Photography / iStock via Getty Images
- Population change in downtown tracts, 2012 to 2022: +18.0%
- Population change of non-downtown tracts, 2012 to 2022: +1.3%
- Per capita income change in downtown tracts, 2012 to 2022: +2.0%
- Per capita income change in non-downtown tracts, 2012 to 2022: +21.8%
29. Bremerton, Washington
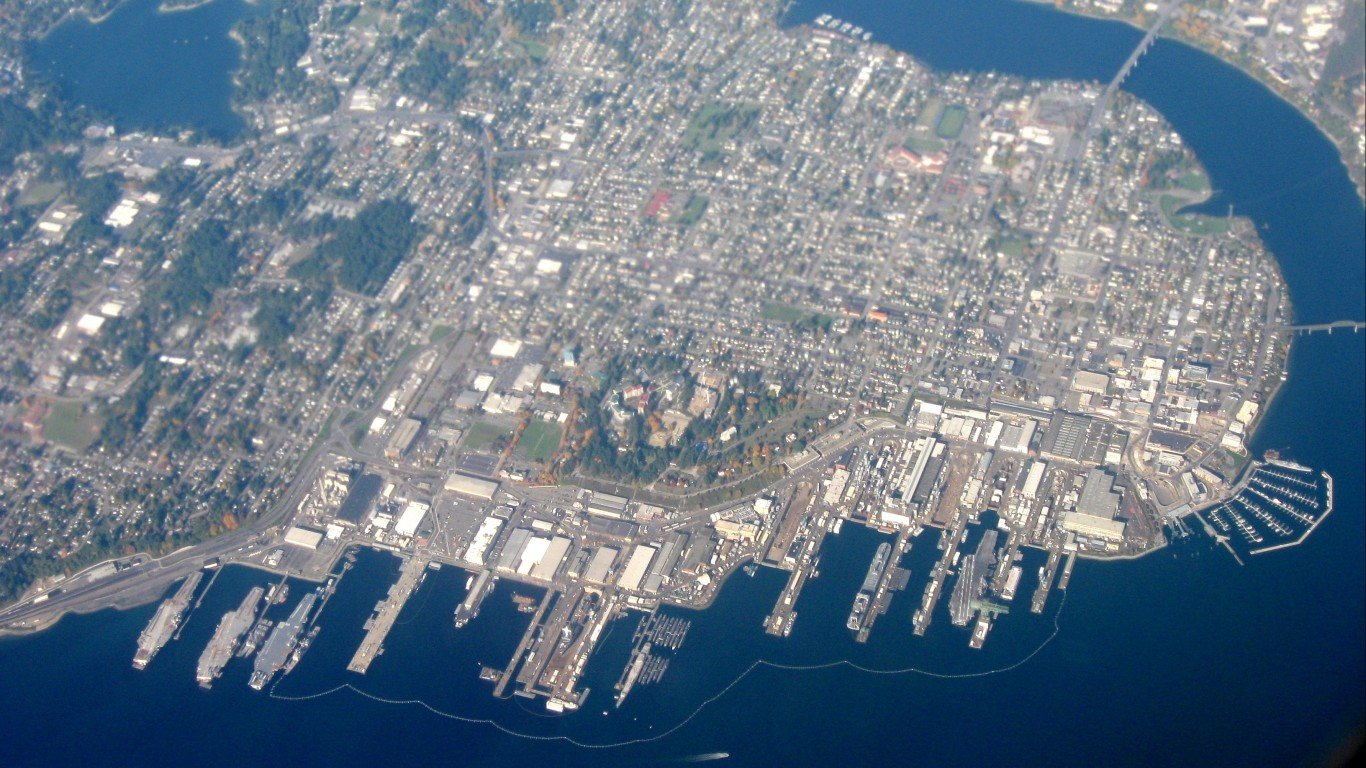
Source: Public Domain / Wikimedia Commons
- Population change in downtown tracts, 2012 to 2022: +18.1%
- Population change of non-downtown tracts, 2012 to 2022: +6.6%
- Per capita income change in downtown tracts, 2012 to 2022: +31.0%
- Per capita income change in non-downtown tracts, 2012 to 2022: +26.5%
28. Punta Gorda, Florida
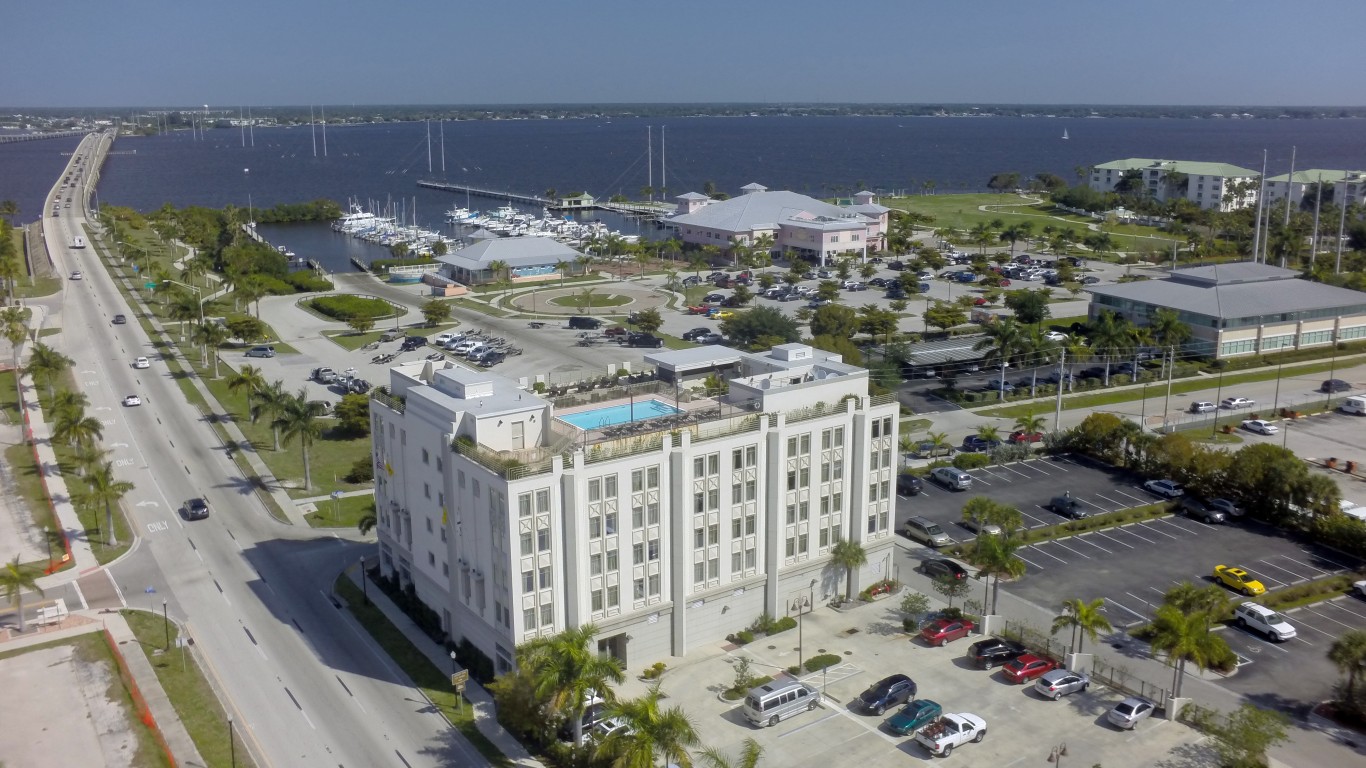
Source: choicegraphx / iStock via Getty Images
- Population change in downtown tracts, 2012 to 2022: +18.4%
- Population change of non-downtown tracts, 2012 to 2022: +5.5%
- Per capita income change in downtown tracts, 2012 to 2022: -8.4%
- Per capita income change in non-downtown tracts, 2012 to 2022: +36.2%
27. Sacramento, California
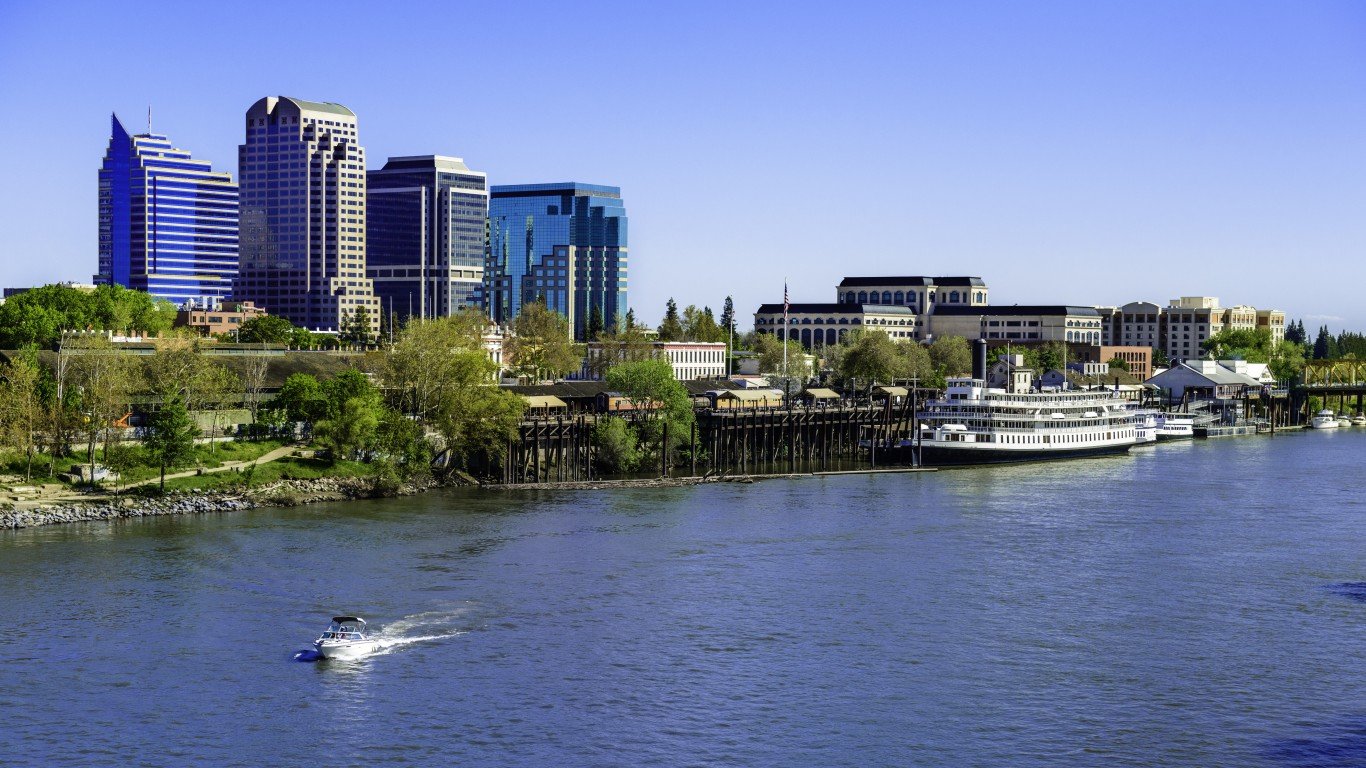
Source: dszc / E+ via Getty Images
- Population change in downtown tracts, 2012 to 2022: +19.2%
- Population change of non-downtown tracts, 2012 to 2022: +9.0%
- Per capita income change in downtown tracts, 2012 to 2022: +37.7%
- Per capita income change in non-downtown tracts, 2012 to 2022: +21.5%
26. Cincinnati, Ohio
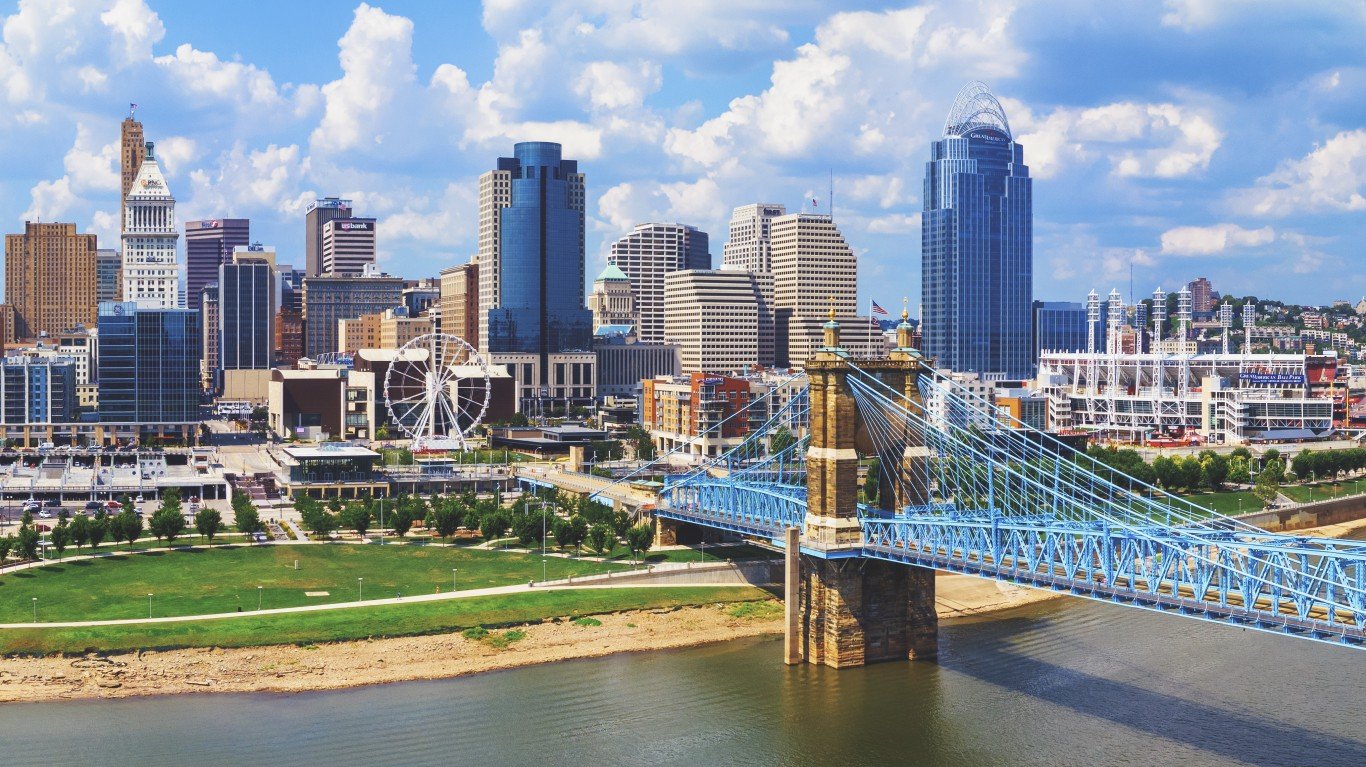
Source: pawel.gaul / E+ via Getty Images
- Population change in downtown tracts, 2012 to 2022: +19.9%
- Population change of non-downtown tracts, 2012 to 2022: +3.0%
- Per capita income change in downtown tracts, 2012 to 2022: +55.2%
- Per capita income change in non-downtown tracts, 2012 to 2022: +13.9%
25. Winston-Salem, North Carolina
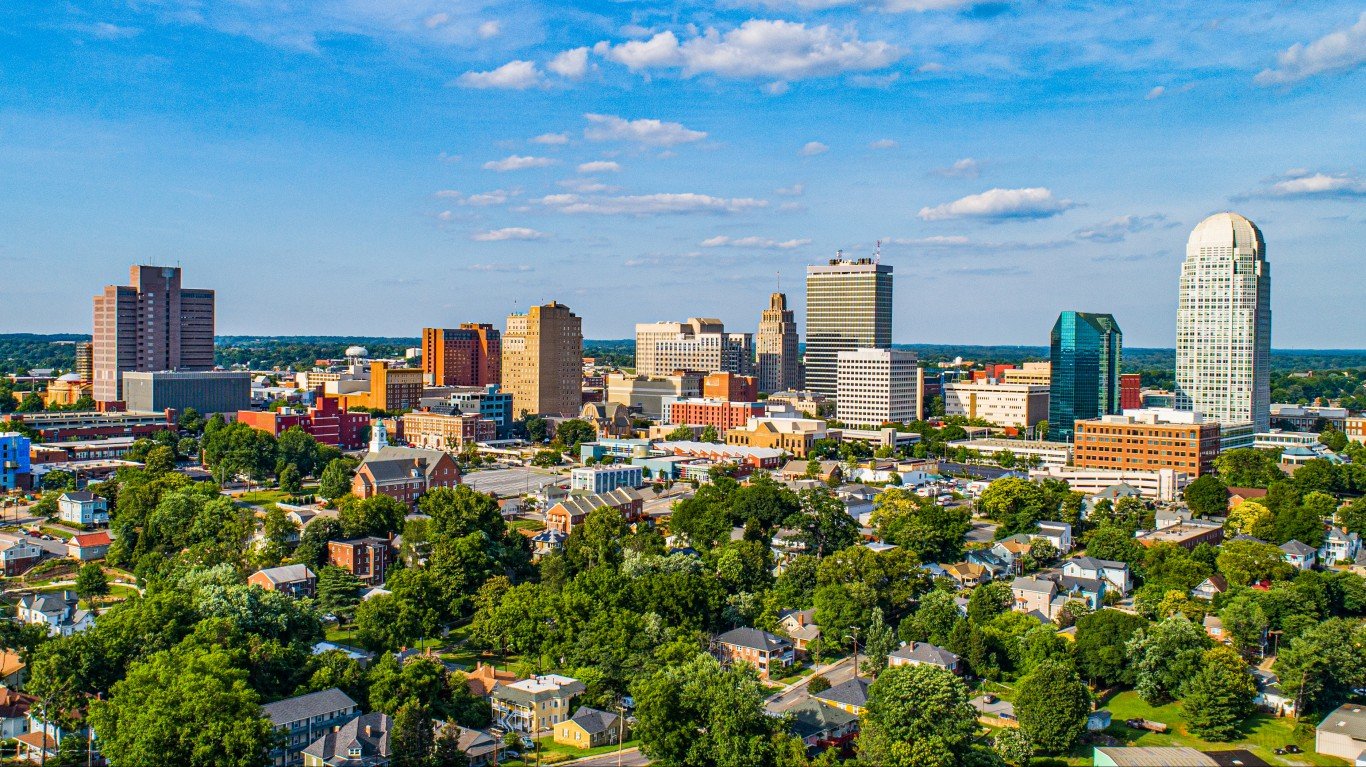
Source: Kruck20 / iStock via Getty Images
- Population change in downtown tracts, 2012 to 2022: +20.5%
- Population change of non-downtown tracts, 2012 to 2022: +7.1%
- Per capita income change in downtown tracts, 2012 to 2022: +35.8%
- Per capita income change in non-downtown tracts, 2012 to 2022: +5.2%
24. Detroit, Michigan
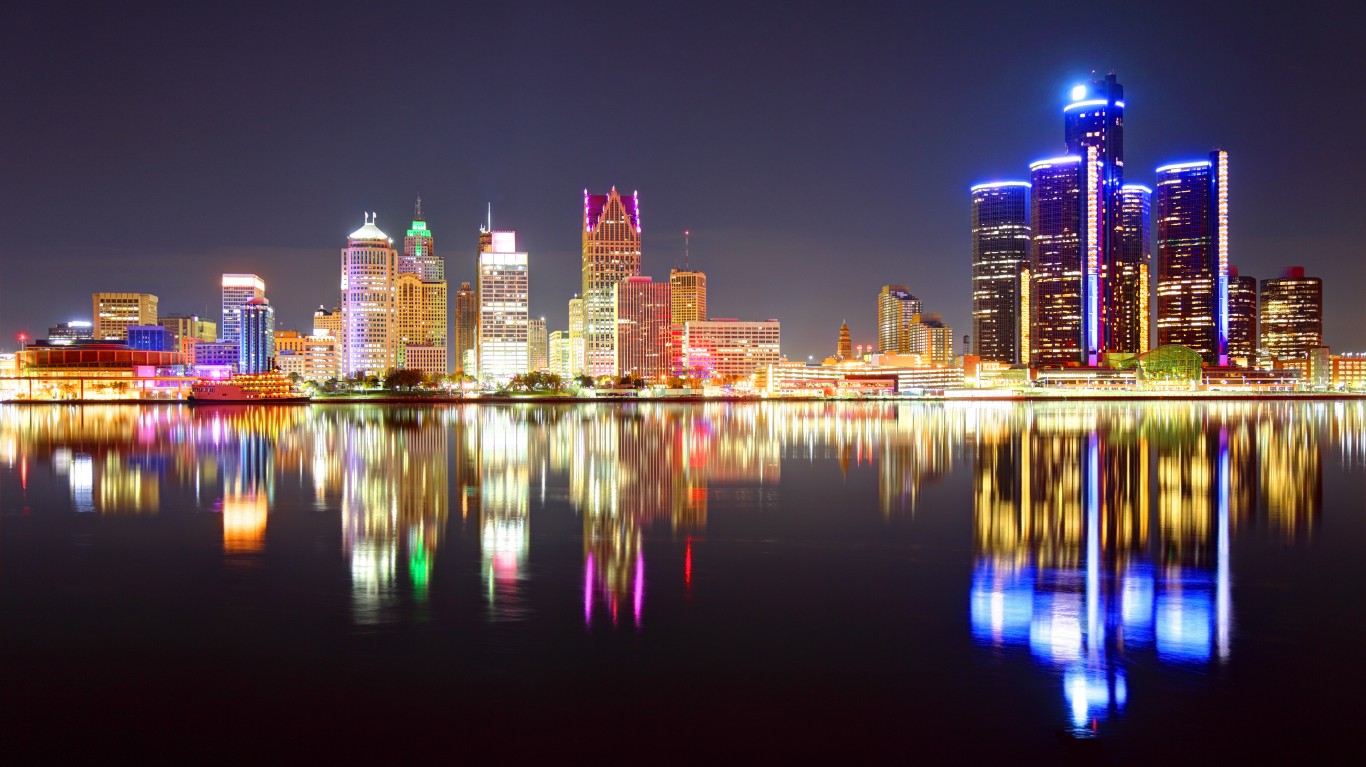
Source: DenisTangneyJr / iStock via Getty Images
- Population change in downtown tracts, 2012 to 2022: +20.8%
- Population change of non-downtown tracts, 2012 to 2022: -11.3%
- Per capita income change in downtown tracts, 2012 to 2022: +67.8%
- Per capita income change in non-downtown tracts, 2012 to 2022: +17.1%
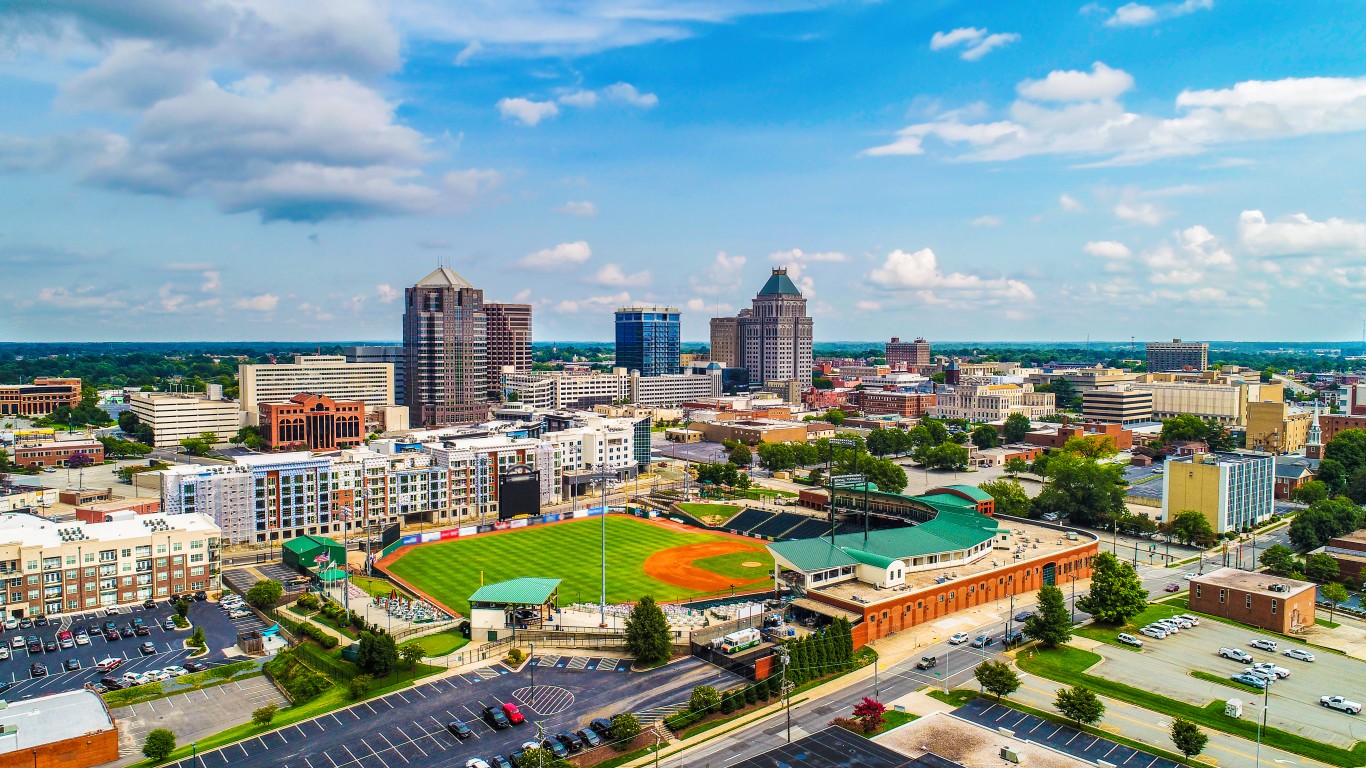
23. Greensboro, North Carolina
Source: Kruck20 / iStock via Getty Images
- Population change in downtown tracts, 2012 to 2022: +21.6%
- Population change of non-downtown tracts, 2012 to 2022: +4.0%
- Per capita income change in downtown tracts, 2012 to 2022: +17.4%
- Per capita income change in non-downtown tracts, 2012 to 2022: +6.2%
22. Columbus, Ohio

Source: Sean Pavone / iStock via Getty Images
- Population change in downtown tracts, 2012 to 2022: +23.0%
- Population change of non-downtown tracts, 2012 to 2022: +11.6%
- Per capita income change in downtown tracts, 2012 to 2022: +34.3%
- Per capita income change in non-downtown tracts, 2012 to 2022: +17.8%
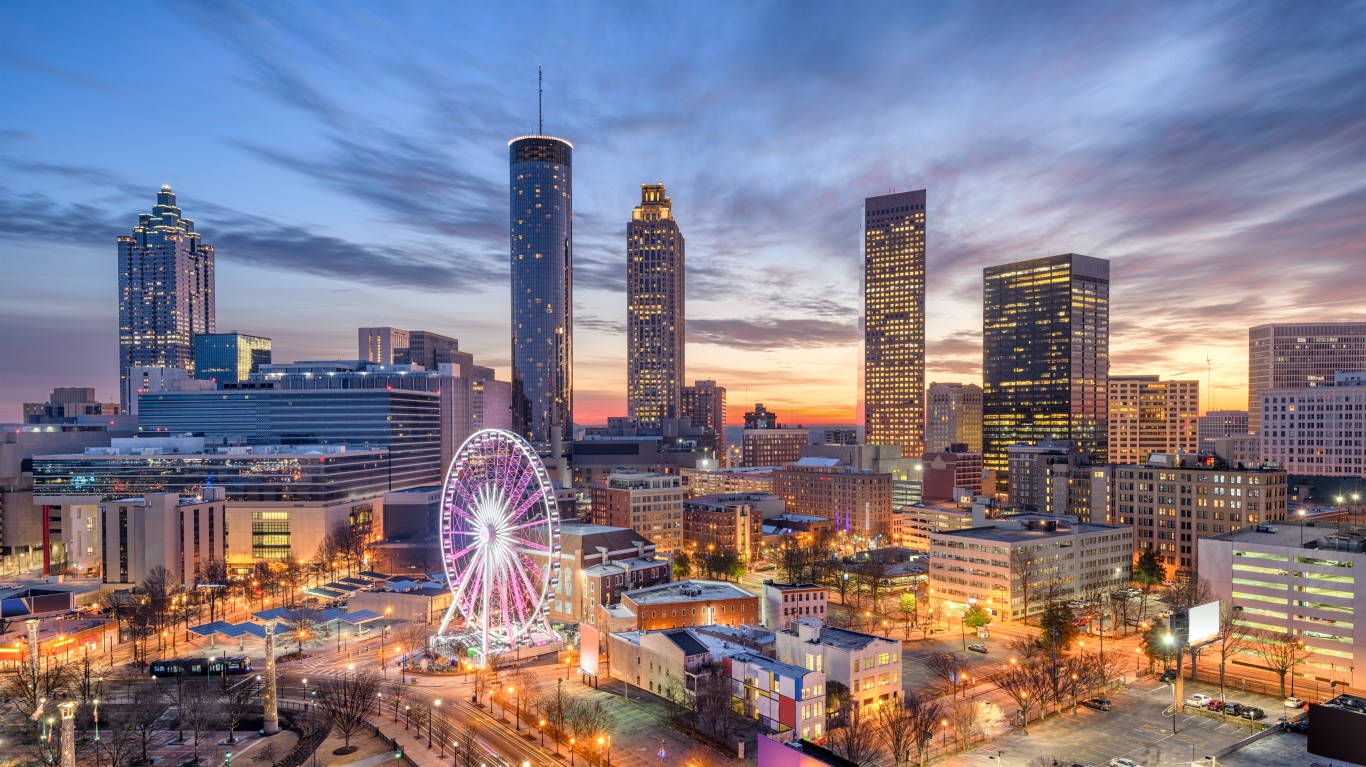
21. Atlanta, Georgia
Source: Sean Pavone / iStock via Getty Images
- Population change in downtown tracts, 2012 to 2022: +23.4%
- Population change of non-downtown tracts, 2012 to 2022: +5.3%
- Per capita income change in downtown tracts, 2012 to 2022: +31.3%
- Per capita income change in non-downtown tracts, 2012 to 2022: +38.6%
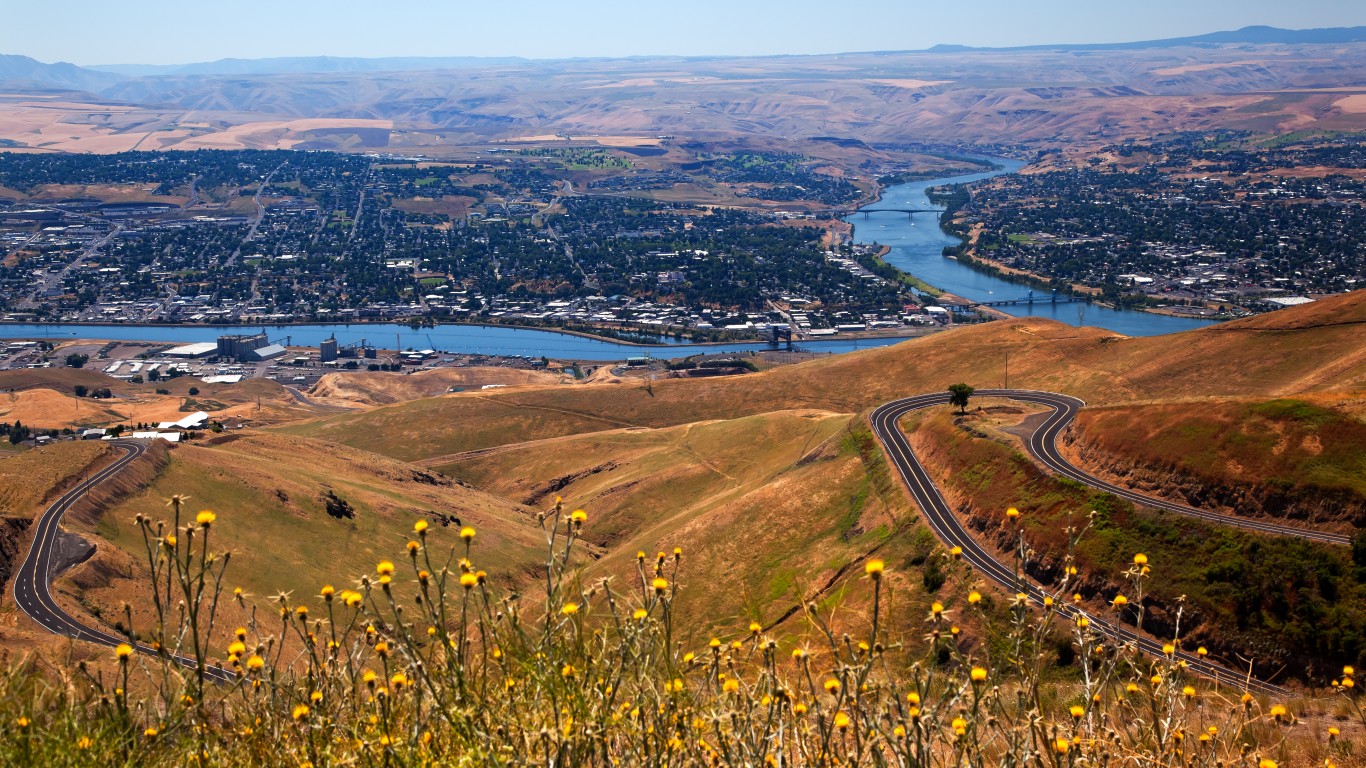
20. Lewiston, Idaho
Source: bpperry / iStock via Getty Images
- Population change in downtown tracts, 2012 to 2022: +23.8%
- Population change of non-downtown tracts, 2012 to 2022: +2.7%
- Per capita income change in downtown tracts, 2012 to 2022: -9.4%
- Per capita income change in non-downtown tracts, 2012 to 2022: +23.5%
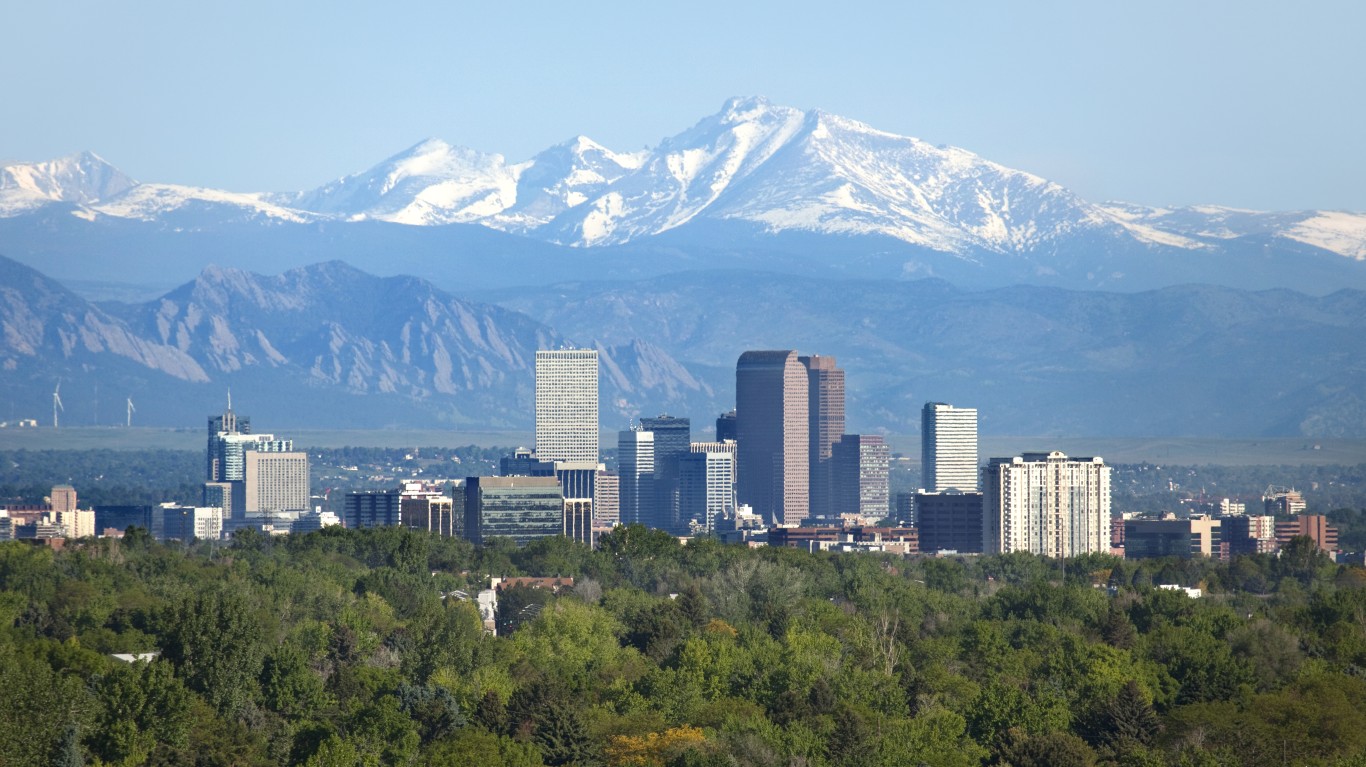
19. Denver, Colorado
Source: milehightraveler / iStock via Getty Images
- Population change in downtown tracts, 2012 to 2022: +23.8%
- Population change of non-downtown tracts, 2012 to 2022: +11.0%
- Per capita income change in downtown tracts, 2012 to 2022: +26.2%
- Per capita income change in non-downtown tracts, 2012 to 2022: +35.8%
18. Columbus, Indiana
Source: Rodrigo A. Rodriguez Fuentes / Getty Images
- Population change in downtown tracts, 2012 to 2022: +24.1%
- Population change of non-downtown tracts, 2012 to 2022: -0.2%
- Per capita income change in downtown tracts, 2012 to 2022: +26.7%
- Per capita income change in non-downtown tracts, 2012 to 2022: +9.0%
17. Ocala, Florida

Source: MichaelWarrenPix / Getty Images
- Population change in downtown tracts, 2012 to 2022: +24.2%
- Population change of non-downtown tracts, 2012 to 2022: +5.2%
- Per capita income change in downtown tracts, 2012 to 2022: -2.6%
- Per capita income change in non-downtown tracts, 2012 to 2022: +14.4%
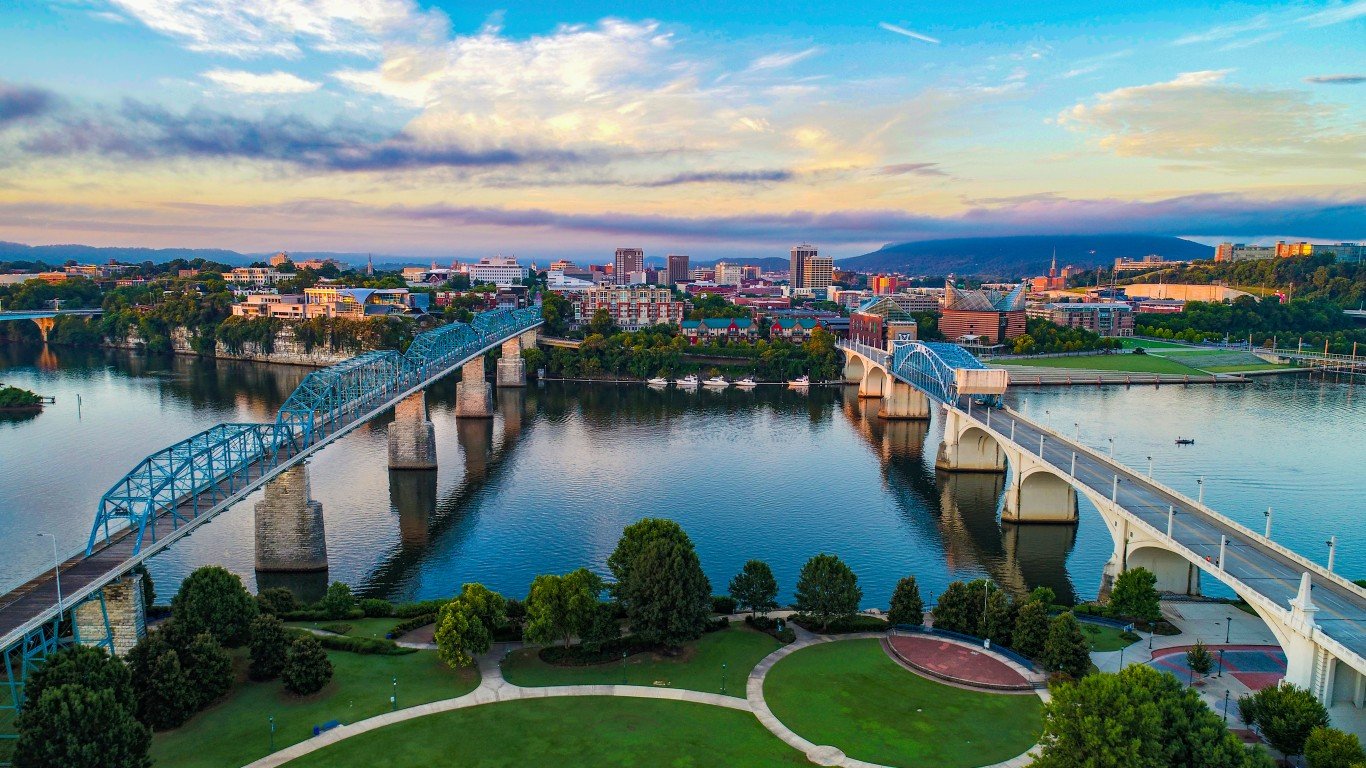
16. Chattanooga, Tennessee
Source: Kruck20 / iStock via Getty Images
- Population change in downtown tracts, 2012 to 2022: +25.3%
- Population change of non-downtown tracts, 2012 to 2022: +3.6%
- Per capita income change in downtown tracts, 2012 to 2022: +89.9%
- Per capita income change in non-downtown tracts, 2012 to 2022: +19.1%
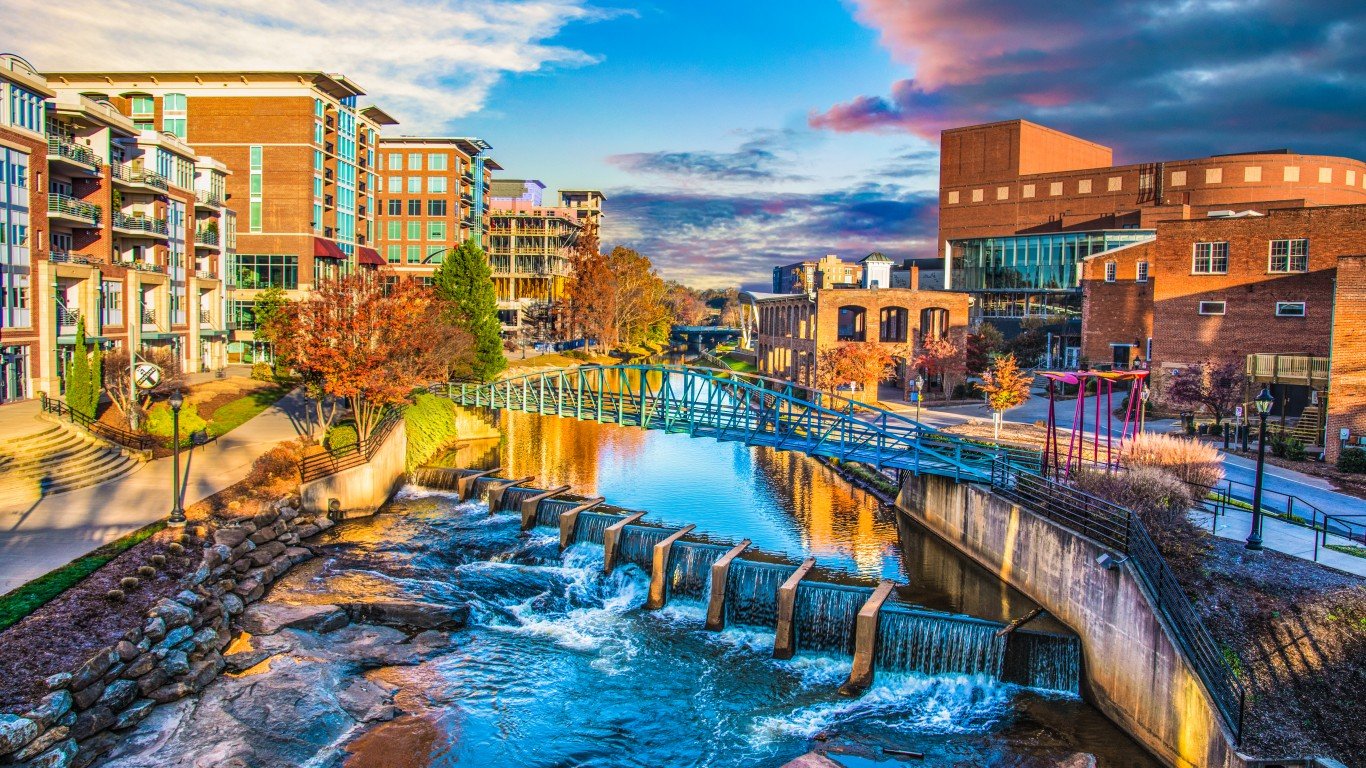
15. Greenville, South Carolina
Source: Kruck20 / iStock via Getty Images
- Population change in downtown tracts, 2012 to 2022: +26.1%
- Population change of non-downtown tracts, 2012 to 2022: +10.3%
- Per capita income change in downtown tracts, 2012 to 2022: +49.1%
- Per capita income change in non-downtown tracts, 2012 to 2022: +37.4%
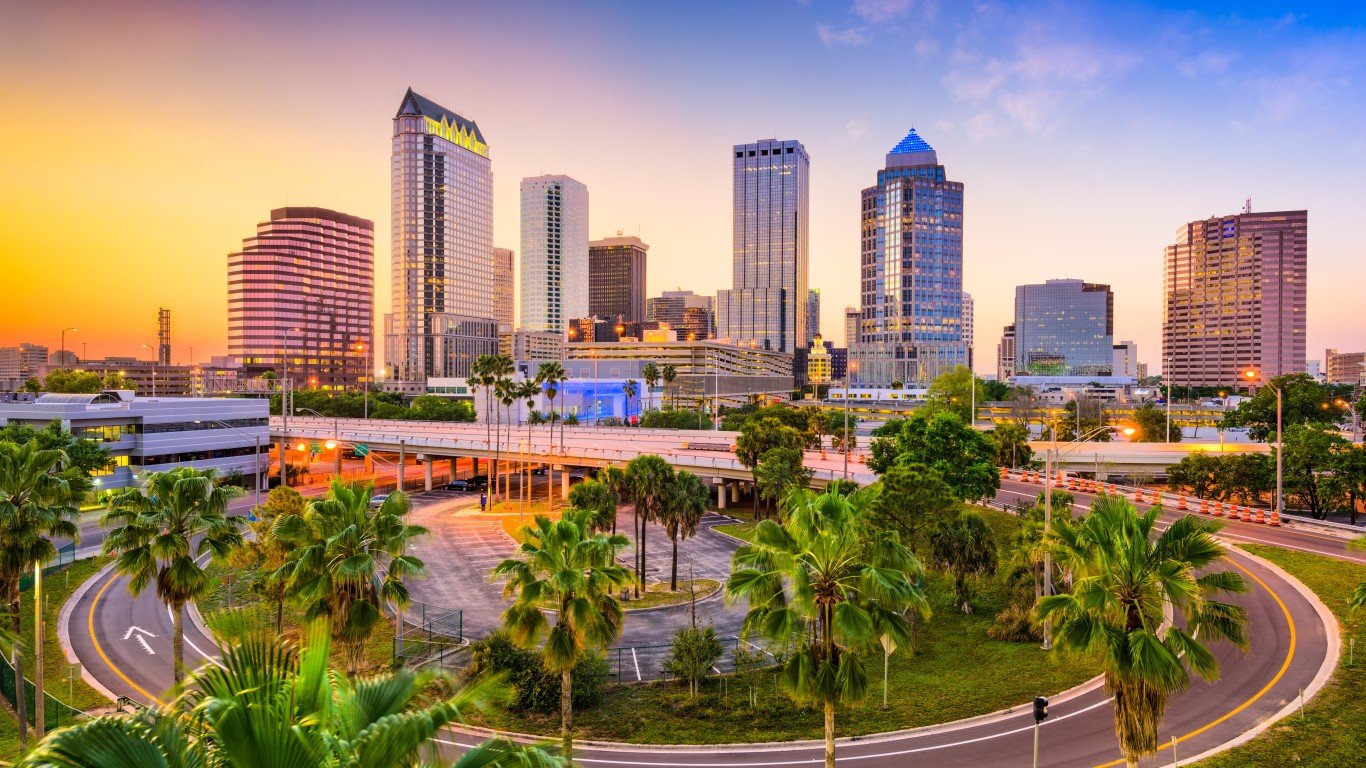
14. Tampa, Florida
Source: SeanPavonePhoto / iStock via Getty Images
- Population change in downtown tracts, 2012 to 2022: +27.1%
- Population change of non-downtown tracts, 2012 to 2022: +10.5%
- Per capita income change in downtown tracts, 2012 to 2022: +39.8%
- Per capita income change in non-downtown tracts, 2012 to 2022: +21.2%
13. Kansas City, Missouri
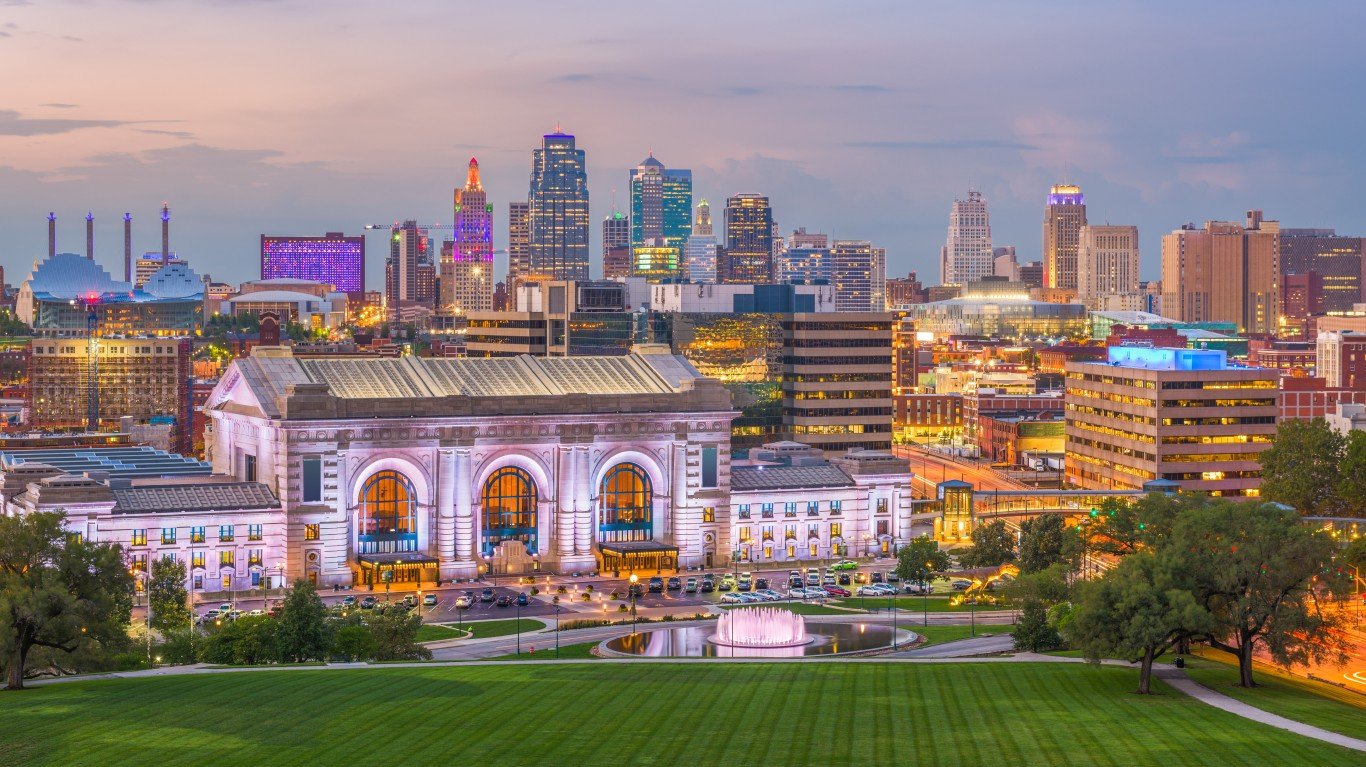
Source: Sean Pavone / iStock via Getty Images
- Population change in downtown tracts, 2012 to 2022: +27.3%
- Population change of non-downtown tracts, 2012 to 2022: +6.3%
- Per capita income change in downtown tracts, 2012 to 2022: +37.7%
- Per capita income change in non-downtown tracts, 2012 to 2022: +12.8%
12. Tuscaloosa, Alabama
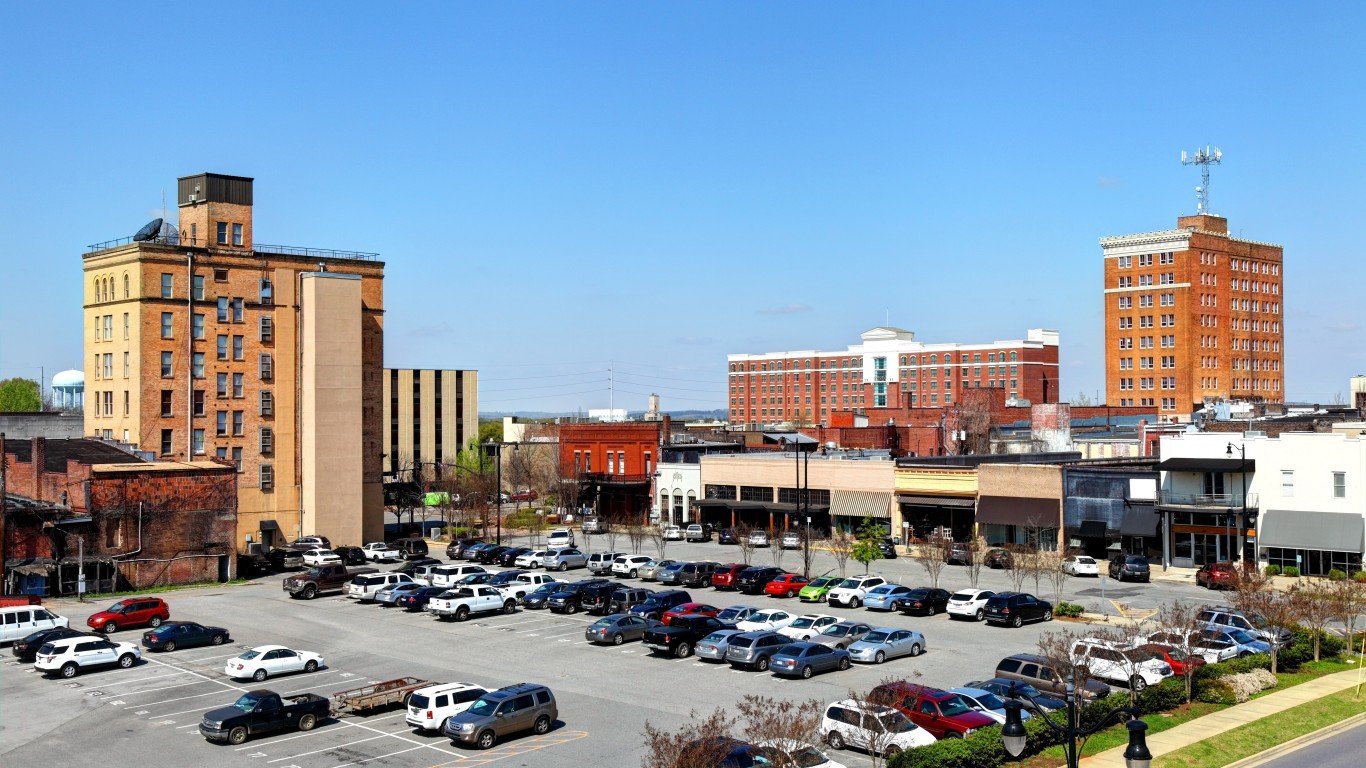
Source: DenisTangneyJr / iStock via Getty Images
- Population change in downtown tracts, 2012 to 2022: +27.7%
- Population change of non-downtown tracts, 2012 to 2022: +27.9%
- Per capita income change in downtown tracts, 2012 to 2022: +27.1%
- Per capita income change in non-downtown tracts, 2012 to 2022: +9.0%
11. Durham, North Carolina
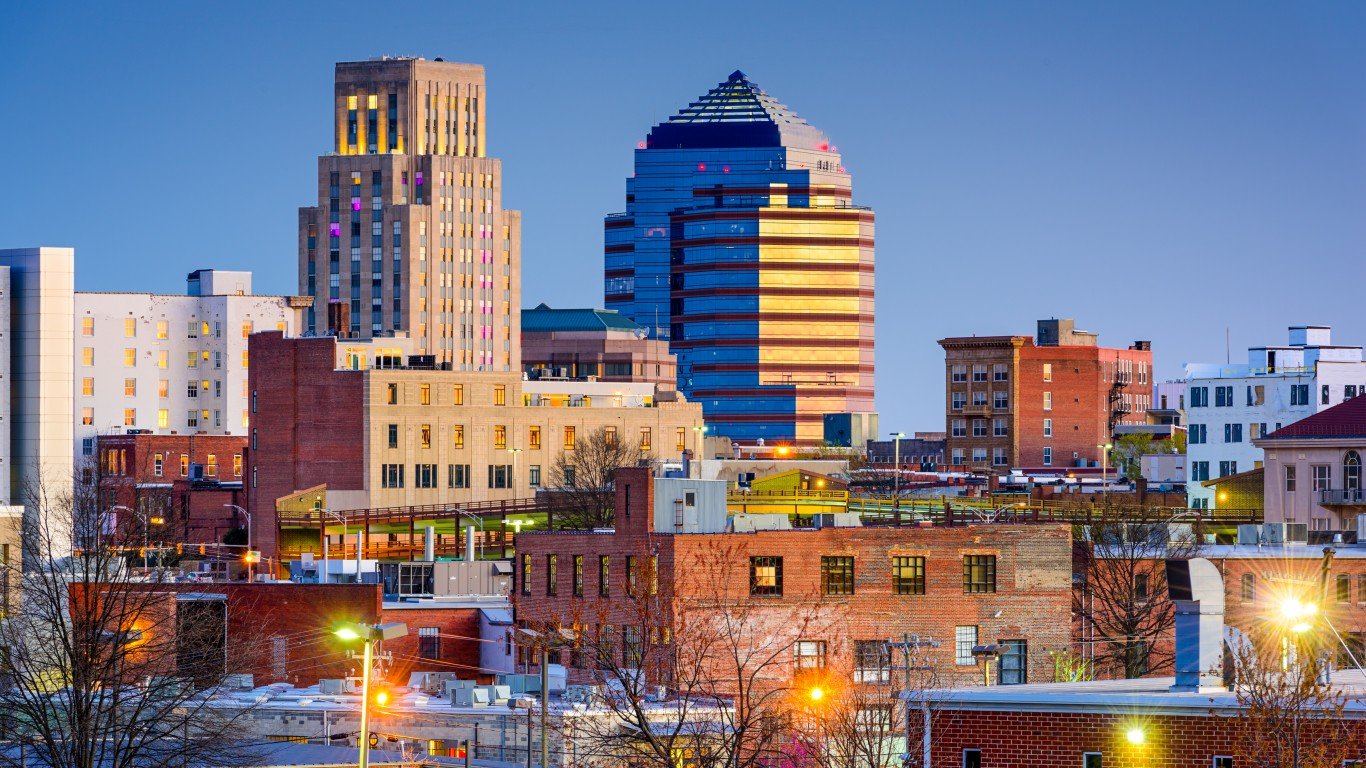
Source: SeanPavonePhoto / iStock via Getty Images
- Population change in downtown tracts, 2012 to 2022: +27.9%
- Population change of non-downtown tracts, 2012 to 2022: +14.4%
- Per capita income change in downtown tracts, 2012 to 2022: +52.9%
- Per capita income change in non-downtown tracts, 2012 to 2022: +18.9%
10. Seattle, Washington
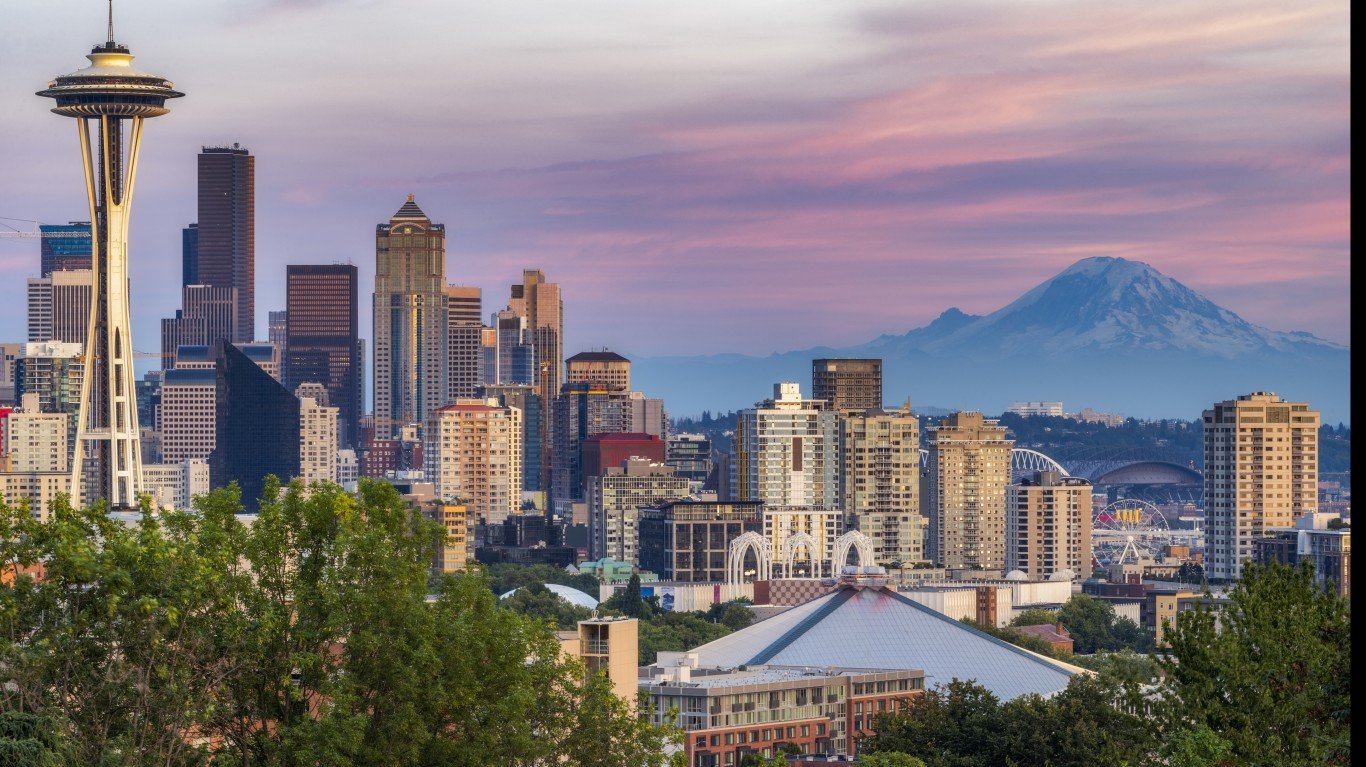
Source: chinaface / E+ via Getty Images
- Population change in downtown tracts, 2012 to 2022: +28.3%
- Population change of non-downtown tracts, 2012 to 2022: +12.9%
- Per capita income change in downtown tracts, 2012 to 2022: +64.5%
- Per capita income change in non-downtown tracts, 2012 to 2022: +39.7%
9. Madison, Wisconsin
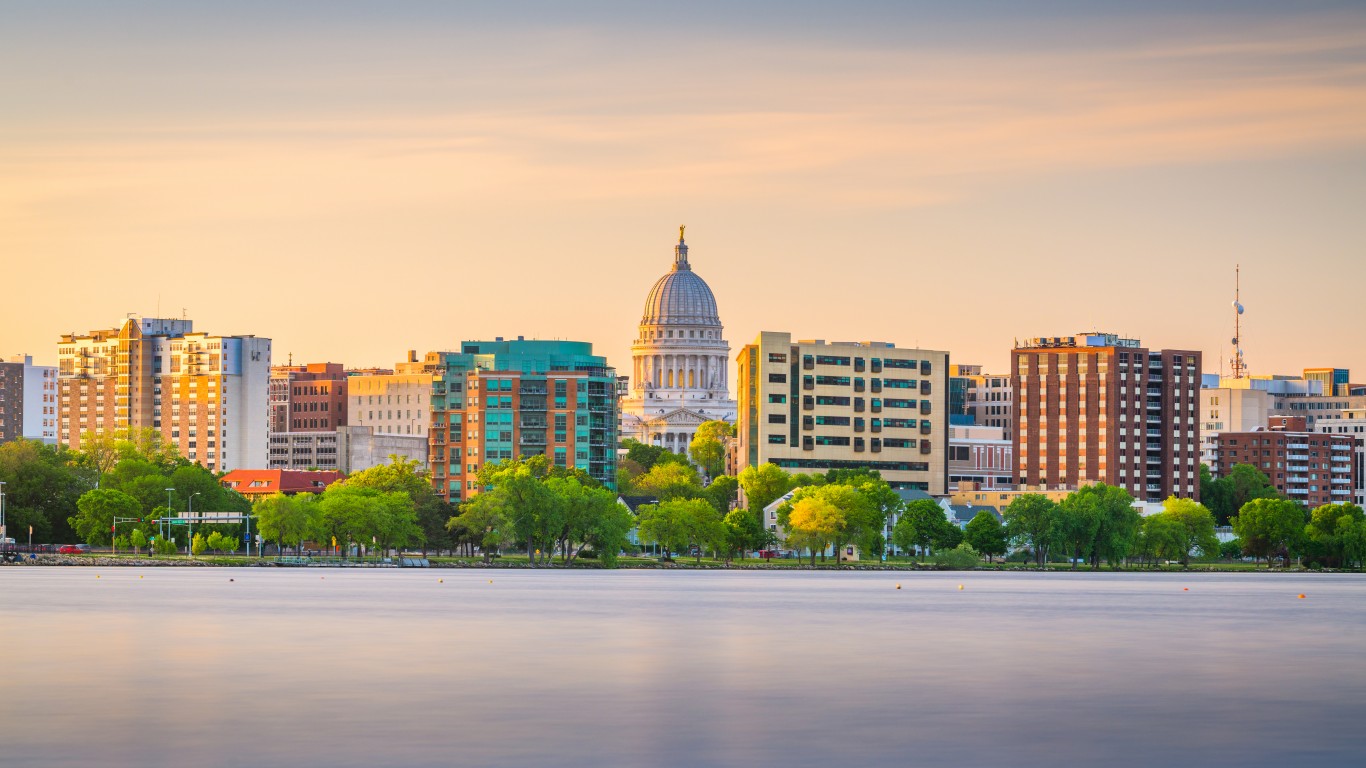
Source: Sean Pavone / iStock via Getty Images
- Population change in downtown tracts, 2012 to 2022: +31.8%
- Population change of non-downtown tracts, 2012 to 2022: +5.6%
- Per capita income change in downtown tracts, 2012 to 2022: +28.4%
- Per capita income change in non-downtown tracts, 2012 to 2022: +12.4%
8. Little Rock, Arkansas
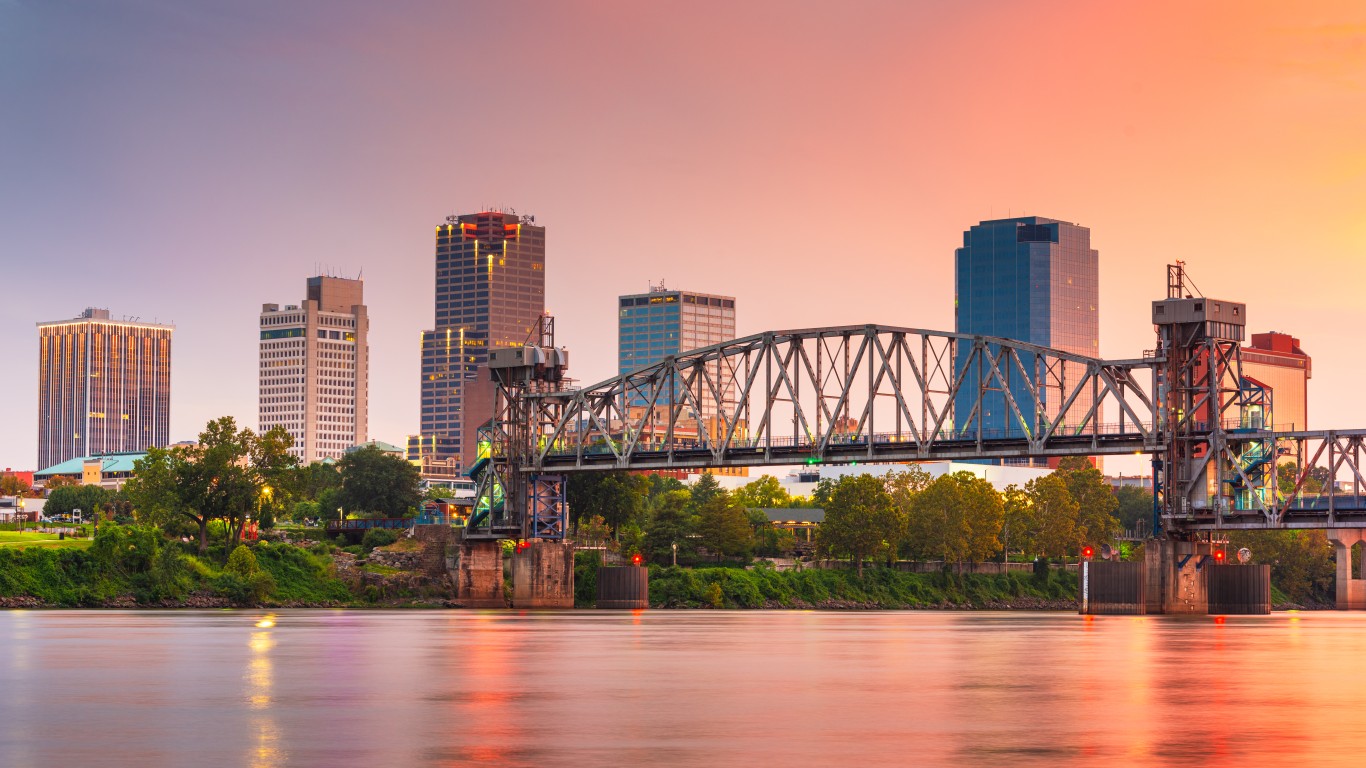
Source: Sean Pavone / iStock via Getty Images
- Population change in downtown tracts, 2012 to 2022: +31.9%
- Population change of non-downtown tracts, 2012 to 2022: +2.3%
- Per capita income change in downtown tracts, 2012 to 2022: +69.6%
- Per capita income change in non-downtown tracts, 2012 to 2022: +10.8%
7. Dallas, Texas

Source: Ron and Patty Thomas / iStock via Getty Images
- Population change in downtown tracts, 2012 to 2022: +33.3%
- Population change of non-downtown tracts, 2012 to 2022: +5.7%
- Per capita income change in downtown tracts, 2012 to 2022: +12.6%
- Per capita income change in non-downtown tracts, 2012 to 2022: +18.3%
6. Nashville, Tennessee

Source: f11photo / iStock via Getty Images
- Population change in downtown tracts, 2012 to 2022: +34.0%
- Population change of non-downtown tracts, 2012 to 2022: +10.5%
- Per capita income change in downtown tracts, 2012 to 2022: +87.2%
- Per capita income change in non-downtown tracts, 2012 to 2022: +24.9%
5. Chicago, Illinois
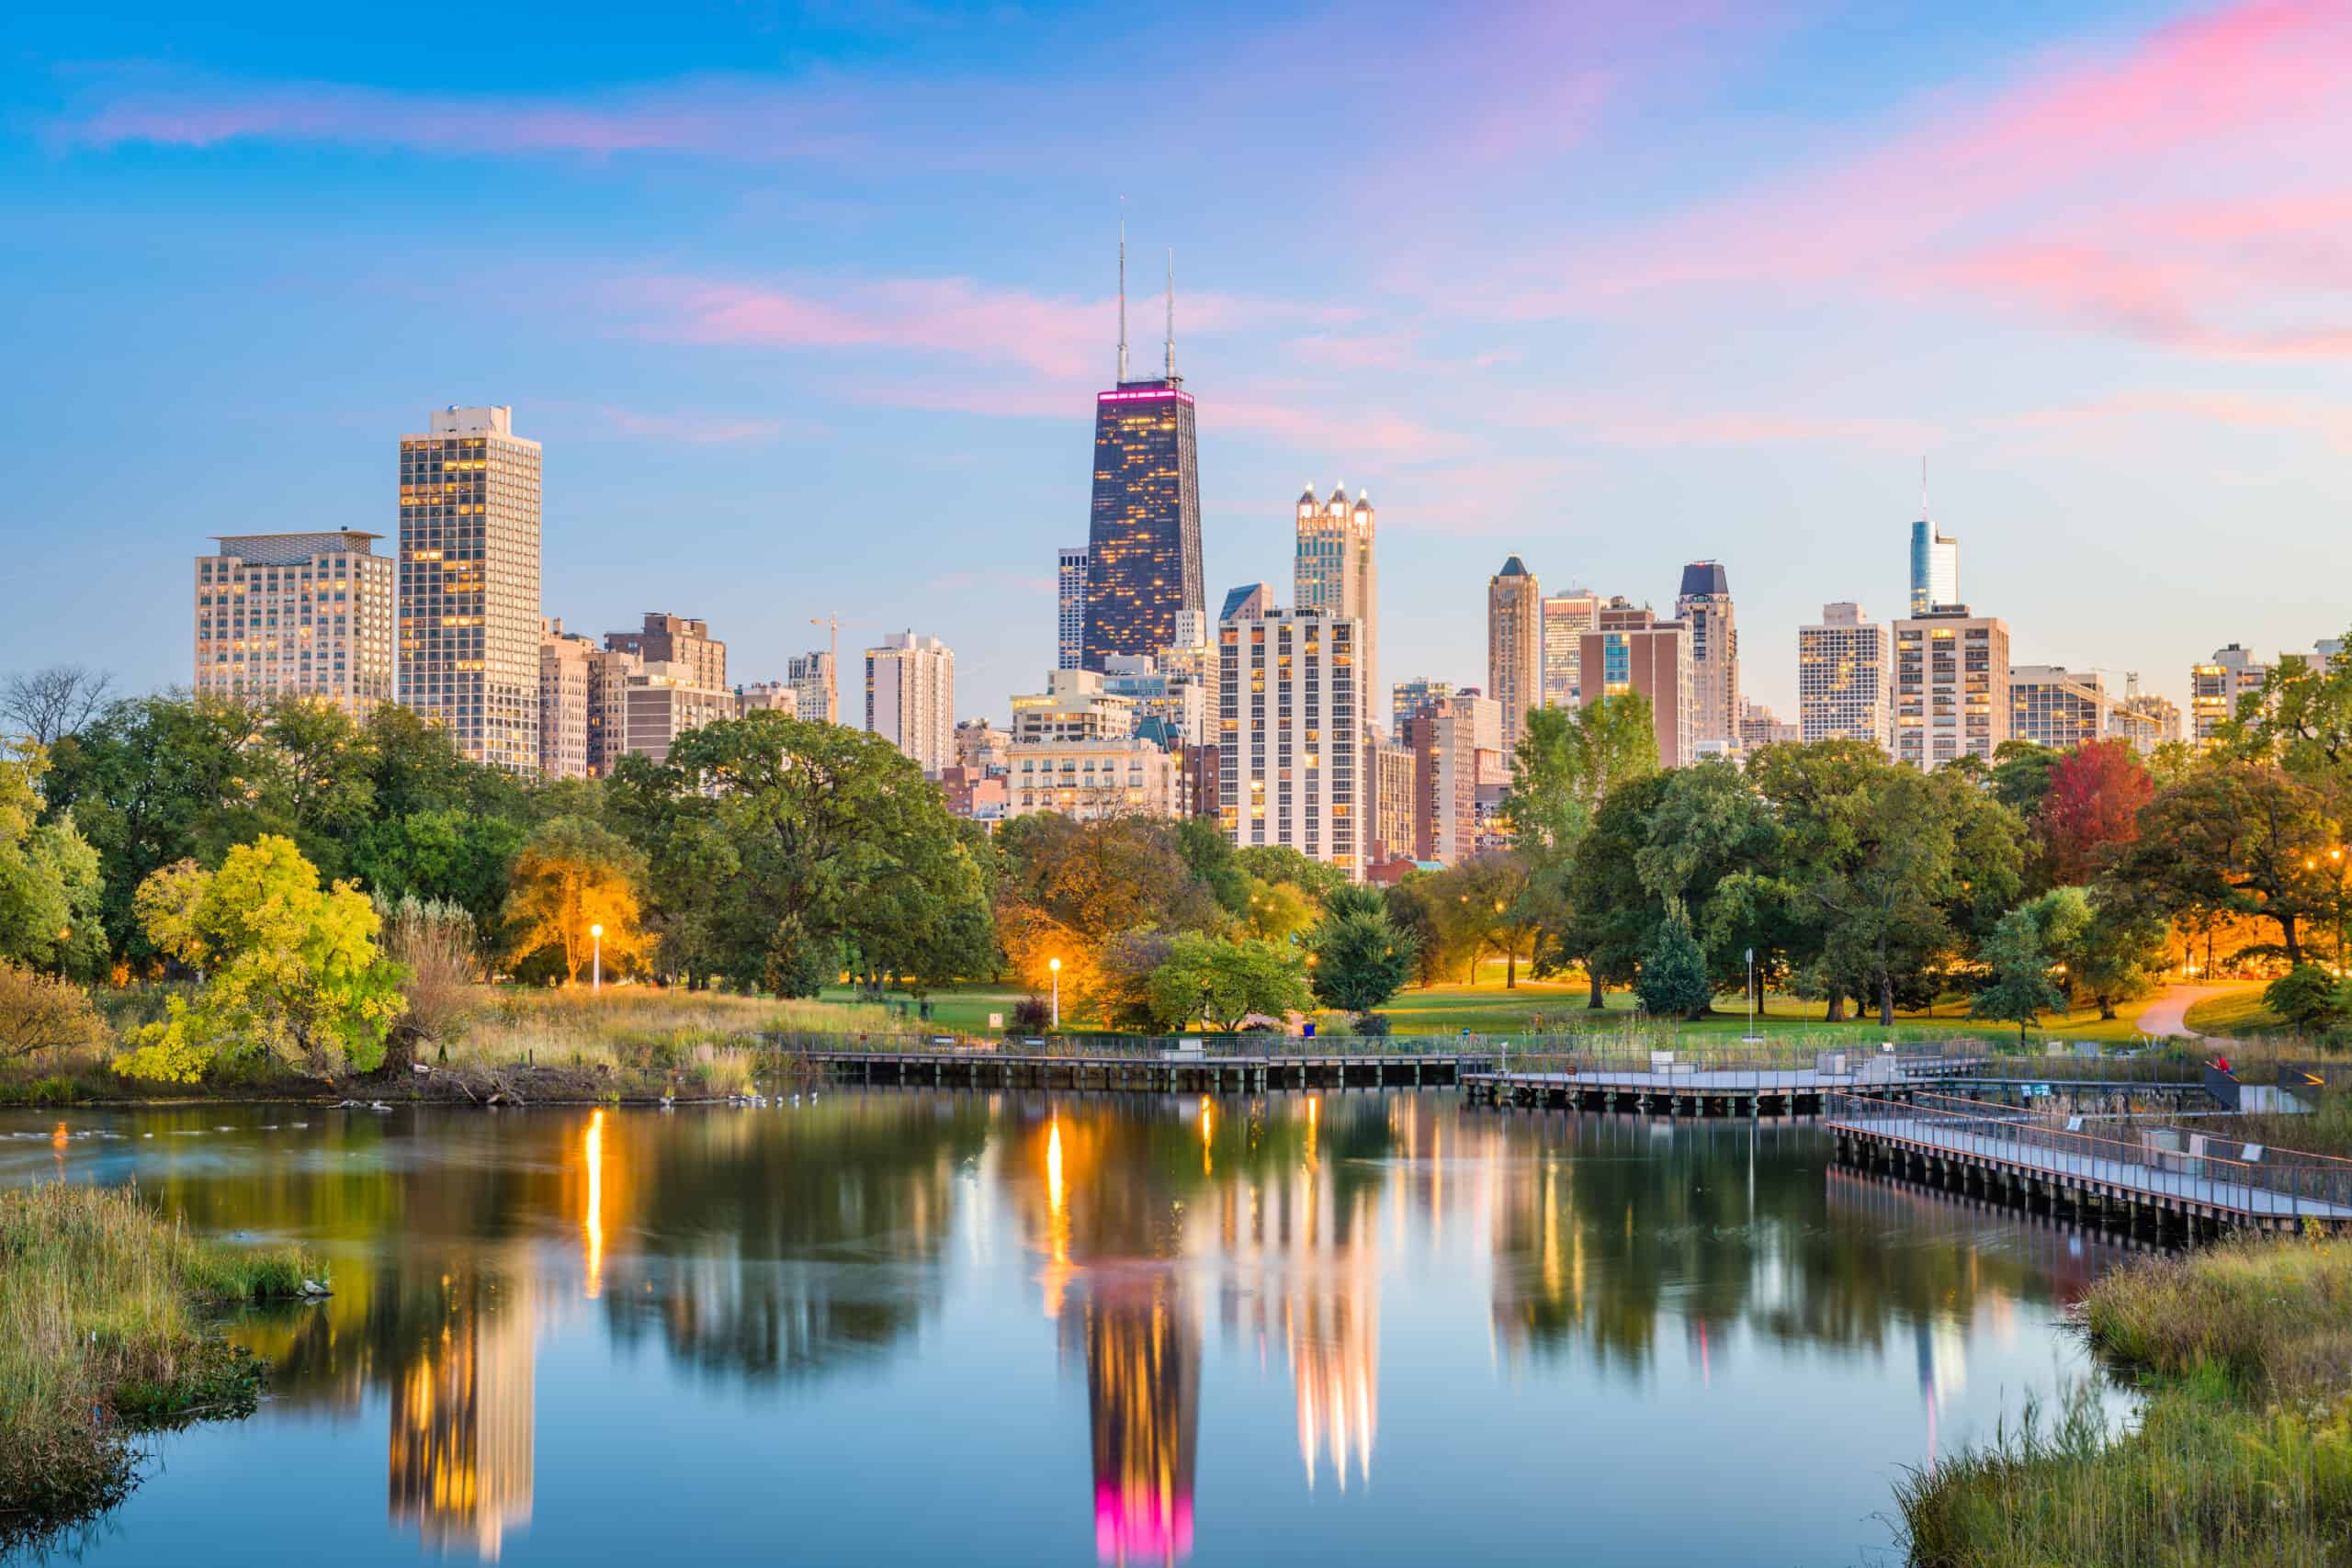
Source: Sean Pavone / Shutterstock
- Population change in downtown tracts, 2012 to 2022: +35.8%
- Population change of non-downtown tracts, 2012 to 2022: -1.3%
- Per capita income change in downtown tracts, 2012 to 2022: +5.0%
- Per capita income change in non-downtown tracts, 2012 to 2022: +27.2%
4. Barnstable Town, Massachusetts

Source: OlegAlbinsky / iStock via Getty Images
- Population change in downtown tracts, 2012 to 2022: +37.7%
- Population change of non-downtown tracts, 2012 to 2022: +2.6%
- Per capita income change in downtown tracts, 2012 to 2022: +12.3%
- Per capita income change in non-downtown tracts, 2012 to 2022: +14.7%
3. Cleveland, Ohio
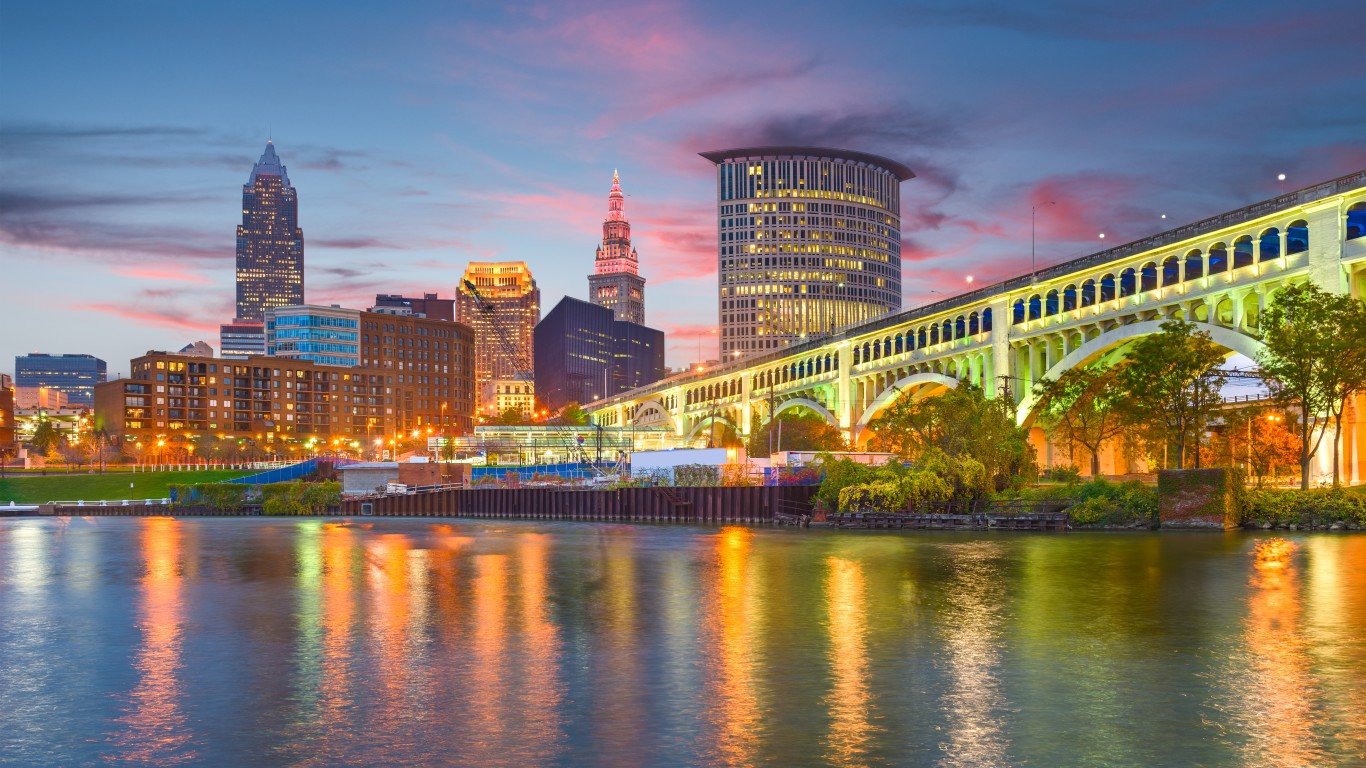
Source: Sean Pavone / iStock via Getty Images
- Population change in downtown tracts, 2012 to 2022: +42.1%
- Population change of non-downtown tracts, 2012 to 2022: -8.4%
- Per capita income change in downtown tracts, 2012 to 2022: +17.9%
- Per capita income change in non-downtown tracts, 2012 to 2022: +15.5%
2. Charlotte, North Carolina
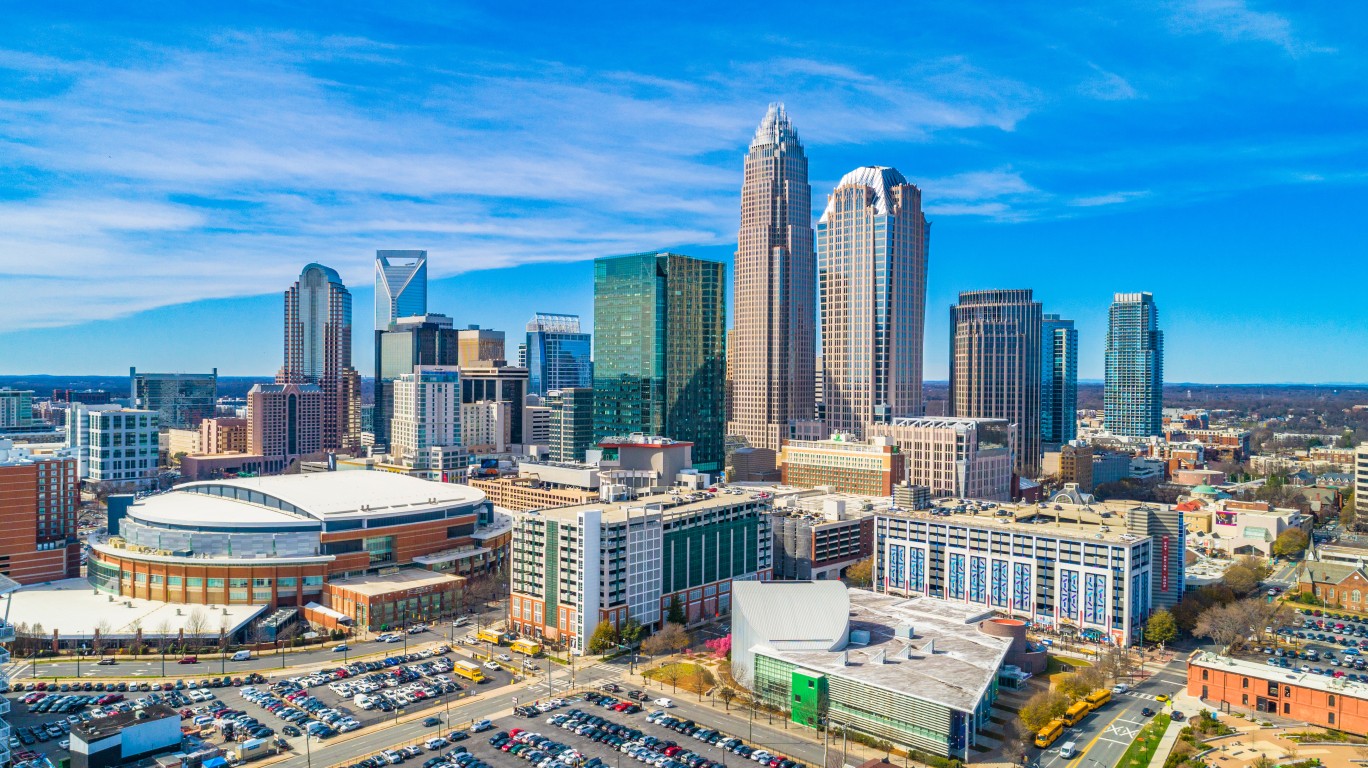
Source: Kruck20 / iStock via Getty Images
- Population change in downtown tracts, 2012 to 2022: +47.0%
- Population change of non-downtown tracts, 2012 to 2022: +11.8%
- Per capita income change in downtown tracts, 2012 to 2022: +29.7%
- Per capita income change in non-downtown tracts, 2012 to 2022: +19.3%
1. Flagstaff, Arizona
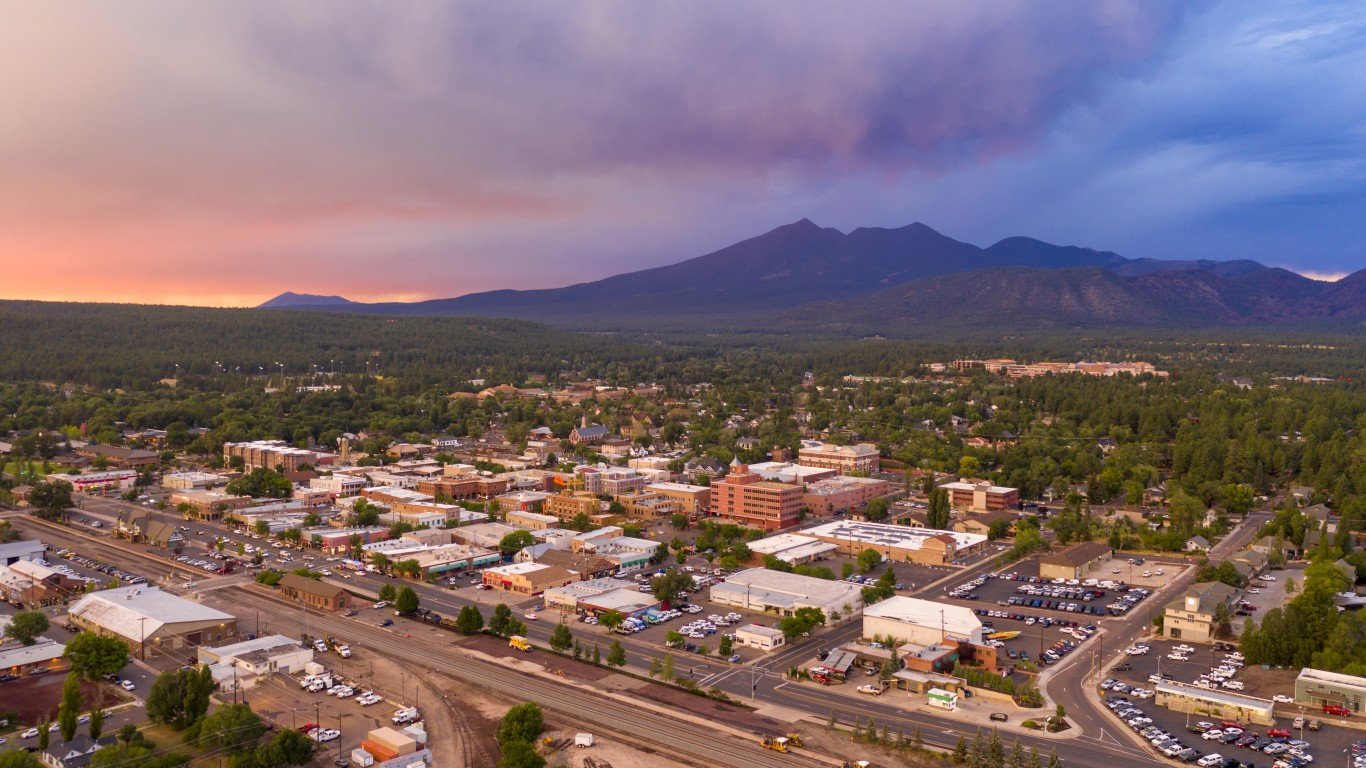
Source: ChrisBoswell / iStock via Getty Images
- Population change in downtown tracts, 2012 to 2022: +49.9%
- Population change of non-downtown tracts, 2012 to 2022: +1.3%
- Per capita income change in downtown tracts, 2012 to 2022: +8.4%
- Per capita income change in non-downtown tracts, 2012 to 2022: +22.0%
Take This Retirement Quiz To Get Matched With An Advisor Now (Sponsored)
Are you ready for retirement? Planning for retirement can be overwhelming, that’s why it could be a good idea to speak to a fiduciary financial advisor about your goals today.
Start by taking this retirement quiz right here from SmartAsset that will match you with up to 3 financial advisors that serve your area and beyond in 5 minutes. Smart Asset is now matching over 50,000 people a month.
Click here now to get started.
Thank you for reading! Have some feedback for us?
Contact the 24/7 Wall St. editorial team.
Editors' Picks