
[cnxvideo id=”625476″ placement=”ros”]The average American born in 1960 is expected to live for 69.8 years. Today, the life expectancy of someone born in the United States is 78.9 years. Thanks to advances in medical technology and healthcare spending, longevity in the country continues to rise.
Compared to other advanced economies, however, health in the United States is improving at a relatively slow pace. According to the the OECD’s Health at a Glance Report, while life expectancy in the United States has increased by nine years since 1960, average life expectancy across all OECD nations improved by 13 years. The slower pace is somewhat disquieting, especially considering that the United States spends $9,146 per capita in public health annually — the third most in the world and nearly double the average expenditure across OECD nations.
While the nation as a whole is trailing most developed countries, some states are keeping up better than others. In Hawaii, Americans are expected to live 81.3 years, the longest of all states and in line with most of Western Europe. Meanwhile, Mississippi’s 75 year life expectancy is closer to the 74.7 year life expectancy across all Latin American and Caribbean countries.
Click here to see the states with the longest (and shortest) life expectancies.
24/7 Wall St. reviewed data from the OECD Regional Well-Being study to determine the states with the longest and shortest life expectancy at birth.
Within most western economies, differences in life expectancy are heavily tied to behavioral factors. One likely reason for the U.S.’s relatively low life expectancy is its widespread obesity. Obesity can be indicative of unhealthy behavior, and is itself a major risk factor in diabetes, cardiovascular disease, and other life-threatening conditions. The obesity rate in the United States is 28.9%, by far the highest of any OECD nation.
The discrepancies in life expectancy between states can also largely be explained by obesity. In the five states where more than a third of the population is obese, the average life expectancy is no more than 76 years. Likewise, life expectancy in the each of the states with the five lowest obesity rates is 80 years or greater.
The same relationship exists between physical activity and life expectancy. States in which a higher share of residents exercise regularly in their leisure time are much more likely to have a longer average life expectancy.
Socioeconomic status is another significant determinant of a population’s longevity. While not as directly related to health outcomes as obesity or the frequency of physical activity, the wealth of an area’s population tends to reflect its life expectancy. Higher incomes provide for access to better medical care, healthier foods, and more leisure time that can encourage physical activity and ultimately prolong life. Similarly, a higher share of residents living in poverty tends to correspond with a lower life expectancy.
Recent research suggests that the gap in life expectancies between higher and lower income residents is growing. One reason may be the difference in smoking rates between the rich and the poor — the nation’s number one cause of preventable death. While smoking rates have declined nationwide, they’ve declined more among the wealthier population. Nevertheless, no comprehensive explanation for the widening gap exists.
To determine the states with the longest and shortest life expectancies at birth, 24/7 Wall St. reviewed figures from the OECD Regional Well-Being study. Data on obesity and physical inactivity rates came from the CDC’s Behavioral Risk Factor Surveillance System. Population estimates, median household income, and poverty data came from the 2014 American Community Survey, produced by the U.S. Census Bureau.

50. Mississippi
> Life expectancy: 75.0 years
> Population: 2,994,079
> Obesity rate: 35.5% (3rd highest)
> Pct. of adults physically inactive: 31.6% (the highest)
> Poverty rate: 21.5% (the highest)
> Median household income: $39,680 (the lowest)

49. Alabama
> Life expectancy: 75.4 years
> Population: 4,849,377
> Obesity rate: 33.5% (5th highest)
> Pct. of adults physically inactive: 27.6% (4th highest)
> Poverty rate: 19.3% (4th highest)
> Median household income: $42,830 (4th lowest)
[nativounit]

48. West Virginia
> Life expectancy: 75.4 years
> Population: 1,850,326
> Obesity rate: 35.7% (2nd highest)
> Pct. of adults physically inactive: 28.7% (7th highest)
> Poverty rate: 18.3% (7th highest)
> Median household income: $41,059 (2nd lowest)

47. Louisiana
> Life expectancy: 75.7 years
> Population: 4,649,676
> Obesity rate: 34.9% (4th highest)
> Pct. of adults physically inactive: 29.5% (3rd highest)
> Poverty rate: 19.8% (3rd highest)
> Median household income: $44,555 (7th lowest)
[recirclink id=314203]

46. Oklahoma
> Life expectancy: 75.9 years
> Population: 3,878,051
> Obesity rate: 33.0% (6th highest)
> Pct. of adults physically inactive: 28.3% (14th highest)
> Poverty rate: 16.6% (14th highest)
> Median household income: $47,529 (13th lowest)

45. Arkansas
> Life expectancy: 76.0 years
> Population: 2,966,369
> Obesity rate: 35.9% (the highest)
> Pct. of adults physically inactive: 30.7% (6th highest)
> Poverty rate: 18.9% (6th highest)
> Median household income: $41,262 (3rd lowest)

44. Kentucky
> Life expectancy: 76.0 years
> Population: 4,413,457
> Obesity rate: 31.6% (12th highest)
> Pct. of adults physically inactive: 28.2% (5th highest)
> Poverty rate: 19.1% (5th highest)
> Median household income: $42,958 (5th lowest)
[nativounit]

43. Tennessee
> Life expectancy: 76.3 years
> Population: 6,549,352
> Obesity rate: 31.2% (14th highest)
> Pct. of adults physically inactive: 26.8% (7th highest)
> Poverty rate: 18.3% (7th highest)
> Median household income: $44,361 (6th lowest)

42. South Carolina
> Life expectancy: 77.0 years
> Population: 4,832,482
> Obesity rate: 32.1% (10th highest)
> Pct. of adults physically inactive: 25.3% (11th highest)
> Poverty rate: 18.0% (11th highest)
> Median household income: $45,238 (9th lowest)
[recirclink id=313896]

41. Georgia
> Life expectancy: 77.2 years
> Population: 10,097,343
> Obesity rate: 30.5% (19th highest)
> Pct. of adults physically inactive: 23.6% (7th highest)
> Poverty rate: 18.3% (7th highest)
> Median household income: $49,321 (17th lowest)

40. Missouri
> Life expectancy: 77.5 years
> Population: 6,063,589
> Obesity rate: 30.2% (20th highest)
> Pct. of adults physically inactive: 25.0% (21st highest)
> Poverty rate: 15.5% (21st highest)
> Median household income: $48,363 (15th lowest)

39. Indiana
> Life expectancy: 77.6 years
> Population: 6,596,855
> Obesity rate: 32.7% (7th highest)
> Pct. of adults physically inactive: 26.1% (23rd highest)
> Poverty rate: 15.2% (23rd highest)
> Median household income: $49,446 (18th lowest)
[recirclink id=313978]
38. North Carolina
> Life expectancy: 77.8 years
> Population: 9,943,964
> Obesity rate: 29.7% (24th highest)
> Pct. of adults physically inactive: 23.2% (12th highest)
> Poverty rate: 17.2% (12th highest)
> Median household income: $46,556 (11th lowest)

37. Ohio
> Life expectancy: 77.8 years
> Population: 11,594,163
> Obesity rate: 32.6% (8th highest)
> Pct. of adults physically inactive: 25.0% (20th highest)
> Poverty rate: 15.8% (20th highest)
> Median household income: $49,308 (16th lowest)
[nativounit]

36. Nevada
> Life expectancy: 78.1 years
> Population: 2,839,099
> Obesity rate: 27.7% (16th lowest)
> Pct. of adults physically inactive: 22.5% (23rd highest)
> Poverty rate: 15.2% (23rd highest)
> Median household income: $51,450 (24th lowest)

35. Michigan
> Life expectancy: 78.2 years
> Population: 9,909,877
> Obesity rate: 30.7% (17th highest)
> Pct. of adults physically inactive: 25.5% (18th highest)
> Poverty rate: 16.2% (18th highest)
> Median household income: $49,847 (20th lowest)

34. Alaska
> Life expectancy: 78.3 years
> Population: 736,732
> Obesity rate: 29.7% (24th highest)
> Pct. of adults physically inactive: 19.2% (6th lowest)
> Poverty rate: 11.2% (6th lowest)
> Median household income: $71,583 (3rd highest)
[recirclink id=313334]

33. Wyoming
> Life expectancy: 78.3 years
> Population: 584,153
> Obesity rate: 29.5% (24th lowest)
> Pct. of adults physically inactive: 22.1% (6th lowest)
> Poverty rate: 11.2% (6th lowest)
> Median household income: $57,055 (18th highest)

32. Delaware
> Life expectancy: 78.4 years
> Population: 935,614
> Obesity rate: 30.7% (17th highest)
> Pct. of adults physically inactive: 24.9% (17th lowest)
> Poverty rate: 12.5% (17th lowest)
> Median household income: $59,716 (14th highest)
[nativounit]
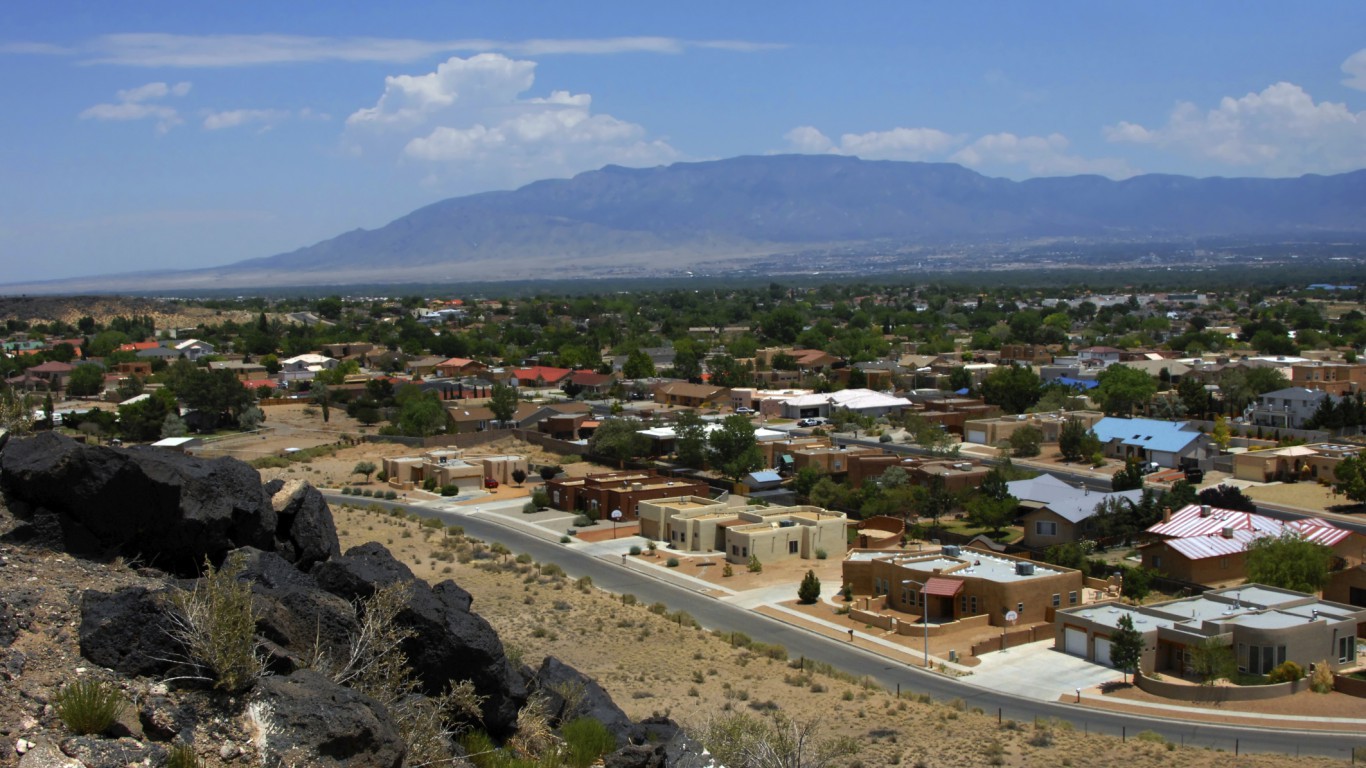
31. New Mexico
> Life expectancy: 78.4 years
> Population: 2,085,572
> Obesity rate: 28.4% (19th lowest)
> Pct. of adults physically inactive: 23.3% (2nd highest)
> Poverty rate: 21.3% (2nd highest)
> Median household income: $44,803 (8th lowest)
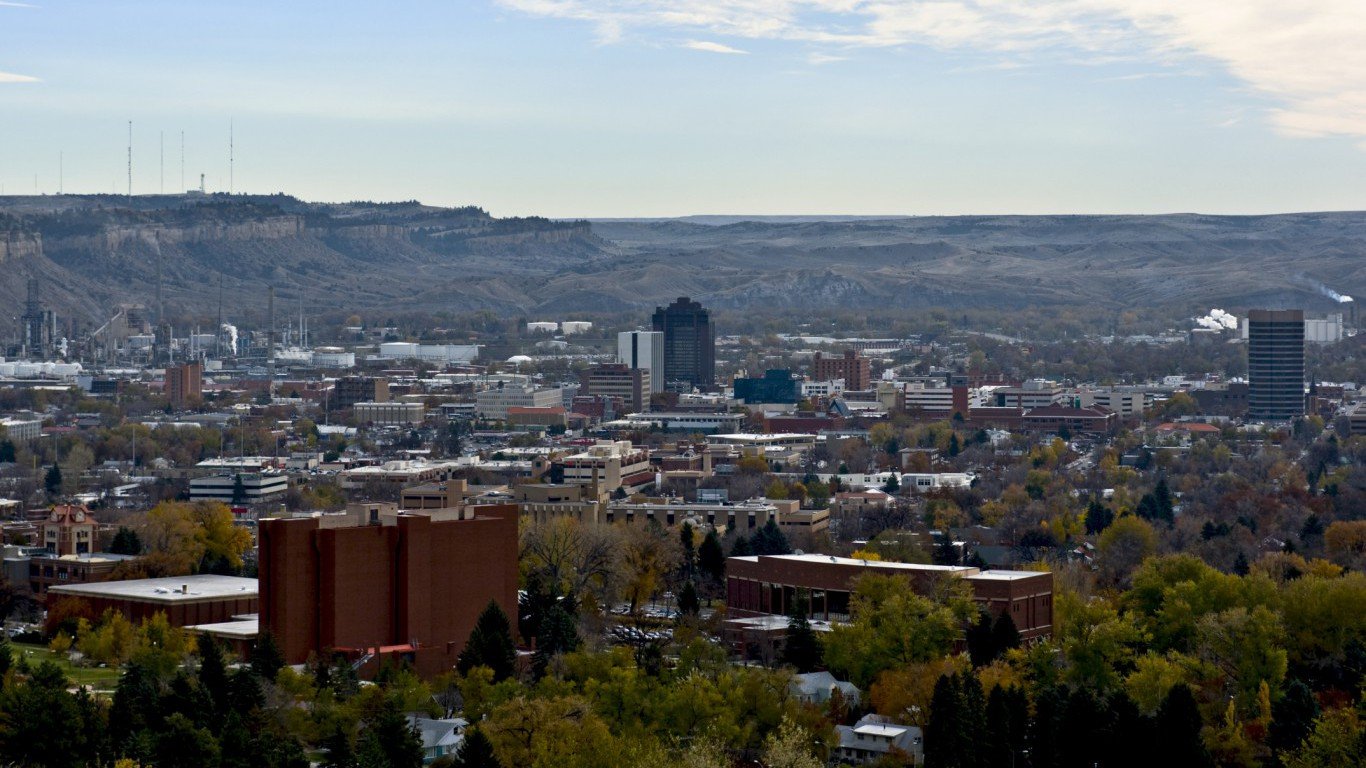
30. Montana
> Life expectancy: 78.5 years
> Population: 1,023,579
> Obesity rate: 26.4% (9th lowest)
> Pct. of adults physically inactive: 19.6% (22nd highest)
> Poverty rate: 15.4% (22nd highest)
> Median household income: $46,328 (10th lowest)

29. Pennsylvania
> Life expectancy: 78.5 years
> Population: 12,787,209
> Obesity rate: 30.2% (20th highest)
> Pct. of adults physically inactive: 23.3% (21st lowest)
> Poverty rate: 13.6% (21st lowest)
> Median household income: $53,234 (22nd highest)
[nativounit]

28. Texas
> Life expectancy: 78.5 years
> Population: 26,956,958
> Obesity rate: 31.9% (11th highest)
> Pct. of adults physically inactive: 27.6% (12th highest)
> Poverty rate: 17.2% (12th highest)
> Median household income: $53,035 (23rd highest)

27. Kansas
> Life expectancy: 78.7 years
> Population: 2,904,021
> Obesity rate: 31.3% (13th highest)
> Pct. of adults physically inactive: 23.8% (21st lowest)
> Poverty rate: 13.6% (21st lowest)
> Median household income: $52,504 (25th lowest)
[recirclink id=313638]

26. Maryland
> Life expectancy: 78.8 years
> Population: 5,976,407
> Obesity rate: 29.6% (25th lowest)
> Pct. of adults physically inactive: 21.4% (2nd lowest)
> Poverty rate: 10.1% (2nd lowest)
> Median household income: $73,971 (the highest)

25. Illinois
> Life expectancy: 79.0 years
> Population: 12,880,580
> Obesity rate: 29.3% (23rd lowest)
> Pct. of adults physically inactive: 23.9% (25th lowest)
> Poverty rate: 14.4% (25th lowest)
> Median household income: $57,444 (17th highest)

24. Virginia
> Life expectancy: 79.0 years
> Population: 8,326,289
> Obesity rate: 28.5% (20th lowest)
> Pct. of adults physically inactive: 23.5% (12th lowest)
> Poverty rate: 11.8% (12th lowest)
> Median household income: $64,902 (8th highest)
[nativounit]

23. Maine
> Life expectancy: 79.2 years
> Population: 1,330,089
> Obesity rate: 28.2% (18th lowest)
> Pct. of adults physically inactive: 19.7% (22nd lowest)
> Poverty rate: 14.1% (22nd lowest)
> Median household income: $49,462 (19th lowest)

22. Florida
> Life expectancy: 79.4 years
> Population: 19,893,297
> Obesity rate: 26.2% (7th lowest)
> Pct. of adults physically inactive: 23.7% (16th highest)
> Poverty rate: 16.5% (16th highest)
> Median household income: $47,463 (12th lowest)
[recirclink id=311794]

21. Idaho
> Life expectancy: 79.5 years
> Population: 1,634,464
> Obesity rate: 28.9% (22nd lowest)
> Pct. of adults physically inactive: 18.7% (25th highest)
> Poverty rate: 14.8% (25th highest)
> Median household income: $47,861 (14th lowest)

20. North Dakota
> Life expectancy: 79.5 years
> Population: 739,482
> Obesity rate: 32.2% (9th highest)
> Pct. of adults physically inactive: 21.3% (9th lowest)
> Poverty rate: 11.5% (9th lowest)
> Median household income: $59,029 (15th highest)

19. Oregon
> Life expectancy: 79.5 years
> Population: 3,970,239
> Obesity rate: 27.9% (17th lowest)
> Pct. of adults physically inactive: 16.5% (14th highest)
> Poverty rate: 16.6% (14th highest)
> Median household income: $51,075 (23rd lowest)
[recirclink id=312913]
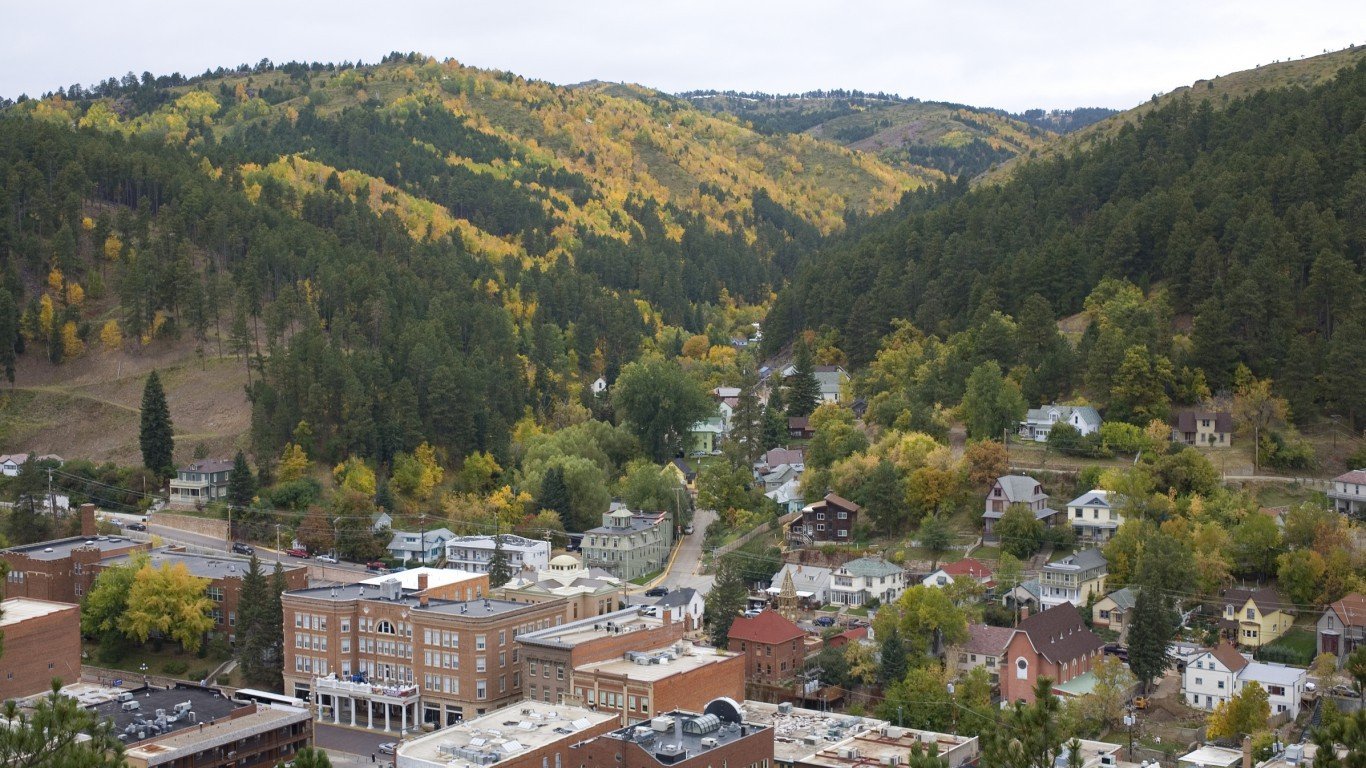
18. South Dakota
> Life expectancy: 79.5 years
> Population: 853,175
> Obesity rate: 29.8% (23rd highest)
> Pct. of adults physically inactive: 21.2% (23rd lowest)
> Poverty rate: 14.2% (23rd lowest)
> Median household income: $50,979 (22nd lowest)

17. Arizona
> Life expectancy: 79.6 years
> Population: 6,731,484
> Obesity rate: 28.9% (22nd lowest)
> Pct. of adults physically inactive: 21.2% (10th highest)
> Poverty rate: 18.2% (10th highest)
> Median household income: $50,068 (21st lowest)
[nativounit]

16. Iowa
> Life expectancy: 79.7 years
> Population: 3,107,126
> Obesity rate: 30.9% (16th highest)
> Pct. of adults physically inactive: 22.6% (15th lowest)
> Poverty rate: 12.2% (15th lowest)
> Median household income: $53,712 (21st highest)

15. Nebraska
> Life expectancy: 79.8 years
> Population: 1,881,503
> Obesity rate: 30.2% (20th highest)
> Pct. of adults physically inactive: 21.3% (16th lowest)
> Poverty rate: 12.4% (16th lowest)
> Median household income: $52,686 (24th highest)

14. Rhode Island
> Life expectancy: 79.9 years
> Population: 1,055,173
> Obesity rate: 27.0% (12th lowest)
> Pct. of adults physically inactive: 22.5% (24th lowest)
> Poverty rate: 14.3% (24th lowest)
> Median household income: $54,891 (19th highest)
[recirclink id=312757]

13. Washington
> Life expectancy: 79.9 years
> Population: 7,061,530
> Obesity rate: 27.3% (13th lowest)
> Pct. of adults physically inactive: 18.1% (19th lowest)
> Poverty rate: 13.2% (19th lowest)
> Median household income: $61,366 (11th highest)

12. Colorado
> Life expectancy: 80.0 years
> Population: 5,355,866
> Obesity rate: 21.3% (the lowest)
> Pct. of adults physically inactive: 16.4% (13th lowest)
> Poverty rate: 12.0% (13th lowest)
> Median household income: $61,303 (12th highest)
[nativounit]

11. Wisconsin
> Life expectancy: 80.0 years
> Population: 5,757,564
> Obesity rate: 31.2% (14th highest)
> Pct. of adults physically inactive: 21.2% (19th lowest)
> Poverty rate: 13.2% (19th lowest)
> Median household income: $52,622 (25th highest)

10. Utah
> Life expectancy: 80.2 years
> Population: 2,942,902
> Obesity rate: 25.7% (6th lowest)
> Pct. of adults physically inactive: 16.8% (11th lowest)
> Poverty rate: 11.7% (11th lowest)
> Median household income: $60,922 (13th highest)

9. New Hampshire
> Life expectancy: 80.3 years
> Population: 1,326,813
> Obesity rate: 27.4% (14th lowest)
> Pct. of adults physically inactive: 19.3% (the lowest)
> Poverty rate: 9.2% (the lowest)
> Median household income: $66,532 (7th highest)
[nativounit]

8. New Jersey
> Life expectancy: 80.3 years
> Population: 8,938,175
> Obesity rate: 26.9% (10th lowest)
> Pct. of adults physically inactive: 23.3% (4th lowest)
> Poverty rate: 11.1% (4th lowest)
> Median household income: $71,919 (2nd highest)

7. Massachusetts
> Life expectancy: 80.5 years
> Population: 6,745,408
> Obesity rate: 23.3% (3rd lowest)
> Pct. of adults physically inactive: 20.1% (10th lowest)
> Poverty rate: 11.6% (10th lowest)
> Median household income: $69,160 (6th highest)
[recirclink id=311816]

6. New York
> Life expectancy: 80.5 years
> Population: 19,746,227
> Obesity rate: 27.0% (12th lowest)
> Pct. of adults physically inactive: 25.9% (19th highest)
> Poverty rate: 15.9% (19th highest)
> Median household income: $58,878 (16th highest)

5. Vermont
> Life expectancy: 80.5 years
> Population: 626,562
> Obesity rate: 24.8% (5th lowest)
> Pct. of adults physically inactive: 19.0% (15th lowest)
> Poverty rate: 12.2% (15th lowest)
> Median household income: $54,166 (20th highest)

4. California
> Life expectancy: 80.8 years
> Population: 38,802,500
> Obesity rate: 24.7% (4th lowest)
> Pct. of adults physically inactive: 21.7% (17th highest)
> Poverty rate: 16.4% (17th highest)
> Median household income: $61,933 (9th highest)
[nativounit]

3. Connecticut
> Life expectancy: 80.8 years
> Population: 3,596,677
> Obesity rate: 26.3% (8th lowest)
> Pct. of adults physically inactive: 20.6% (3rd lowest)
> Poverty rate: 10.8% (3rd lowest)
> Median household income: $70,048 (4th highest)

2. Minnesota
> Life expectancy: 81.1 years
> Population: 5,457,173
> Obesity rate: 27.6% (15th lowest)
> Pct. of adults physically inactive: 20.2% (9th lowest)
> Poverty rate: 11.5% (9th lowest)
> Median household income: $61,481 (10th highest)
[recirclink id=309960]

1. Hawaii
> Life expectancy: 81.3 years
> Population: 1,419,561
> Obesity rate: 22.1% (2nd lowest)
> Pct. of adults physically inactive: 19.6% (7th lowest)
> Poverty rate: 11.4% (7th lowest)
> Median household income: $69,592 (5th highest)
Contact [email protected] for any questions or corrections.