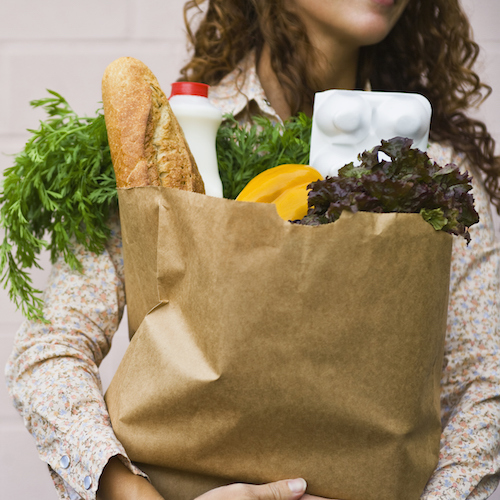
[cnxvideo id=”510061″ placement=”ros”]Many American consumers have been felt the effect of rising food prices on their grocery bills. Between 2006 and 2016, the price of food has increased by 27.8%, outpacing the 21.9% inflation rate. The prices of some goods and popular consumer items have also surged to a much greater degree.
To determine which items are driving up grocery bills the most, 24/7 Wall St. analyzed changes in the Consumer Price Index from 2006 to 2016 for over 300 goods with data from the Bureau of Labor Statistics. Nearly doubling in price over the last 10 years, cigarettes had the largest increase in price of any grocery item.
[in-text-ad]
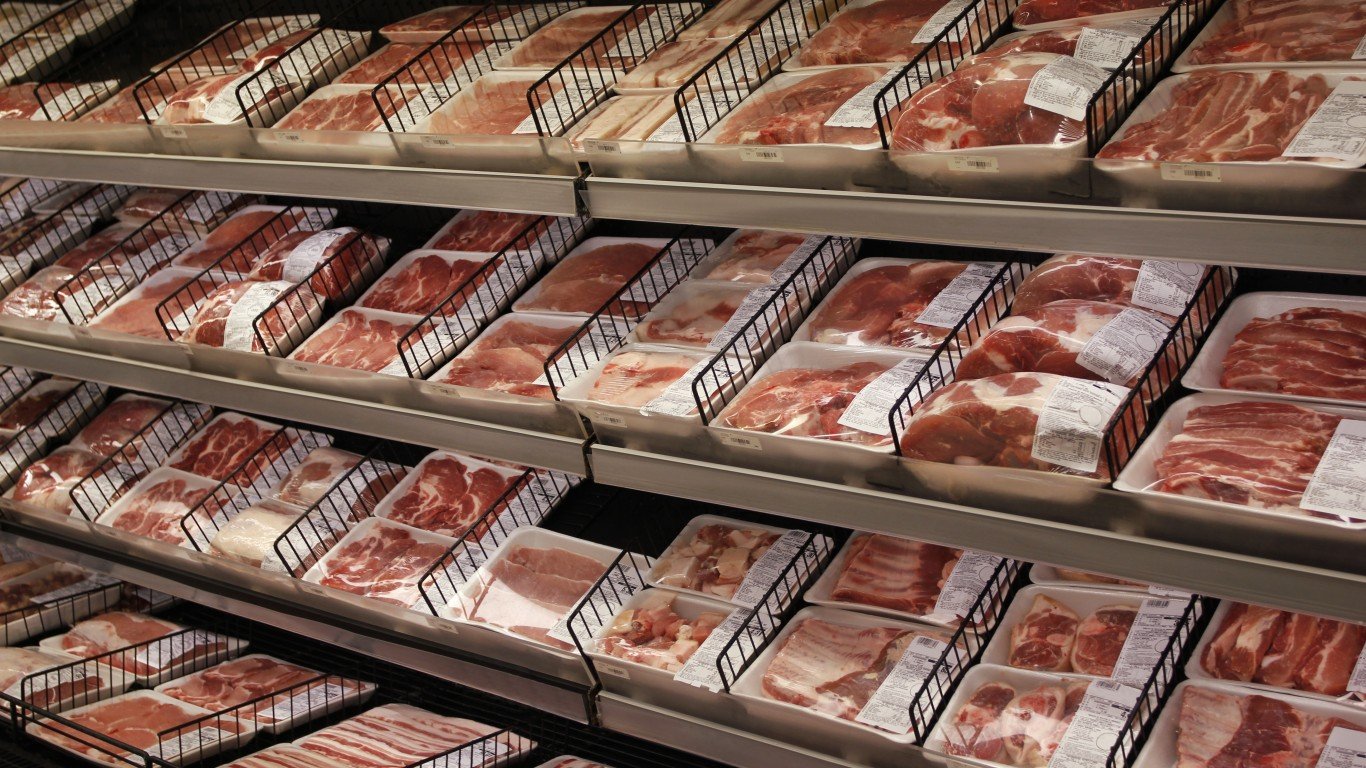
Several factors are behind the general rise in the price of food over the last few decades. One is greater demand. As the world population becomes wealthier over time, demand for food and more expensive goods rises. Specifically, as people have demanded more meat, the price of cattle, poultry, and other animal products has increased.
Click here to see the 20 groceries driving up your bill the most.
In the United States, there were large upswings in the prices of a few cow products. The average retail price of beef increased from $4.09 a pound to a record-high $6.29 per pound. As a result of the price increase, Americans consumed roughly 3 billion pounds less of beef in 2015 than in 2005. The price increase was largely due to a supply shortage of beef. Years of drought in the top cattle-producing regions of the country led to reduced cattle inventories, as well as rising energy and animal feed prices.
Animal feed is one of a number of products made from wheat and corn that is growing more expensive. Corn and wheat are particularly susceptible to supply shocks and price volatility, and the country is currently dedicating a larger share of its corn supply for uses outside of agriculture. The U.S. government provides subsidies to farmers who grow corn for use in biofuels, prompting many farmers to switch from growing corn for consumption to growing it for ethanol production. While an estimated 6% of U.S. corn crop was used for ethanol in 2000, that share has since risen to 40% today. Additionally, the World Trade Organization limits the supply of corn and wheat that the U.S. can store in reserve, weakening the country’s buffer against shortages. A number of foods with the fastest rising prices contain either corn or wheat as a primary ingredient.
Price increases of such basic ingredients as flour, sugar, corn, and oil — used in a wide array of foods — can impact a large share of grocery items. The price of flour, for example, rose by 32% between 2006 and 2016. A number of items that require flour as a basic ingredient, such as cookies, cupcakes, pasta, and bread, also rose in price substantially.
For most basic goods, price fluctuations can have a major impact on consumer behavior. A major hike in the federal cigarette tax in 2009 — from 39 cents per pack to just over one dollar per pack — likely drove down tobacco consumption considerably. Over the last 10 years, the price of tobacco and other smoking products rose by 90.4%, more than four times the overall increase in price for all goods. The U.S. adult smoking rate fell from 20.9% in 2004 to 16.8% in 2014.
To determine which items are driving up grocery bills the most, 24/7 Wall St. analyzed changes in the Consumer Price Index from 2006 to 2016 for over 300 foods and frequently purchased consumer items with data from the Bureau of Labor Statistics. Definitions of food items also came from the BLS. To avoid repetition, we excluded certain items from the list when a similar product had a larger increase. For example, two items classified on the CPI — uncooked ground beef and uncooked beef steaks — each had substantial price increases. Only uncooked ground beef, which had the larger 10-year increase, remained on the list.
These are the 20 foods driving up your grocery bill the most.

20. Canned fruits
> Price increase: 32.0%
Over the last century, canned fruits have grown in popularity due to rising demand for convenience and healthy food. Canned fruits have longer shelf lives and lower shipping and handling costs than fresh produce, and as a result they are heavily imported and exported. The availability of foreign suppliers tends to keep prices more stable, as these products are less subject to the seasonal production and price fluctuations that fresh produce may face. Easy importing and exporting also exposes vendors to international markets — where rising affluence is increasing the demand and price of healthy foods. Nevertheless, the price of canned fruits rose by 32.0% between 2006 and 2016, outpacing the 21.9% inflation rate for all items.
[in-text-ad]
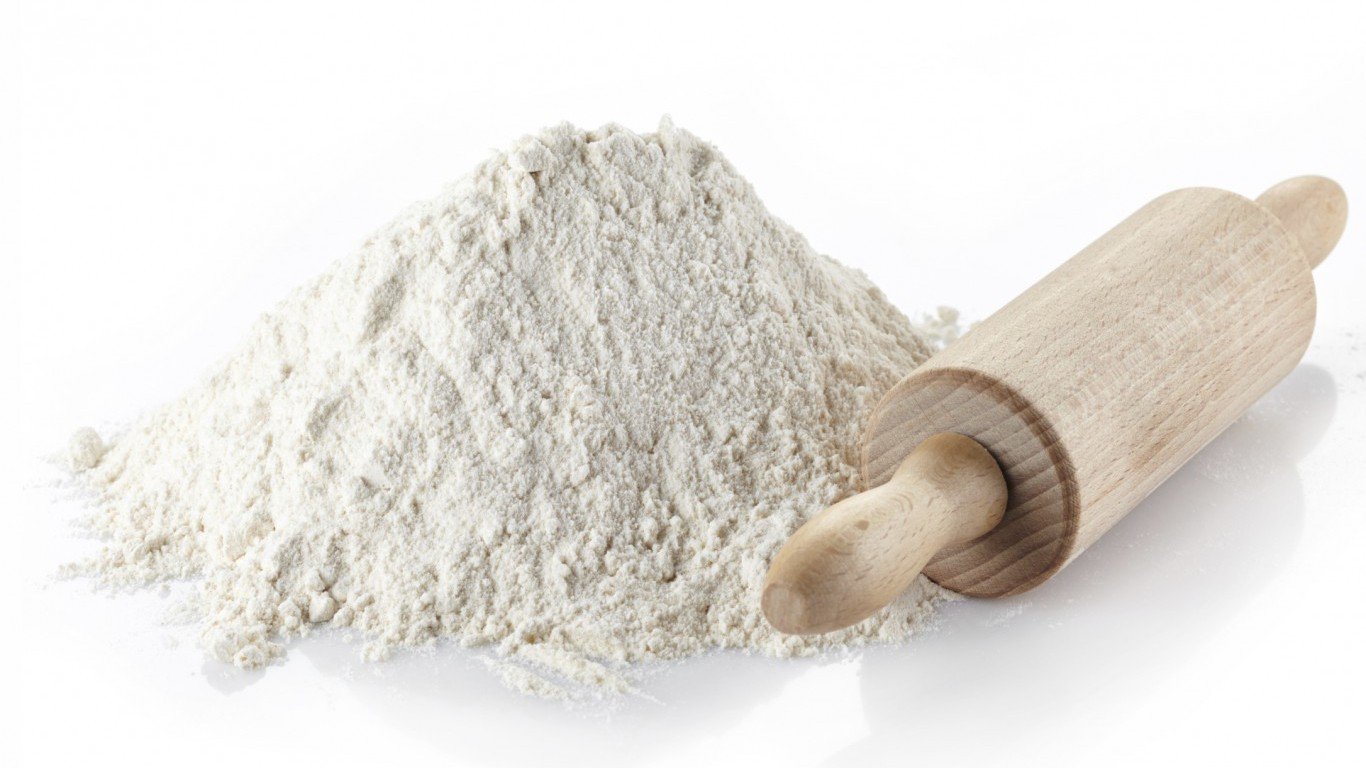
19. Flour and prepared flour mixes
> Price increase: 32.1%
The price of flour and prepared flour mixes has increased by roughly 32% over the past 10 years, much more than the 22% increase in the overall price of goods. One reason may be the limit imposed by the World Trade Organization on how much wheat the U.S. is allowed to keep in reserve supply. The restriction weakens the country’s cushion against supply shortages, making the price of flour particularly volatile.
The rising cost of flour has likely had an impact on the prices of several other food categories that use the ingredient. The price of cakes, cupcakes, and cookies rose as much as the price of flour did, while the price of bread rose even more.
[recirclink id=376338]

18. Cakes, cupcakes, and cookies
> Price increase: 32.1%
The price of cakes, cupcakes, and cookies rose by about the same amount as the price of flour, which is a primary ingredient in many of these baked goods. Much of this increase occurred between January 2006 and January 2009, when the price of these goods rose by around 17%.
While the price of these baked goods as a whole increased substantially in the last decade, the price of at least one food in this category, chocolate chip cookies, only increased from $2.76 per pound to to $3.41 per pound. The 23.3% increase is roughly in line with the overall increase in the price of goods and services due to inflation.
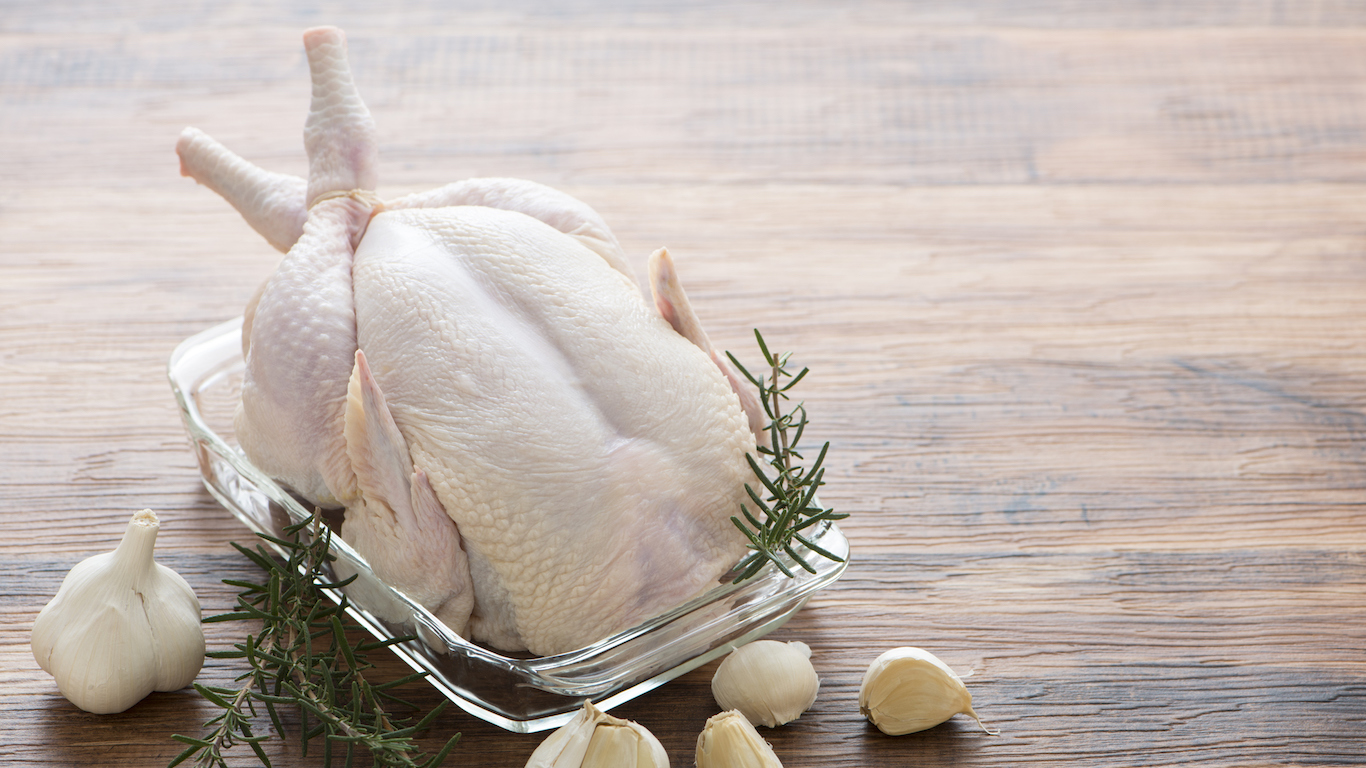
17. Fresh whole chicken
> Price increase: 32.5%
Depending on which parts of the bird shoppers buy, chicken over the past decade has either become much more affordable, or much less affordable. The price of chicken legs rose by about 11% since January 2006, while the price of boneless chicken breasts actually fell 3%, which represents a huge relative decline given that the overall price of goods and services rose by 22% due to inflation over that period. Whole, fresh chickens, on the other hand, became more expensive, with prices rising by about 33% over the decade.
[in-text-ad-2]
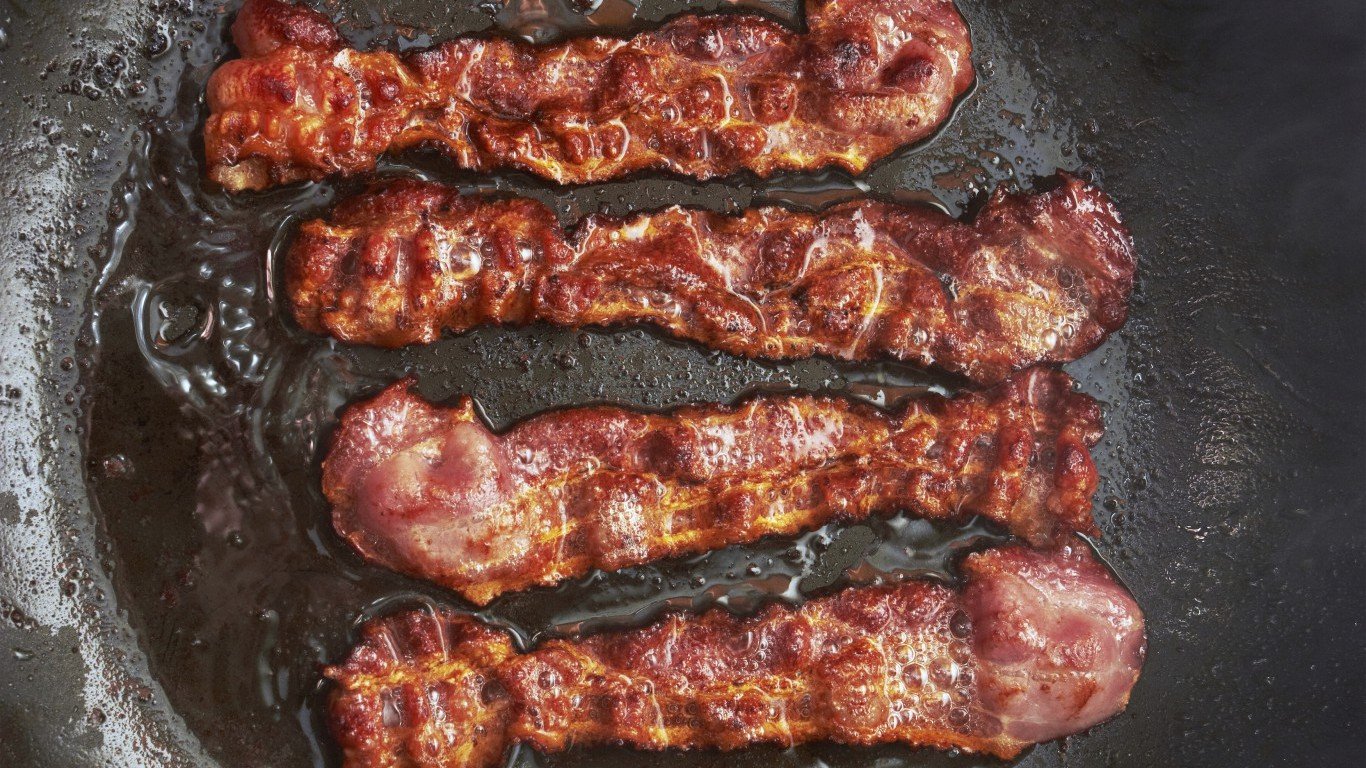
16. Bacon and related products
> Price increase: 33.2%
Those who consider bacon an essential part of breakfast have likely felt the effect of increasing bacon costs on their wallet. The price of bacon and bacon related products rose by nearly a third over the past decade. When examining the price of just sliced bacon, the increase has been even more dramatic. Sliced bacon prices rose by about 52%, more than double the overall increase in the price of goods and services during that time. Bacon prices appear set to rise even further in the near future, as the supply of pork bellies — the source of the product — is at about a third of what it was a year ago and is at its lowest level since 1957.
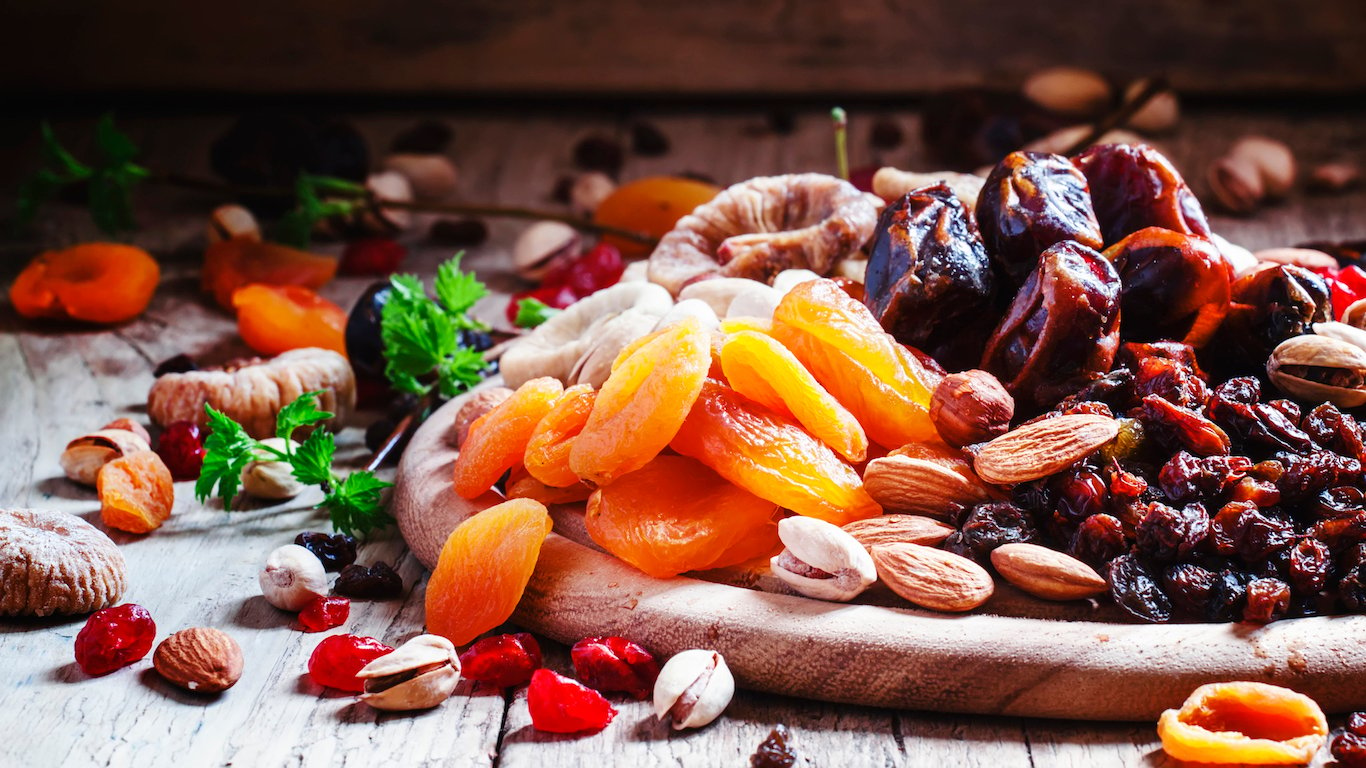
15. Miscellaneous processed fruits and vegetables including dried
> Price increase: 33.7%
The price of miscellaneous processed fruits and vegetables, including dried peas, beans, and lentils, increased by 33.7% between 2006 and 2016, outpacing the 21.9% inflation rate for all items. The capital requirements for fruit and vegetable processing can be high compared to fresh food production, and may be a barrier to entry into the industry. The long shelf life and low shipping costs of processed fruits and vegetables, however, makes importing and exporting less expensive and exposes vendors to the international markets — where rising affluence is increasing the demand and price of healthy foods. With the increase in price of miscellaneous processed fruits and vegetables potentially widening profit margins, companies that were unable to establish fruit and vegetable processing operations a decade ago may now find it more economically viable to do so.
[in-text-ad]
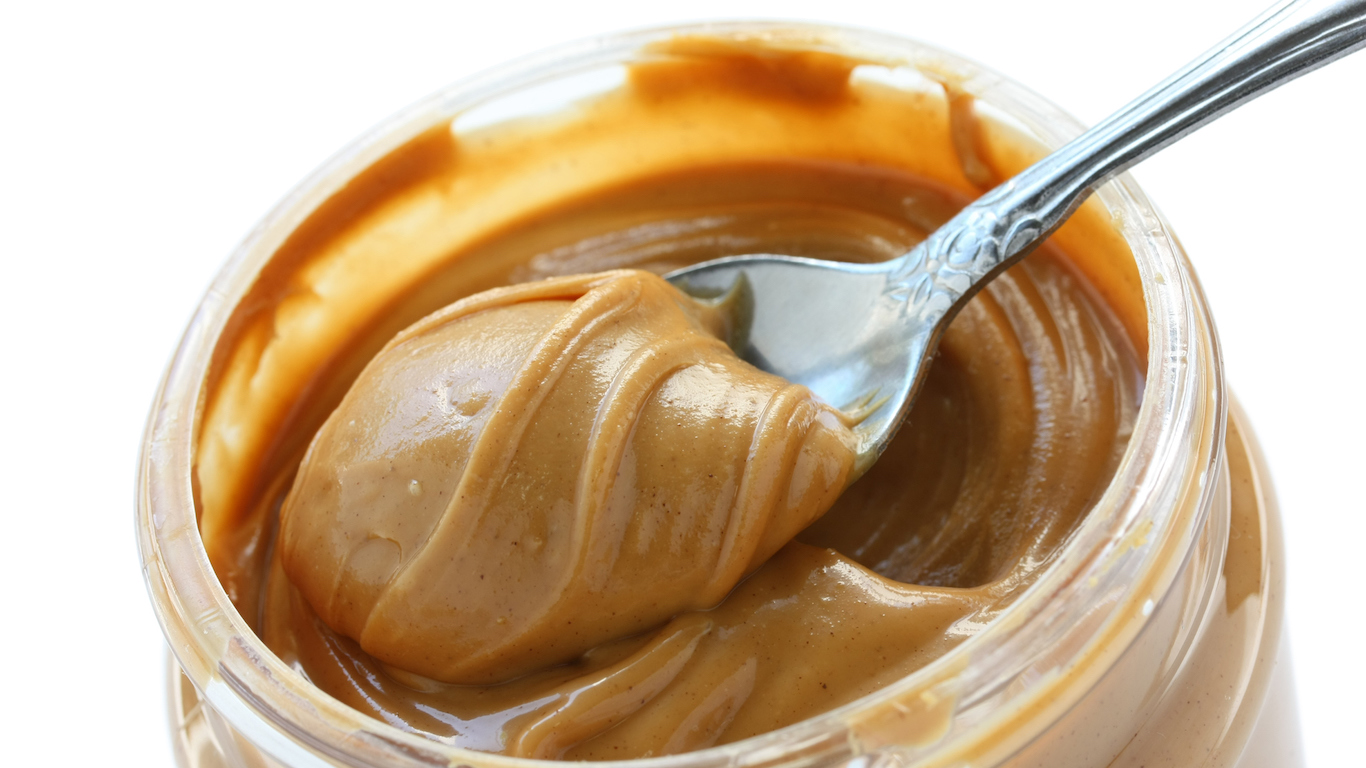
14. Miscellaneous fats and oils including peanut butter
The price of fats and oils, including butter and margarine, increased faster than the increase in the overall cost of goods and services over the last 10 years. Some of the miscellaneous products in the category, such as other alternative cooking oils and peanut butter, rose even more quickly. Peanut butter in particular appears to have been the driving force behind this category’s large price increase, as the price of creamy peanut butter, for example, rose by about 52%, close to double the overall increase among food products. This rise in price appears to be at least partially due to a peanut supply shortage. For many U.S. peanut farmers, 2016 was a hot, dry year that resulted in poor peanut crops and a tightening of the peanut market.
[recirclink id=377173]
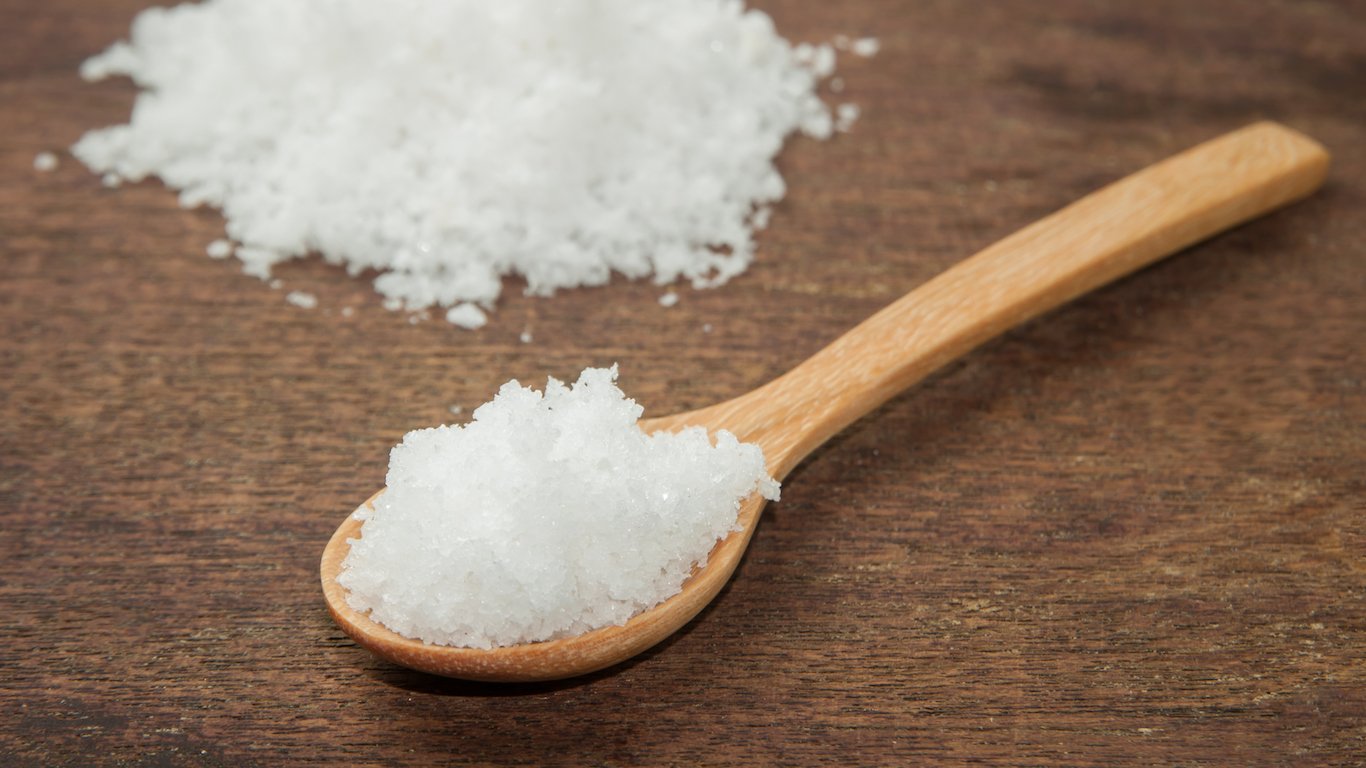
13. Salt and other seasonings and spices
> Price increase: 34.0%
Salt, once a luxury throughout most of the world, is now easily the most commonplace spice that is used to some degree in most savory foods. Over the last decade, the price of salt and other common spices rose substantially. The increase was not enough to return the items to luxury status, but was far greater than the overall inflation rate. Salt and spices prices increased by 34%, compared to the 28% increase across all food products.
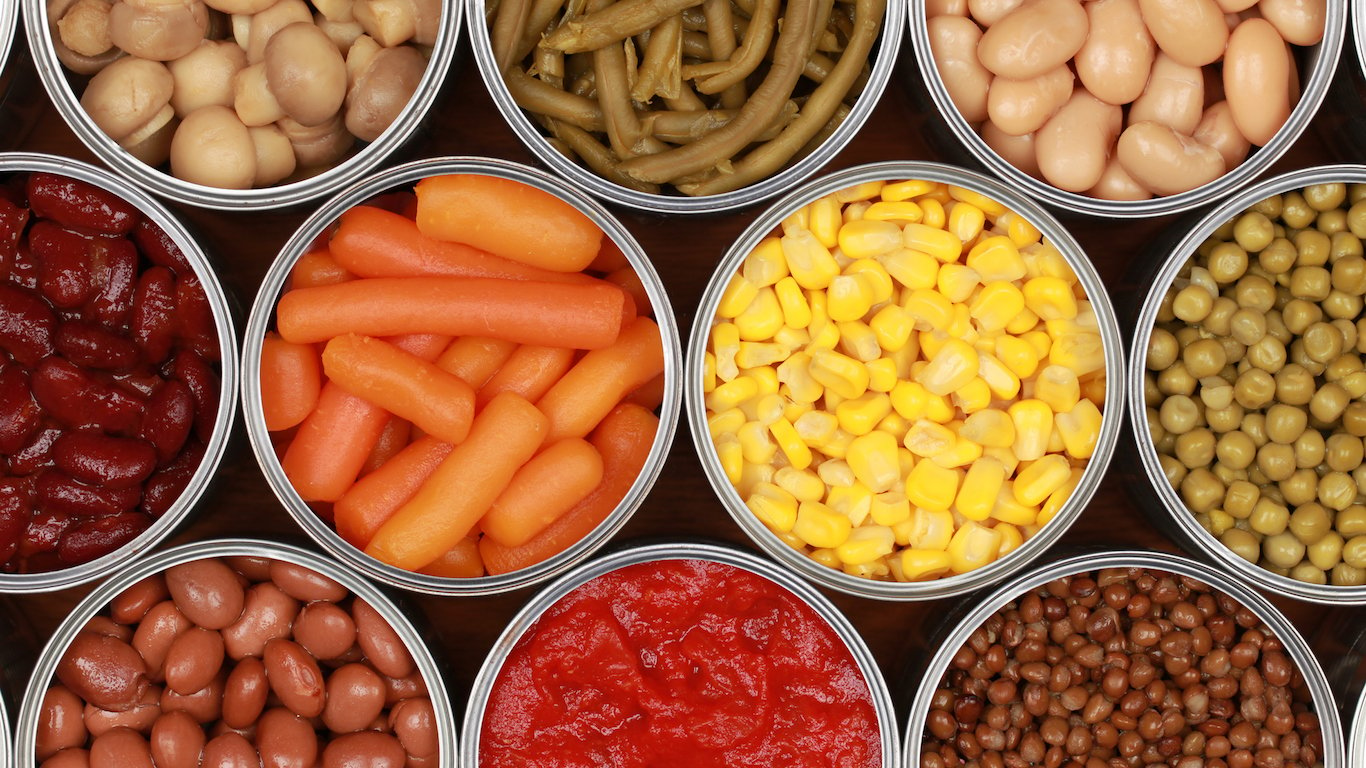
12. Canned vegetables
> Price increase: 35.3%
As food processing technology advanced to meet the rising demand for convenience and healthy eating of American consumers, canned vegetables have grown in popularity. Canned vegetables have a longer shelf life than fresh produce, as well as lower shipping and handling costs. As a result, canned vegetables are heavily imported and exported around the world. While international trade may have helped curbed price fluctuations for canned vegetables, the grocery item nevertheless increased in price by 35.3% between 2006 and 2016, more than a majority of foods. Meanwhile, inflation has led to a 21.9% increase in prices for all U.S. items. Rising global affluence has led to increased demand of both canned and fresh vegetables, which may help explain the sharp rise in price.
[in-text-ad-2]

11. Frankfurters
> Price increase: 35.8%
The price of frankfurters increased by 35.8% between 2006 and 2016, far more than the 21.9% inflation rate for all items. Frankfurters are one of several cow products that have risen in price over past decade. The upswing is likely related to the beef supply shortage. Years of drought in the top cattle producing regions of the country as well as rising feed and energy prices reduced cattle inventories. As the total number of cattle and calves on U.S. farms fell by roughly 6 million head over the past decade, the average retail price of Choice beef increased to a record-high of $6.29 per pound. Perhaps as a result of the costlier cow products, Americans consumed roughly 3 billion pounds less Choice beef in 2015 than in 2005.
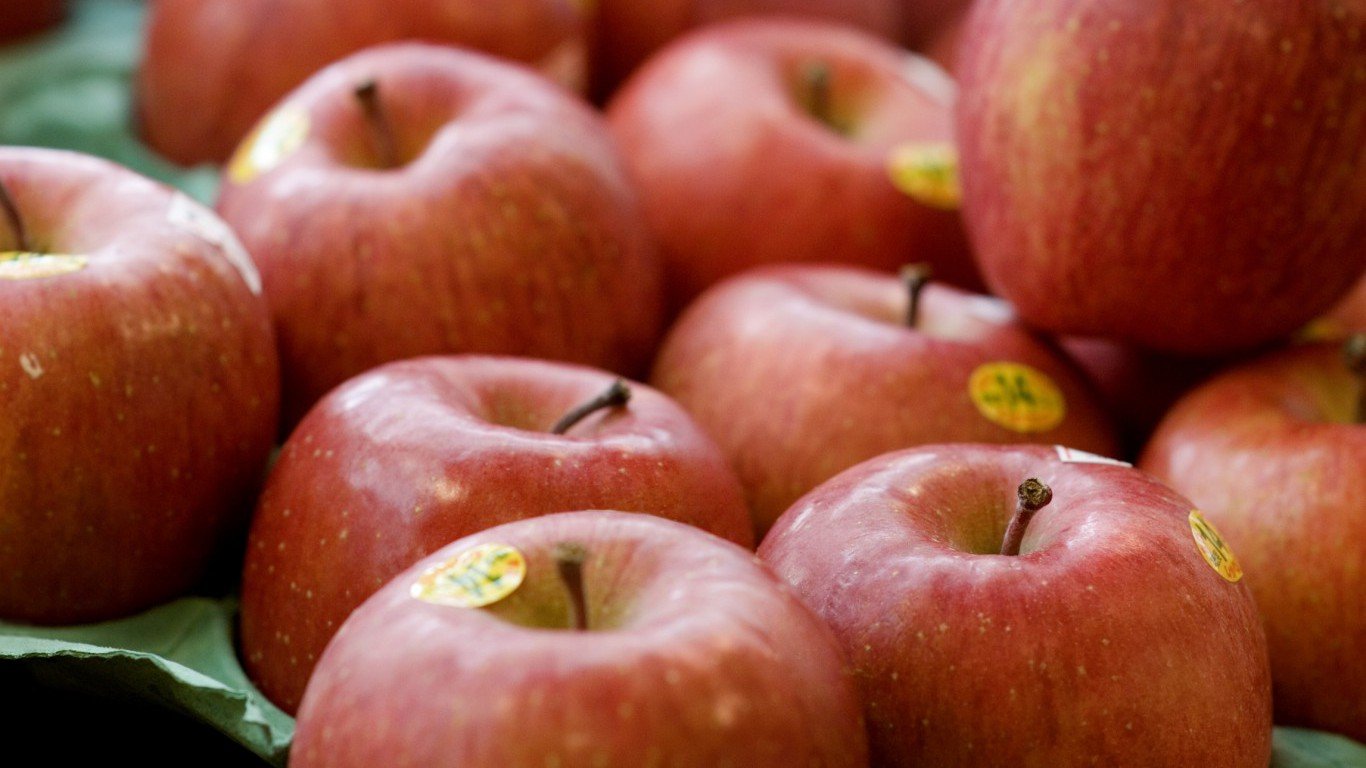
10. Apples
> Price increase: 36.6%
According to the USDA, demand for apples among American consumers has remained fairly unchanged since the 1980s. Demand declined somewhat in the 1990s as countries as countries in the Southern Hemisphere began to increase exports of more exotic fruits previously unavailable in the winter months. In response, U.S. apple growers increased their apple exports to a record high in 2015. To accommodate the tastes of foreign markets, apple producers added higher quality, more expensive apple varieties to their orchards. As U.S. apple exports rose between 2006 and 2016, the price of apples increased 37%, outpacing the 28% increase in overall food price.
[in-text-ad]
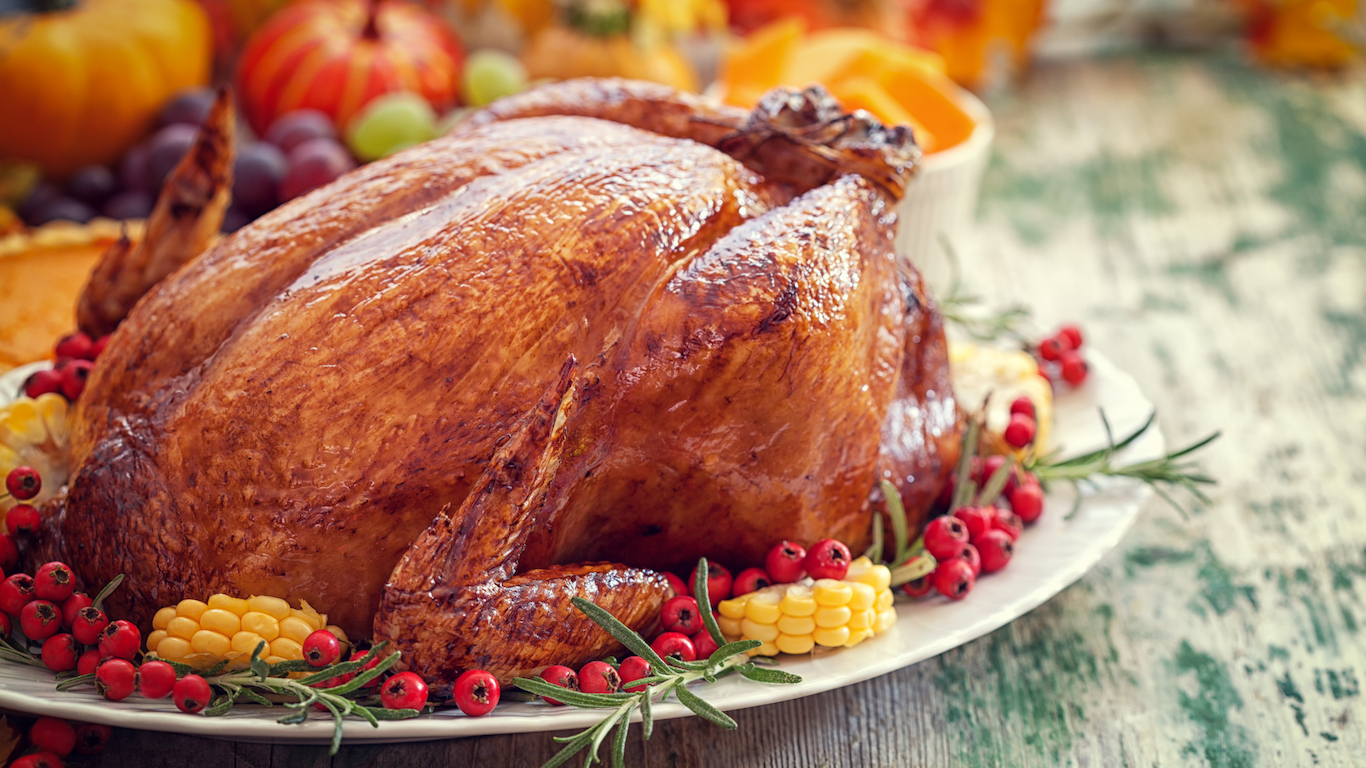
9. Miscellaneous poultry including turkey
> Price increase: 37.0%
Poultry other than chicken, such as ducks, fowl, and turkey, have increased in price by 37% over the past decade, outpacing the 22% inflation rate for all items. The cost of a frozen turkey on Thanksgiving rose from roughly 97 cents per pound in 2006 to $1.53 per pound in 2016. One reason for the price hike in 2015 may have been a supply shortage caused by the worst outbreak of bird flu in U.S. history. Roughly 48 million birds were lost to avian influenza in the summer of 2015, which resulted in an estimated 20% increase in the price of turkey from the year prior.
[recirclink id=375655]
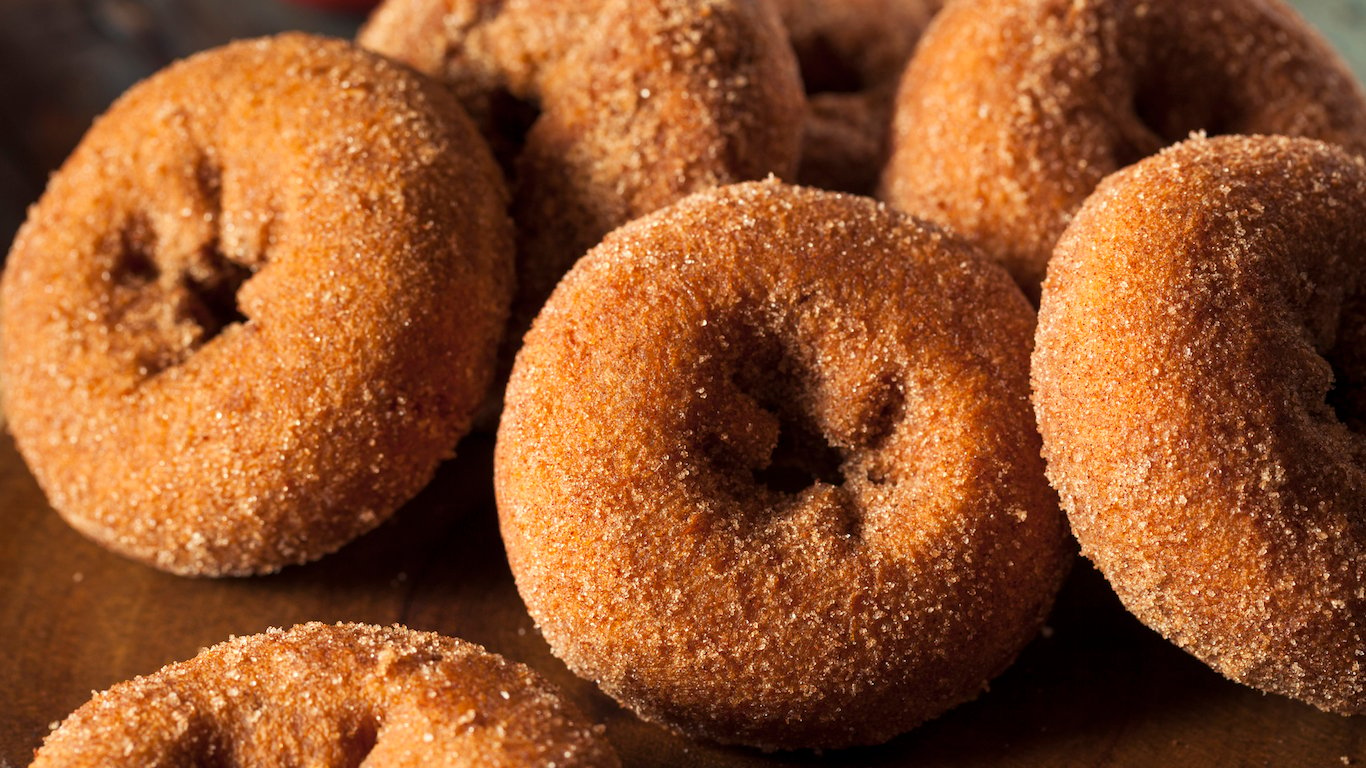
8. Snacks
> Price increase: 38.4%
The cost of calorie-dense snack foods such as danishes, donuts, ice cream, and toaster pastries have increased 38.4% between 2006 and 2016, far more than the 27.8% upswing in price for all food items. Snacking behavior has risen substantially in the past few decades, with American children increasing their snack intake from once on day on average in the late 1970s to nearly three times daily today. According to the USDA, one reason households consume high-calorie, low-nutrient snacks so often is the misconception that healthier fruits and vegetables are more expensive, when in fact they cost roughly the same on a per-serving basis.
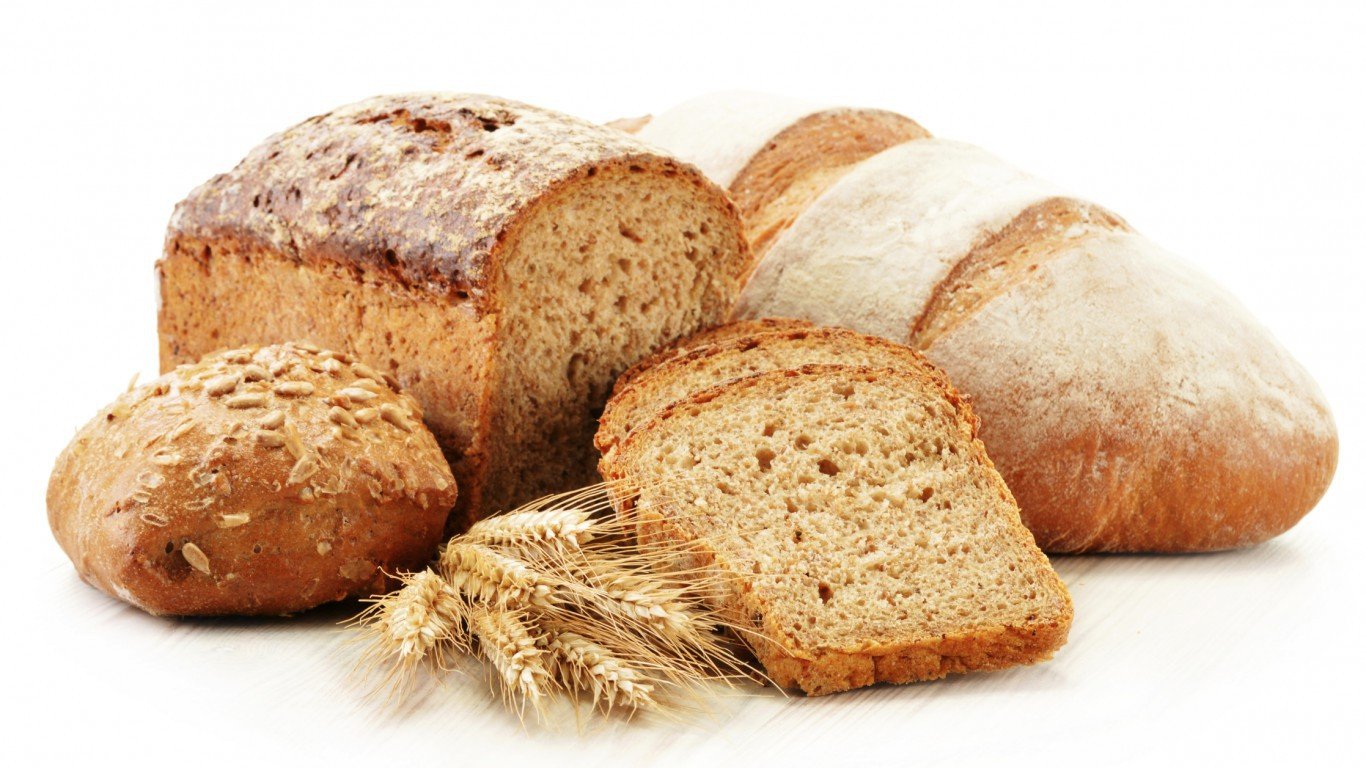
7. Bread
> Price increase: 38.9%
The price of bread increased by 39% between 2006 and 2016, outpacing the 22% inflation rate rate for all items by 17 percentage points. American wheat consumption per capita has gradually declined over the last two decades as more consumers adopt low-carb diets, and some phase bread out of their grocery lists entirely. For less wealthy nations, where bread is a major dietary staple, the price change may have a more serious impact.
[in-text-ad-2]
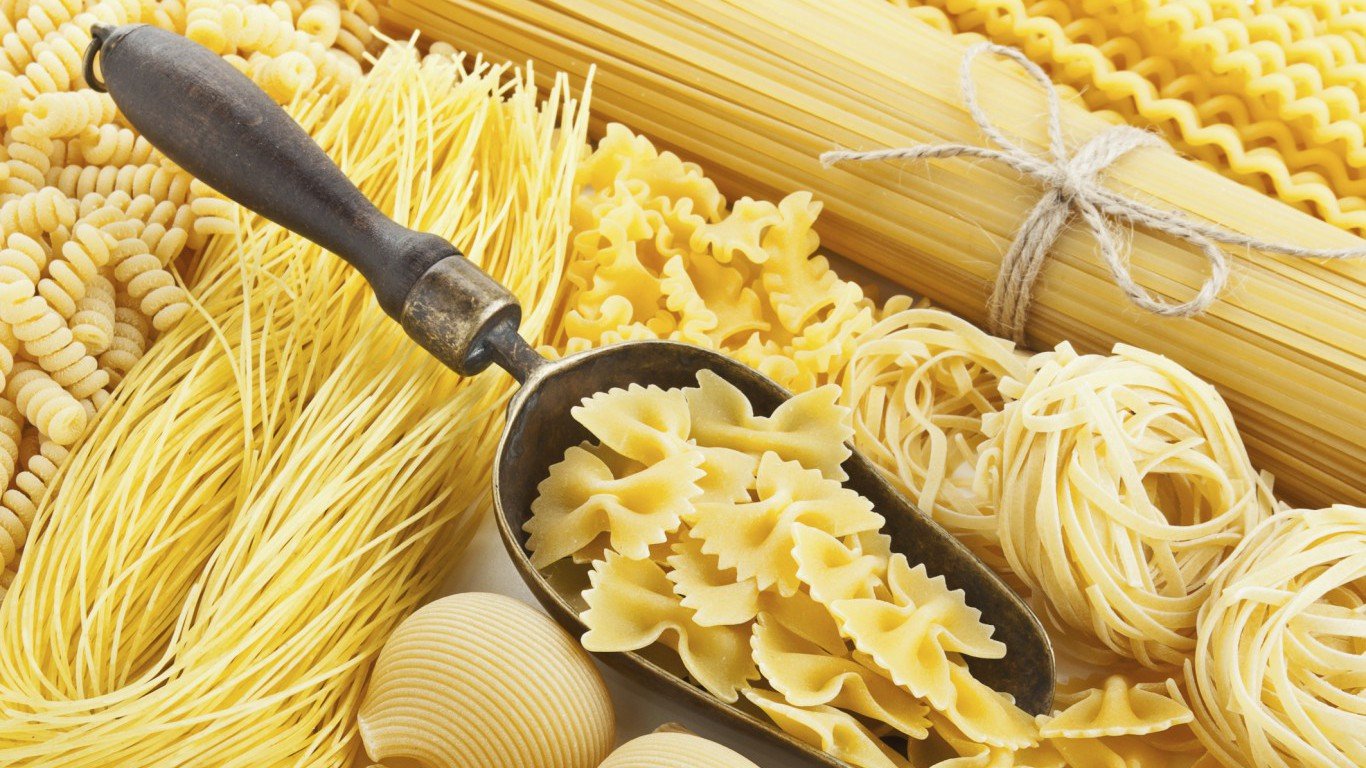
6. Rice, pasta, cornmeal
> Price increase: 40.3%
For those watching both their weight and their wallet, now may be the perfect time to start a low-carb diet. The price of rice, pasta, and cornmeal in the United States rose by more than 40% between 2006 and 2016, a larger increase than the 22% inflation rate for all items over the past decade. While the price increase has likely impacted American consumers, who consume an average of 19.4 pounds of pasta annually, the change may have been a larger drag for pasta lovers in Italy, where citizens consume 51.8 pounds of pasta per capita each year.

5. Prescription drugs
> Price increase: 43.5%
While demand of a product often fluctuates according to its price, demand of prescription drugs is far more stable. Despite heavy competition, in recent years pharmaceutical companies have raised the prices of a number of widely used prescription drugs. In 2016, Pfizer, the nation’s largest drug manufacturer, raised the price of approximately 130 of its products by 10% or more. Since 2011, four of the top 10 prescription drugs in the U.S. have more than doubled in price. Such price hikes are just a few of the many examples of major drug manufacturers increasing the cost of life-saving treatments, despite harsh criticism from Congress and the public. The price of prescription drugs rose by more than 40% between 2006 and 2016, and now accounts for nearly in every five dollars spent on health care.
[in-text-ad]

4. Shelf stable fish and seafood
> Price increase: 45.0%
The U.S. aquaculture industry largely consists of catfish, trout, salmon, tilapia, hybrid striped bass, sturgeon, walleye, and yellow perch. Most seafood available for consumption in the United States is imported and consists of shrimp, salmon, and canned tuna. The increase in the price of seafood likely stems from rising demand for fish worldwide, particularly in China. The increased demand has been an economic boon for major seafood-producing countries. Norway, for example, which accounts for roughly half of the world’s salmon, exported a record-high amount of seafood in 2015.
[recirclink id=377173]
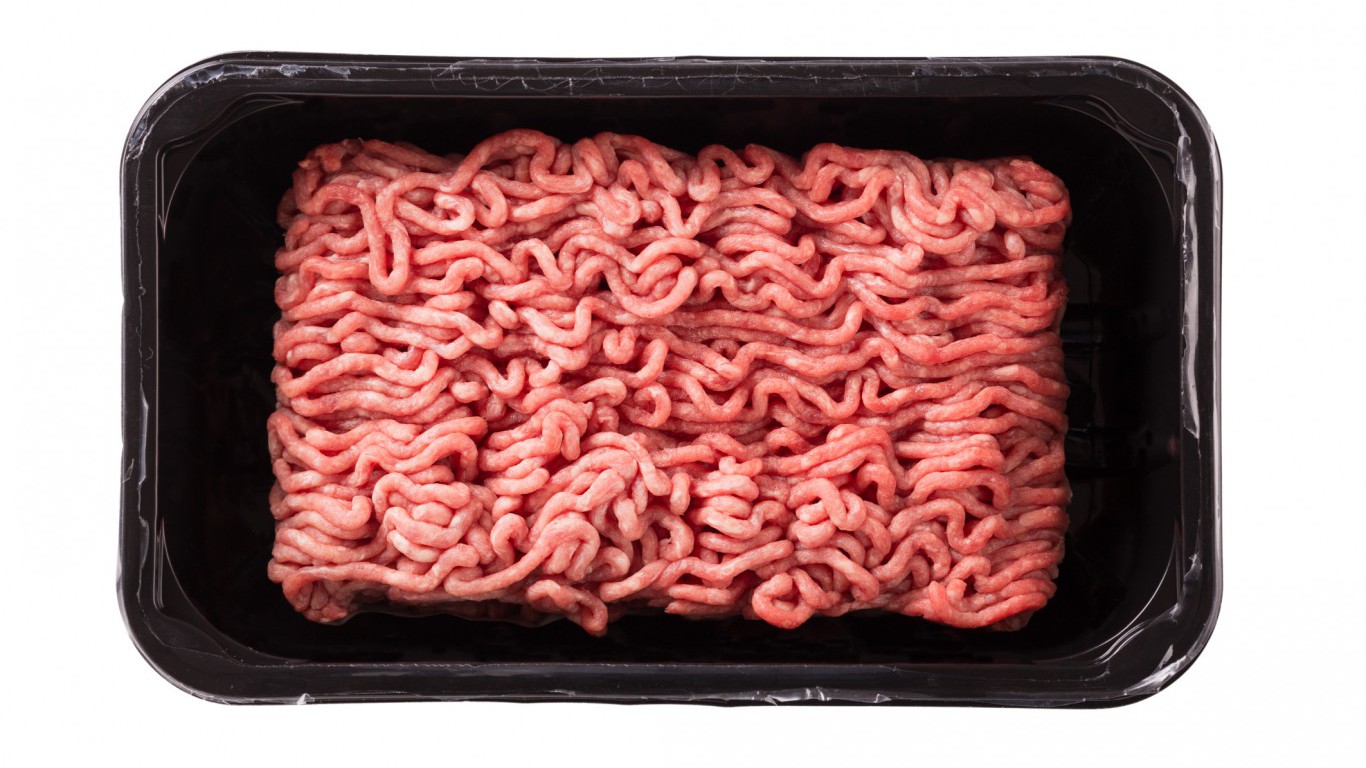
3. Uncooked ground beef
> Price increase: 46.3%
The price of uncooked ground beef increased by 46.3% over the past decade, more than nearly any other food item. Other cow products, such as uncooked beef steaks, have also increased in price faster than most grocery items. The spike in the price was largely the result of a beef supply shortage. Years of drought in the top cattle-producing regions of the country, followed by rising feed and energy prices, led to reduced cattle inventories. As the total number of cattle and calves on U.S. farms fell by roughly 6 million head between 2005 to 2015, the average retail price of Choice beef increased from $4.09 a pound to a record-high $6.29 per pound. High retail prices have led to reduced beef consumption in the United States. Americans consumed roughly 3 billion pounds less beef in 2015 compared to 2005.
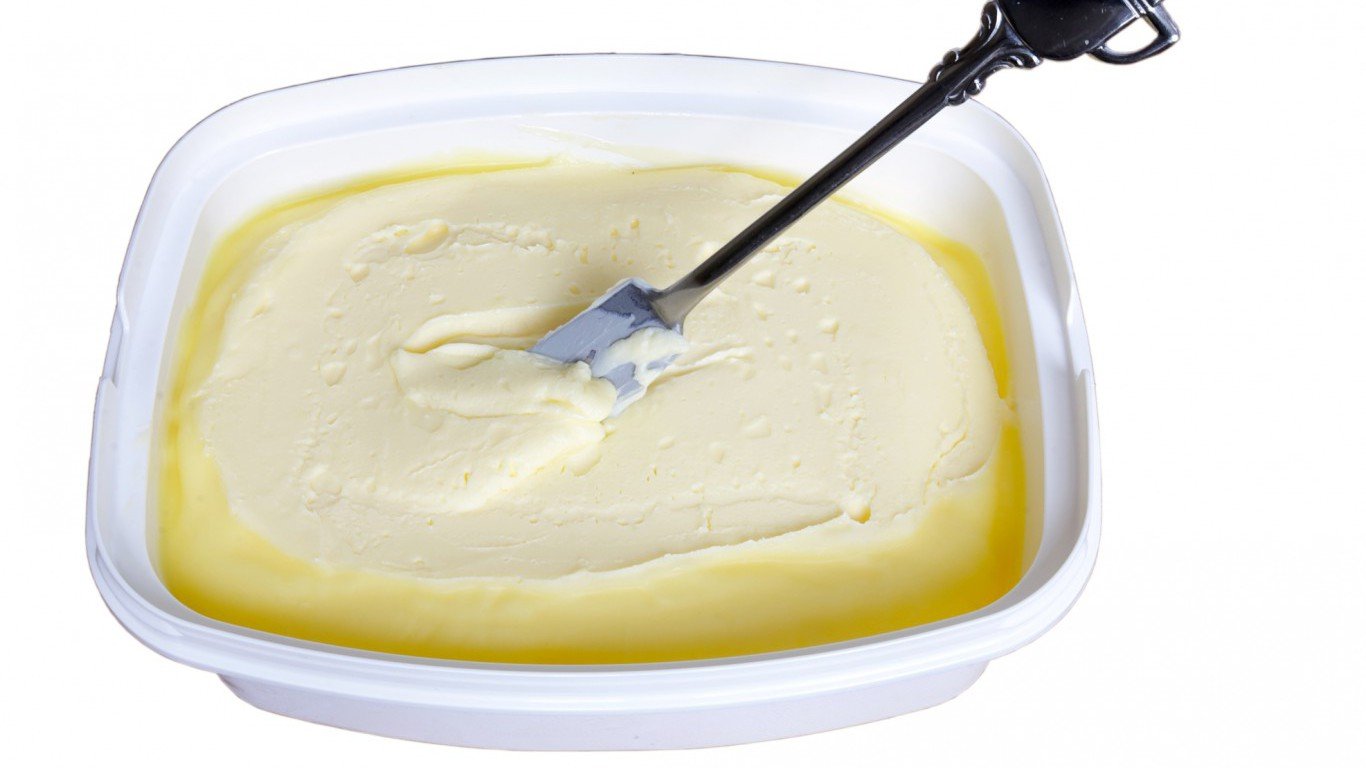
2. Margarine
> Price increase: 63.6%
The price of margarine increased by 63.6% between 2006 and 2016, the second largest price hike of any grocery product. Consumers often substitute margarine with butter, and therefore the demand for one may affect the price of the other. While shortages and rationing of butter in World War II led Americans to consume more margarine than butter per capita by the mid-1950s, by 2010 butter had surpassed margarine as the most consumed spread in the United States. The rising demand for butter is likely in part due to new research which has reduced the negative perception of saturated fats, previously thought to be less healthy than the trans fats found in margarine. Rising margarine prices may also have helped butter’s rise in popularity. While the price of margarine rose by more than double the 27.8% average increase across all foods over the past decade, the price of butter rose by just 21.4%.
[in-text-ad-2]

1. Tobacco and smoking products
> Price increase: 90.4%
The price of cigarettes rose by 90.4% over the past decade, more than four times the average price increase of all goods over the same period. The largest hike occurred in 2009, when Congress and President Obama increased the federal cigarette tax from 39 cents to $1.01 per pack. The price increase has likely led to a decline in tobacco sales and overall smoking behavior. Over the past decade, the U.S. adult smoking rate has fallen from 20.9% to 16.8%. The youth smoking rate fell even further, declining from 23.0% of all high school students in 2005 to 10.8% in 2015 — the lowest level since the youth smoking rate was first measured in 1991.
Contact [email protected] for any questions or corrections.