Special Report
States Where the Middle Class Is Being Left Behind
Published:
Last Updated:
While certain measures of the economy as a whole indicate healthy growth, a closer look reveals a picture of growing income inequality and a shrinking middle class. Over the last 10 years, the median income of the wealthiest fifth of U.S. households increased at 1.5 times the income growth rate of the middle fifth of households and 2.7 times the rate of increase for the bottom fifth of households.
Partially as a result, income earned by the upper quintile of households increased from 50.3% of all U.S. income in 2007 to 51.6% in 2016. Over the same period, the earnings of middle class households fell from 14.7% of all income to 14.3%. In some states, the disparities in income growth among the classes have been far greater, and the declines in the share of middle class income much larger.
To determine the states where the middle class is disappearing, 24/7 Wall St. reviewed the decline in the share of aggregate household income earned by the middle quintile of households in all 50 states from 2007 to 2016 with data from the U.S. Census Bureau’s American Community Survey. There are 10 states with a decline of 0.54 percentage points or greater.
Click here to see the full list of states where the middle class is disappearing.
Click here to see our detailed findings and methodology.
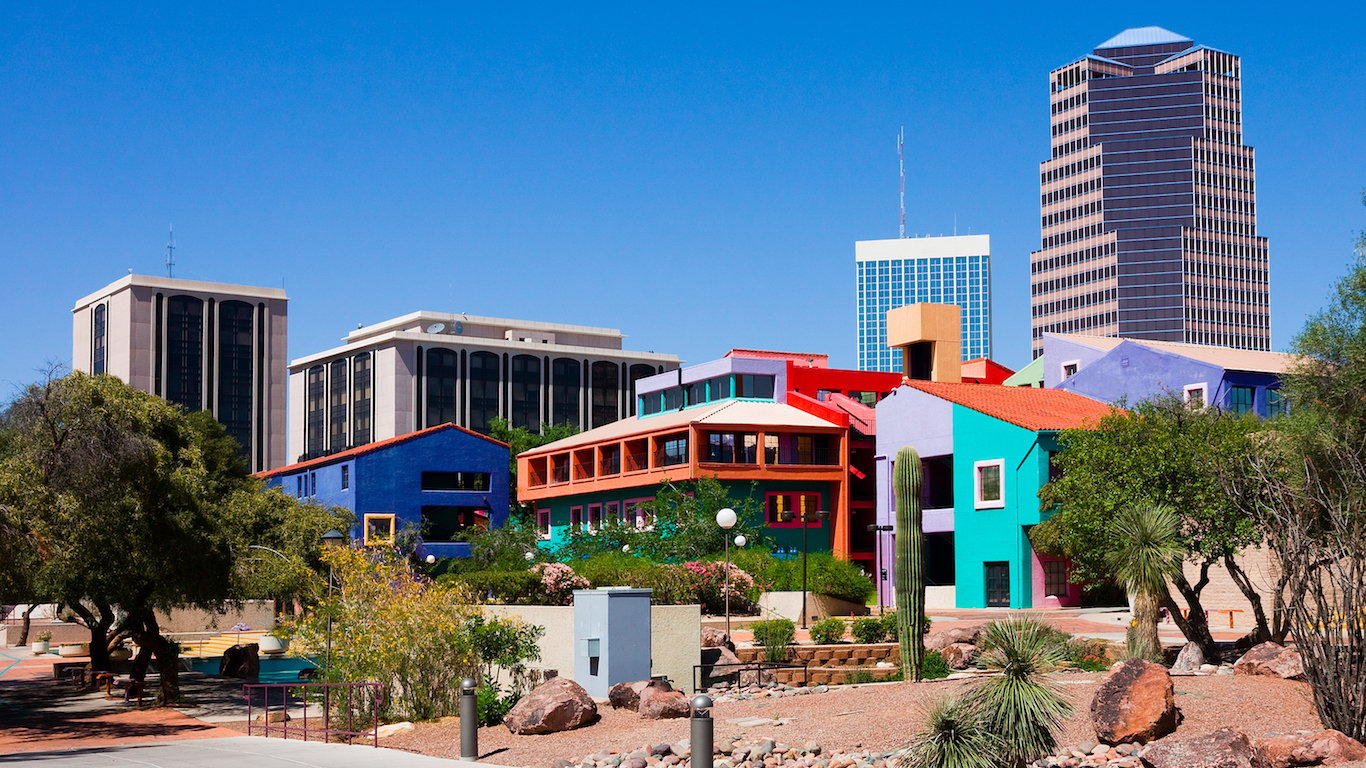
10. Arizona
> 10-yr. chg. in middle class income share: -0.5 ppts.
> Middle class share of income: 15.1% (2007), 14.6% (2016)
> Upper class share of income: 48.7% (2007), 50.6% (2016)
> Lower class share of income: 3.8% (2007), 3.2% (2016)
Income growth among the country’s top earners in the last 10 years has far outpaced income growth among the middle and lower class. The uneven income growth has resulted in a smaller middle class and greater income inequality overall. In Arizona, the income generated by the middle quintile of households fell from 15.1% of all income in the state in 2007 to 14.6% in 2016, one of the larger declines of any state.
Over that time, the income generated by the wealthiest quintile rose from 48.7% of all income to 50.6%, one of the larger increases in the country. The median household income of the wealthiest fifth of households rose 16.4%, more than twice the 8.1% income growth among the middle fifth of earners. The median household income among the poorest quintile of households actually decreased 3.7% in Arizona, one of only four states in which the poorest fifth of earners became even poorer in the past decade.
[in-text-ad]
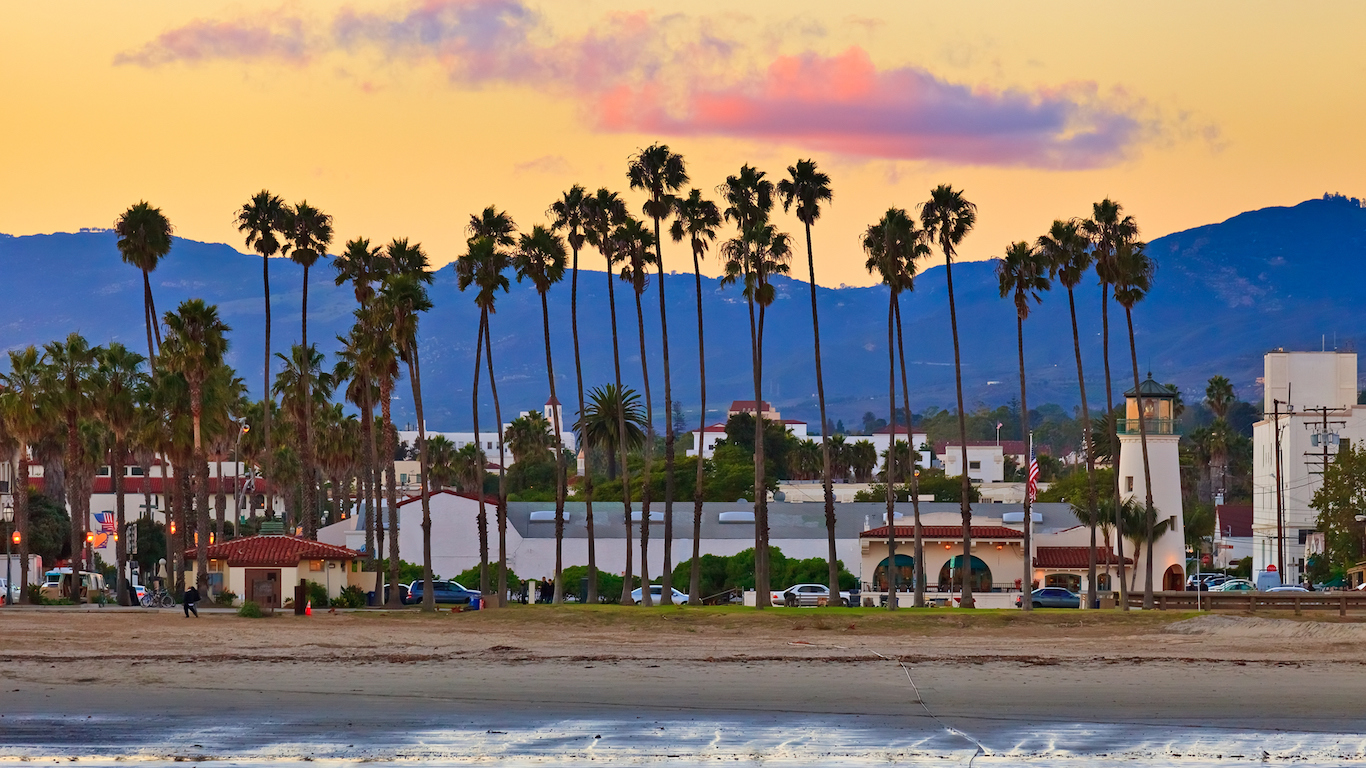
9. California
> 10-yr. chg. in middle class income share: -0.5 ppts.
> Middle class share of income: 14.6% (2007), 14.1% (2016)
> Upper class share of income: 50.5% (2007), 52.2% (2016)
> Lower class share of income: 3.4% (2007), 3.0% (2016)
Incomes among the wealthiest fifth of California households increased by 22.4% in the last 10 years, nearly eight times the 2.9% income growth among the poorest fifth of households in the state and far more than the 14.0% income growth among the middle quintile. The rapid growth of upper-class incomes relative to the lowest and middle quintiles of earners in California has contributed to the shrinking of the state’s middle class. The income generated by the middle quintile of earners as a share of all earnings in the state fell from 14.6% in 2007 to 14.1% in 2016, one of the larger declines of any state.
The rapid income growth of California’s upper class relative to the rest of the state may have partially contributed to the overall rise in housing costs throughout the state. Many more middle class households in the state pay more in housing costs today than they did 10 years ago. The share of households earning between $35,000 and $75,000 a year that pay more than a third of their income on housing in California rose from 49.2% in 2007 to 52.5% in 2016, one of the largest increases of any state.
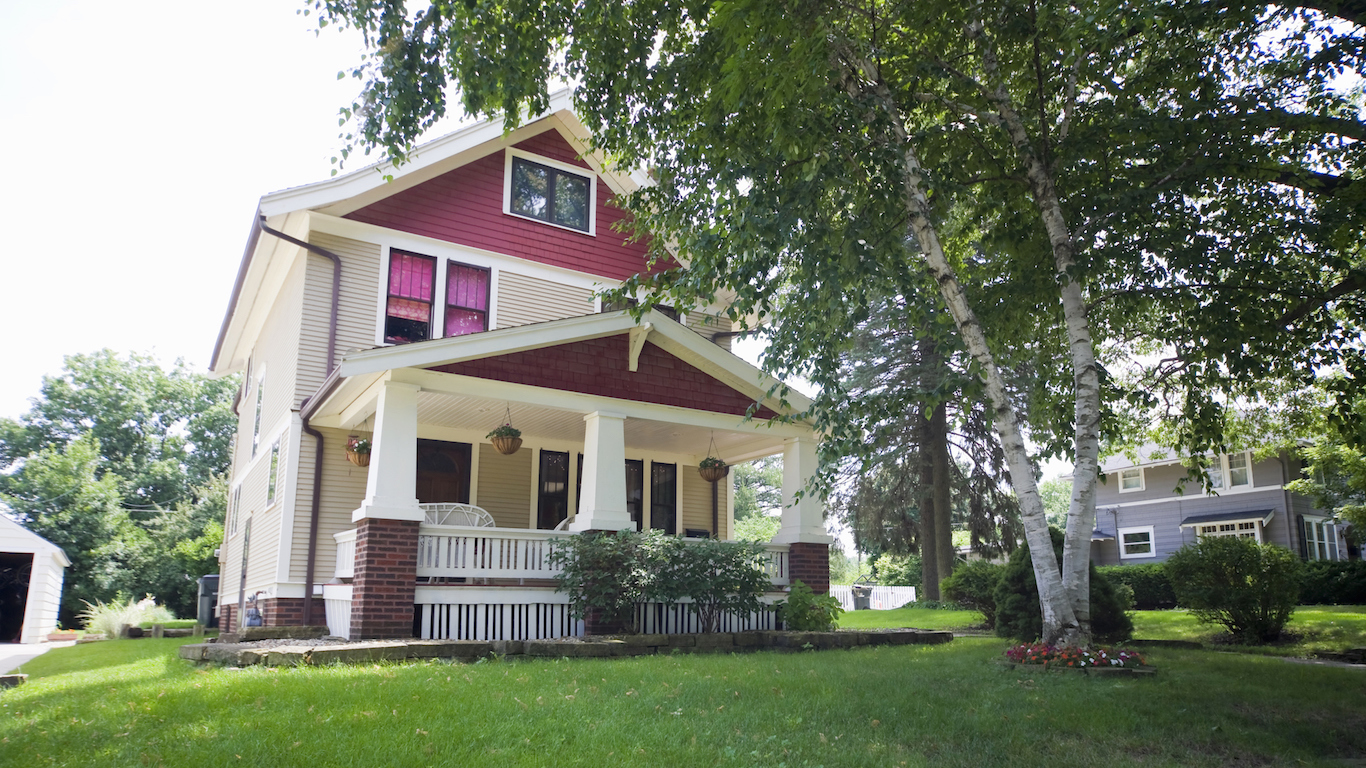
8. Iowa
> 10-yr. chg. in middle class income share: -0.6 ppts.
> Middle class share of income: 15.9% (2007), 15.3% (2016)
> Upper class share of income: 46.6% (2007), 48.2% (2016)
> Lower class share of income: 4.1% (2007), 3.8% (2016)
The median income of Iowa’s wealthiest fifth of households increased by 28.3% over the past 10 years, while the income of the middle fifth of earners rose by 19.2 — one of the largest differentials in the country. The income earned by middle class households as a share of all income in the state fell from 15.9% in 2007 to 15.3% in 2016, one of the largest declines of any state. Meanwhile, earnings of the wealthiest 20% of households rose from 46.6% of total income to 48.2%, one of the larger increases in the country. Income growth among Iowa’s upper class also far outpaced that of the lower class.
Rapid income growth among Iowa’s wealthiest residents likely contributed to the rising cost of housing in the state over the past decade — at the expense of Iowa’s poorer residents. The cost of the typical household in Iowa rose more than three times as fast as the country as a whole in the last 10 years, and the share of households earning less than $35,000 a year in Iowa who spend at least 30% of their incomes on housing costs rose from 54.3% in 2007 to 62.9% in 2016 — the fifth largest increase of any state.

7. Rhode Island
> 10-yr. chg. in middle class income share: -0.6 ppts.
> Middle class share of income: 15.4% (2007), 14.8% (2016)
> Upper class share of income: 48.7% (2007), 50.5% (2016)
> Lower class share of income: 3.2% (2007), 2.9% (2016)
Rapid income growth over the past 10 years among the wealthiest residents in the United States has far outpaced that of the poorest Americans, leading to worsening income inequality and shrinking the middle class. In Rhode Island, the share of income generated by the middle quintile of households fell from 15.4% of all income in 2007 to 14.8% in 2016, one of the largest declines of any state. The share of income earned by the wealthiest quintile, meanwhile, rose from 48.7% of all income to 50.5%, one of the largest increases. The median household income among the richest quintile rose 20.0% over that period, nearly twice the 11.3% income growth experienced by the middle class of earners — one of the largest differentials of any state.
One factor contributing to the relatively slow growth of middle class incomes in Rhode Island may be the decline of the state’s manufacturing industry. Employment in the manufacturing industry fell 20.3% from 2007 to 2016, the sixth largest decline of any state.
[in-text-ad]

6. Ohio
> 10-yr. chg. in middle class income share: -0.6 ppts.
> Middle class share of income: 15.4% (2007), 14.8% (2016)
> Upper class share of income: 48.4% (2007), 50.2% (2016)
> Lower class share of income: 3.5% (2007), 3.3% (2016)
The share of income earned by the middle quintile of earners in Ohio fell from 15.4% in 2007 to 14.8% in 2016, one of the largest declines of any state. The shrinking of the middle class in Ohio was largely due to the rapid income growth among the state’s top earners. The median income of the wealthiest fifth of households rose by 21.7% from 2007 to 2016, far more than the 12.6% income growth among the middle quintile of earners and the 8.4% growth among the bottom fifth of households.
While the affordability of housing often declines in tandem with increases in income inequality and upper class income growth, the cost of real estate in Ohio is relatively close to what it was 10 years ago. The value of the typical home has risen only 1.7% from $137,800 in 2007 to $140,100 in 2016, less than one-third the national increase in home value and now the eighth lowest median home value of any state. The share of households earning between $35,000 and $75,000 a year that spend at least 30% of their income on housing in Ohio actually fell from 20.7% in 2007 to 15.5% in 2016, one of the largest declines in the country.

5. Indiana
> 10-yr. chg. in middle class income share: -0.7 ppts.
> Middle class share of income: 15.8% (2007), 15.1% (2016)
> Upper class share of income: 46.8% (2007), 48.9% (2016)
> Lower class share of income: 4.0% (2007), 3.6% (2016)
According to the Gini index, income inequality has increased more over the past 10 years in Indiana than in all but two other U.S. states. The median income of the wealthiest fifth of Indiana households rose 20.9% from 2007 to 2016, nearly twice the income growth among the middle quintile of households and almost four times the income growth among the poorest fifth of households — each among the largest differentials of any state. The share of all income earned in the state by the middle class fell from 15.8% in 2007 to 15.1% in 2016, the fifth largest decline in the country.
The relatively slow growth of middle class incomes in Indiana may be partially due to the decline of certain blue collar industries in the state. While 17.0% of all jobs in the state are still in manufacturing — the largest share in the country — the number of jobs in the industry fell 4.8% over the last 10 years, one of the larger declines of any state.
4. Michigan
> 10-yr. chg. in middle class income share: -0.7 ppts.
> Middle class share of income: 15.3% (2007), 14.6% (2016)
> Upper class share of income: 48.4% (2007), 50.4% (2016)
> Lower class share of income: 3.6% (2007), 3.3% (2016)
The median income of the wealthiest quintile of households in Michigan rose 20.2% over the last 10 years, far more than the median income growth among middle class households of 10.3% and nearly three times the income growth in the poorest quintile of 7.5%. The disparity in income growth has led to increased income inequality in Michigan and a decline in the size of the middle class. The share of income earned by the middle quintile of households fell from 15.3% in 2007 to 14.6% in 2016, nearly the largest percentage-point decline of any state.
While in other states where top earners’ income grew far faster than middle and lower classes incomes the cost of housing also increased at a relatively rapid rate, housing in Michigan has largely become more affordable over the past 10 years. The value of the typical home fell from $153,100 in 2007 to $147,100 in 2016 in Michigan — one of only 13 states where home values are lower today than they were 10 years ago. The share of households earning between $35,000 and $75,000 a year that spend at least 30% of their income on housing actually fell from 26.3% to 16.5%, the largest percentage-point decline of any state other than Nevada.

3. Wisconsin
> 10-yr. chg. in middle class income share: -0.7 ppts.
> Middle class share of income: 15.9% (2007), 15.2% (2016)
> Upper class share of income: 46.8% (2007), 48.7% (2016)
> Lower class share of income: 4.1% (2007), 3.7% (2016)
The median income of the wealthiest fifth of households in Wisconsin rose by 22.5% over the last 10 years. During that time, incomes of the middle class increased by just 13.1%, and incomes of the fifth poorest households grew by a mere 7.7%. These are some of the largest class disparities in income growth of any state, and contributed to the shrinking of Wisconsin’s middle class over that time. The share of income in the state earned by the middle class fell from 15.9% in 2007 to 15.2% in 2016, the third largest percentage-point decline in the country.
The relatively slow growth of middle class incomes may be partially due to the decline of certain blue collar industries. While 15.9% of the state’s workforce is employed in the manufacturing industry today — the second largest share of any state — the number of jobs in the industry fell 7.2% over the past decade, one of the larger declines in the country.
[in-text-ad]
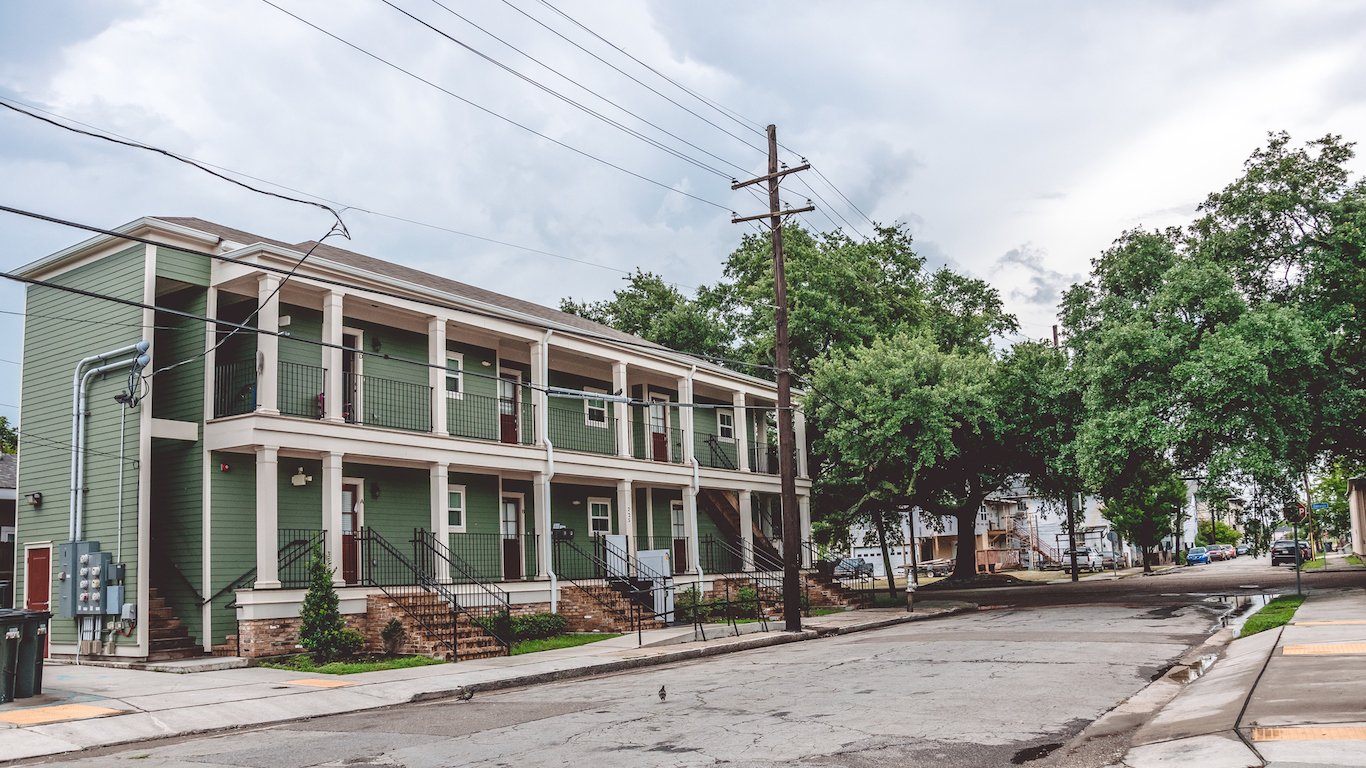
2. Louisiana
> 10-yr. chg. in middle class income share: -0.7 ppts.
> Middle class share of income: 14.5% (2007), 13.8% (2016)
> Upper class share of income: 50.7% (2007), 52.8% (2016)
> Lower class share of income: 3.0% (2007), 2.8% (2016)
The distribution of wealth in Louisiana, already among the worst of any state, became even more uneven in the last decade. The share of income earned by the middle quintile of earners in the state fell from 14.5% in 2007 — the sixth smallest share in the country — to 13.8% in 2016, now the second smallest share and second largest decline of any state. The median income of the wealthiest fifth of households increased 20.5% over the last decade, nearly twice the 10.3% increase among the middle class — the third largest difference of any state. The relatively slow growth in middle quintile incomes may have been partially due to the state’s declining oil industry, which supports a large number of middle class households. Employment in mining and logging fell 27.4% over the last 10 years, one of the largest contractions of any state.
The rapid growth of upper class incomes has likely contributed to the increase in the cost of real estate in Louisiana, and at the expense of the middle class. The share of households earning between $35,000 and $75,000 a year that pay at least 30% of their income on housing rose from 15.7% in 2007 to 18.4% in 2016, one of the largest increases of any state.
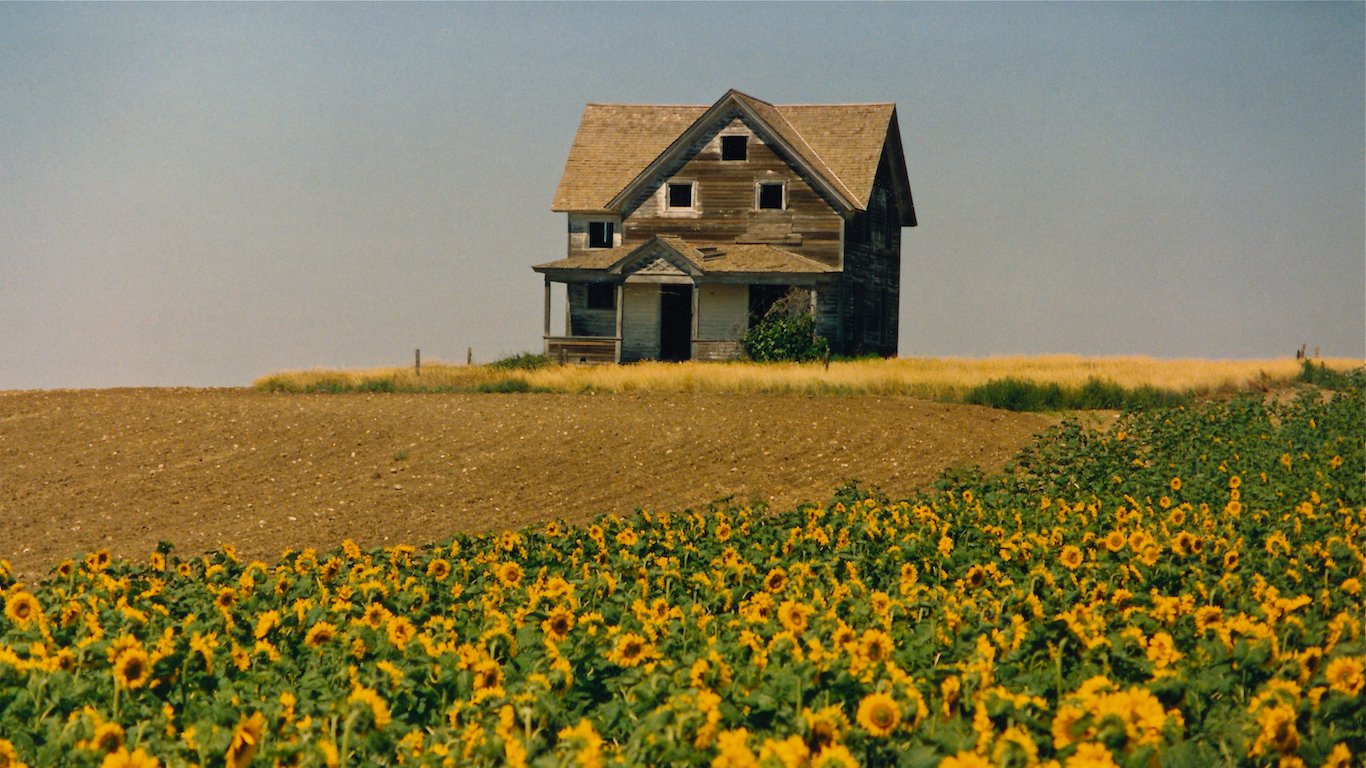
1. Montana
> 10-yr. chg. in middle class income share: -1.0 ppts.
> Middle class share of income: 15.5% (2007), 14.5% (2016)
> Upper class share of income: 48.0% (2007), 50.4% (2016)
> Lower class share of income: 3.8% (2007), 3.6% (2016)
The income generated by the middle fifth of households in Montana fell from 15.5% of all income in 2007 — one of the larger shares in the country — to just 14.5% in 2016, now one of the smaller shares and the largest decline of any state. Like the nation as a whole, the shrinking of the middle class is likely due to the rapid income growth among the upper class. The median income of the top fifth of households rose by 29.6% from 2007 to 2016, nearly twice the 15.2% income growth experienced by the middle class — nearly the largest differential of any state.
The rapid growth of upper class incomes has likely increased the cost of real estate throughout the state and made housing less affordable for many members of the middle class. The cost of the typical home in Montana rose 27.8% over the past decade, the sixth most of any state. The share of households earning between $35,000 and $75,000 a year that spend more than 30% of their income on housing costs rose from 17.0% in 2007 to 21.9% in 2016 — the fourth largest increase in the country.
Detailed Findings & Methodology
One factor that may contribute to the disparity in income growth is the decline of major blue collar industries in the Rust Belt and surrounding areas. In five of the 10 states with the largest declines in the share of income generated by the middle class, manufacturing accounts for a larger share of employment than the 8.6% national share. The four states with the largest manufacturing sectors in the country — Indiana, Wisconsin, Michigan, and Iowa — rank fifth, third, fourth, and eighth on this list. Over the last 10 years, employment in the U.S. manufacturing industry fell 11.0%, nearly the largest decline of any major sector.
In many of the states where upper class income growth is outpacing that of the middle class, there also has been an increase in home values, often at the expense of the lower classes. The general rule of thumb in real estate budgeting — that a household spend less than 30% of its income on housing — has become easier to follow for the wealthiest Americans over the last decade, and more difficult for poorer households. Nationwide, the share of households earning between $35,000 and $75,000 — approximately the middle income bracket — that spend at least 30% of their incomes on housing rose from 70.7% in 2007 to 71.6% in 2016.
Meanwhile, the share of households earning more than $75,000 annually that spend 30% or more of their income on housing was nearly halved, falling from 12.1% in 2007 to 6.7% in 2016. In six of the 10 states on this list, the percentage-point increase in the share of middle class households that spend 30% or more of their income on housing is at least three times the national figure.
To determine the states where the middle class is disappearing, 24/7 Wall St. reviewed the percentage-point decline in the share of aggregate household income earned by the middle quintile of households in all 50 states from 2007 to 2016 with data from the U.S. Census Bureau’s American Community Survey. We defined the middle class as the third income quintile, or the middle 20% of households. Because ACS income data reflects pre-tax levels, they may overstate the degree of income inequality in the poorer quintiles. However, it is unlikely that the tax burden of the third quintile is significant enough to skew the data.
Data on median home value, median income by quintile, the share of households that spend at least 30% of their income on housing, and the Gini index also came from the ACS. Data on employment by industry came from the Bureau of Labor Statistics. All data are for the most recent period available.
A financial advisor can help you understand the advantages and disadvantages of investment properties. Finding a qualified financial advisor doesn’t have to be hard. SmartAsset’s free tool matches you with up to three financial advisors who serve your area, and you can interview your advisor matches at no cost to decide which one is right for you. If you’re ready to find an advisor who can help you achieve your financial goals, get started now.
Investing in real estate can diversify your portfolio. But expanding your horizons may add additional costs. If you’re an investor looking to minimize expenses, consider checking out online brokerages. They often offer low investment fees, helping you maximize your profit.
Thank you for reading! Have some feedback for us?
Contact the 24/7 Wall St. editorial team.


 24/7 Wall St.
 24/7 Wall St.