

On September 8, 2018, countries around the world will celebrate International Literacy Day. The event shines a spotlight on global literacy needs and focuses on the strategies and resources needed to spread literacy around the world.
While the event will primarily highlight literacy needs in developing countries, there is still much room for improvement in many parts of the United States. Reading proficiency and activity varies significantly from state to state and is affected by socioeconomic factors such as income, educational attainment, and the quality of public schools.
To identify the most and least literate states, 24/7 Wall St. compiled an index of several measures related to reading proficiency, access to reading materials, and library usage. These states are listed from the most literate to the least.
Click here to see the most and least literate states.
Click here to see our detailed findings and methodology.

1. Vermont
> Adults lacking basic prose literacy skills: 6.6% (4th lowest)
> Pct. adults with bachelor’s degree or higher: 36.4% (8th highest)
> Public libraries: 29.8 per 100,000 (the highest)
> Registered library users: 54.2% of pop. (23rd highest)
[in-text-ad]

2. New Hampshire
> Adults lacking basic prose literacy skills: 5.8% (the lowest)
> Pct. adults with bachelor’s degree or higher: 36.6% (7th highest)
> Public libraries: 17.5 per 100,000 (4th highest)
> Registered library users: 60.8% of pop. (7th highest)

3. Massachusetts
> Adults lacking basic prose literacy skills: 9.9% (22nd lowest)
> Pct. adults with bachelor’s degree or higher: 42.7% (the highest)
> Public libraries: 6.8 per 100,000 (18th highest)
> Registered library users: 48.7% of pop. (15th lowest)

4. Minnesota
> Adults lacking basic prose literacy skills: 6.0% (2nd lowest)
> Pct. adults with bachelor’s degree or higher: 34.8% (11th highest)
> Public libraries: 6.4 per 100,000 (22nd highest)
> Registered library users: 69.9% of pop. (2nd highest)
[in-text-ad-2]

5. Colorado
> Adults lacking basic prose literacy skills: 9.9% (23rd lowest)
> Pct. adults with bachelor’s degree or higher: 39.9% (2nd highest)
> Public libraries: 4.7 per 100,000 (16th lowest)
> Registered library users: 65.3% of pop. (5th highest)

6. Iowa
> Adults lacking basic prose literacy skills: 7.5% (10th lowest)
> Pct. adults with bachelor’s degree or higher: 28.4% (17th lowest)
> Public libraries: 18.1 per 100,000 (3rd highest)
> Registered library users: 65.6% of pop. (4th highest)
[in-text-ad]

7. Wyoming
> Adults lacking basic prose literacy skills: 8.9% (17th lowest)
> Pct. adults with bachelor’s degree or higher: 27.1% (11th lowest)
> Public libraries: 13.0 per 100,000 (8th highest)
> Registered library users: 61.8% of pop. (6th highest)

8. Connecticut
> Adults lacking basic prose literacy skills: 8.6% (15th lowest)
> Pct. adults with bachelor’s degree or higher: 38.6% (4th highest)
> Public libraries: 6.7 per 100,000 (19th highest)
> Registered library users: 44.9% of pop. (10th lowest)

9. Nebraska
> Adults lacking basic prose literacy skills: 7.3% (6th lowest)
> Pct. adults with bachelor’s degree or higher: 31.4% (19th highest)
> Public libraries: 13.8 per 100,000 (7th highest)
> Registered library users: 54.1% of pop. (24th highest)
[in-text-ad-2]

10. Maine
> Adults lacking basic prose literacy skills: 7.4% (8th lowest)
> Pct. adults with bachelor’s degree or higher: 30.1% (25th highest)
> Public libraries: 20.0 per 100,000 (2nd highest)
> Registered library users: 54.6% of pop. (20th highest)

11. Kansas
> Adults lacking basic prose literacy skills: 7.8% (11th lowest)
> Pct. adults with bachelor’s degree or higher: 32.8% (15th highest)
> Public libraries: 12.9 per 100,000 (9th highest)
> Registered library users: 59.1% of pop. (10th highest)
[in-text-ad]

12. Utah
> Adults lacking basic prose literacy skills: 9.4% (20th lowest)
> Pct. adults with bachelor’s degree or higher: 32.6% (17th highest)
> Public libraries: 4.2 per 100,000 (12th lowest)
> Registered library users: 59.5% of pop. (8th highest)
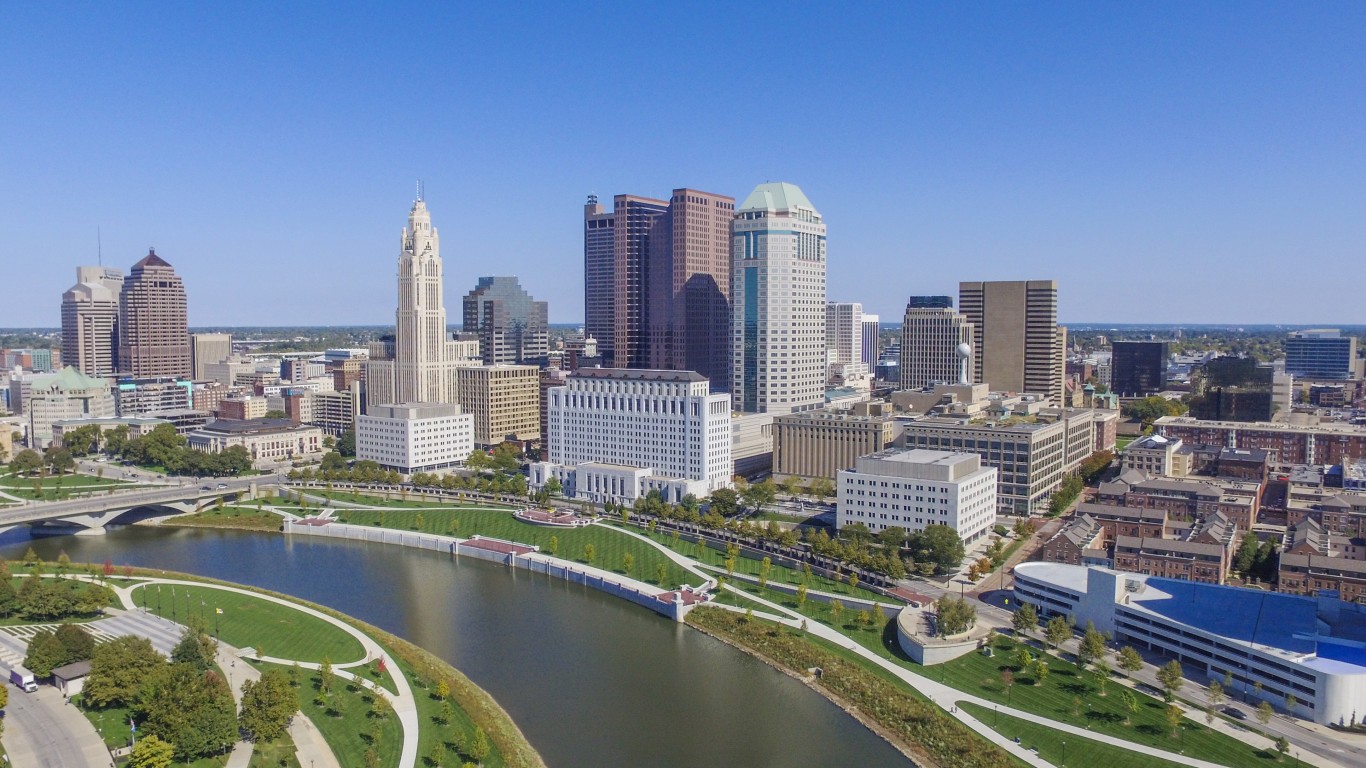
13. Ohio
> Adults lacking basic prose literacy skills: 9.1% (18th lowest)
> Pct. adults with bachelor’s degree or higher: 27.5% (14th lowest)
> Public libraries: 6.1 per 100,000 (24th highest)
> Registered library users: 75.1% of pop. (the highest)

14. Virginia
> Adults lacking basic prose literacy skills: 12.0% (23rd highest)
> Pct. adults with bachelor’s degree or higher: 38.1% (6th highest)
> Public libraries: 4.2 per 100,000 (13th lowest)
> Registered library users: 57.9% of pop. (12th highest)
[in-text-ad-2]

15. Washington
> Adults lacking basic prose literacy skills: 9.8% (21st lowest)
> Pct. adults with bachelor’s degree or higher: 35.1% (10th highest)
> Public libraries: 4.7 per 100,000 (17th lowest)
> Registered library users: 54.7% of pop. (19th highest)
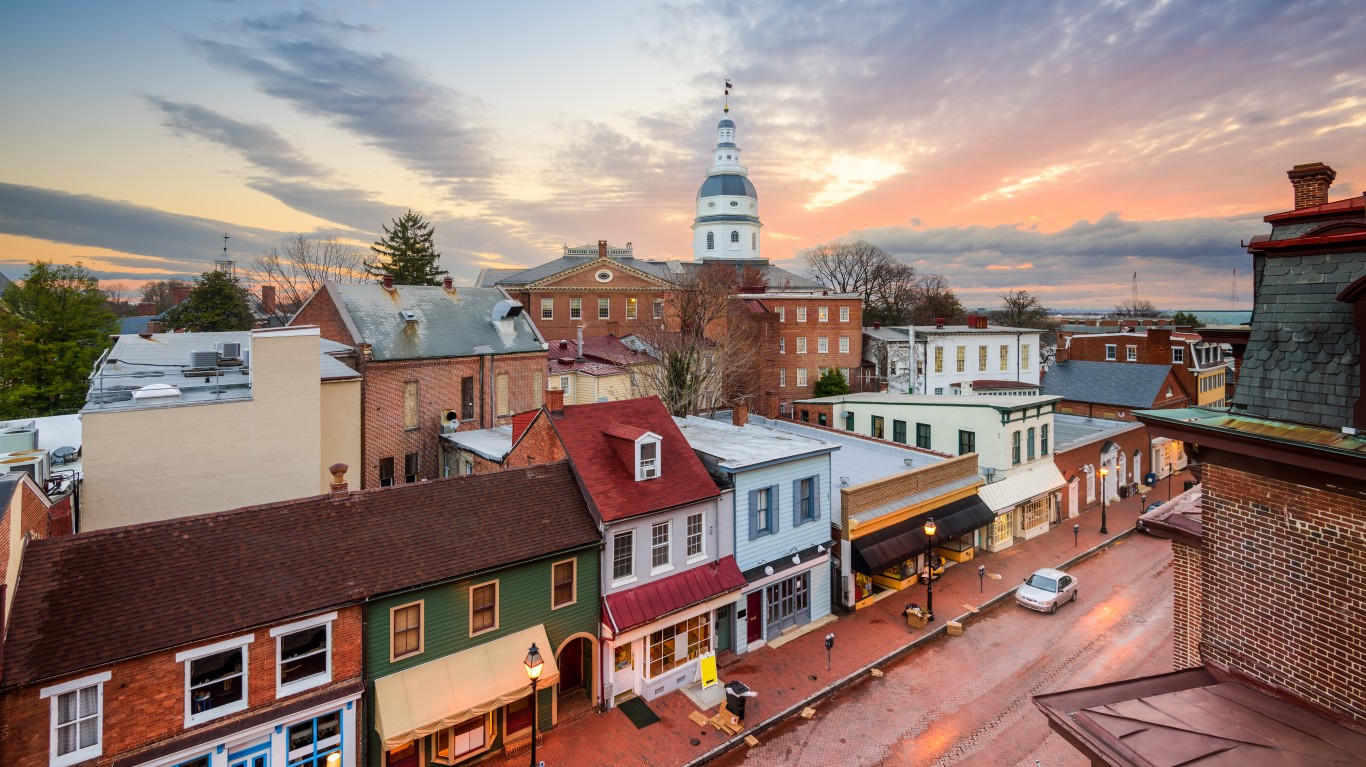
16. Maryland
> Adults lacking basic prose literacy skills: 11.2% (24th highest)
> Pct. adults with bachelor’s degree or higher: 39.3% (3rd highest)
> Public libraries: 3.2 per 100,000 (5th lowest)
> Registered library users: 57.5% of pop. (14th highest)
[in-text-ad]

17. Wisconsin
> Adults lacking basic prose literacy skills: 7.3% (7th lowest)
> Pct. adults with bachelor’s degree or higher: 29.5% (23rd lowest)
> Public libraries: 7.9 per 100,000 (14th highest)
> Registered library users: 57.9% of pop. (13th highest)

18. Oregon
> Adults lacking basic prose literacy skills: 10.2% (24th lowest)
> Pct. adults with bachelor’s degree or higher: 32.7% (16th highest)
> Public libraries: 5.6 per 100,000 (22nd lowest)
> Registered library users: 55.7% of pop. (17th highest)

19. Montana
> Adults lacking basic prose literacy skills: 8.8% (16th lowest)
> Pct. adults with bachelor’s degree or higher: 31.0% (20th highest)
> Public libraries: 11.2 per 100,000 (10th highest)
> Registered library users: 44.0% of pop. (8th lowest)
[in-text-ad-2]

20. Missouri
> Adults lacking basic prose literacy skills: 7.5% (9th lowest)
> Pct. adults with bachelor’s degree or higher: 28.5% (18th lowest)
> Public libraries: 5.9 per 100,000 (23rd lowest)
> Registered library users: 53.7% of pop. (25th highest)

21. Rhode Island
> Adults lacking basic prose literacy skills: 8.5% (14th lowest)
> Pct. adults with bachelor’s degree or higher: 34.1% (12th highest)
> Public libraries: 6.6 per 100,000 (20th highest)
> Registered library users: 42.2% of pop. (7th lowest)
[in-text-ad]

22. Indiana
> Adults lacking basic prose literacy skills: 8.0% (12th lowest)
> Pct. adults with bachelor’s degree or higher: 25.6% (9th lowest)
> Public libraries: 6.4 per 100,000 (23rd highest)
> Registered library users: 51.1% of pop. (21st lowest)

23. New Jersey
> Adults lacking basic prose literacy skills: 16.9% (5th highest)
> Pct. adults with bachelor’s degree or higher: 38.6% (5th highest)
> Public libraries: 4.9 per 100,000 (19th lowest)
> Registered library users: 47.2% of pop. (13th lowest)

24. Alaska
> Adults lacking basic prose literacy skills: 9.2% (19th lowest)
> Pct. adults with bachelor’s degree or higher: 29.6% (25th lowest)
> Public libraries: 14.0 per 100,000 (6th highest)
> Registered library users: 46.0% of pop. (11th lowest)
[in-text-ad-2]

25. South Dakota
> Adults lacking basic prose literacy skills: 7.0% (5th lowest)
> Pct. adults with bachelor’s degree or higher: 28.9% (20th lowest)
> Public libraries: 16.4 per 100,000 (5th highest)
> Registered library users: 42.2% of pop. (6th lowest)

26. Idaho
> Adults lacking basic prose literacy skills: 10.5% (25th lowest)
> Pct. adults with bachelor’s degree or higher: 27.6% (15th lowest)
> Public libraries: 8.7 per 100,000 (13th highest)
> Registered library users: 53.4% of pop. (25th lowest)
[in-text-ad]
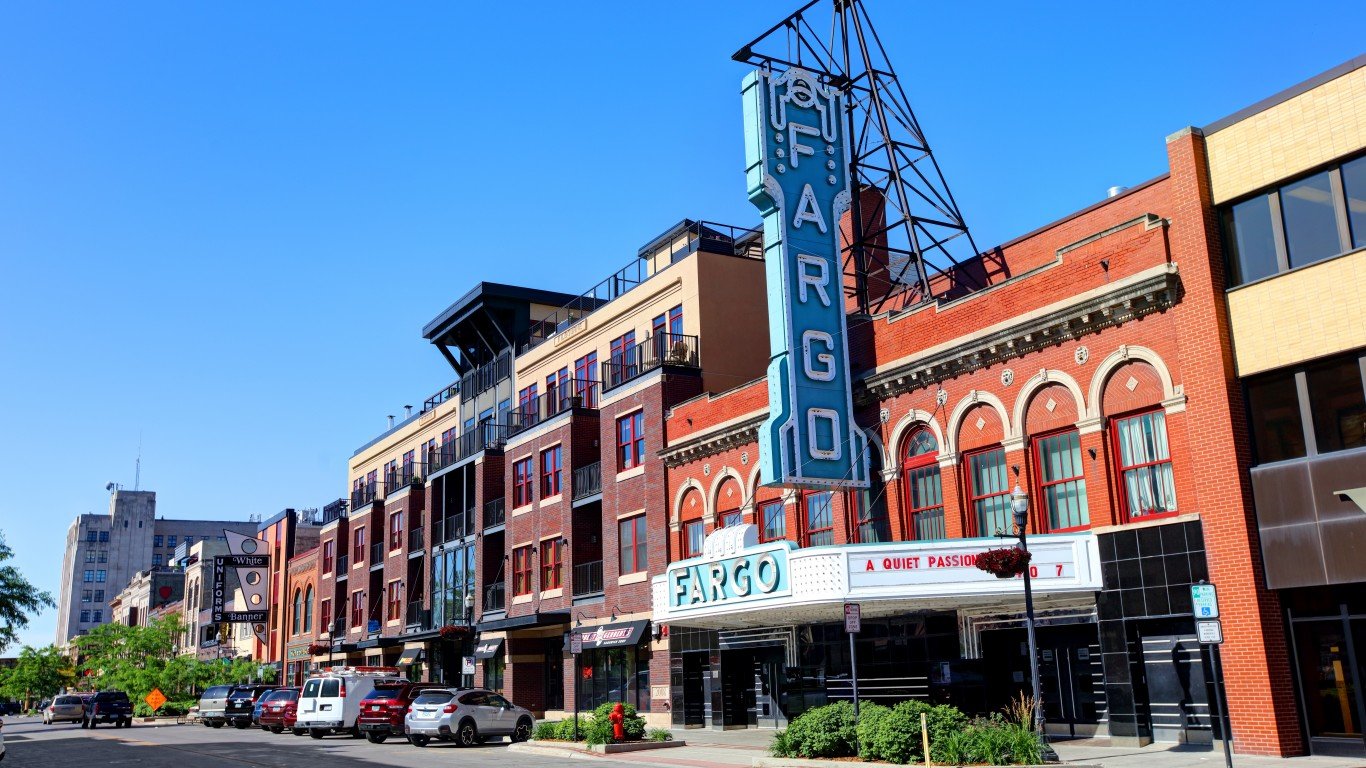
27. North Dakota
> Adults lacking basic prose literacy skills: 6.3% (3rd lowest)
> Pct. adults with bachelor’s degree or higher: 29.6% (24th lowest)
> Public libraries: 11.1 per 100,000 (11th highest)
> Registered library users: 35.9% of pop. (the lowest)

28. Kentucky
> Adults lacking basic prose literacy skills: 12.2% (22nd highest)
> Pct. adults with bachelor’s degree or higher: 23.4% (5th lowest)
> Public libraries: 4.6 per 100,000 (15th lowest)
> Registered library users: 59.3% of pop. (9th highest)

29. North Carolina
> Adults lacking basic prose literacy skills: 13.6% (15th highest)
> Pct. adults with bachelor’s degree or higher: 30.4% (24th highest)
> Public libraries: 3.8 per 100,000 (9th lowest)
> Registered library users: 54.2% of pop. (22nd highest)
[in-text-ad-2]
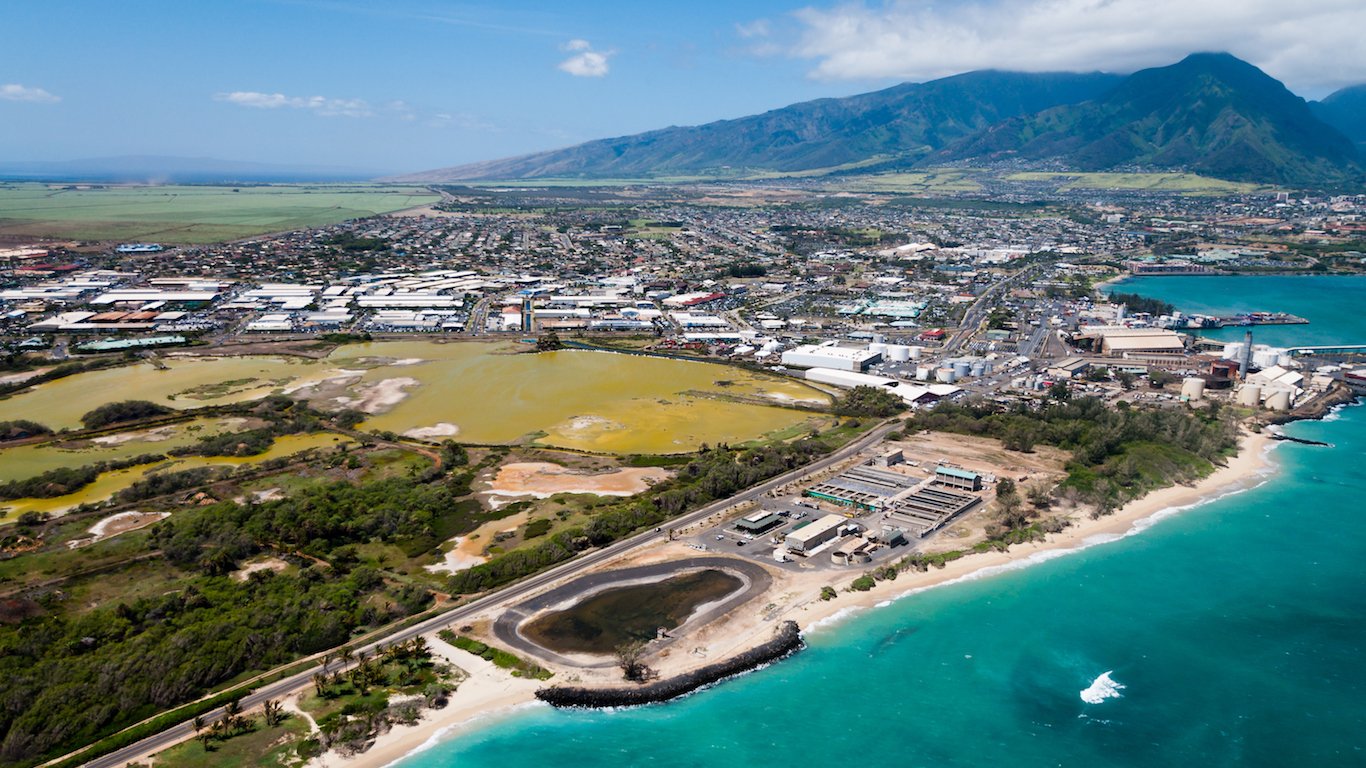
30. Hawaii
> Adults lacking basic prose literacy skills: 15.9% (11th highest)
> Pct. adults with bachelor’s degree or higher: 31.9% (18th highest)
> Public libraries: 3.5 per 100,000 (8th lowest)
> Registered library users: 69.9% of pop. (3rd highest)
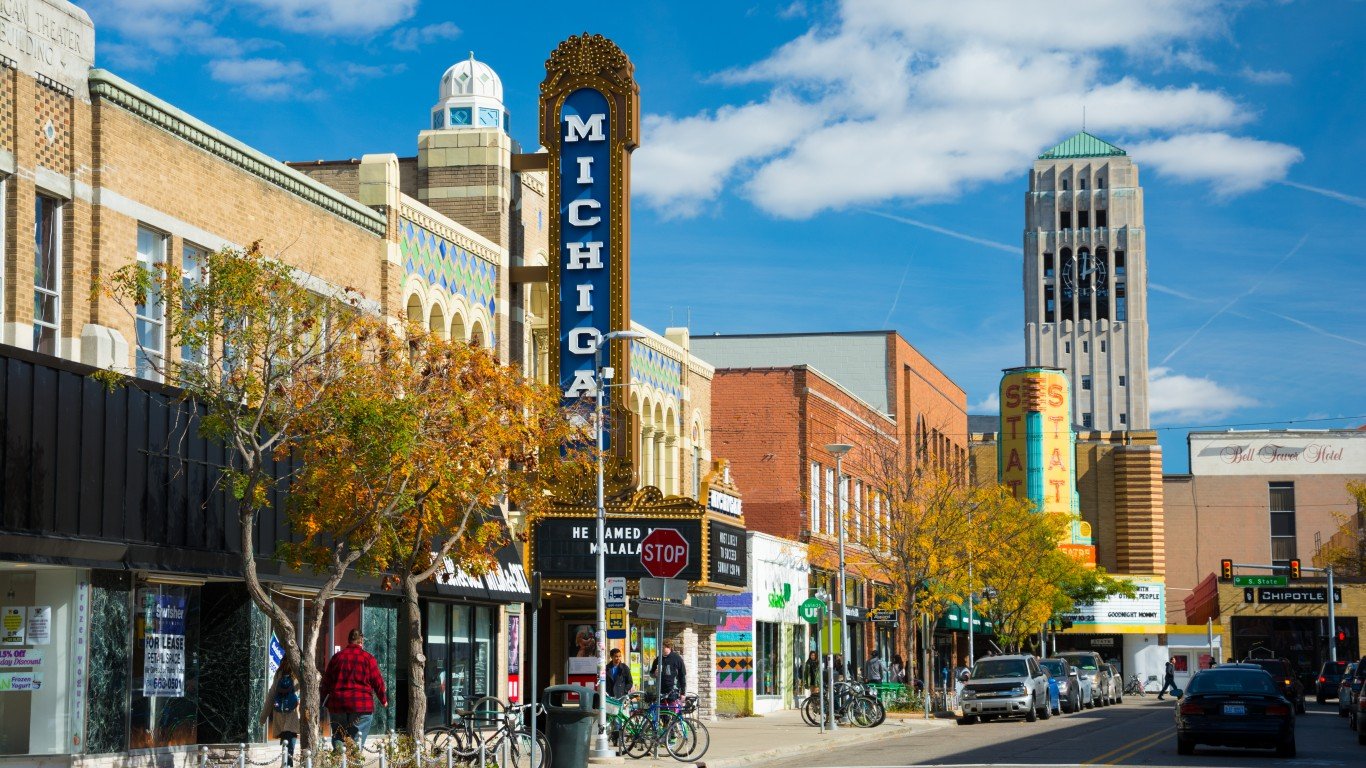
31. Michigan
> Adults lacking basic prose literacy skills: 8.3% (13th lowest)
> Pct. adults with bachelor’s degree or higher: 28.3% (16th lowest)
> Public libraries: 6.5 per 100,000 (21st highest)
> Registered library users: 49.8% of pop. (17th lowest)
[in-text-ad]

32. Pennsylvania
> Adults lacking basic prose literacy skills: 12.6% (20th highest)
> Pct. adults with bachelor’s degree or higher: 30.8% (22nd highest)
> Public libraries: 4.8 per 100,000 (18th lowest)
> Registered library users: 40.8% of pop. (4th lowest)

33. Delaware
> Adults lacking basic prose literacy skills: 10.7% (25th highest)
> Pct. adults with bachelor’s degree or higher: 31.0% (21st highest)
> Public libraries: 3.4 per 100,000 (7th lowest)
> Registered library users: 42.0% of pop. (5th lowest)

34. Illinois
> Adults lacking basic prose literacy skills: 12.9% (19th highest)
> Pct. adults with bachelor’s degree or higher: 34.0% (13th highest)
> Public libraries: 6.1 per 100,000 (25th highest)
> Registered library users: 40.6% of pop. (3rd lowest)
[in-text-ad-2]

35. New York
> Adults lacking basic prose literacy skills: 22.1% (2nd highest)
> Pct. adults with bachelor’s degree or higher: 35.7% (9th highest)
> Public libraries: 5.4 per 100,000 (20th lowest)
> Registered library users: 54.2% of pop. (21st highest)

36. Tennessee
> Adults lacking basic prose literacy skills: 13.2% (17th highest)
> Pct. adults with bachelor’s degree or higher: 26.1% (10th lowest)
> Public libraries: 4.3 per 100,000 (14th lowest)
> Registered library users: 50.5% of pop. (18th lowest)
[in-text-ad]

37. Arizona
> Adults lacking basic prose literacy skills: 13.1% (18th highest)
> Pct. adults with bachelor’s degree or higher: 28.9% (21st lowest)
> Public libraries: 3.2 per 100,000 (6th lowest)
> Registered library users: 46.4% of pop. (12th lowest)
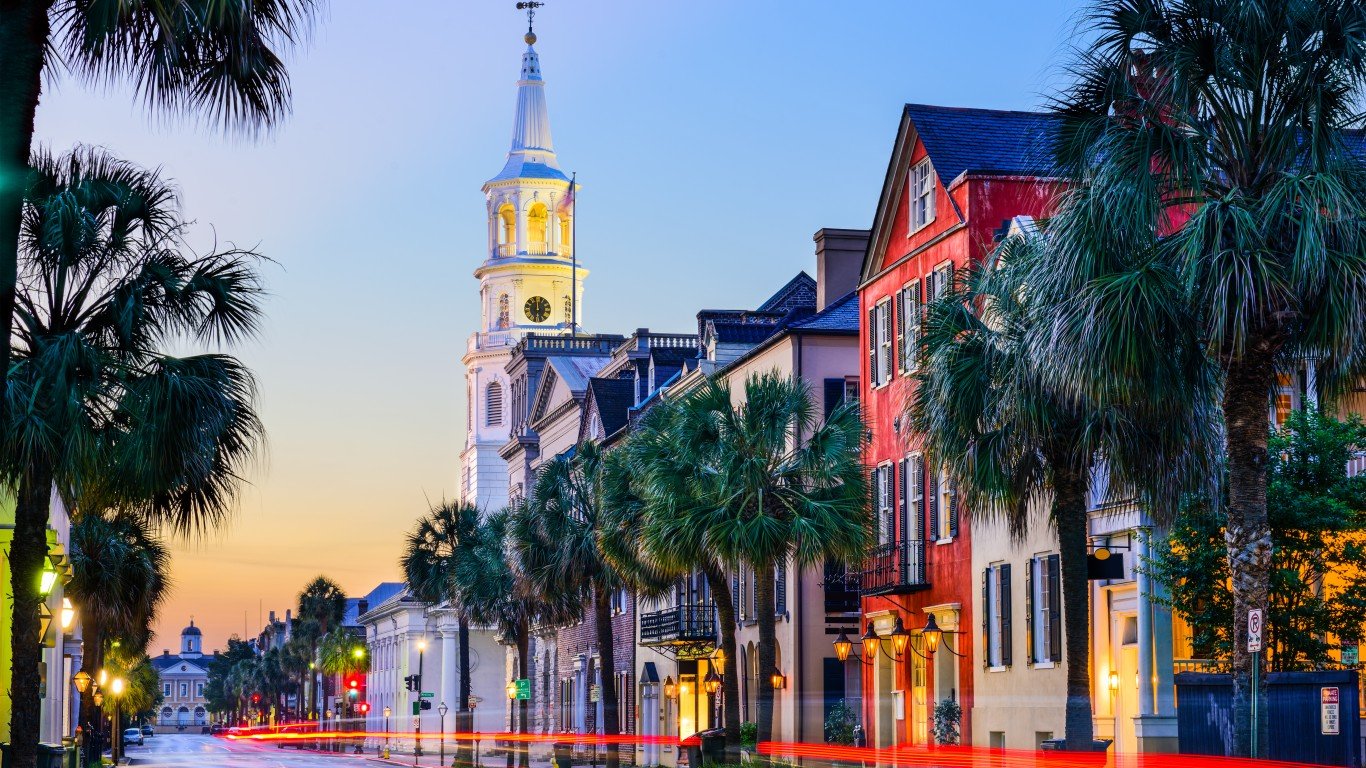
38. South Carolina
> Adults lacking basic prose literacy skills: 14.7% (13th highest)
> Pct. adults with bachelor’s degree or higher: 27.2% (13th lowest)
> Public libraries: 3.9 per 100,000 (10th lowest)
> Registered library users: 50.9% of pop. (19th lowest)

39. Oklahoma
> Adults lacking basic prose literacy skills: 12.3% (21st highest)
> Pct. adults with bachelor’s degree or higher: 25.2% (8th lowest)
> Public libraries: 5.5 per 100,000 (21st lowest)
> Registered library users: 48.2% of pop. (14th lowest)
[in-text-ad-2]

40. Arkansas
> Adults lacking basic prose literacy skills: 13.7% (14th highest)
> Pct. adults with bachelor’s degree or higher: 22.4% (3rd lowest)
> Public libraries: 7.9 per 100,000 (16th highest)
> Registered library users: 55.4% of pop. (18th highest)

41. Alabama
> Adults lacking basic prose literacy skills: 14.8% (12th highest)
> Pct. adults with bachelor’s degree or higher: 24.7% (7th lowest)
> Public libraries: 6.1 per 100,000 (25th lowest)
> Registered library users: 56.5% of pop. (16th highest)
[in-text-ad]
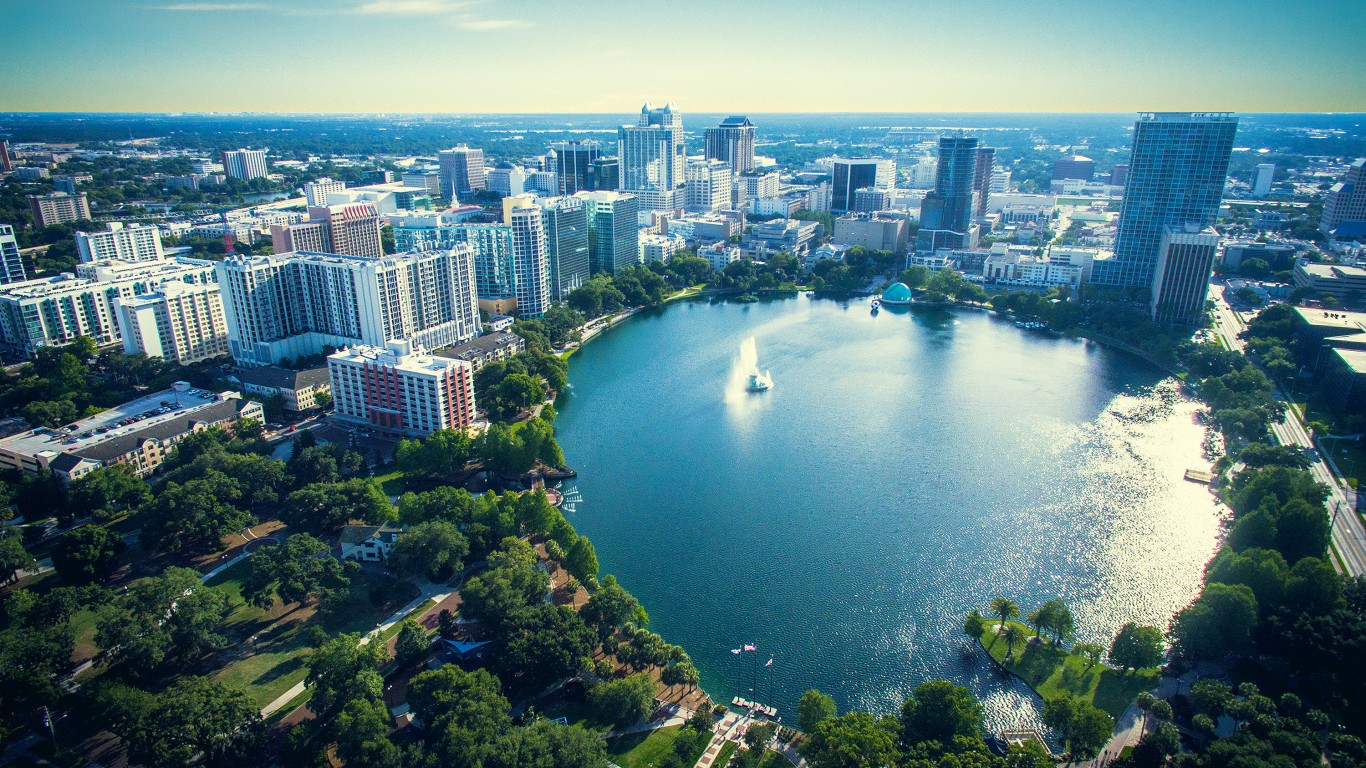
42. Florida
> Adults lacking basic prose literacy skills: 19.7% (3rd highest)
> Pct. adults with bachelor’s degree or higher: 28.6% (19th lowest)
> Public libraries: 2.6 per 100,000 (the lowest)
> Registered library users: 53.3% of pop. (24th lowest)
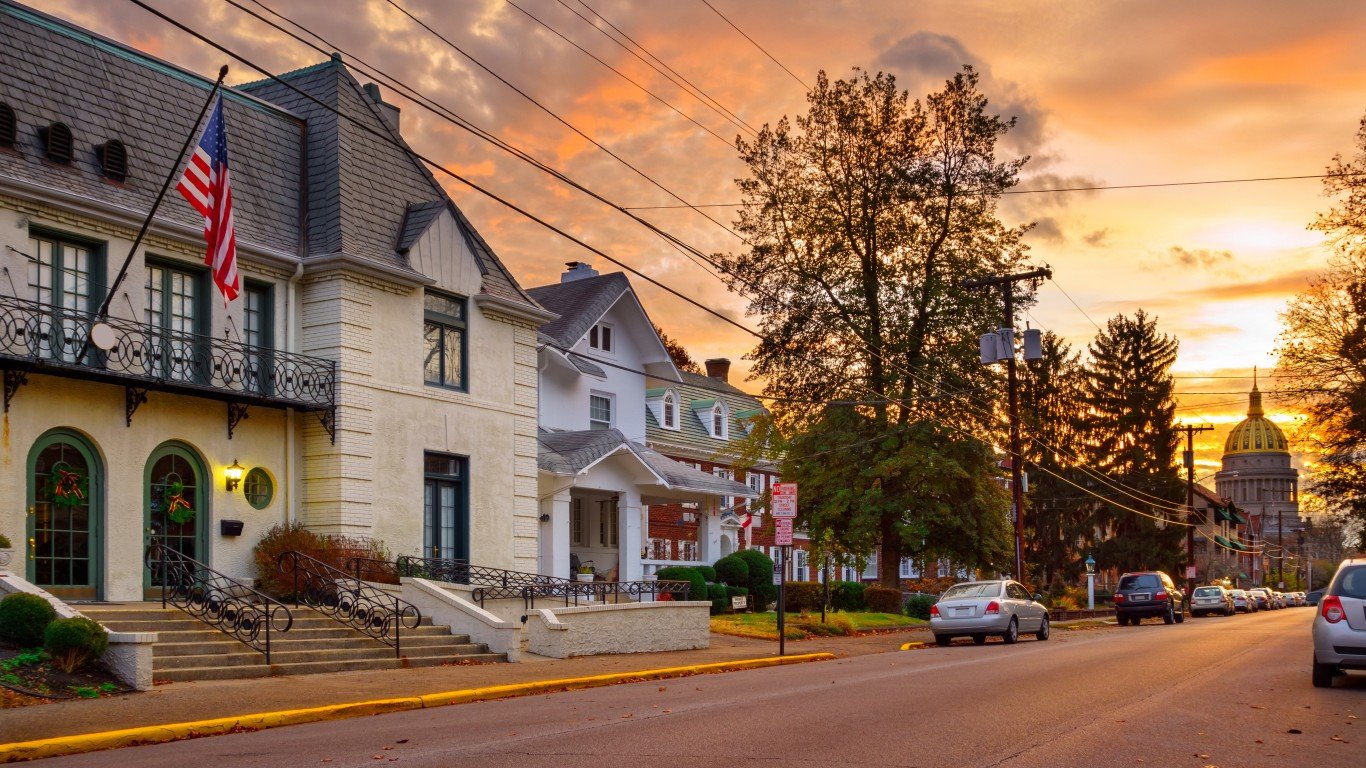
43. West Virginia
> Adults lacking basic prose literacy skills: 13.4% (16th highest)
> Pct. adults with bachelor’s degree or higher: 20.8% (the lowest)
> Public libraries: 9.4 per 100,000 (12th highest)
> Registered library users: 50.9% of pop. (20th lowest)

44. California
> Adults lacking basic prose literacy skills: 23.1% (the highest)
> Pct. adults with bachelor’s degree or higher: 32.9% (14th highest)
> Public libraries: 2.9 per 100,000 (2nd lowest)
> Registered library users: 57.4% of pop. (15th highest)
[in-text-ad-2]

45. Georgia
> Adults lacking basic prose literacy skills: 16.7% (6th highest)
> Pct. adults with bachelor’s degree or higher: 30.5% (23rd highest)
> Public libraries: 3.9 per 100,000 (11th lowest)
> Registered library users: 38.3% of pop. (2nd lowest)

46. New Mexico
> Adults lacking basic prose literacy skills: 16.5% (7th highest)
> Pct. adults with bachelor’s degree or higher: 27.2% (12th lowest)
> Public libraries: 6.0 per 100,000 (24th lowest)
> Registered library users: 52.8% of pop. (22nd lowest)
[in-text-ad]
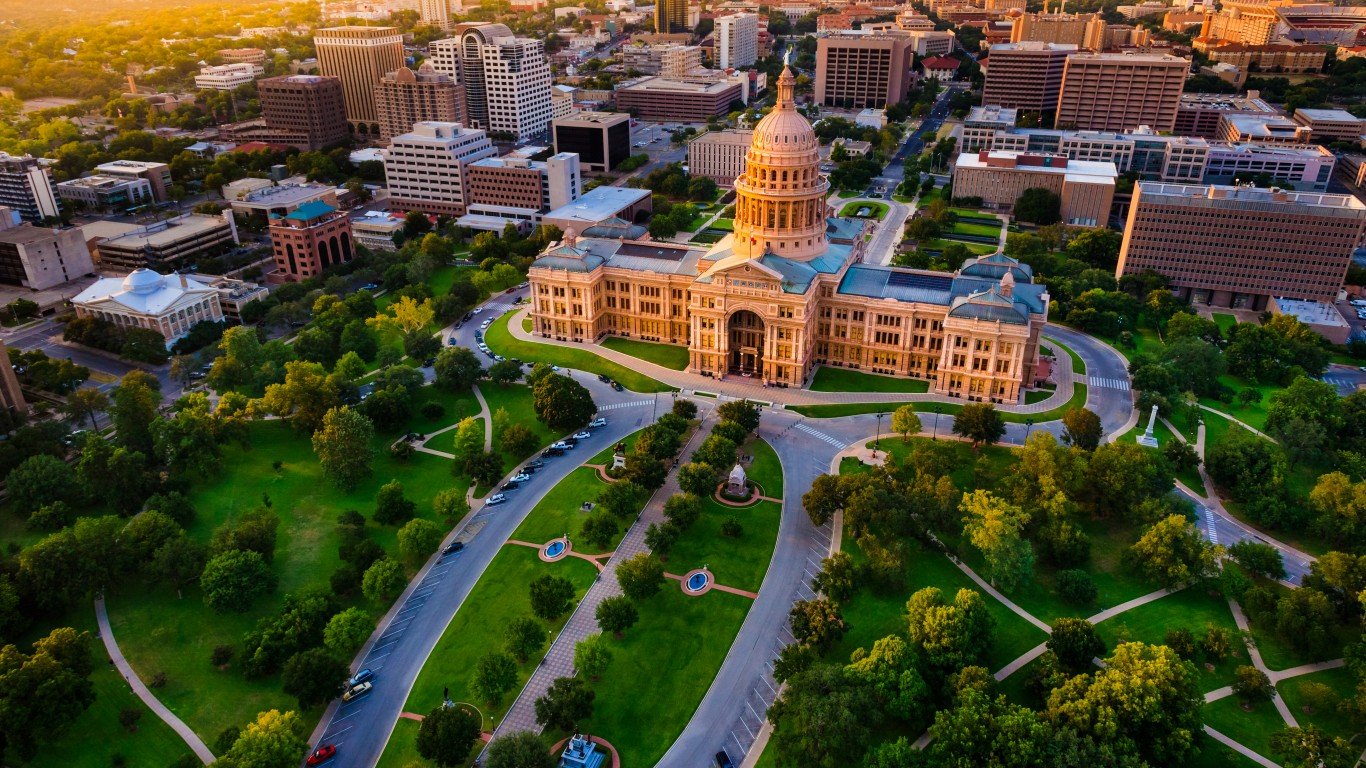
47. Texas
> Adults lacking basic prose literacy skills: 19.0% (4th highest)
> Pct. adults with bachelor’s degree or higher: 28.9% (22nd lowest)
> Public libraries: 3.2 per 100,000 (4th lowest)
> Registered library users: 49.2% of pop. (16th lowest)
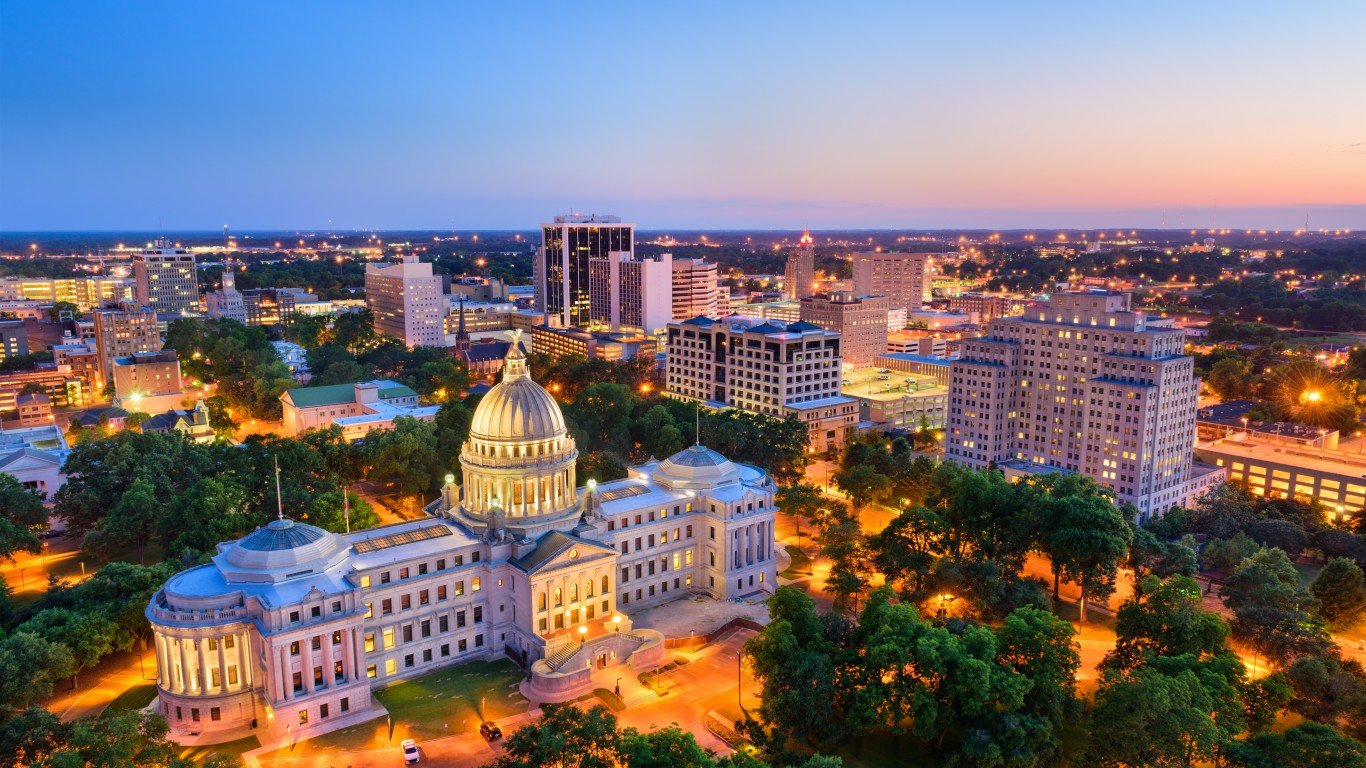
48. Mississippi
> Adults lacking basic prose literacy skills: 16.0% (9th highest)
> Pct. adults with bachelor’s degree or higher: 21.8% (2nd lowest)
> Public libraries: 7.9 per 100,000 (15th highest)
> Registered library users: 58.5% of pop. (11th highest)

49. Louisiana
> Adults lacking basic prose literacy skills: 16.0% (10th highest)
> Pct. adults with bachelor’s degree or higher: 23.4% (4th lowest)
> Public libraries: 7.2 per 100,000 (17th highest)
> Registered library users: 53.0% of pop. (23rd lowest)
[in-text-ad-2]

50. Nevada
> Adults lacking basic prose literacy skills: 16.1% (8th highest)
> Pct. adults with bachelor’s degree or higher: 23.5% (6th lowest)
> Public libraries: 2.9 per 100,000 (3rd lowest)
> Registered library users: 44.6% of pop. (9th lowest)
Detailed findings
According to the most recent survey of adult literacy in the United States, the 2003 National Assessment of Adult Literacy, 14.5% of American adults age 16 and over lack basic prose literacy skills — defined as ranging from being fully unable to read to only being able to understand short, commonplace text in English, but nothing more advanced. The share of adults lacking basic prose literacy skills ranges from 23.1% in California to 5.8% in New Hampshire and is strongly correlated with the share of limited English-speaking households.
One of the largest predictors of student success is parental education, and adult literacy rates correlate heavily with student educational outcomes. In 9 of the 10 states with the highest adults literacy rates, the share of eighth graders who scored proficient or better on the reading section of the 2015 National Assessment of Educational Progress is greater than the 34.3% national share. This percentage is lower than the national rate in 9 of the 10 states with the lowest adult literacy rates.
Literacy rates also correlate with factors associated with reading behavior and access to books. In all 10 of the states with the highest adult literacy rates, the concentration of public libraries is greater than the national figure of 5.2 public libraries per 100,000 Americans.
While the relationship between school expenditures and student outcomes is complicated, research has identified a link — albeit a minor one — between school spending and academic achievement, and states with higher public school expenditure per pupil tend to have higher literacy rates and more student success overall. Expenditures for public elementary and secondary schools per pupil are greater than the national average of $11,408 in seven of the 10 states with the highest adult literacy rates, and lower in eight of the 10 states with the lowest adult literacy rates.
The states with the highest school spending per capita are New York, Alaska, and Connecticut, and the states with the lowest are Utah, Idaho, and Arizona.
School spending and, ultimately, student outcomes are largely associated with wealth. Approximately 92% of public school funding comes from state and local sources, much of which is derived from income and property taxes. Median annual household incomes are greater than the national median of $57,617 in all 10 of the states with the higher per-pupil school expenditure. Incomes are strongly correlated with literacy rates overall.
Methodology
To identify the most and least literate states, 24/7 Wall St. compiled an index of several measures related to reading proficiency, access to reading materials, and library usage. The share of adults lacking basic prose literacy skills — defined as literacy skills ranging from being “unable to read and understand any written information to being able only to locate easily identifiable information in short, commonplace prose text in English” — came from the 2003 National Assessment of Adult Literacy as was included in the index at full weight. The shares of fourth and eighth graders who scored proficient or better on the reading section of the 2015 National Assessment of Educational Progress came from the National Center for Education Statistics and were each included in the index at half-weight. The shares of adults with at least a bachelor’s degree came from the U.S. Census Bureau’s 2016 American Community Survey and were included in the index at full weight. Data on the number of bookstores in each state came from the Census Bureau’s County Business Patterns series and was included in the index at half-weight after being adjusted for population. Data on the number of public libraries in each state came from the American Library Association and was included in the index at half-weight after being adjusted for population. The number of registered public library users in each state also came from the ALA and was included in the index at full weight as a percentage of the total population.
Take This Retirement Quiz To Get Matched With An Advisor Now (Sponsored)
Are you ready for retirement? Planning for retirement can be overwhelming, that’s why it could be a good idea to speak to a fiduciary financial advisor about your goals today.
Start by taking this retirement quiz right here from SmartAsset that will match you with up to 3 financial advisors that serve your area and beyond in 5 minutes. Smart Asset is now matching over 50,000 people a month.
Click here now to get started.
Thank you for reading! Have some feedback for us?
Contact the 24/7 Wall St. editorial team.
 24/7 Wall St.
 24/7 Wall St.
 24/7 Wall St.
 24/7 Wall St.
 24/7 Wall St.
