Special Report
Cities Where Americans Struggle to Afford Their Homes

Published:
Last Updated:

The government, as well as lenders, generally advise that Americans spend no more than 30% of their monthly income on housing. Households spending more than that on rent or mortgage payments are considered cost burdened and often do not have enough money left over for other necessities. Still, 32% of American households are cost burdened, and in some of the country’s more expensive cities, the share is far higher.
Housing is a basic need that is becoming increasingly difficult to meet in the United States. According to “The State of the Nation’s Housing 2018,” a report compiled by the Joint Center for Housing Studies of Harvard University, there is a serious shortage of affordable housing in the United States. Nationwide, the median rent climbed 20% faster than inflation from 1990 to 2016. The median home price climbed 41% faster over the same period.
Rising housing costs are attributable to a number of factors, including better housing quality, rising materials and labor costs, and growing scarcity of developed land. Because of these factors, coupled with weak income growth over the last three decades, housing has become unaffordable for millions of Americans, particularly those in lower- and middle-income brackets.
24/7 Wall St. reviewed “The State of the Nation’s Housing 2018” to identify the 21 metro areas where the largest share of households are struggling to afford their homes. In each metro area on this list, at least 35% of all households spend at least 30% of their income on housing. In all but two metro area on this list, over half of all households earning between $30,000 and $44,999 a year are burdened by housing costs.
Click here to see the cities where Americans struggle to afford their homes.
Click here to see our detailed findings and methodology.

21. Chicago-Naperville-Elgin, IL-IN-WI
> Cost-burdened households: 35.0%
> Cost-burdened low income households: 38.8%
> Median single-family home value: $214,653
> Median household income: $65,000
> Homeownership rate: 63.4%
Chicago-Naperville-Elgin is one of 21 major U.S. metro areas where at least 35% of all households spend 30% or more of their income on housing. Some 17.6% of area households are moderately burdened — spending between 30% and 50% of their income on housing — and 17.4% of area households are severely burdened, spending over half of their income on housing.
Unlike most cities on this list, housing costs as a proportion of income are rising at a slower rate in Chicago than across the nation as a whole, as is the median home price. Growing affordability of housing in the area may be due to stagnant demand. The metro area’s population grew by a 10th of 1% from 2011 to 2016, even as the U.S. population grew by 3.7%. Still, Chicago remains one of the least affordable housing markets in the country.
[in-text-ad]

20. Boston-Cambridge-Newton, MA-NH
> Cost-burdened households: 35.1%
> Cost-burdened low income households: 64.9%
> Median single-family home value: $442,151
> Median household income: $81,200
> Homeownership rate: 61.3%
The Boston-Cambridge-Newton metro area is one of the wealthiest in the United States — the typical household there earns $81,200 a year, far more than the national median of $57,000. It is also one of the most expensive places to live. The typical single family home is valued at $442,151, the seventh highest median home value of the 100 largest metro areas in the country. Some 35.1% of households in the Boston metro area spend at least 30% of their income on housing, one of the highest cost burden rates of any city.
Higher housing cost burdens in the city are driven by very low supply relative to demand, particularly among the city’s low-income renters. There are less than 47 affordable rental units available for every 100 extremely low income renter households in the metro area.

19. Virginia Beach-Norfolk-Newport News, VA-NC
> Cost-burdened households: 35.2%
> Cost-burdened low income households: 57.7%
> Median single-family home value: $222,658
> Median household income: $60,000
> Homeownership rate: 60.5%
In the Virginia Beach metro area, 35.2% of households spend a disproportionately high share of their income on housing costs. Nearly 16% of area households are severely burdened, spending more than half of their income on housing.
A lack of affordable housing for the metro area’s lower-income residents is likely contributing to the problem. Nearly 45% of households in the $30,000-$44,999 income bracket in Virginia beach spend between 30% and 50% of their income on housing.

18. New Orleans-Metairie, LA
> Cost-burdened households: 36.2%
> Cost-burdened low income households: 44.5%
> Median single-family home value: $171,387
> Median household income: $48,700
> Homeownership rate: 60.7%
More than one in every three households in the New Orleans metro area pay a large share of their income on housing. Further, the majority of those households are severely burdened by housing costs, meaning they spend over half of their income on their rent or mortgage.
As is often the case, lower-income households are the most likely to be burdened by housing costs. Some 44.5% of households in the $30,000-$44,999 income range pay at least 30% of their income on housing. Meanwhile, only 3.6% of households earning at least $75,000 are disproportionately burdened by housing costs.
[in-text-ad-2]
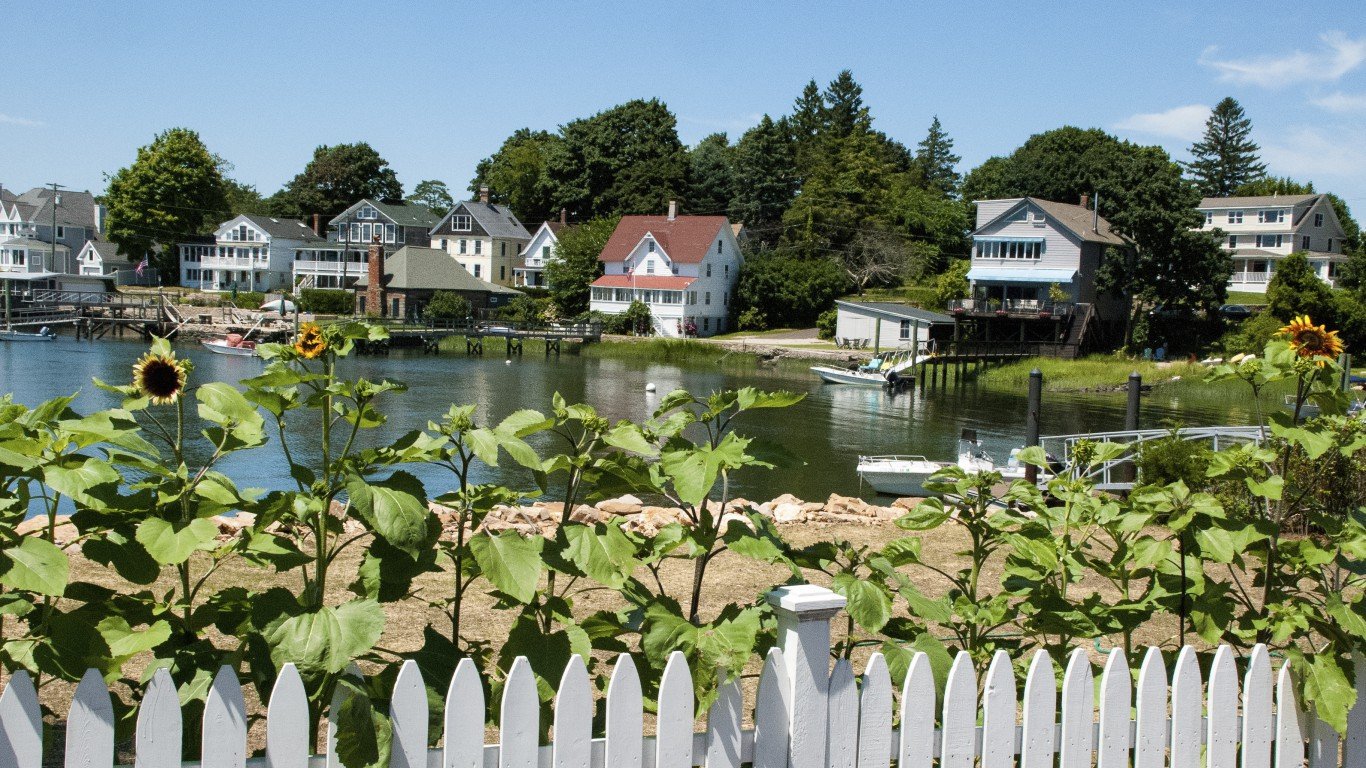
17. New Haven-Milford, CT
> Cost-burdened households: 36.3%
> Cost-burdened low income households: 61.8%
> Median single-family home value: $201,182
> Median household income: $66,500
> Homeownership rate: 61.2%
New Haven-Milford is one of two Connecticut metro areas to have some of the worst housing cost burdens in the country. The high housing cost burden appears to be driven largely by a lack of low-cost housing options. Nearly 62% of households earning $30,000-$44,999 per year spend a disproportionately large share of their income on housing.
Still, housing has become more affordable in the area in recent years, likely due to an uptick in supply. The total population in the New Haven metro area fell by 0.5% between 2011 and 2016, even as the U.S. population expanded by 3.7%. Over roughly the same period, the ratio of median home price to median income fell by 12%, and the median monthly housing payment as a share of monthly income fell by 5.4%.
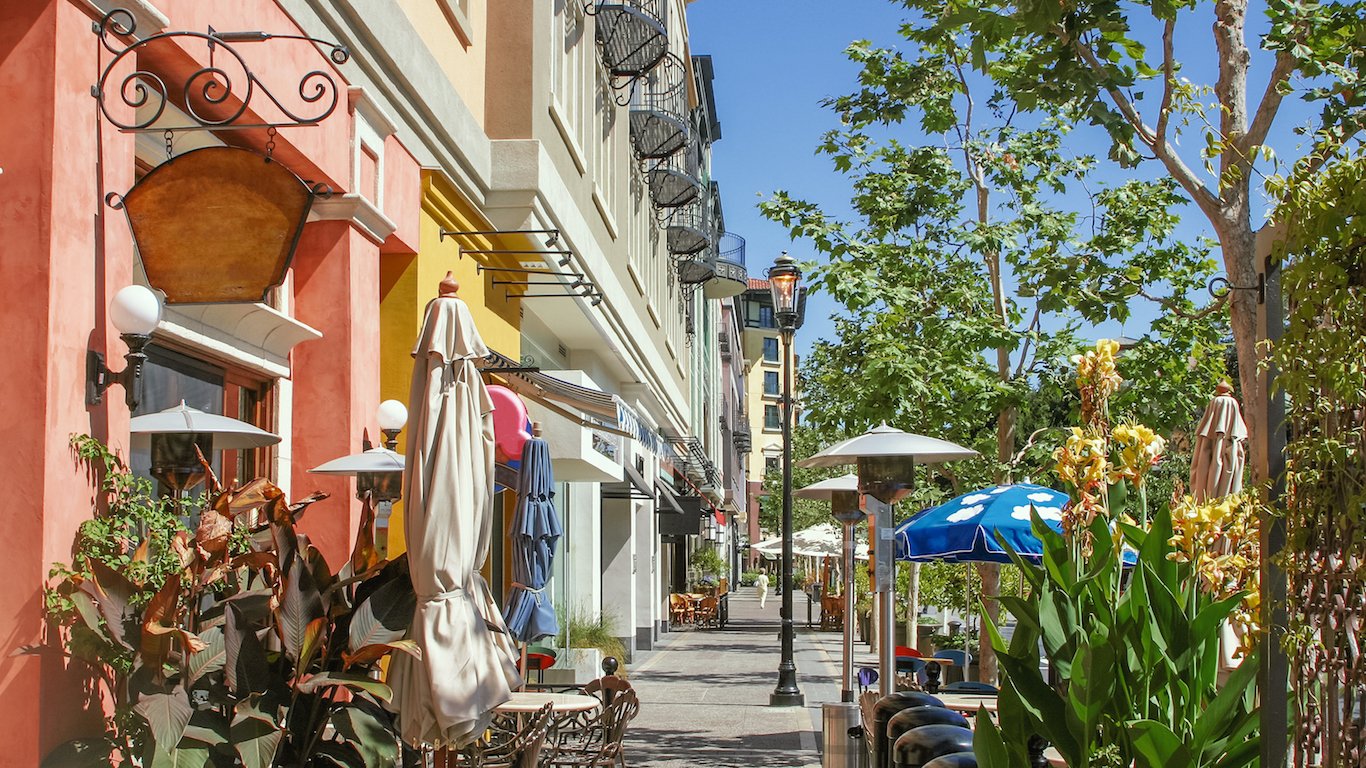
16. San Jose-Sunnyvale-Santa Clara, CA
> Cost-burdened households: 36.5%
> Cost-burdened low income households: 76.2%
> Median single-family home value: $1.2 million
> Median household income: $109,210
> Homeownership rate: 56.6%
The explosive economic growth in the tech sector in the San Jose-Sunnyvale-Santa Clara metro area led to skyrocketing home prices. As a result, housing has become unaffordable for many area residents. The typical single-family home in San Jose is now valued at $1.2 million, the highest median home value of the nation’s 100 largest metro areas. An estimated 36.5% of households spend at least 30% of their incomes on housing, far more than the 32.0% of American households who do.
Housing in San Jose is particularly unaffordable for low income residents. Some 43.4% of households earning between $30,000 and $44,999 a year — spend over 50% of their incomes on housing, the largest share of any major metro area.
[in-text-ad]

15. Stockton-Lodi, CA
> Cost-burdened households: 37.0%
> Cost-burdened low income households: 58.4%
> Median single-family home value: $347,675
> Median household income: $59,000
> Homeownership rate: 54.1%
Some 37% of households in the Stockton-Lodi metro area are moderately or severely burdened by housing costs. Low-income residents are disproportionately affected. Over half of area households earning $30,000-$44,999 a year spend at least 30% of their income on housing costs. The city of Stockton is planning to pay its poorest residents a basic income to offset rising housing costs and reduce homelessness.
High demand is likely partially to blame for the disproportionately high housing costs in the metro area. Like in a number of other West Coast housing markets, inventory of homes for sale fell in each of the last three years in Stockton-Lodi.
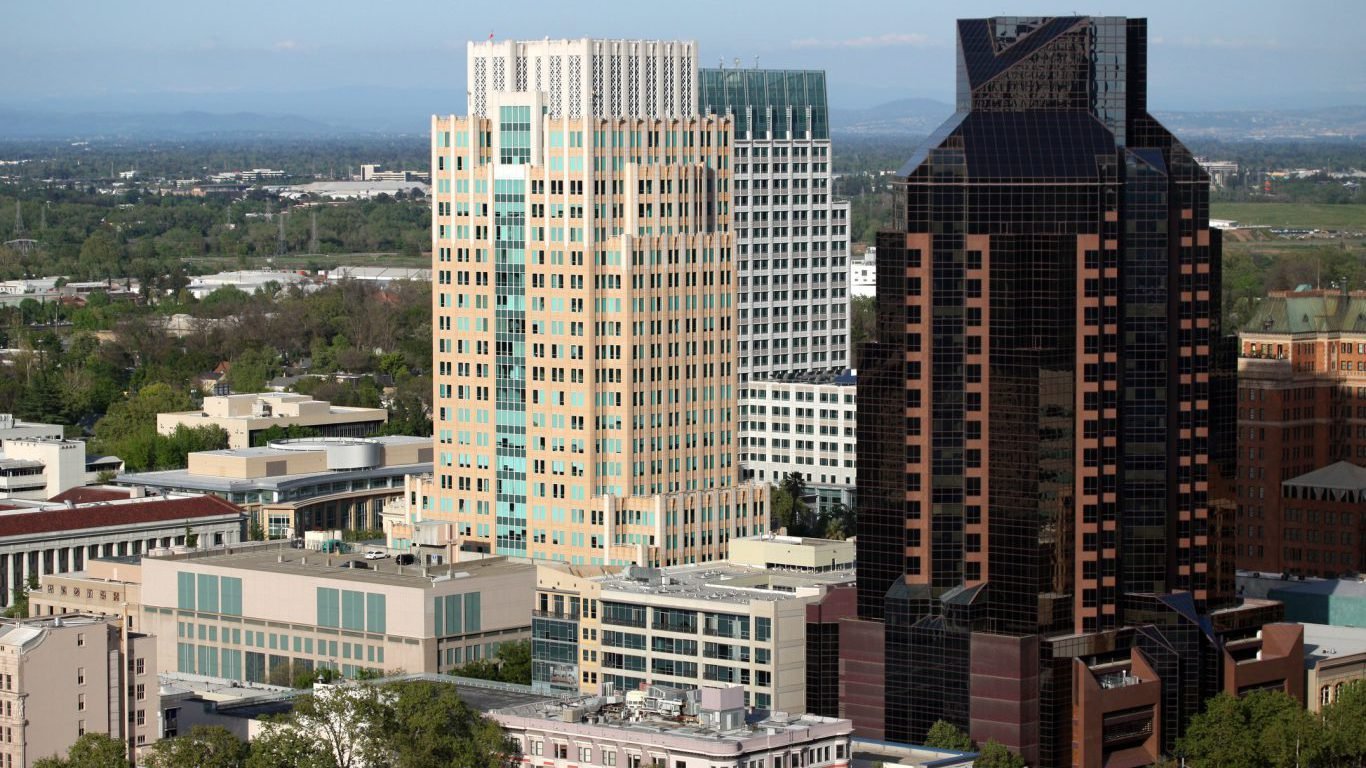
14. Sacramento–Roseville–Arden-Arcade, CA
> Cost-burdened households: 37.2%
> Cost-burdened low income households: 59.8%
> Median single-family home value: $391,391
> Median household income: $64,000
> Homeownership rate: 59.1%
The Sacramento metro area is one of a handful nationwide to have fewer than 20 affordable rental units for every 100 low-income households. As a result, nearly 60% of area households in the $30,000-$44,999 income range are especially burdened by housing costs.
Rapid population growth in the metro area is driving up housing demand and also likely costs. The number of people living in the Sacramento metro area increased by 5.5% from 2011 to 2016, faster than the national population growth rate of 3.7%. Over roughly the same period, the typical monthly mortgage payment in the metro area increased by 92.5%, more than double the 41.4% increase nationwide.

13. San Francisco-Oakland-Hayward, CA
> Cost-burdened households: 37.4%
> Cost-burdened low income households: 70.1%
> Median single-family home value: $909,836
> Median household income: $96,000
> Homeownership rate: 53.6%
The San Francisco-Oakland-Hayward metro area is one of the wealthiest in the country. The typical household there earns $96,000 a year, nearly $40,000 more than the national median. It is also one of the least affordable places in the country. The typical single-family home costs $909,836, the second highest median home value of the nation’s 100 largest metro areas. Some 37.4% of households spend at least 30% of their incomes to housing costs, far more than the 32.0% of households nationwide that spend at least 30% on housing costs.
San Francisco housing is particularly unaffordable for the middle class. Of households earning $45,000-$74,999 a year, 55.9% are cost-burdened by housing, the largest share of any major U.S. metro area.
[in-text-ad-2]

12. Orlando-Kissimmee-Sanford, FL
> Cost-burdened households: 37.6%
> Cost-burdened low income households: 55.6%
> Median single-family home value: $217,129
> Median household income: $52,000
> Homeownership rate: 59.3%
The Orlando-Kissimmee-Sanford metro area has undergone rapid population growth over the past several years. The city’s population grew by 12.4% between 2011 and 2016, more than three times the national population growth rate of 3.7%. The increased demand for housing has contributed to a massive increase in home values, making real estate less affordable for many of Orlando’s lower income residents. The typical home in Orlando is now worth 4.4 times the median income in the city, up 50% from five years ago — the eighth largest increase in price-to-income ratio of the 100 largest U.S. metro areas. Today, some 37.6% of Orlando households are cost burdened, far more than the 32.0% of households nationwide.

11. Las Vegas-Henderson-Paradise, NV
> Cost-burdened households: 37.6%
> Cost-burdened low income households: 57.0%
> Median single-family home value: $250,491
> Median household income: $55,000
> Homeownership rate: 52.3%
The Las Vegas metro area reported one of the steepest housing price increases in 2017. Area home prices rose by 14% last year compared to a 6.2% average increase nationwide. Renters in the metro area are not spared either, over 50% are moderately or severely burdened by rent prices. Currently, Las Vegas is one of just a handful of major metro areas with fewer than 20 affordable rental units available for every 100 low-income households.
Across Las Vegas, 37.6% of households pay more than they can afford on housing. Almost half of those burdened spend over 50% of their income on housing.
[in-text-ad]

10. Bakersfield, CA
> Cost-burdened households: 38.8%
> Cost-burdened low income households: 44.5%
> Median single-family home value: $204,670
> Median household income: $50,000
> Homeownership rate: 57.0%
Bakersfield is one of 10 California metro areas to rank on this list. A relatively large share of Bakersfield residents face serious financial hardship. Some 22.7% live below the poverty line, one of the highest poverty rates of any U.S. metro area and well above the 14.0% U.S. poverty rate. Low income Americans are the most vulnerable to housing cost burdens and likely account for a large share of Bakersfield’s high housing cost burden rate. Some 38.8% of households in the area spend at least 30% of their income on housing, the 10th largest share of any U.S. metro area.

9. Bridgeport-Stamford-Norwalk, CT
> Cost-burdened households: 38.9%
> Cost-burdened low income households: 76.6%
> Median single-family home value: $323,589
> Median household income: $89,700
> Homeownership rate: 65.3%
The Bridgeport-Stamford-Norwalk metro area is one of the less affordable cities in the United States. The typical single-family home in Bridgeport is worth $323,589, one of the higher median home values of the 100 largest metro areas. Overall, some 38.9% of households spend more than 30% of incomes on housing, far more than the 32.0% of households that spend more than 30% of incomes nationwide.
Housing is particularly unaffordable for the area’s low income residents. Bridgeport has the highest income inequality of any major metro area, and 76.6% of low income households — earning between $30,000 and $45,000 — spend at least 30% of their incomes on housing, the largest share nationwide.

8. Urban Honolulu, HI
> Cost-burdened households: 40.3%
> Cost-burdened low income households: 68.8%
> Median single-family home value: N/A
> Median household income: $78,800
> Homeownership rate: 54.1%
Home prices have risen far faster than incomes in the Honolulu metro area. San Jose and Los Angeles are the only U.S. metro areas with higher median home sale price-to-income ratios than Honolulu. The the typical home in Honolulu sells for 9.2 times the area’s median household income, more than double the national sale price-to-income ratio of 4.2.
For many in the Honolulu metro area, the high housing costs leave little disposable income for other expenses. More than two out of every three households in the $30,000-$44,999 income bracket are housing cost-burdened, as are more than half of households in the $45,000-$74,999 income range. Though the implications of being housing cost-burdened may be less grave for higher income Americans, 18.8% of Honolulu households earning at least $75,000 spend 30% or more of their income on housing, the largest share of any U.S. metro area.
[in-text-ad-2]

7. Oxnard-Thousand Oaks-Ventura, CA
> Cost-burdened households: 40.4%
> Cost-burdened low income households: 73.3%
> Median single-family home value: $578,148
> Median household income: $78,000
> Homeownership rate: 62.1%
The Oxnard-Thousand Oaks-Ventura metro area has some of the most expensive real estate in the country. The typical area home is worth $578,148, the fourth highest median home value of metro areas considered. As a result, it is one of only five metro areas nationwide where most residents who financed their home spend over $4,000 per month on mortgage payments.
There is also a shortage of affordable, low-income housing in the metro area. Some 73.3% of households earning $30,000-$44,999 a year are strained by housing costs. The majority of those cost burdened low-income households spend over half of their income on housing.

6. Fresno, CA
> Cost-burdened households: 41.2%
> Cost-burdened low income households: 52.1%
> Median single-family home value: $235,570
> Median household income: $48,600
> Homeownership rate: 52.9%
Housing in the Fresno metro area is 10% less expensive on average than it is nationwide. Still, it has one of the largest shares of housing cost burdened residents in the country. The typical household in Fresno earns just $48,600 a year, $8,400 less than the U.S. median and the 11th lowest median household income of the 100 largest U.S. metro areas. Some 41.2% of Fresno households are housing cost burdened, far more than the 32.0% of cost-burdened households nationwide.
Fresno is currently in need of some 35,000 affordable housing units — but funding the project is proving to be a challenge. California requires that the apartments be solar powered and that construction workers be paid higher wages than they would receive on private sector projects, driving up construction costs considerably.
[in-text-ad]

5. Riverside-San Bernardino-Ontario, CA
> Cost-burdened households: 42.9%
> Cost-burdened low income households: 63.0%
> Median single-family home value: $349,689
> Median household income: $56,800
> Homeownership rate: 61.1%
Three of the five U.S. metro areas with the worst housing cost burden rates are in California. In Riverside-San Bernardino-Ontario, 42.9% of households spend at least 30% of their income on housing, well above the 32.0% of cost-burdened households nationwide. In recent years, housing costs have climbed far faster than incomes. As of 2017, the area’s median home price was 5.7 times the area’s median household income, a 56.9% increase from five years earlier.
Housing costs are likely driven up in large part by increasing demand. The metro area’s population grew by 5.2% from 2011 to 2016, well above the comparable U.S. population growth rate of 3.7%.

4. New York-Newark-Jersey City, NY-NJ-PA
> Cost-burdened households: 43.0%
> Cost-burdened low income households: 72.4%
> Median single-family home value: $420,083
> Median household income: $71,000
> Homeownership rate: 51.0%
Of the 43% of households in the New York metro area that are cost burdened, more than half spend over 50% of their income on housing. The metro area’s poor are disproportionately burdened by housing costs. Some 72.4% of households in the $35,000-$44,999 income bracket spend at least 30% of their income on housing. In an attempt to reduce the number of households affected by high housing costs, New York City Mayor Bill de Blasio is on track to build 300,000 new affordable housing units in the city by 2026.
The city’s high housing costs are likely exacerbating New York’s homeless problem. While homelessness is declining across the vast majority of the country’s largest metro areas, New York’s homeless population is the largest in the country, climbing in three out of the last four years to over 80,000.

3. San Diego-Carlsbad, CA
> Cost-burdened households: 43.2%
> Cost-burdened low income households: 71.3%
> Median single-family home value: $570,533
> Median household income: $70,000
> Homeownership rate: 52.1%
In San Diego, rising home prices have contributed to one of the least affordable housing markets in the country. The price of the typical single-family home relative to income in San Diego increased by 29.7% over the last five years, one of the largest increases of any city. Today some 43.2% of area households spend at least 30% of their incomes on housing, the third largest share of cost-burdened residents nationwide. Housing prices may continue to increase rapidly as the city runs out of developable land. According to the Joint Center for Housing Studies at Harvard University, at its current rate of construction San Diego has just 10 months of new land available for development. By comparison, a balanced market is considered to have 24 to 36 months of land available for housing development.
[in-text-ad-2]
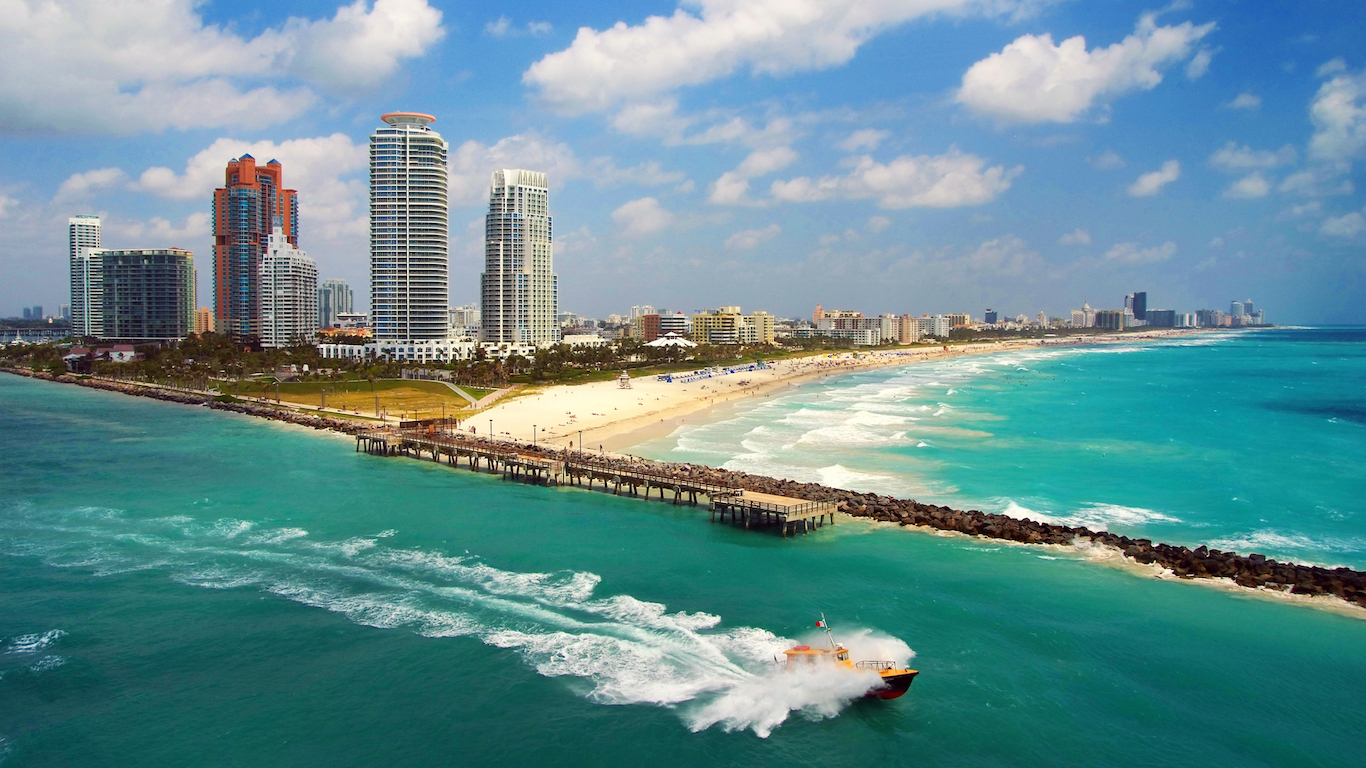
2. Miami-Fort Lauderdale-West Palm Beach, FL
> Cost-burdened households: 45.7%
> Cost-burdened low income households: 66.1%
> Median single-family home value: $263,245
> Median household income: $50,100
> Homeownership rate: 58.3%
The ratio of home price-to-income increased more than twice as fast in Miami than it did nationwide over the past five years. While today the typical household in the Miami-Fort Lauderdale-West Palm Beach earns $50,100 a year — far less than the national median income of $57,000 — the typical single-family home sells for $263,245, the 22nd highest median home value of the 100 largest U.S. metro areas. Some 45.7% of Miami households spend at least 30% of their incomes on housing, the largest share of any major city other than Los Angeles. Nearly one in three households earning $30,000 to $44,999 a year are cost burdened by housing prices.
Renters in Miami are not spared. Added amenities and rising construction costs have pushed average rents for new units to over $2,000 in the city. Some 61.2% of renters in the metro area spend at least 30% of their income on housing.

1. Los Angeles-Long Beach-Anaheim, CA
> Cost-burdened households: 46.7%
> Cost-burdened low income households: 74.6%
> Median single-family home value: $631,007
> Median household income: $65,000
> Homeownership rate: 47.4%
In Los Angeles, housing prices increased at a faster rate than income, leading to the city becoming unaffordable for a large share of residents. Some 46.7% of city households are considered housing cost burdened, the largest share nationwide. According to the Joint Center for Housing Studies at Harvard University, a household earning the median income in Los Angeles could afford monthly mortgage payments on just 11% of homes recently sold in the area. Just 47.4% of heads of household in Los Angeles own their homes, the lowest homeownership rate of the 100 largest metro areas.
The lack of affordable housing options in Los Angeles likely forces many of the city’s lower income residents out of the area, and may force those who cannot afford to leave the metro area into homelessness. According to the JCHS, some 0.48% of the Los Angeles population is homeless, the highest rate of any metro area.
Detailed Findings
Lower-income Americans are more likely to be burdened by housing costs and are often impacted harder by housing cost burdens. Nationwide, 42.6% of households earning $30,000 to $44,999 a year are burdened by housing costs, compared to 22.0% of household in the $45,000 to $74,999 income range and just 6.2% of households earning $75,000 or more.
High housing costs can have serious implications for lower-income households. For example, in the Bridgeport-Stamford-Norwalk metro area in Connecticut, one in every three households earning $30,000 to $44,999 a year spend over half of their income on housing, and are considered severely cost burdened. That means an area household earning $35,000 and spending 55% of income on rent or a mortgage has only about $1,300 left over a month to spend on food, utilities, health care, transportation, savings, and any other necessary expense.
While 2.6% of households earning $75,000 or more in the Bridgeport metro area are also severely burdened by housing costs, the remaining share of total income can carry them much further. A household in Bridgeport spending 55% of its $100,000 annual income on housing would have $3,750 in remaining funds for other monthly expenses.
In many of the cities on this list, low-income households are forced to pay a disproportionate share of their income on housing because of a lack of affordable options. In cities like Las Vegas, Los Angeles, and Sacramento, California, there were fewer than 20 affordable units for every 100 low-income renters in 2016.
Some cities on this list facing similar shortages of affordable low-income housing are taking measures to address the problem. For example, in New York, where 72.4% of those earning between $30,000 and $44,999 are burdened by high housing costs, Mayor Bill de Blasio is implementing a program to build 300,000 new affordable housing units in the city by 2026.
Similarly, the city of Stockton, California — where 58.4% of households earning between $30,000 and $44,999 a year are moderately or severely burdened by housing costs — is planning to pay its poorest residents a basic income to offset rising housing costs and reduce homelessness.
In addition to the broad trends affecting housing costs across the nation as a whole, increasing demand partially explains high housing costs in many of the cities on this list. Between 2011 and 2016, the U.S. population grew by 3.7%. Population growth outpaced the national growth rate in 14 of the 19 cities on this list for which data is available. In 10 of those metro areas, the median monthly mortgage payment increased by more than the 41.4% national average over roughly the same period — nearly doubling in some cases.
Methodology
To identify the U.S. cities where the most households struggle to afford their homes, 24/7 Wall St. reviewed data from “The State of the Nation’s Housing 2018,” a report compiled by the Joint Center for Housing Studies of Harvard University. The rank is based on the share of households in a given metro area paying 30% or more of their monthly income on housing. The rank, which was included in the JCHS report, was calculated using median household income, adjusted to a monthly rate, and the median price of an existing single-family home. Only those cities where at least 35% of households spend 30% or more of their income on housing were included on this list. Income-to-home price ratios, which were also included in the JCHS report, were calculated using Moody’s 2017 income projections. All other measures of income are from the 2016 U.S. Census Bureau’s American Community Survey. Population estimates are also from the ACS.
Take the quiz below to get matched with a financial advisor today.
Each advisor has been vetted by SmartAsset and is held to a fiduciary standard to act in your best interests.
Here’s how it works:
1. Answer SmartAsset advisor match quiz
2. Review your pre-screened matches at your leisure. Check out the
advisors’ profiles.
3. Speak with advisors at no cost to you. Have an introductory call on the phone or introduction in person and choose whom to work with in the future
Take the retirement quiz right here.
Thank you for reading! Have some feedback for us?
Contact the 24/7 Wall St. editorial team.