More than 50 years after the Fair Housing Act of 1968 outlawed housing discrimination on the basis of race, sex, national origin, and religion, segregation persists in some of America’s largest cities.
The patterns of segregation in many major metropolitan areas can be traced back to laws and housing policies of the early 20th century, when discriminatory zoning policies were legal and were used to exclude large portions of new black residents moving to cities in the Northeast and Midwest from the rural South. Even after the Supreme Court began to ban explicitly racist zoning policies in the mid-20th century, government officials excluded residents from certain neighborhoods on the basis of race through the federally-backed Home Owners’ Loan Corporation.
The HOLC created “residential security” maps for major American cities for use by loan officers, appraisers, and real estate professionals that outlined neighborhoods according to investment risk, often redlining black neighborhoods as “hazardous” areas. According to the advocacy group National Community Reinvestment Coalition, 74% of the neighborhoods that the HOLC designated as high risk or “hazardous” are low-to-moderate income neighborhoods today, and 64% are minority neighborhoods.
Many of the most segregated cities experienced a period of economic decline starting in the 1960s as wealthy white families moved from inner cities to outlying suburbs, leaving behind the families without the resources to move with a shrunken tax base and declining infrastructure. In some of America’s fastest shrinking cities, the same patterns may be continuing today.
24/7 Wall St. calculated the percentage of black residents who live in predominantly black census tracts — where at least 50% of the population is black — to identify the most segregated cities in America.
Segregation often limits access to education and employment opportunities for residents of minority communities and contributes to racial disparities in urban areas. Nationwide, 16.8% of black Americans live in majority black neighborhoods. Adult residents of these neighborhoods are 2.2 times less likely to have a college education than residents of predominantly white neighborhoods, 3.1 times more likely to be unemployed, and 3.4 times more likely to live in poverty. Due in part to these disparities, some of the most segregated cities in America also rank among the worst cities for Black Americans.
A majority of the most segregated cities in America are located in the South and Midwest and have large black populations overall. Louisiana is home to five of the 25 most segregated cities, followed by Georgia with four, and Alabama and Michigan, each with three. In 24 of the 25 most segregated cities, African Americans constitute a larger portion of the population than the 12.7% national share.
Click here to see the 25 most segregate cities in America
Click here to read our methodology
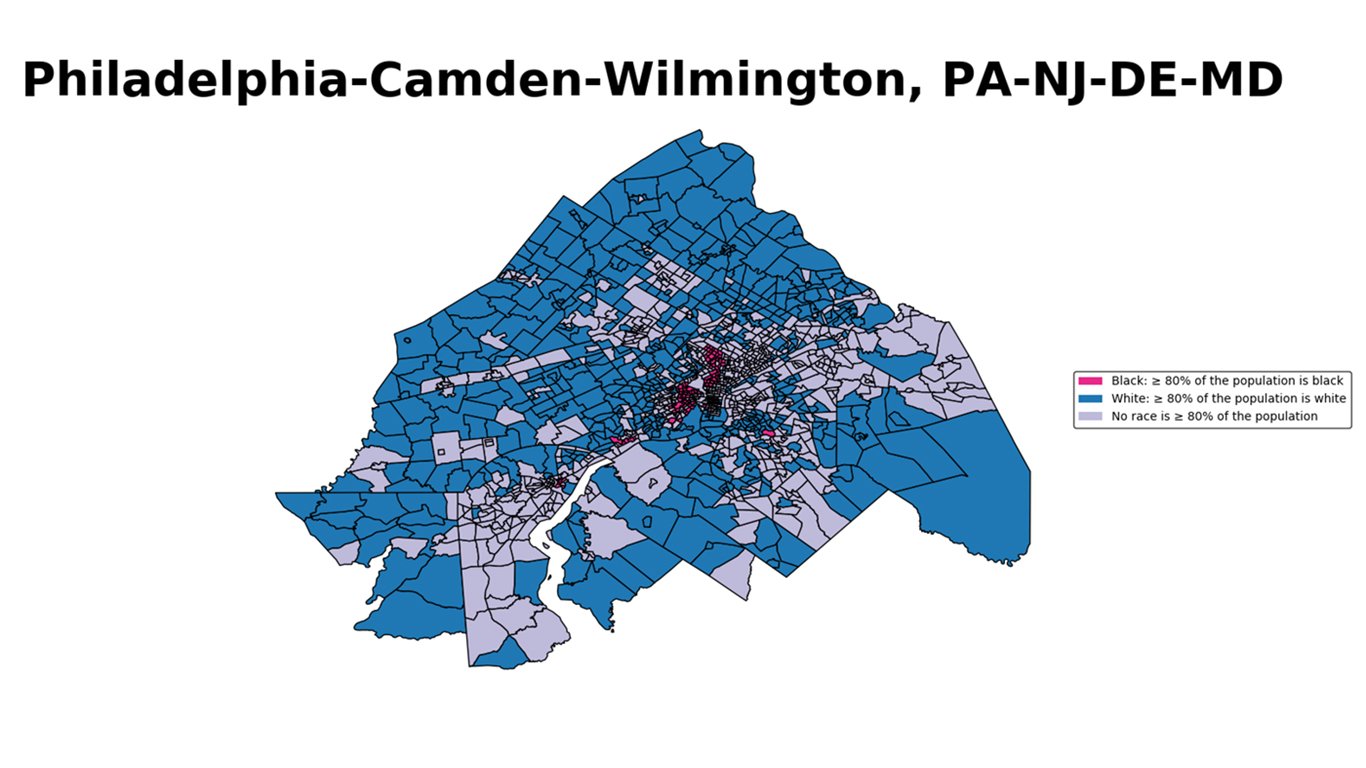
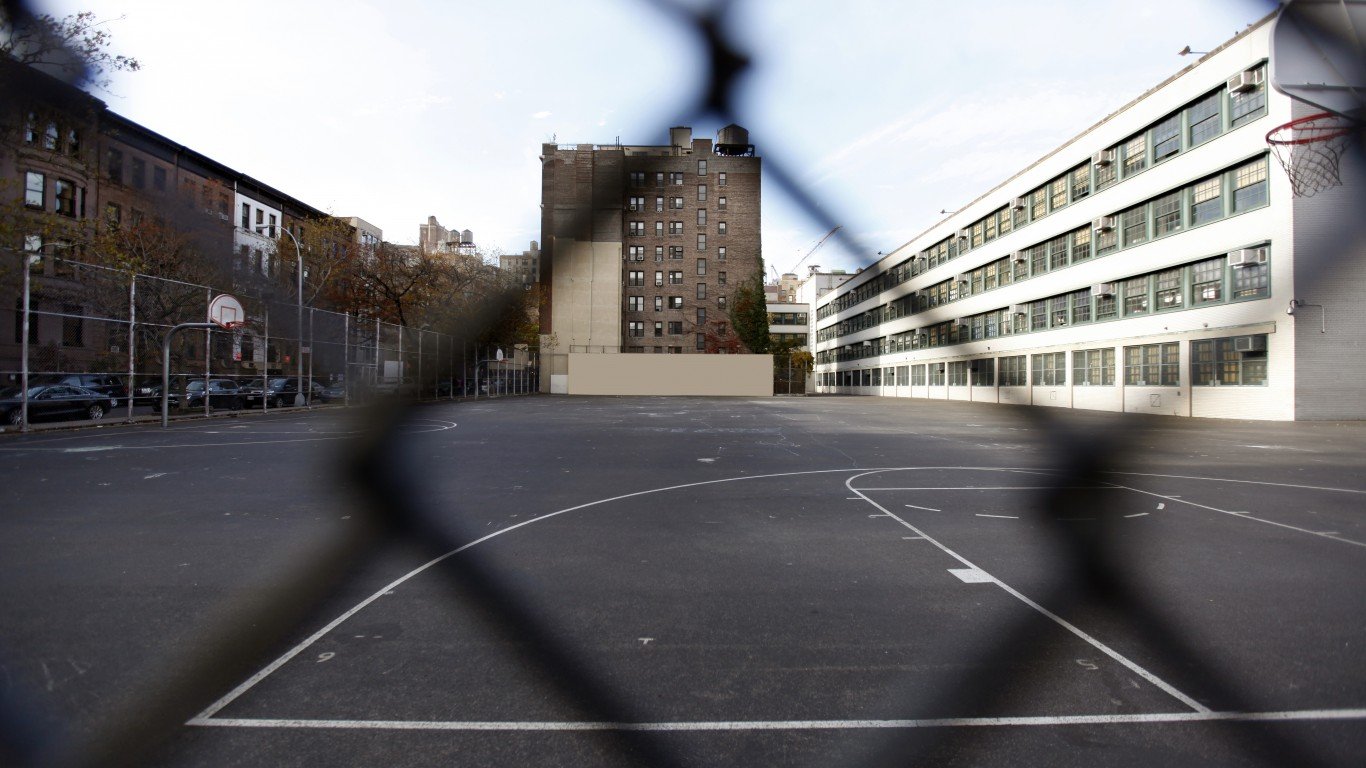
25. Philadelphia-Camden-Wilmington, PA-NJ-DE-MD
> Black pop. in black neighborhoods: 30.2% (383,327)
> Black population: 21.0% (1.3 million)
> Black poverty rate: 23.5% (298,302)
> White poverty rate: 6.9% (263,358)
While nationwide 16.8% of black Americans live in predominantly black neighborhoods, in Philadelphia, 30.2% of black residents do. Like many major Northeastern U.S. cities, much of Philadelphia’s segregation is rooted in discriminatory housing policies established by the Federal Housing Administration in the early 20th century and continue to delineate social inequalities throughout the metro area today.
Just 14.6% of adults in majority-black Philadelphia neighborhoods have a bachelor’s degree, compared to 44.0% of adults in predominantly white neighborhoods — one of the largest college attainment gaps of any U.S. city. Similarly, while 31.4% of residents in black neighborhoods in Philadelphia live below the poverty line, only 5.5% of residents in white neighborhoods do.
[in-text-ad]

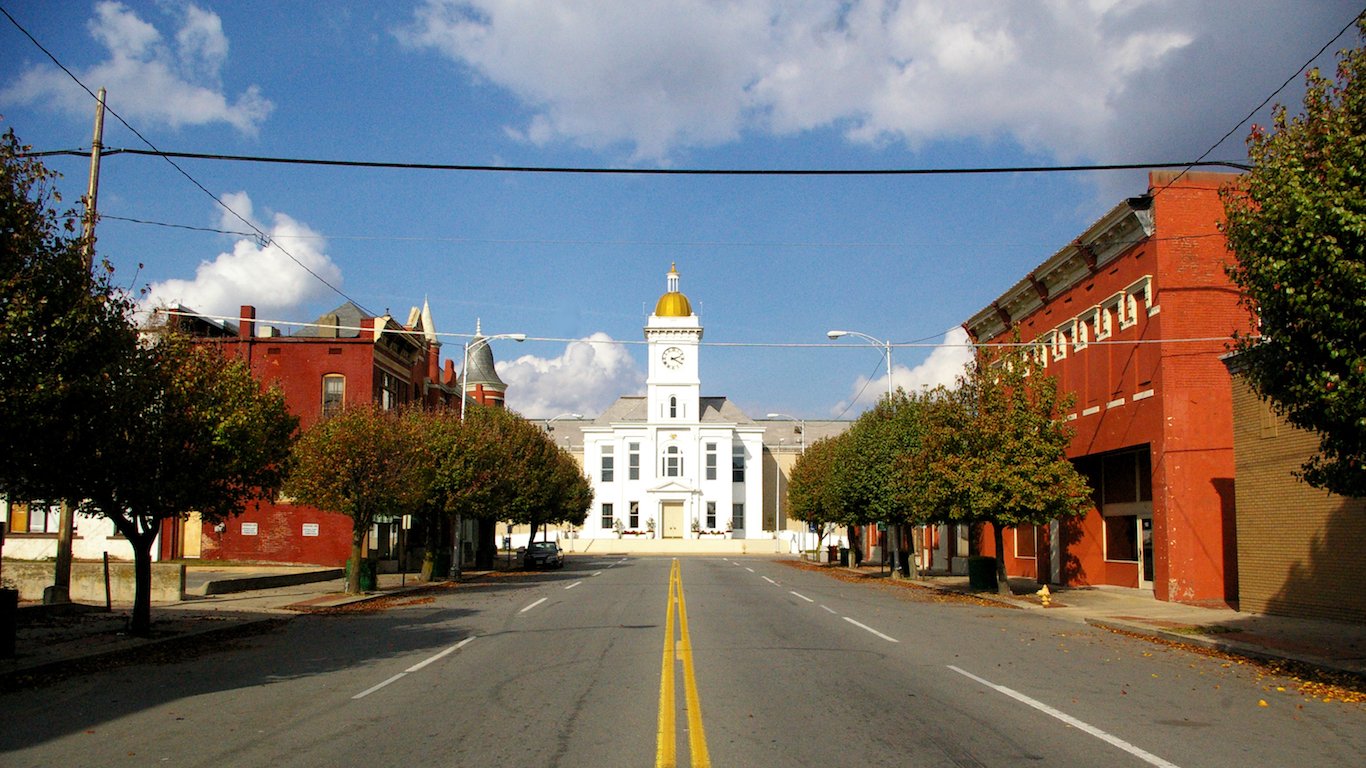
24. Montgomery, AL
> Black pop. in black neighborhoods: 30.3% (50,154)
> Black population: 44.3% (165,646)
> Black poverty rate: 27.4% (45,439)
> White poverty rate: 8.8% (16,191)
More than 60 years after the Montgomery bus boycott catalyzed the U.S. civil rights movement, Montgomery remains one of the most segregated cities in America. An estimated 30.3% of black residents in Montgomery live in majority-black neighborhoods, compared to 16.8% of black Americans nationwide. Also, 35.0% of residents in black neighborhoods live in poverty, compared to 9.0% of residents in white neighborhoods.
Like many segregated cities, urban renewal and highway infrastructure projects in Montgomery in the mid-20th century, such as the construction of interstate 65 and 85, displaced hundreds of black families and cut off minority communities from the larger metro area. Today, Montgomery’s predominantly black neighborhoods are still clustered around the intersection of I-65 and I-85.
[recirclink id=534369]
Click image to enlarge
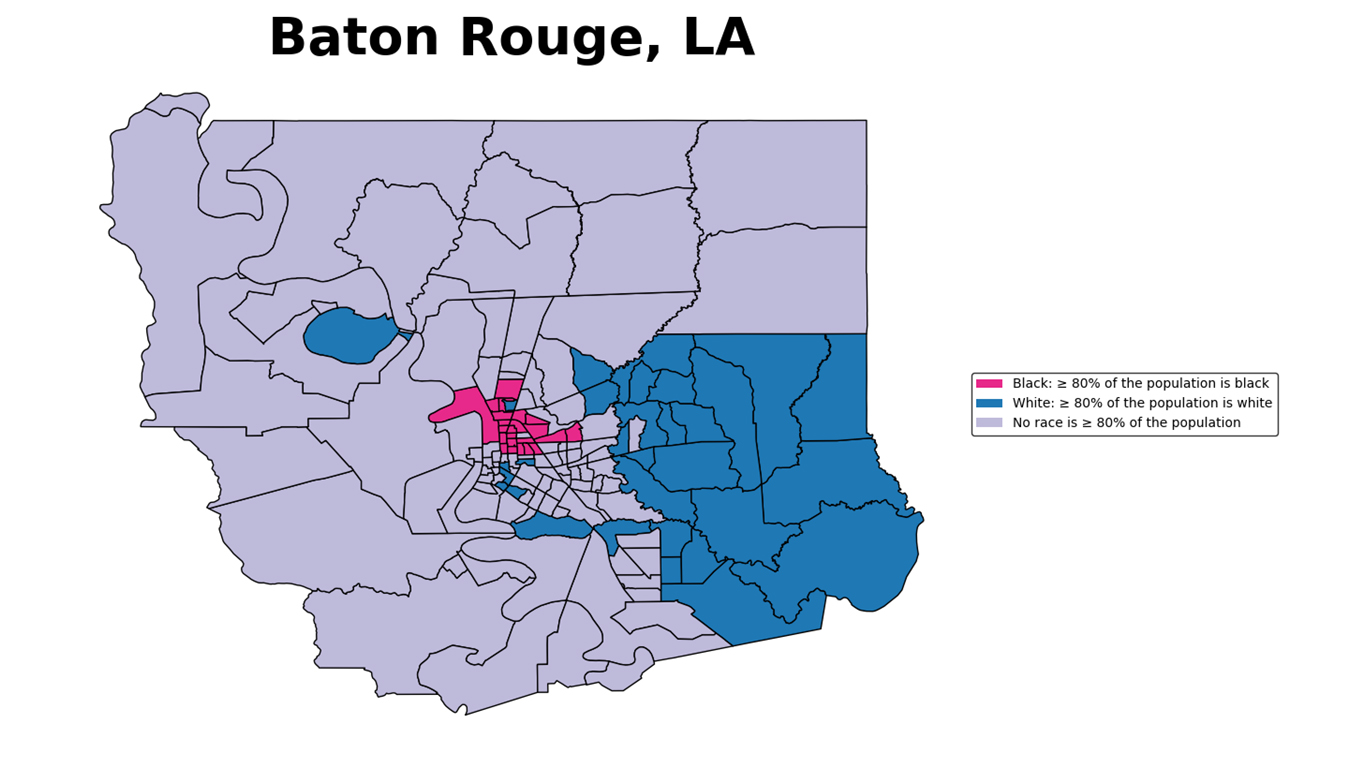
23. Baton Rouge, LA
> Black pop. in black neighborhoods: 30.3% (88,966)
> Black population: 35.4% (293,605)
> Black poverty rate: 25.7% (75,521)
> White poverty rate: 10.4% (49,008)
While nationwide 16.8% of African Americans live in predominantly black neighborhoods, 30.3% of black residents in Baton Rouge do. Racial inequality is often made worse by segregation, and the typical white household in Baton Rouge makes $32,260 more a year than the typical black households — a larger gap than the $25,073 white-black income gap nationwide. An estimated 25.7% of the Baton Rouge African American population lives in poverty, more than twice the 10.4% white poverty rate.
Segregation in Baton Rouge is largely demarcated by Florida Boulevard, an east-west thoroughfare that separates the mostly black neighborhoods in the north side of the city from the largely white south side.
Click image to enlarge
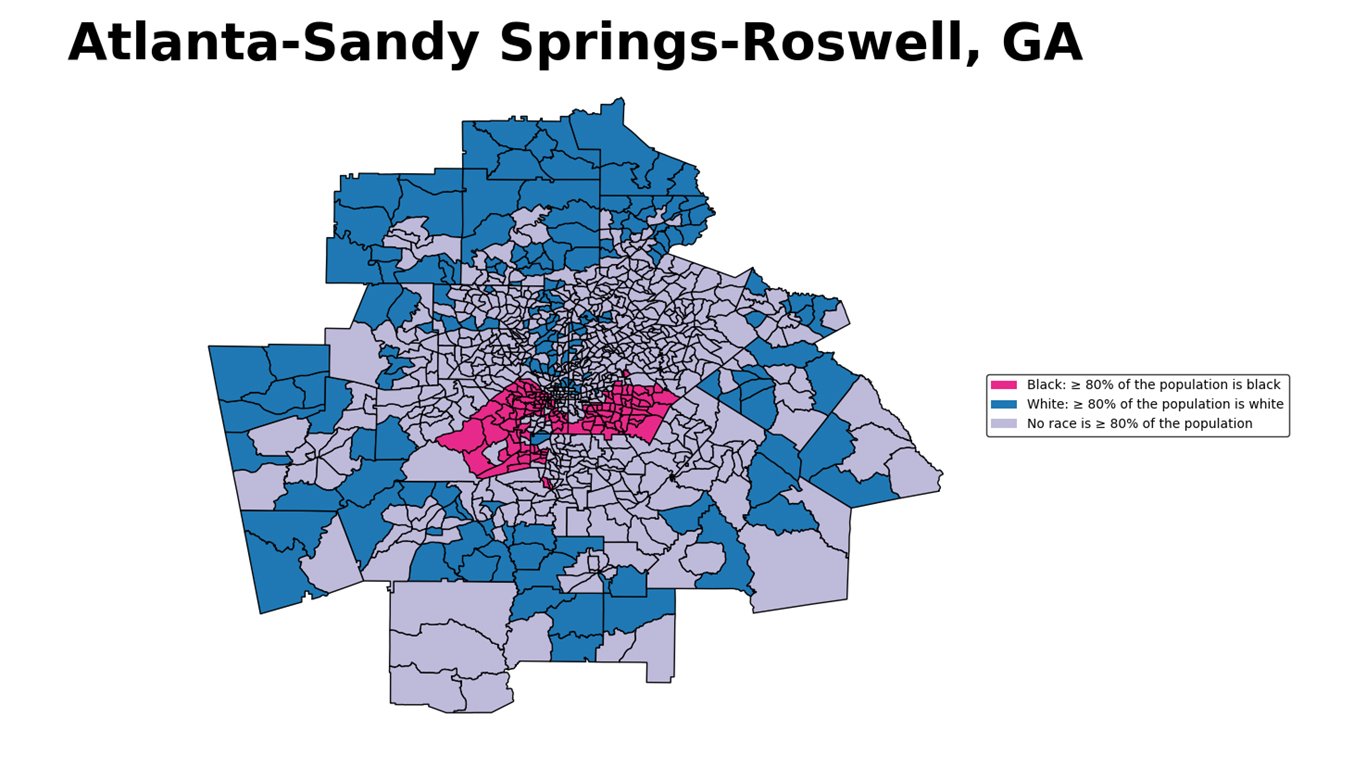
22. Atlanta-Sandy Springs-Roswell, GA
> Black pop. in black neighborhoods: 30.6% (588,034)
> Black population: 33.7% (1.9 million)
> Black poverty rate: 18.8% (360,273)
> White poverty rate: 8.1% (221,544)
Atlanta’s current segregation patterns can be traced back to redlining maps drawn up by the HOLC in the 1930s. A 1938 appraisal map of the city shows how poor, black neighborhoods such as Vine City, English Avenue, and Mechanicsville were classified as hazardous places to underwrite mortgages and were consequently passed over by investors, while white neighborhoods prospered. Today, 30.6% of Atlanta’s African American population lives in predominantly black neighborhoods, compared to the 16.8% national figure.
Atlanta’s African American residents constitute one of the wealthiest, most educated black populations of any metro area, helping to reduce the racial achievement gap overall. Some 25.5% of adults in majority-black neighborhoods have a bachelor’s degree, and 22.5% of residents live in poverty — the fourth largest and fifth smallest shares, respectively, of any U.S. city.
[in-text-ad-2]

Click image to enlarge
21. Buffalo-Cheektowaga-Niagara Falls, NY
> Black pop. in black neighborhoods: 35.0% (48,786)
> Black population: 12.3% (139,418)
> Black poverty rate: 33.1% (46,100)
> White poverty rate: 9.0% (79,639)
Buffalo is representative of many of the forces that shaped segregation patterns throughout Rust Belt cities in the 20th century. Racial policies in the early 20th century excluded black residents from certain neighborhoods, and later, in the 1950s white families moved from inner Buffalo to outlying Erie County suburbs. Additionally, the construction of the Kensington Expressway from 1957 to 1971 displaced a large number of black families and physically cut off the East Side district from the larger metro area.
Today 35.0% of black residents in the Buffalo metro area live in predominantly black neighborhoods, more than twice the national share.
Click image to enlarge
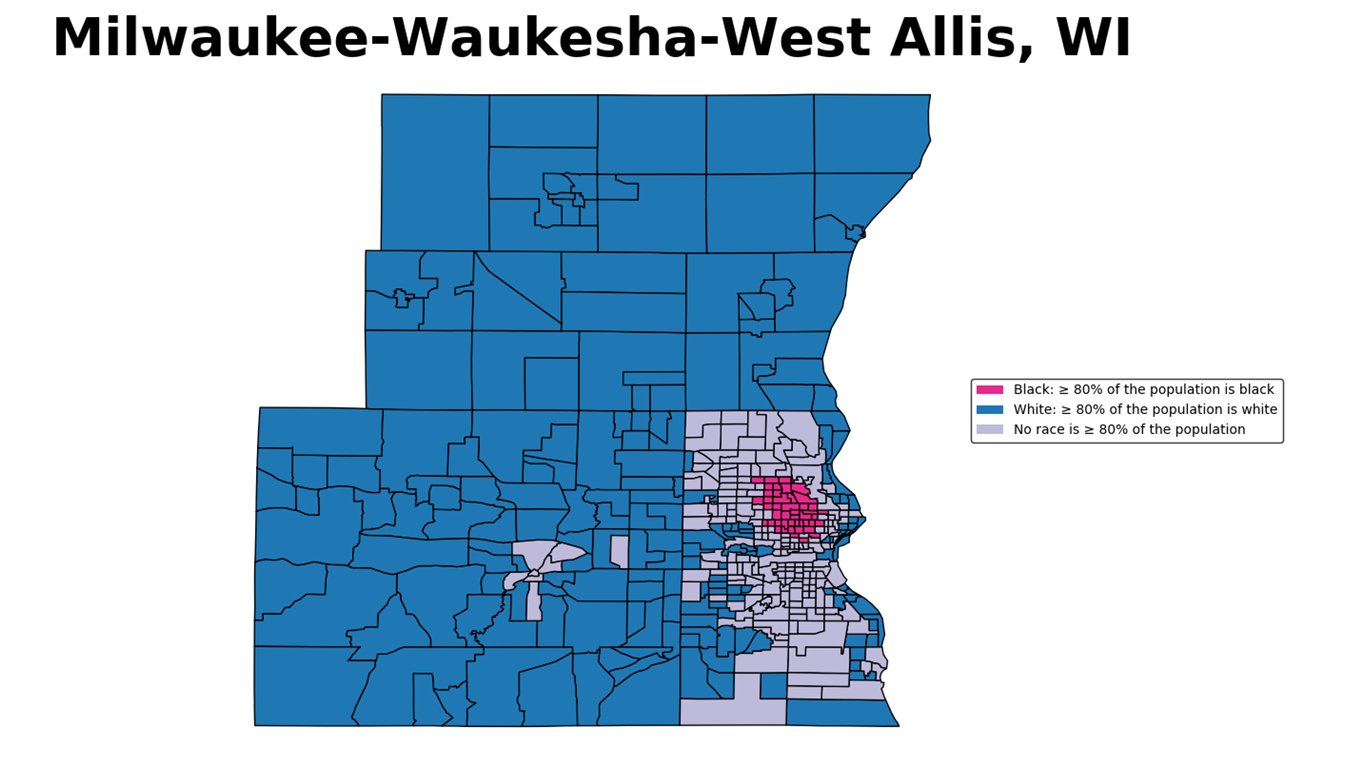
20. Milwaukee-Waukesha-West Allis, WI
> Black pop. in black neighborhoods: 35.2% (91,937)
> Black population: 16.6% (261,429)
> Black poverty rate: 33.7% (88,071)
> White poverty rate: 7.3% (77,667)
Like many Rust Belt cities, Milwaukee’s current segregation patterns can be traced back to discriminatory appraisal maps drawn up by the HOLC. Neighborhoods just north of downtown Milwaukee, such as Halyard Park, Hillside, and Haymarket were deemed hazardous for investment, with assessors citing the area’s African American population as a threat to property values.
Today, 35.2% of black residents in the Milwaukee metro area live in neighborhoods where the majority of residents are black, compared to 16.8% of black Americans nationwide. Some 38.8% of residents in majority-black neighborhoods in Milwaukee live below the poverty line, nearly seven times the 5.8% poverty rate for white neighborhoods.
[in-text-ad]
Click image to enlarge
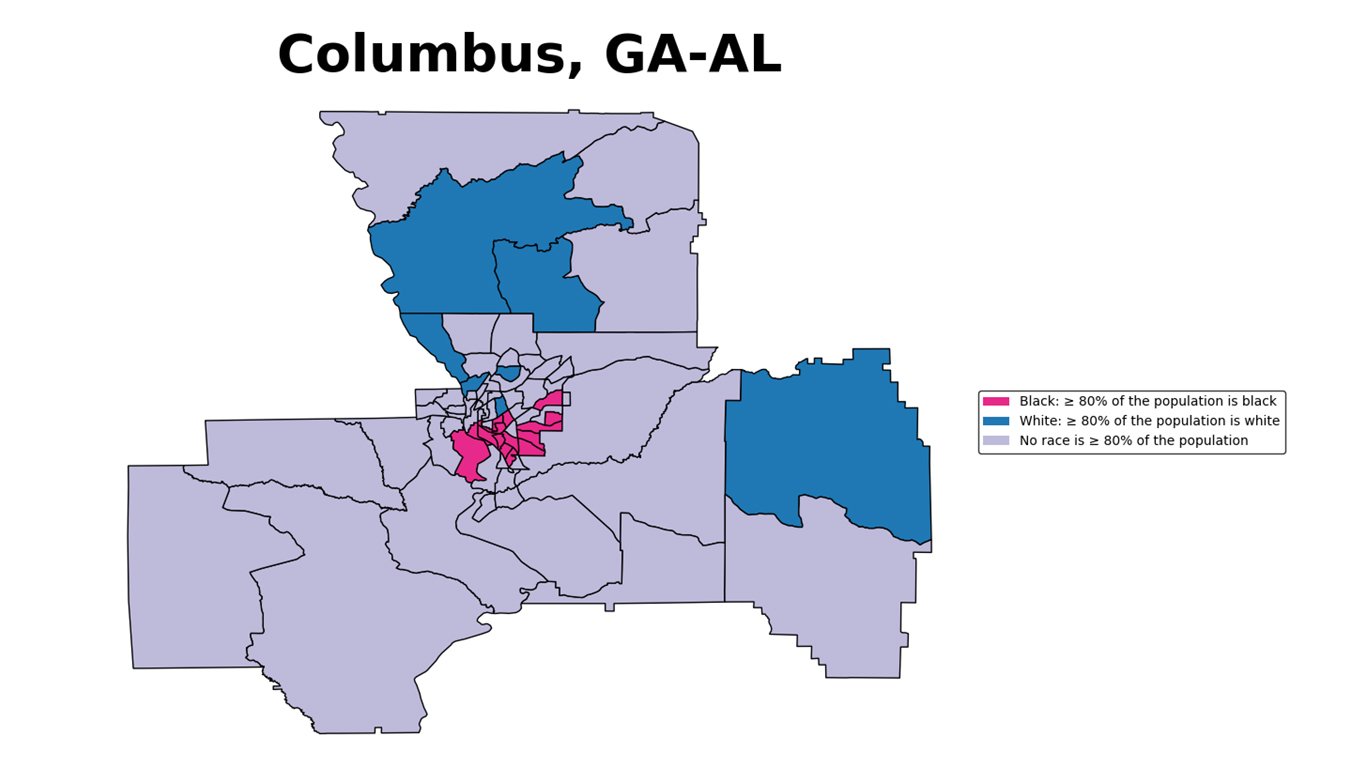
19. Columbus, GA-AL
> Black pop. in black neighborhoods: 36.4% (45,846)
> Black population: 40.6% (126,005)
> Black poverty rate: 27.9% (35,099)
> White poverty rate: 11.2% (16,465)
Columbus is one of four metro areas in Georgia to rank among the 25 most segregated cities in America. An estimated 36.4% of black residents in the Columbus metro area live in predominantly black neighborhoods, more than twice the 16.8% national figure.
Segregation can limit education and employment opportunities for minority communities and contribute to racial disparities in urban areas. In Columbus, while 85.0% of heads of household in white neighborhoods own their homes, just 47.7% of heads of household in black neighborhoods do — one of the larger homeownership gaps nationwide. The poverty rate in black neighborhoods of 33.8% is more than four times greater than the poverty rate in white neighborhoods of 8.0%, also one of the larger gaps of any U.S. city.
[recirclink id=492593]
Click image to enlarge
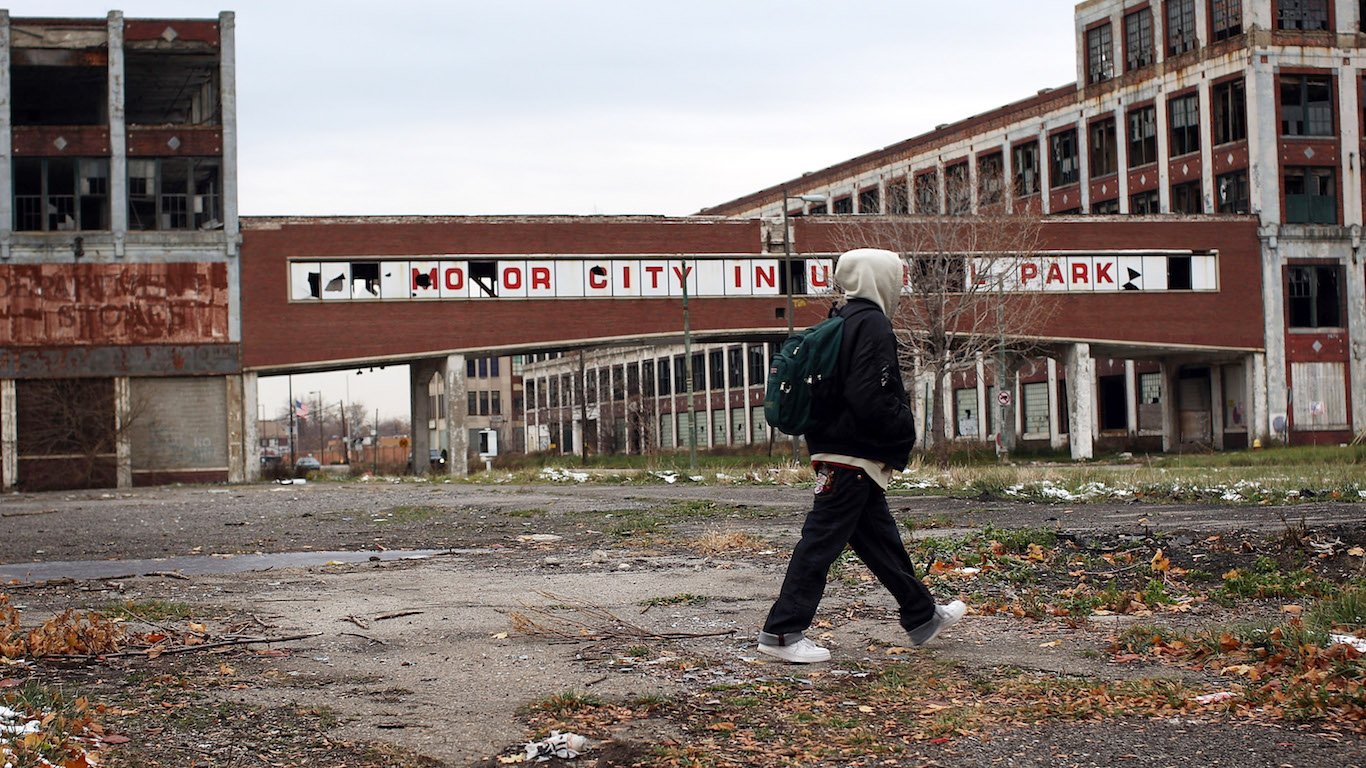
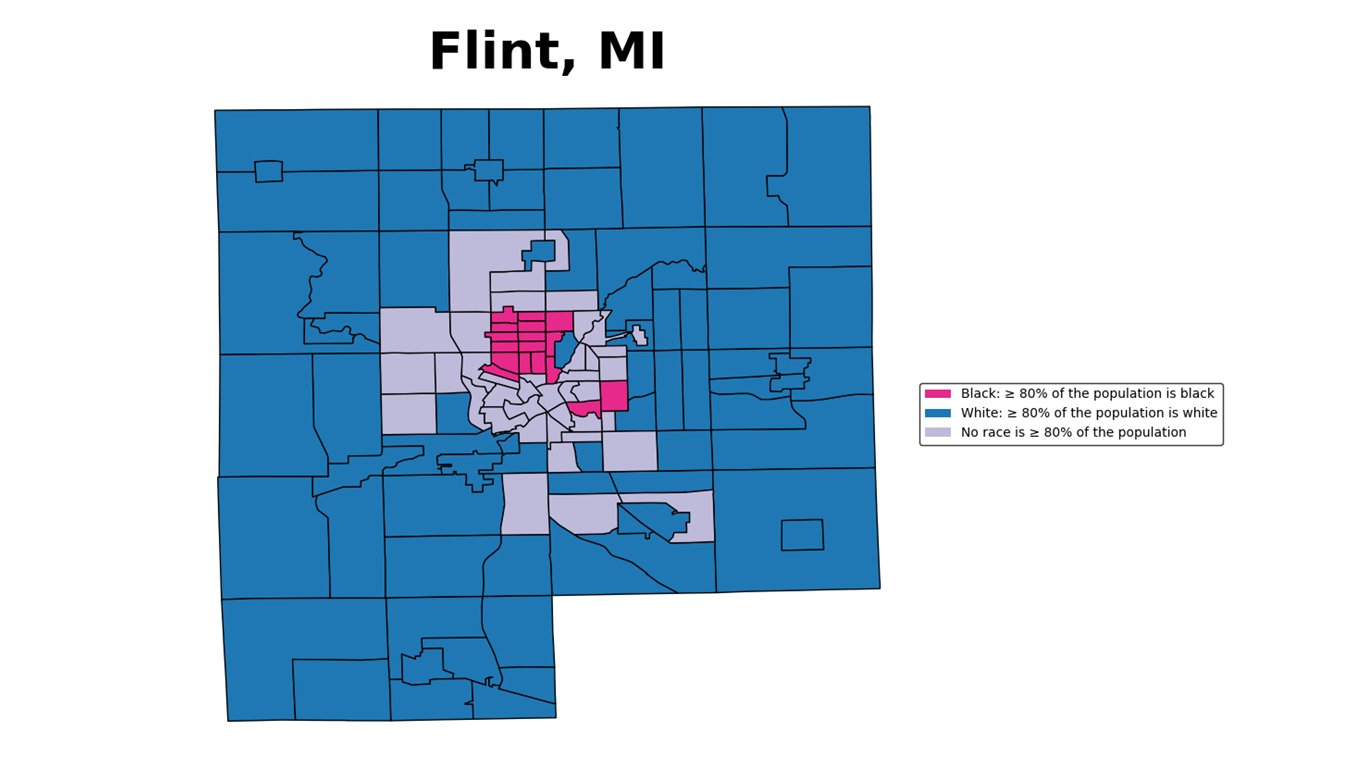
18. Flint, MI
> Black pop. in black neighborhoods: 37.2% (30,591)
> Black population: 20.0% (82,289)
> Black poverty rate: 36.8% (30,317)
> White poverty rate: 14.3% (42,492)
An estimated 37.2% black residents in Flint live in predominantly black neighborhoods, far more than the 16.8% national rate. Residents of predominantly black neighborhoods in Flint are nearly four times as likely to be unemployed and three times as likely to not have a college degree as residents of predominantly white neighborhoods, some of the worst employment and education gaps nationwide.
In 2014, the city of Flint switched its water source from Detroit to the Flint River in order to reduce a budget shortfall. The Environmental Protection Agency quickly confirmed the presence of dangerous levels of lead in the water, which likely led to a 400% spike in pneumonia deaths that year and a slew of other negative health outcomes. Some have used the Flint water crisis an example of environmental racism, a term coined in the 1980s that describes situations in which black Americans are disproportionately exposed to high levels of pollution.
Click image to enlarge
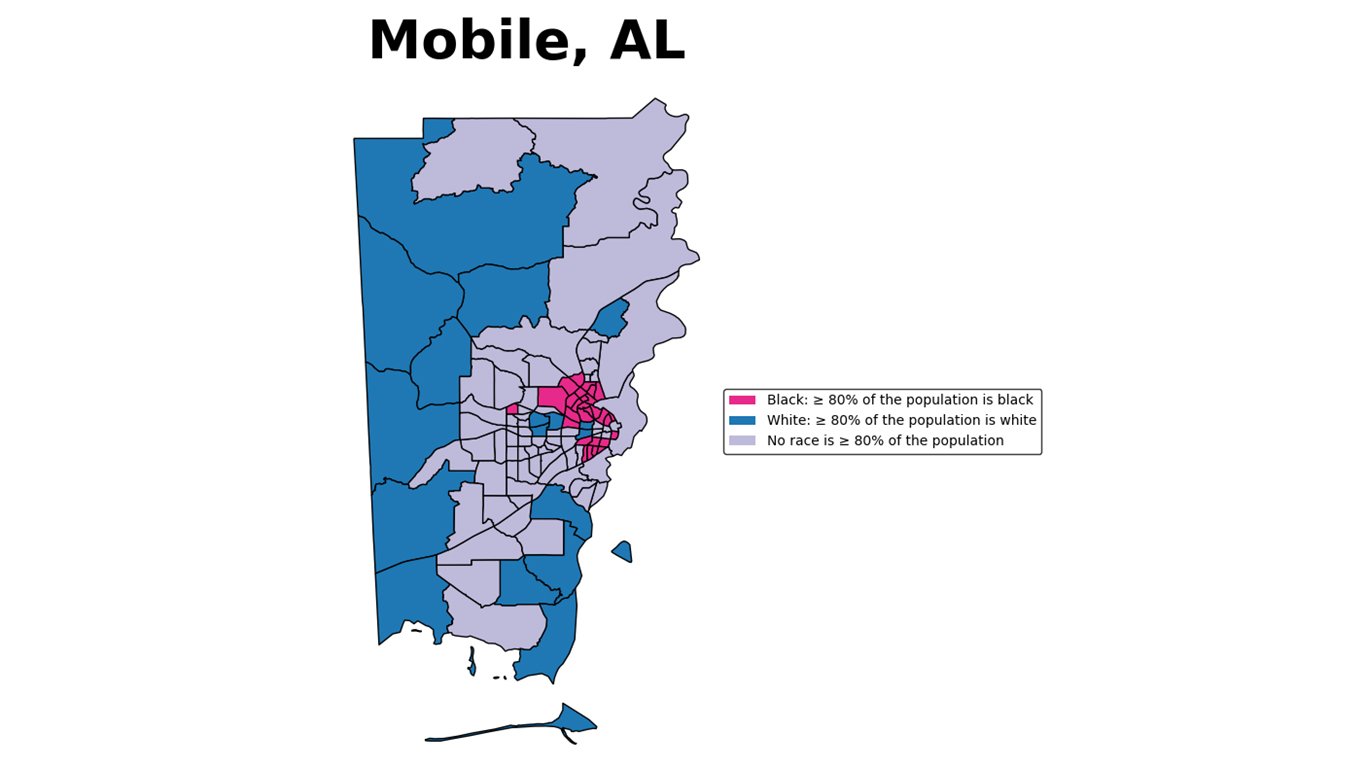
17. Mobile, AL
> Black pop. in black neighborhoods: 38.2% (55,985)
> Black population: 35.3% (146,423)
> Black poverty rate: 29.5% (43,154)
> White poverty rate: 12.0% (28,667)
Mobile is one of three metro areas in Alabama to rank among the most segregated cities in America. An estimated 38.2% of black residents in the metro area live in predominantly black census tracts, more than twice the 16.8% national figure.
Residents of poor, segregated minority neighborhoods often lack access to education and employment opportunities and face major economic disadvantages that can lead to high rates of poverty and unemployment. In Mobile, the poverty rate in majority-black neighborhoods of 36.9% is nearly three times the poverty rate of 12.8% in white neighborhoods. Similarly, the 16.0% unemployment rate in black neighborhoods in the metro area is more than three times the 5.3% unemployment rate in white neighborhoods.
[in-text-ad-2]
Click image to enlarge
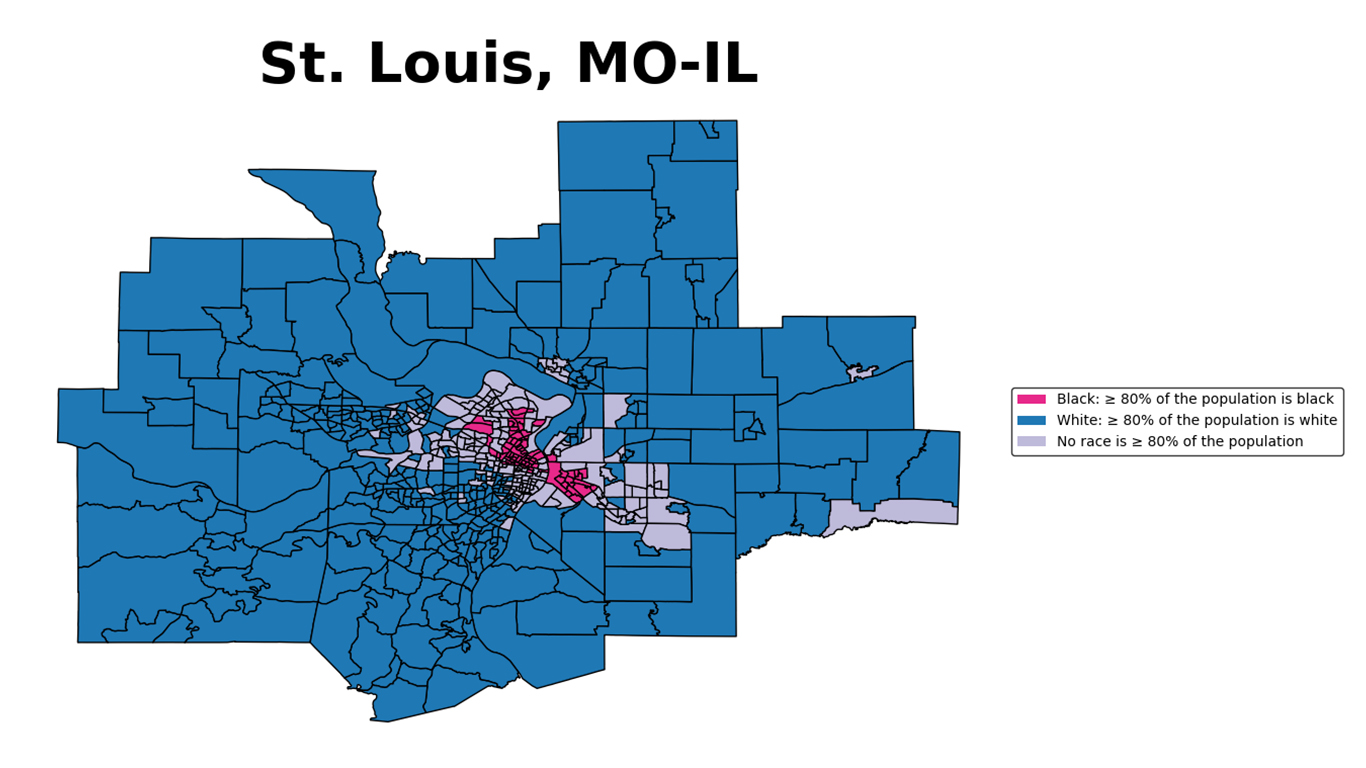
16. St. Louis, MO-IL
> Black pop. in black neighborhoods: 38.3% (196,619)
> Black population: 18.3% (513,403)
> Black poverty rate: 26.4% (135,708)
> White poverty rate: 7.9% (164,836)
An estimated 38.3% of black residents in the St. Louis metro area live in census tracts where more than half of residents are also black, more than twice the 16.8% national figure. Just 12.6% of adults in predominantly black neighborhoods have a bachelor’s degree, compared to 35.0% of adults in white neighborhoods. Similarly, 32.8% of residents in black neighborhoods live in poverty, more than four times the 7.8% poverty rate in white neighborhoods.
Segregation in St. Louis is largely delineated by Delmar Boulevard, an east-west thoroughfare that divides the poor, predominantly black neighborhoods in the north from the wealthier, predominantly white neighborhoods in the south.
Click image to enlarge
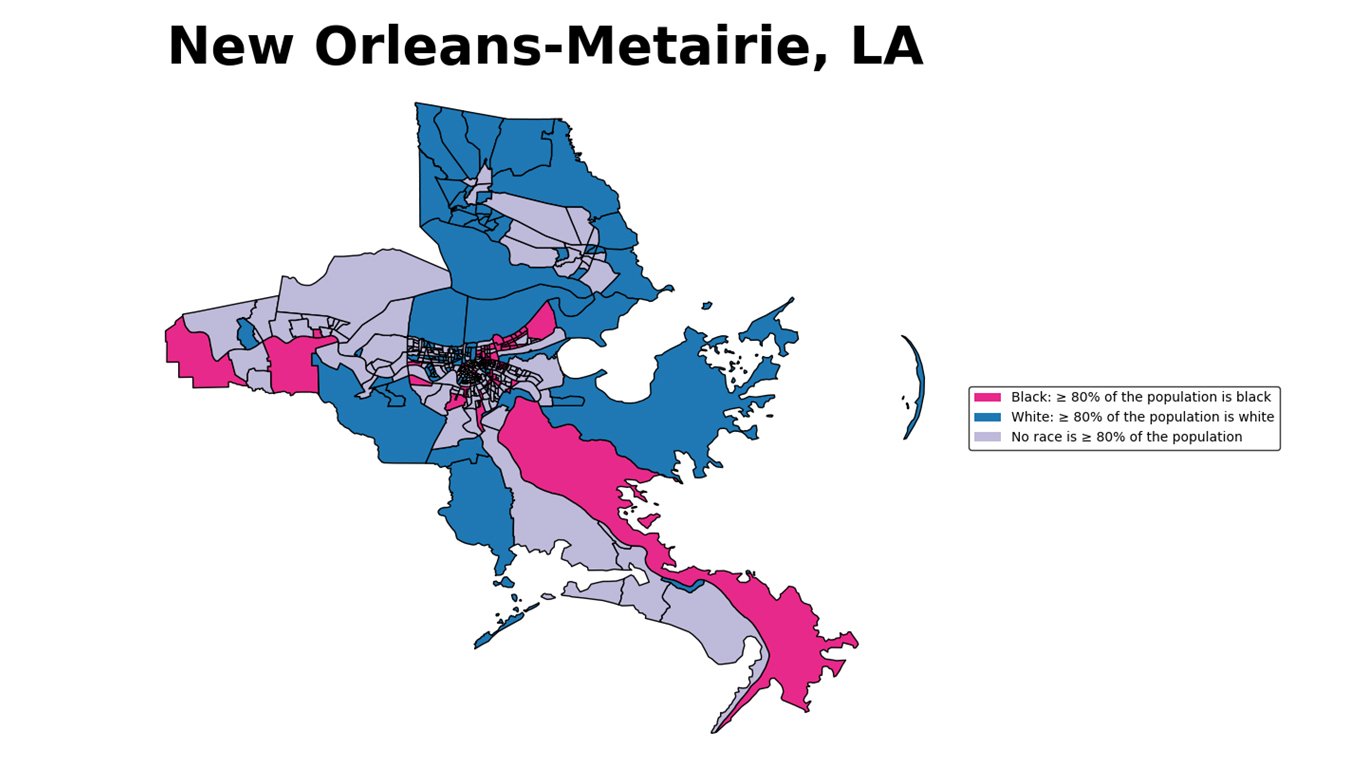
15. New Orleans-Metairie, LA
> Black pop. in black neighborhoods: 39.1% (172,384)
> Black population: 35.0% (441,391)
> Black poverty rate: 29.3% (129,314)
> White poverty rate: 9.4% (61,543)
Like many major U.S. cities, current patterns of segregation in New Orleans were shaped by racist zoning ordinances in the early 20th century, discriminatory, federally-backed appraisal maps starting in the 1930s, and urban renewal projects. Projects such as the Louis Armstrong Park, the Greater New Orleans Bridge, and the Claiborne Avenue elevated highway in the 1950s and 1960s displaced large numbers of black families.
Hurricane Katrina and its aftermath also contributed to segregation in the New Orleans metro area, as rebuilding funds were continuously allocated to higher-value predominantly white neighborhoods over predominantly black neighborhoods. Today, 39.1% of black residents in New Orleans live in predominantly black neighborhoods, far more than the 16.8% national rate.
[in-text-ad]
Click image to enlarge
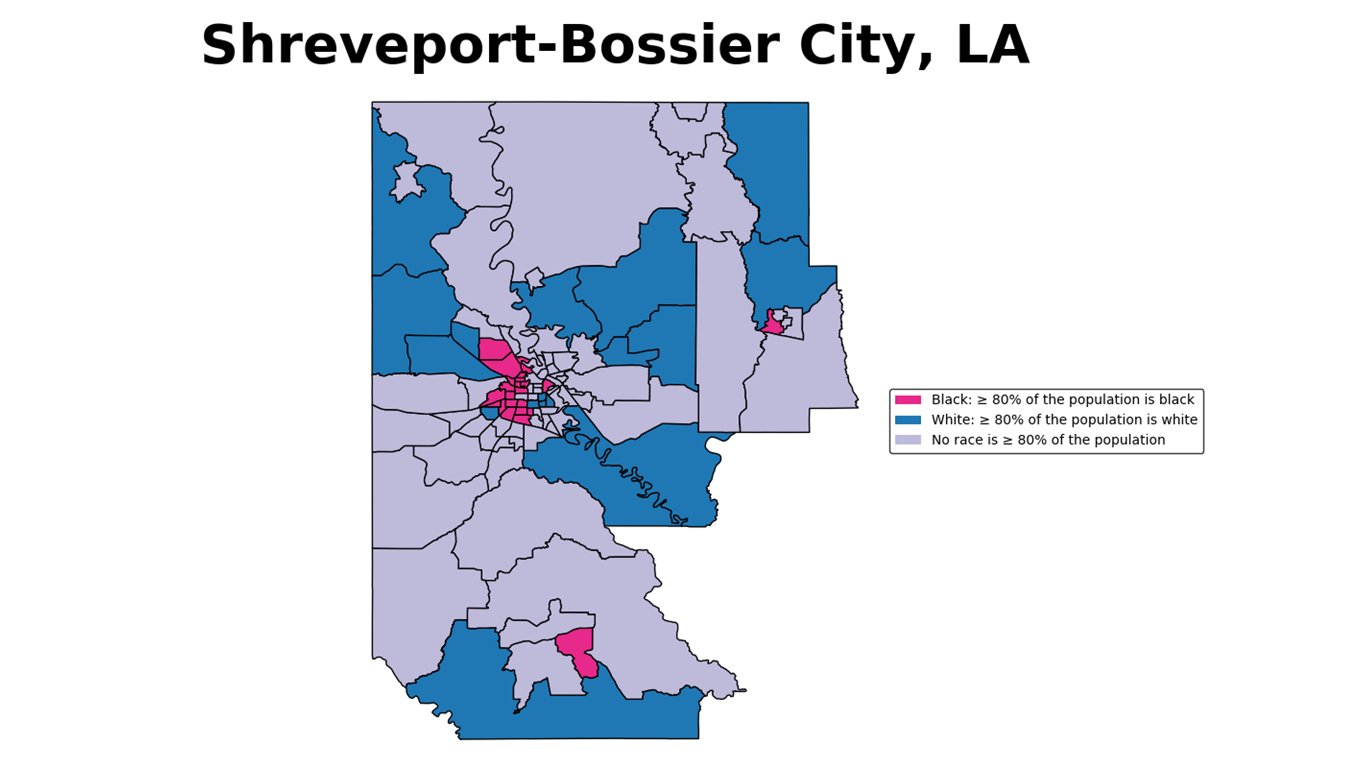
14. Shreveport-Bossier City, LA
> Black pop. in black neighborhoods: 39.4% (68,312)
> Black population: 39.0% (173,216)
> Black poverty rate: 34.2% (59,250)
> White poverty rate: 11.8% (28,428)
An estimated 39.4% of black residents in Shreveport live in neighborhoods where at least half of residents are also black, compared to 16.8% of African Americans nationwide. Some 42.3% of residents of majority-black neighborhoods live in poverty, more than four times the 10.6% poverty rate in white neighborhoods — one of the largest gaps of any U.S. city.
In the mid-20th century, highway and urban renewal projects were often constructed in poor, black neighborhoods, displacing thousands of families and physically segregating minority communities from the rest of the city. In Shreveport, plans are currently underway for a new 3.5-mile stretch of Interstate 49 that would run through the middle of the historically black neighborhood of Allendale and require the demolition of at least one church and 50 homes.
[recirclink id=552140]

Click image to enlarge
13. Birmingham-Hoover, AL
> Black pop. in black neighborhoods: 39.5% (129,365)
> Black population: 28.6% (327,640)
> Black poverty rate: 24.1% (78,825)
> White poverty rate: 10.4% (76,192)
The Birmingham metro area is one of three metropolitan areas in Alabama to rank among the most segregated in America. An estimated 39.5% of black residents in Birmingham-Hoover live in predominantly black census tracts, more than twice the 16.8% national figure.
Segregation often limits education and employment opportunities for poor minority communities, and it can exacerbate racial disparities in urban areas. In Birmingham, the typical white household outearns the typical black household by $25,758 a year, slightly more than the national disparity in median household income. Similarly, black residents in Birmingham are more than twice as likely as white residents to live in poverty and be unemployed.
Click image to enlarge
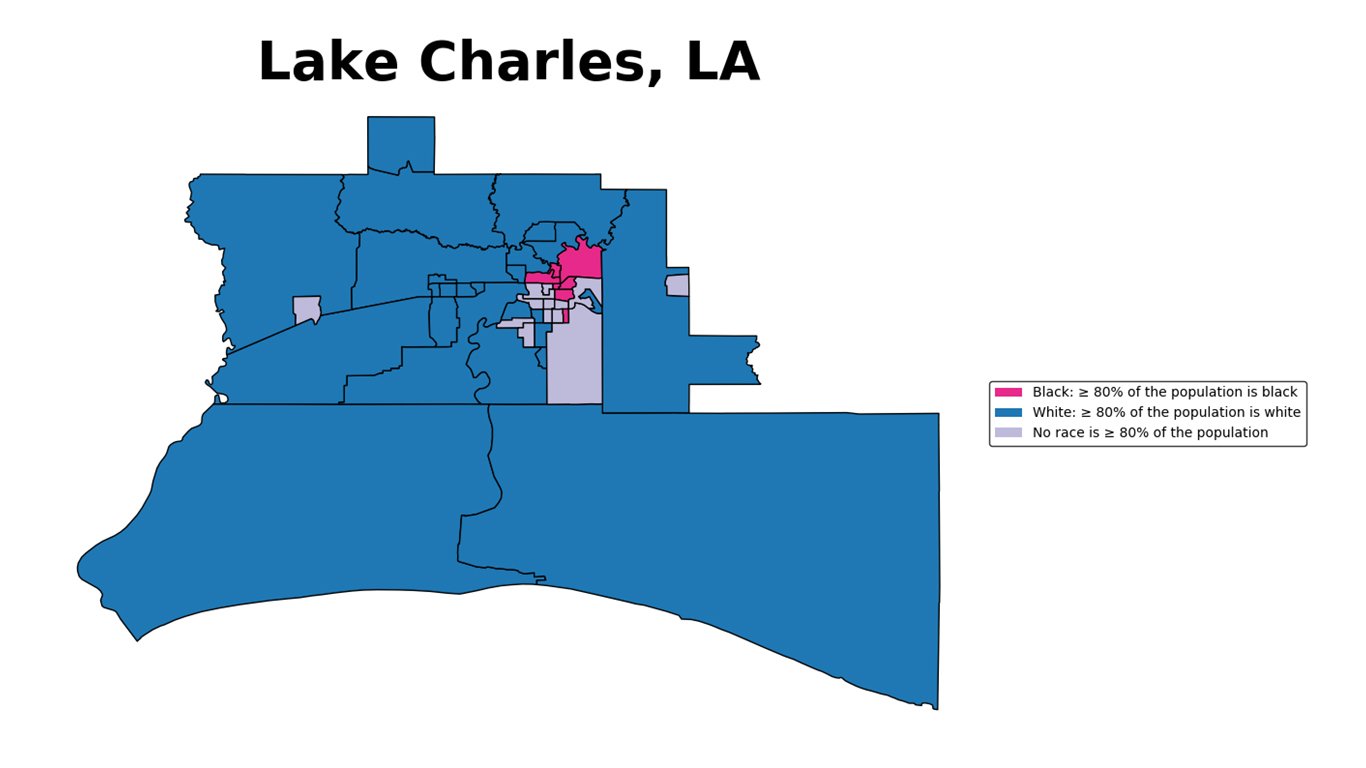
12. Lake Charles, LA
> Black pop. in black neighborhoods: 39.8% (19,631)
> Black population: 24.0% (49,309)
> Black poverty rate: 28.2% (13,922)
> White poverty rate: 11.7% (16,599)
Lake Charles is one of four metro areas in Louisiana to rank among the most segregated cities in America. Some 39.8% of black residents live in predominantly black neighborhoods, and 75.1% of white residents live in predominantly white neighborhoods — each greater than the national segregation rates for blacks of 16.8% and for whites of 39.5%.
Segregation can reduce access to education and employment opportunities for minorities and exacerbate racial disparities. In Lake Charles, the median income of white households is $24,066 greater than the median income for black households, and black residents are more than twice as likely as white residents to be unemployed. While 11.7% of white residents live in poverty, 28.2% of black residents do — a larger poverty gap than across the nation as a whole.
[in-text-ad-2]
Click image to enlarge
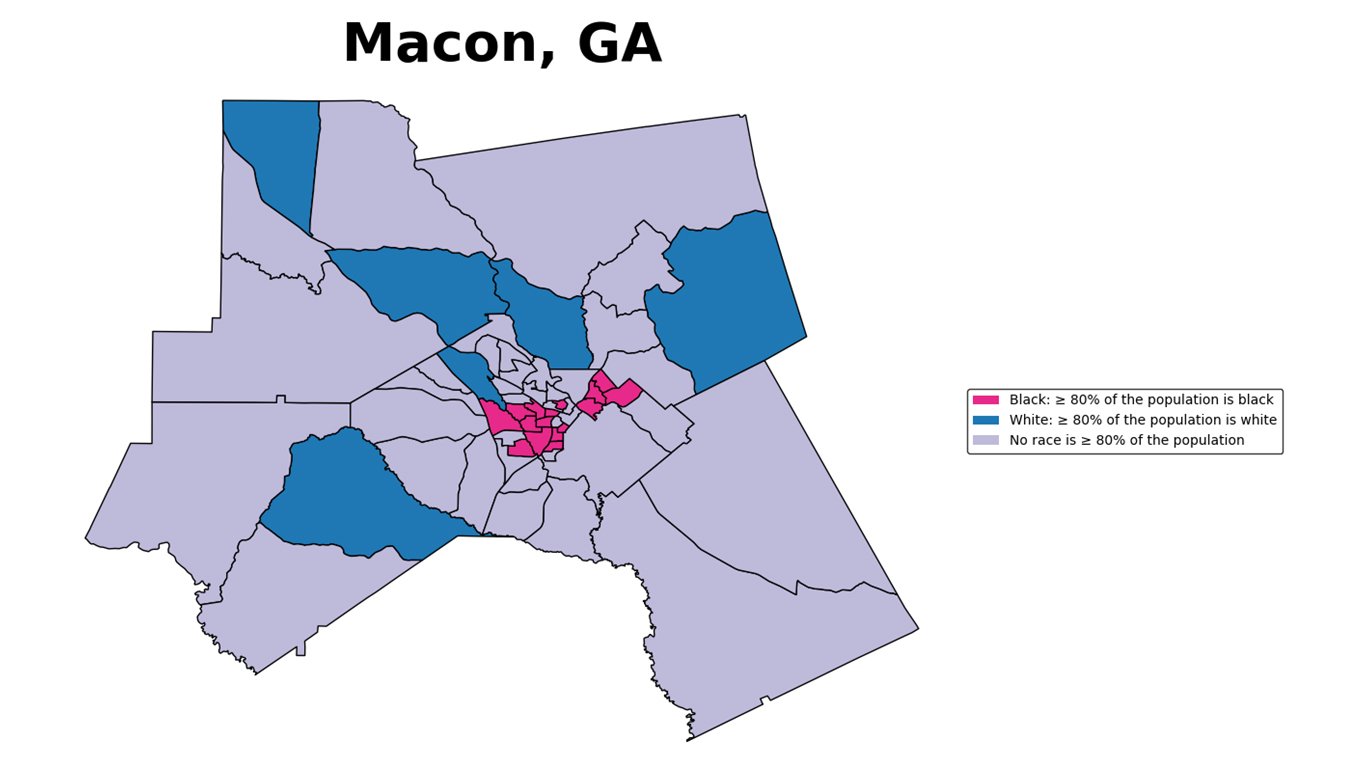
11. Macon, GA
> Black pop. in black neighborhoods: 40.4% (41,762)
> Black population: 44.9% (103,312)
> Black poverty rate: 33.2% (34,302)
> White poverty rate: 11.9% (13,606)
An estimated 40.4% of black residents live in predominantly black neighborhoods, more than twice the 16.8% national figure. Residential segregation has likely contributed to de facto school segregation in Macon and surrounding Bibb County. According to local newspaper The Telegraph, the number of white students relative to black students in Bibb County public schools dropped by more than 40% over the last 20 years, and today nearly 25% of white students in the county currently attend just one charter school.
Educational segregation likely exacerbates racial disparities in educational attainment. Just 9.4% of adults in majority-black neighborhoods in Macon have a bachelor’s degree, far less than the 31.7% college attainment rate in majority-white neighborhoods.
Click image to enlarge
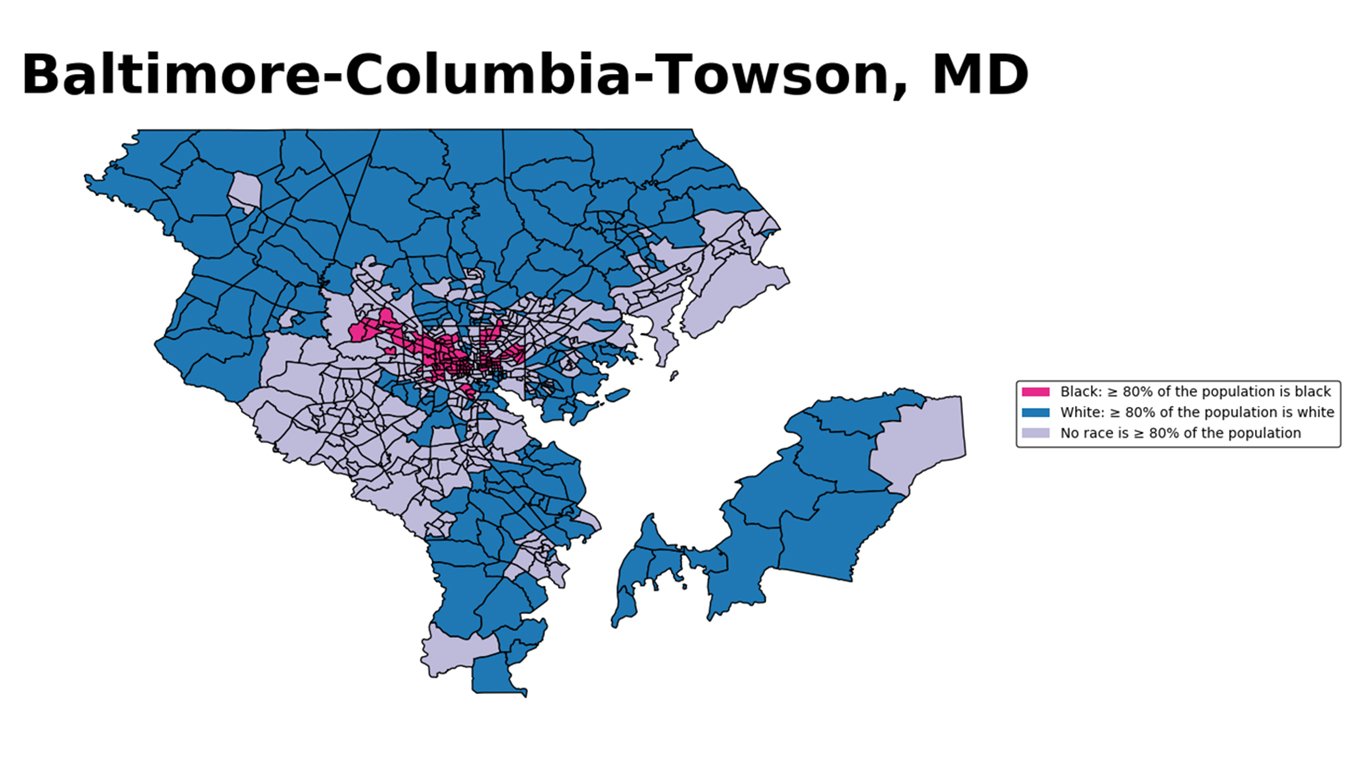
10. Baltimore-Columbia-Towson, MD
> Black pop. in black neighborhoods: 41.0% (333,272)
> Black population: 29.1% (812,786)
> Black poverty rate: 17.7% (143,580)
> White poverty rate: 6.2% (99,464)
Despite being one of the first cities targeted by the Congress of Racial Equality to end racial injustice during the civil rights movement, Baltimore remains one of the most segregated cities in the country to this day. Some 41.0% of black residents live in predominantly black neighborhoods, far greater than the 16.8% of African Americans living in black neighborhoods nationwide.
Segregation can limit access to education and employment opportunities for minorities and contribute to racial disparities in urban areas. Some 18.6% of adults in majority-black neighborhoods in Baltimore have a bachelor’s degree, far less than the 42.9% college attainment rate in white neighborhoods. An estimated 23.8% of residents of black neighborhoods live in poverty, nearly five times the 5.2% poverty rate in white neighborhoods.
[in-text-ad]
Click image to enlarge
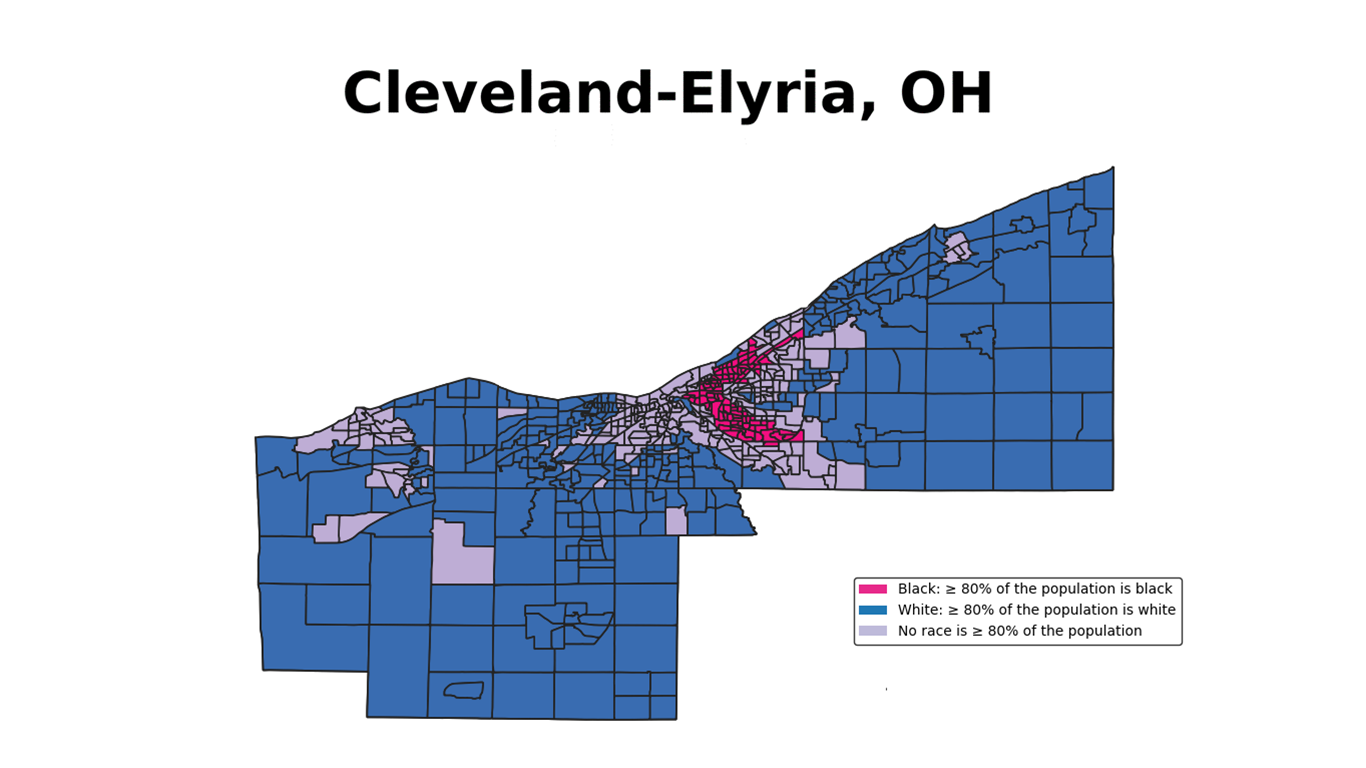
9. Cleveland-Elyria, OH
> Black pop. in black neighborhoods: 42.0% (172,657)
> Black population: 19.9% (410,657)
> Black poverty rate: 32.3% (132,823)
> White poverty rate: 8.6% (124,431)
Like many Rust Belt cities, Cleveland’s current segregation patterns can be traced back to discriminatory zoning practices and racial housing covenants used during the influx of black residents in the early 20th century. Later, the outbound migration of white families moving to the suburbs in the 1960s exacerbated segregation.
Today, 42.0% of black residents in Cleveland live in predominantly black neighborhoods, far more than the 16.8% national figure. Some 39.6% of residents of predominantly black neighborhoods live in poverty, nearly six times the 6.7% poverty rate in white neighborhoods.
[recirclink id=549145]
Click image to enlarge
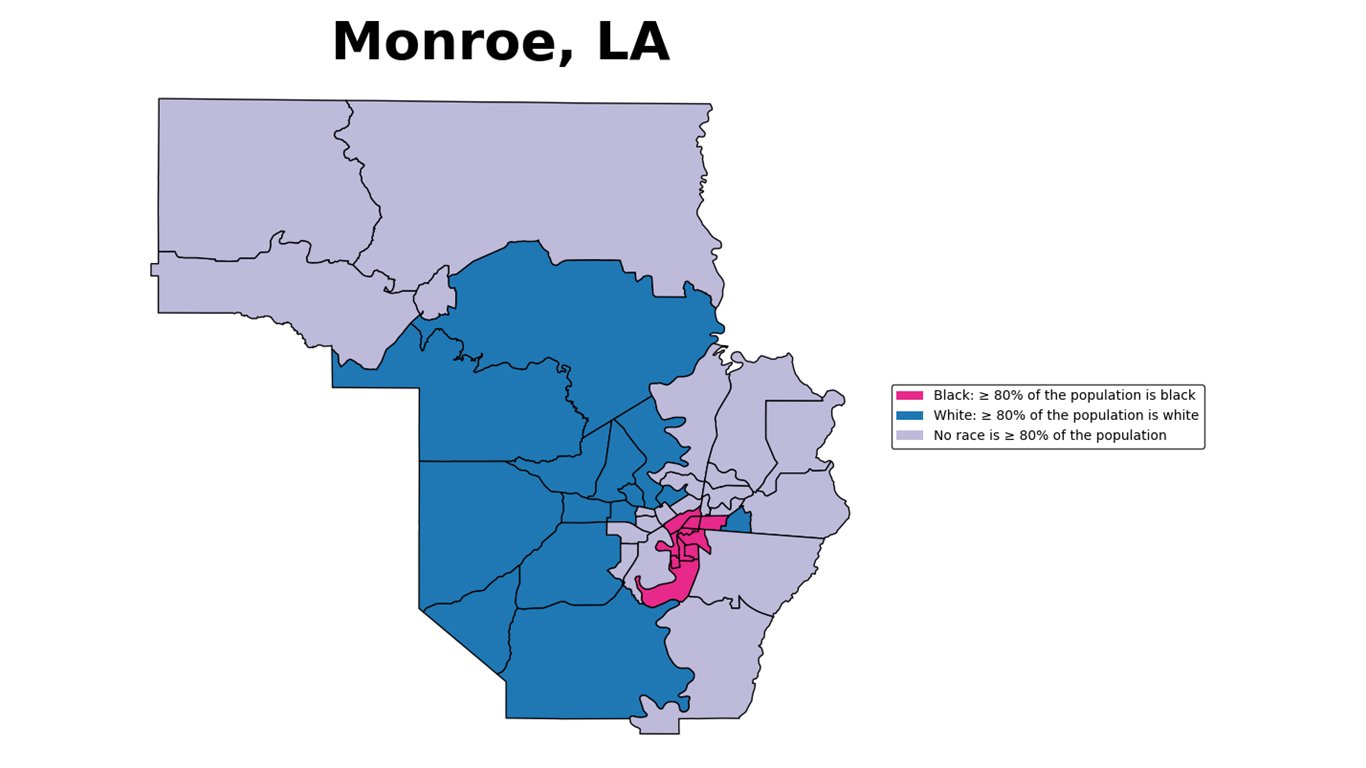
8. Monroe, LA
> Black pop. in black neighborhoods: 42.5% (27,384)
> Black population: 36.0% (64,360)
> Black poverty rate: 39.7% (25,561)
> White poverty rate: 12.9% (13,775)
Monroe is one of four metro areas in Georgia to rank among the most segregated cities in America. An estimated 42.5% of black residents live in predominantly black neighborhoods, more than double the 16.8% national figure and the eighth largest share of any U.S. city.
Segregation often limits access to education and employment opportunities in minority neighborhoods and can significantly contribute to racial disparities in urban areas. In Monroe, just 73.6% of adults in majority-black neighborhoods have a high school diploma, compared to 90.5% of adults in majority-white neighborhoods — one of the largest high school attainment gaps nationwide. While 13.2% of residents in white neighborhoods live in poverty, 48.0% of residents in predominantly black neighborhoods do — also one of the largest gaps of any U.S. city.
Click image to enlarge
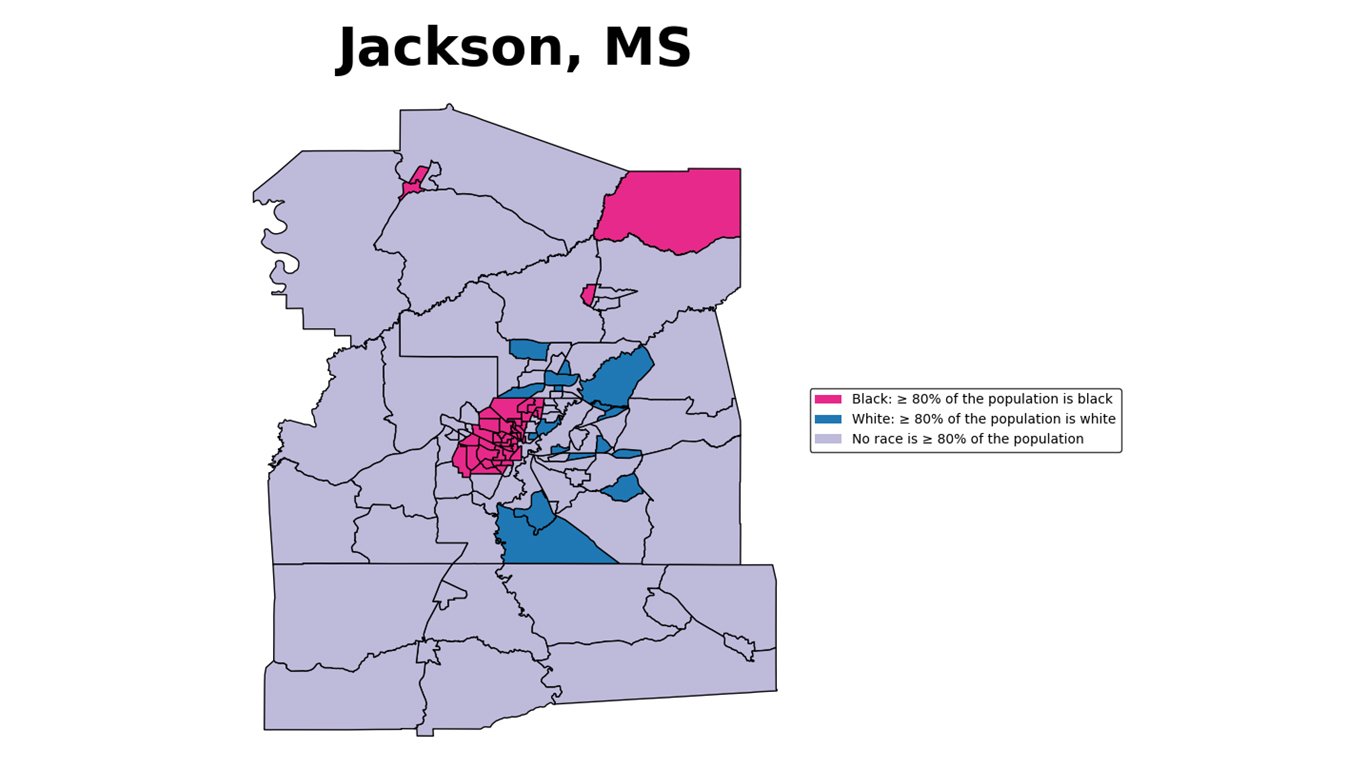
7. Jackson, MS
> Black pop. in black neighborhoods: 45.3% (128,925)
> Black population: 49.2% (284,499)
> Black poverty rate: 26.7% (76,058)
> White poverty rate: 8.3% (22,328)
An estimated 45.3% of black residents in Jackson live in neighborhoods that are predominantly black, more than 2.5 times the 16.8% national figure. Segregation can contribute to racial disparities in urban areas, and in Jackson, black residents are more than three times as likely to be unemployed and live in poverty as white residents.
Mississippi has a long history of state-sanctioned segregation, and it was still litigating issues related to de jure segregation and the Brown v. Board of Education decision up until several years ago. As recently as 2017, a school district in Cleveland, Mississippi — roughly two hours northwest of Jackson — conceded to integrate its two racially divided high schools and two middle schools into one high school and one middle school after 50 years of litigation.
[in-text-ad-2]

Click image to enlarge
6. Memphis, TN-MS-AR
> Black pop. in black neighborhoods: 46.4% (291,314)
> Black population: 46.7% (627,245)
> Black poverty rate: 26.8% (167,827)
> White poverty rate: 8.5% (50,767)
An estimated 46.4% of the black population in Memphis lives in neighborhoods where more than half of the residents are also black, far more than the 16.8% national share. Segregated black neighborhoods often lack access to education and employment opportunities and are more likely to struggle with poverty than white neighborhoods in racially divided cities.
In Memphis, just 13.8% of adults in majority-black neighborhoods have a bachelor’s degree, compared to 42.4% of adults in majority-white neighborhoods — one of the largest gaps in college attainment of any city. The difference in median income between black and white households in Memphis is nearly $33,000, and 33.2% of residents of black neighborhoods live in poverty — more than five times the 6.5% poverty rate in white neighborhoods.
Click image to enlarge
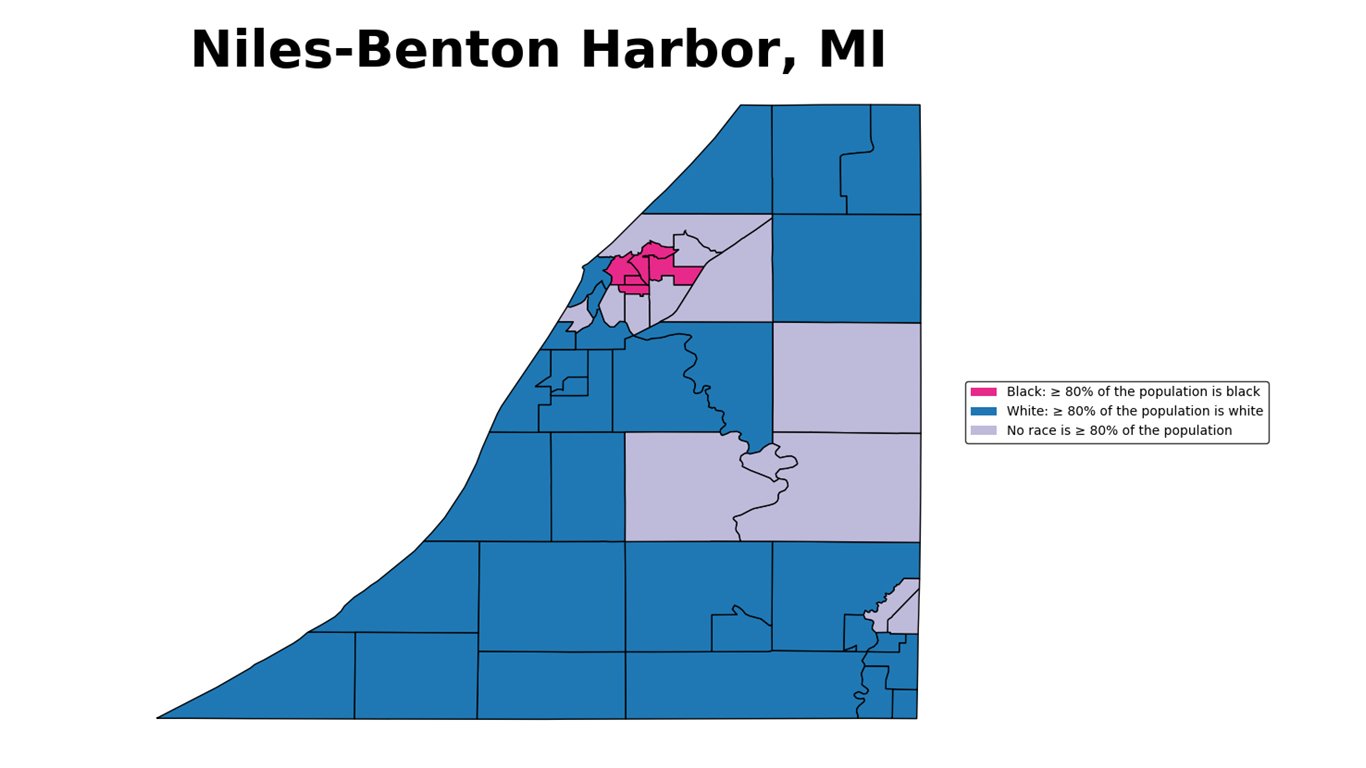
5. Niles-Benton Harbor, MI
> Black pop. in black neighborhoods: 47.2% (10,779)
> Black population: 14.7% (22,829)
> Black poverty rate: 39.0% (8,892)
> White poverty rate: 11.4% (13,321)
Some 47.2% of black residents in the Niles-Benton Harbor metro area live in predominantly black neighborhoods. Niles-Benton Harbor is one of three metro areas on this list in Michigan, which has one of the most segregated public school systems in the country. According to a 2017 report from the Associated Press, 40% of black students in Michigan are in public schools where the student body is more than 90% black, the largest share of any state other than Mississippi.
Niles-Benton Harbor has one of the worst disparities in high school attainment of any city. The high school attainment rate of 92.1% in majority-white neighborhoods is roughly 20 percentage points above the 72.4% attainment rate for majority-black neighborhoods, twice the disparity in high school attainment for the nation as a whole.
[in-text-ad]
Click image to enlarge
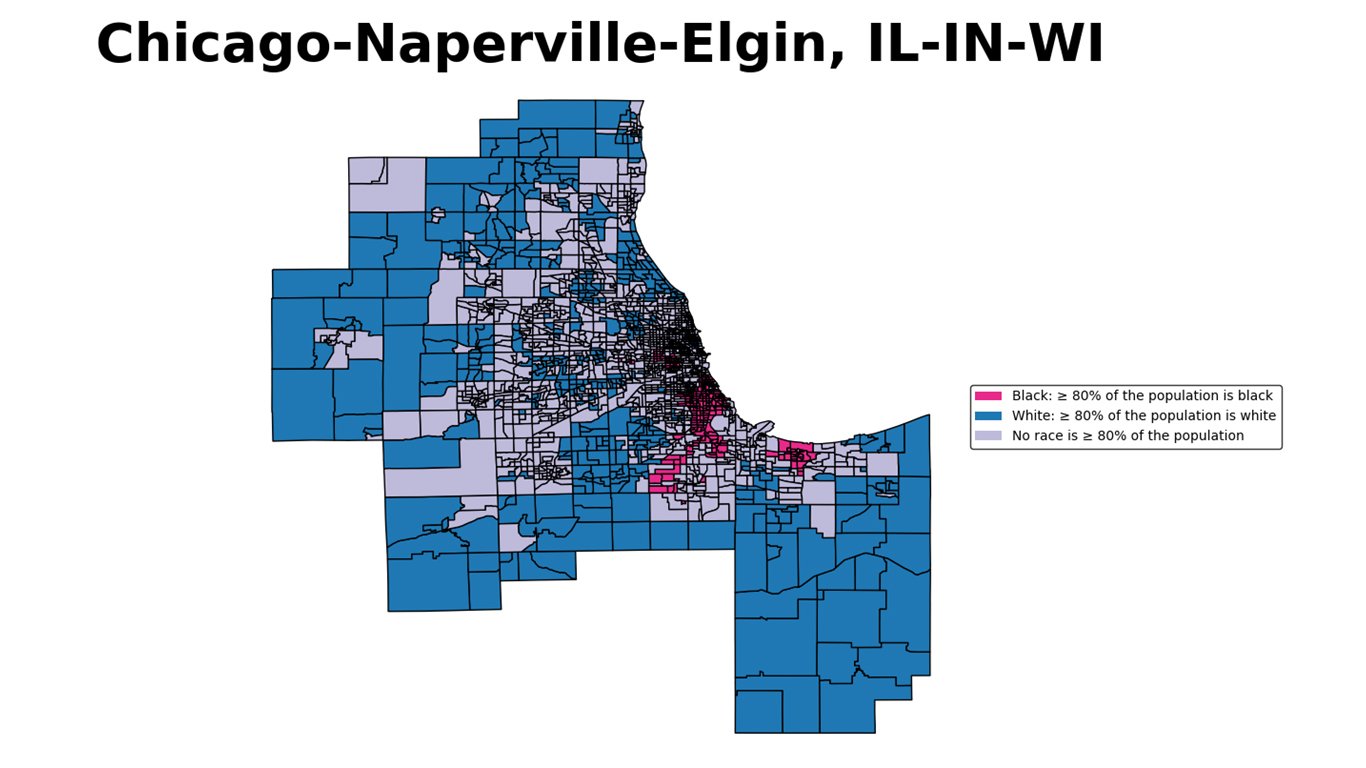
4. Chicago-Naperville-Elgin, IL-IN-WI
> Black pop. in black neighborhoods: 48.2% (770,128)
> Black population: 16.7% (1.6 million)
> Black poverty rate: 26.5% (423,734)
> White poverty rate: 6.8% (347,878)
Like in many Midwestern cities, government officials and property owners in Chicago used discriminatory zoning practices and racially restrictive housing covenants to exclude black residents from certain neighborhoods in the early 20th century. Property in as much as 80% of the city was bound by restrictive covenants by 1927, with African Americans mostly limited to an area known as the “Black Belt” in South Side Chicago.
Today, 48.2% of Chicago’s 1.6 million African American residents live in majority-black neighborhoods, many in the South Side. Residents of majority-black neighborhoods are more than half likely to go to college as residents of white neighborhoods, and they are more than four times as likely to be unemployed.
[recirclink id=504442]
Click image to enlarge
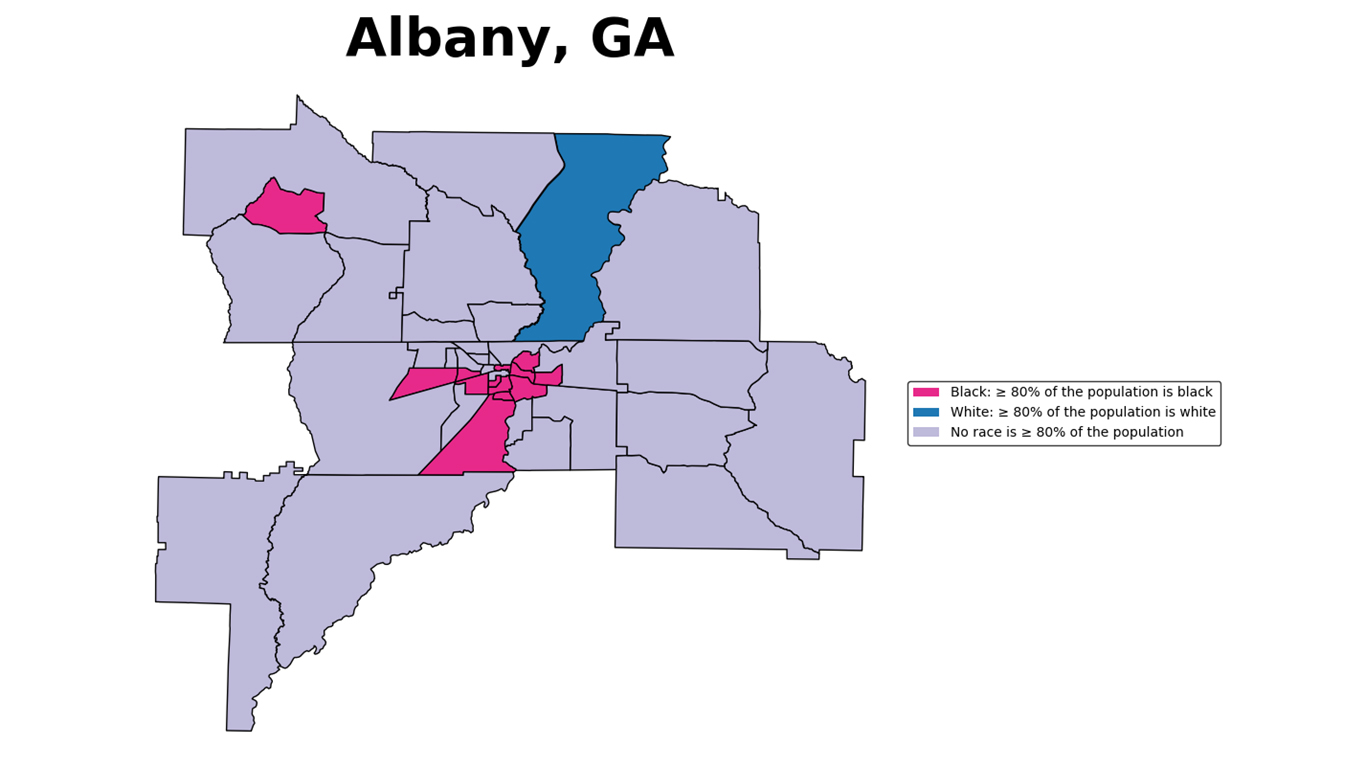
3. Albany, GA
> Black pop. in black neighborhoods: 51.1% (41,493)
> Black population: 52.8% (81,244)
> Black poverty rate: 33.9% (27,517)
> White poverty rate: 13.0% (8,342)
Albany is one of four Georgia metro areas to rank among the most segregated cities. An estimated 51.1% of black residents live in predominantly black neighborhoods, the third largest share of any metro area nationwide and more than three times the 16.8% national rate.
In neighborhoods where more than half of the population is black, 43.8% of residents live in poverty, far more than the 29.7% national figure and the 12.3% poverty rate for majority-white neighborhoods in the metro area. Similarly, 20.6% of the labor force in predominantly black neighborhoods in Albany is unemployed, far more than the 15.5% comparable national figure and the 9.1% unemployment rate in majority-white neighborhoods in the metro area.
Click image to enlarge
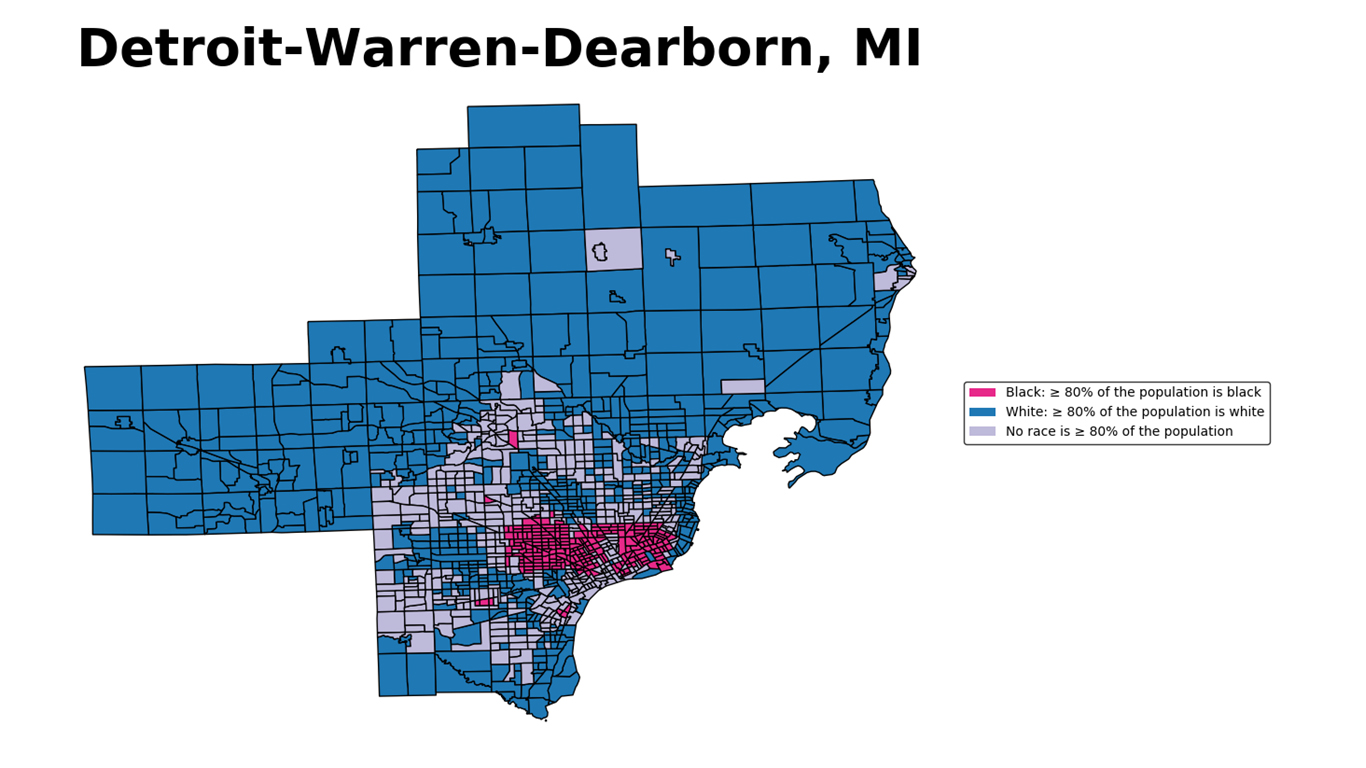
2. Detroit-Warren-Dearborn, MI
> Black pop. in black neighborhoods: 52.4% (503,656)
> Black population: 22.3% (960,838)
> Black poverty rate: 29.9% (287,682)
> White poverty rate: 10.2% (292,703)
Like in many Rust Belt cities, segregation in Detroit was exacerbated after the Great Migration of the mid-20th century, as Detroit residents fought to keep new black residents seeking auto factory jobs out of their neighborhoods. As Detroit deindustrialized after WWII, large waves of wealthy white families left the city center for the suburbs, draining the city’s tax base and depriving its poorer residents of necessary public services and infrastructure. Racial tensions in Detroit culminated in major race riots in 1943 and 1967 that resulted in dozens of deaths, hundreds of injuries, and more than 1,000 buildings burned.
Today, 52.4% of black residents in the Detroit metro area live in neighborhoods that are predominantly black — more than three times the 16.8% national black segregation rate.
[in-text-ad-2]
Click image to enlarge
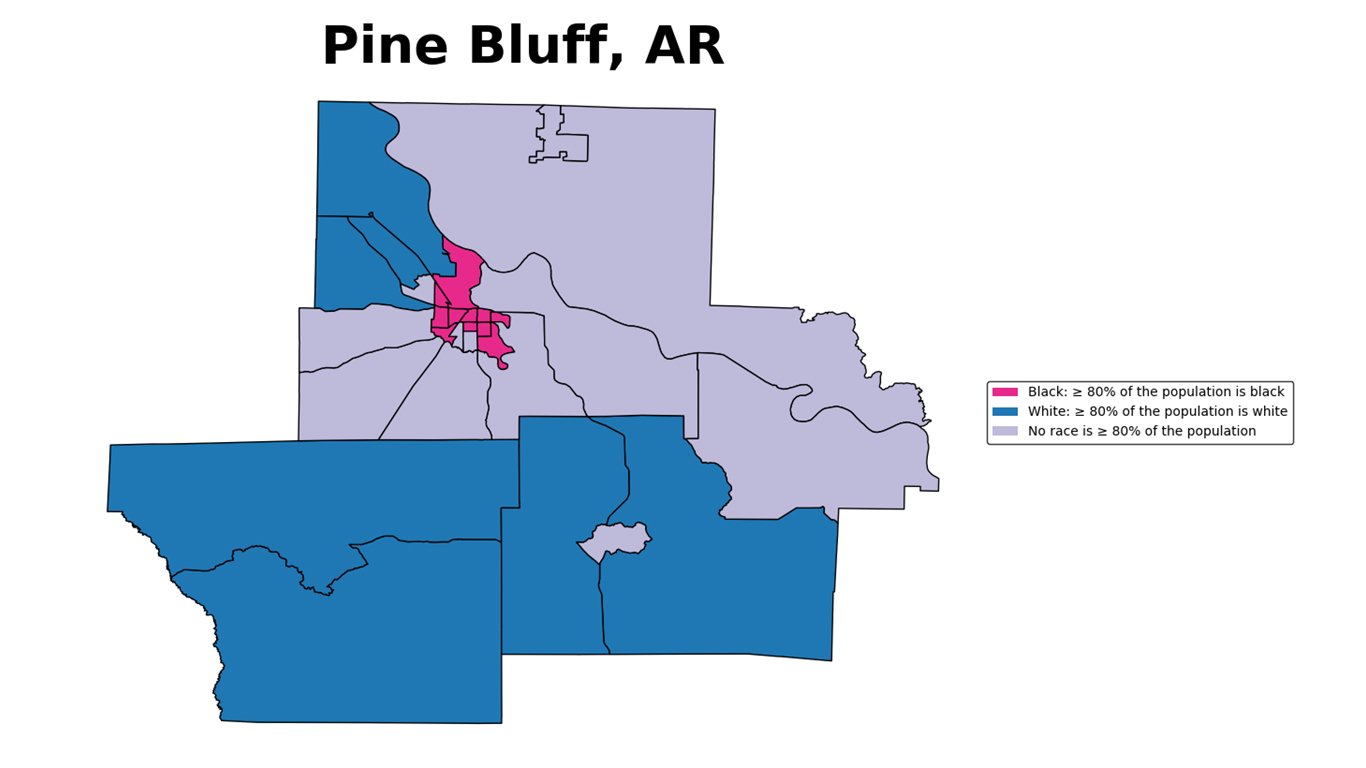
1. Pine Bluff, AR
> Black pop. in black neighborhoods: 53.9% (24,523)
> Black population: 48.6% (45,495)
> Black poverty rate: 27.7% (12,623)
> White poverty rate: 13.9% (6,172)
The site of the Pine Bluff student sit-in movement of 1963, today Pine Bluff is the most segregated metro area in the country. An estimated 53.9% of the black population of Pine Bluff lives in predominantly black neighborhoods, more than three times the 16.8% national figure.
Although segregation often exacerbates racial inequality, Pine Bluff is one of America’s poorest cities and has relatively small achievement gaps between white and black neighborhoods. While nationwide residents of majority-black neighborhoods are 3.4 times more likely to live in poverty as residents of white neighborhoods, in Pine Bluff they are only 1.9 times more likely. Additionally, Pine Bluff is one of only two metro areas in which a larger share of residents have a bachelor’s degree in black neighborhoods than white neighborhoods.
Methodology
To identify America’s most segregated cities, 24/7 Wall St. calculated the percentage of a metropolitan area’s black residents who live in majority black census tracts — statistical subdivisions with an average of about 4,000 people. The greater the share of black metro residents living in the area’s racially homogenous neighborhoods, the greater the degree of segregation. We only considered census tracts with at least 500 residents. Population data are based on five-year estimates through 2017 from the U.S. Census Bureau’s American Community Survey. For the purpose of this story, we only considered segregation of white and black populations.
We also reviewed median household income, poverty rates, educational attainment rates, unemployment rates, and homeownership rates among black and white populations in each metro area from the ACS. All data are five-year estimates.
Contact [email protected] for any questions or corrections.