America’s Fastest Shrinking Housing Markets
More than a decade has passed since the U.S. housing bubble burst and the 2008 financial crisis began. Home prices in major cities across the country lost about a third of their value during the recession but national prices have…

More than a decade has passed since the U.S. housing bubble burst and the 2008 financial crisis began.
Home prices in major cities across the country lost about a third of their value during the recession but national prices have since recovered and even surpassed pre-crisis levels. And though home prices are now close to their highest levels of all time, the recovery has been largely uneven. While prices in the vast majority of housing markets are growing, in a handful, prices have actually declined in the past year.
Based on median single-family home price changes over the year through the second quarter of 2019 from the National Association of Realtors, 24/7 Wall St. reviewed the fastest shrinking housing markets. Single-family home price data for the 180 metropolitan areas reviewed came from the National Association of Realtors. Income data came from the U.S. Census Bureau’s American Community Survey.
The decline in home prices in these markets, in some cases, represents part of a longer-term trend of low-demand for housing in a market that continues to struggle due to a weak economy. This is the case for places like Peoria, Illinois, and Binghamton, New York, where the typical home costs over $100,000 less than the national median of $279,000. Economic struggles may not only affect residents’ ability to afford housing, but may also push some away, leading to even lower housing demand. Some cities on this list are among America’s fastest shrinking cities.
Not all of the housing markets on this list fall into this group, however. Some of the metro areas with declining home prices are among the healthiest and most in-demand housing markets in the country. For example, while home prices have declined in San Jose and San Francisco, the two cities remain the second most expensive and most expensive markets in the country. In these cases, the home price declines may be a correction in an unaffordable market where prices were too high. These are America’s 25 least affordable housing markets.
Click here to see the fastest shrinking housing markets
Click here to see the fastest growing housing markets
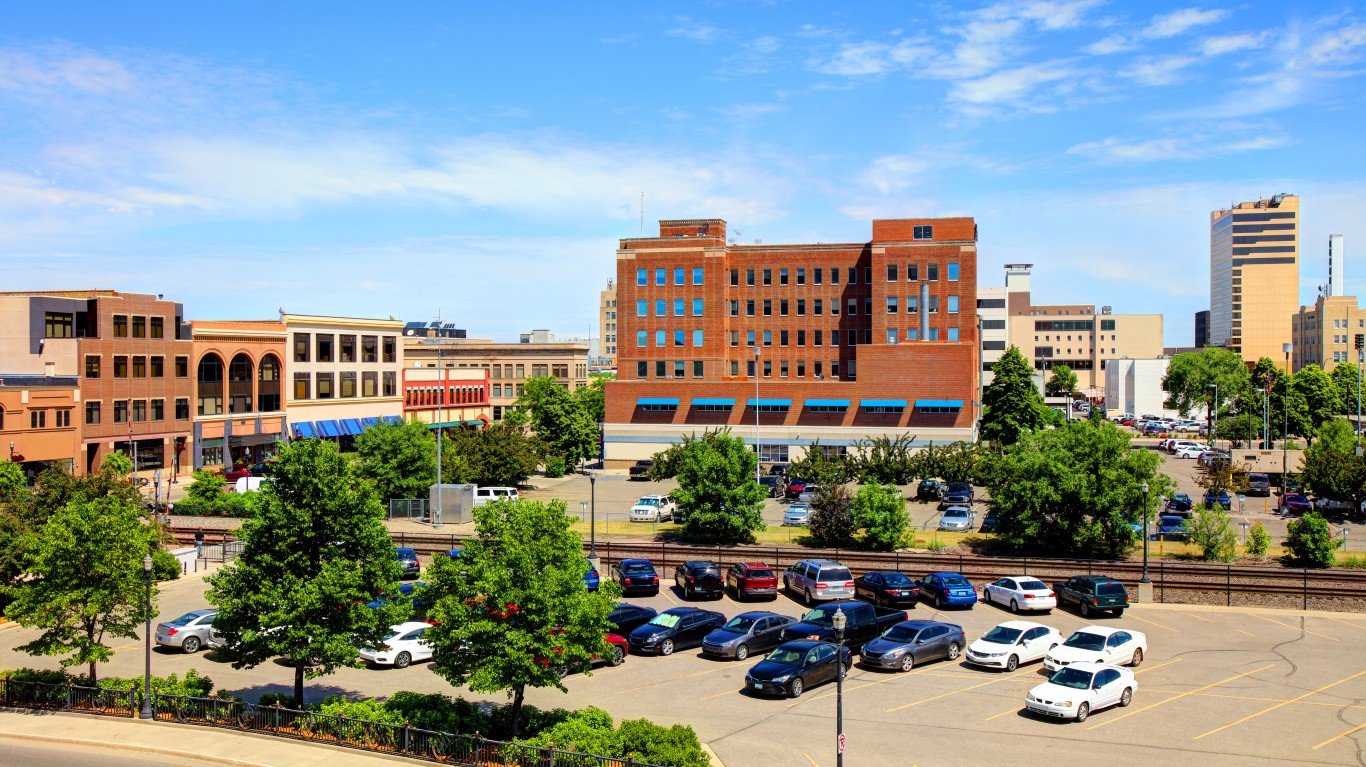
16. Fargo, ND-MN
> 1-yr. chg. in median home sale price: -0.4%
> Median home sale price 2018 Q2: $219,800
> Median home sale price 2019 Q2: $219,000
> Median household income: $63,353

15. Bridgeport-Stamford-Norwalk, CT
> 1-yr. chg. in median home sale price: -0.6%
> Median home sale price 2018 Q2: $473,100
> Median home sale price 2019 Q2: $470,100
> Median household income: $91,198
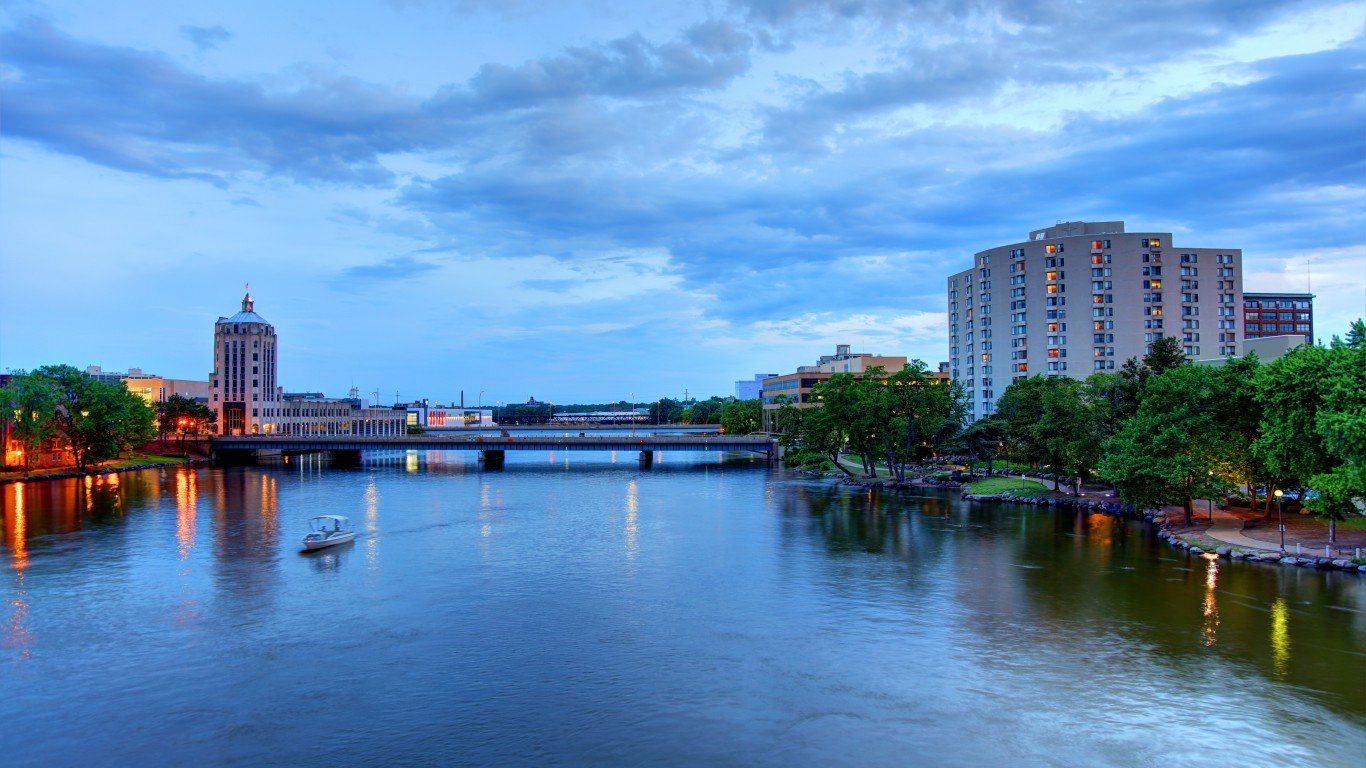
14. Rockford, IL
> 1-yr. chg. in median home sale price: -0.7%
> Median home sale price 2018 Q2: $128,800
> Median home sale price 2019 Q2: $127,900
> Median household income: $55,484
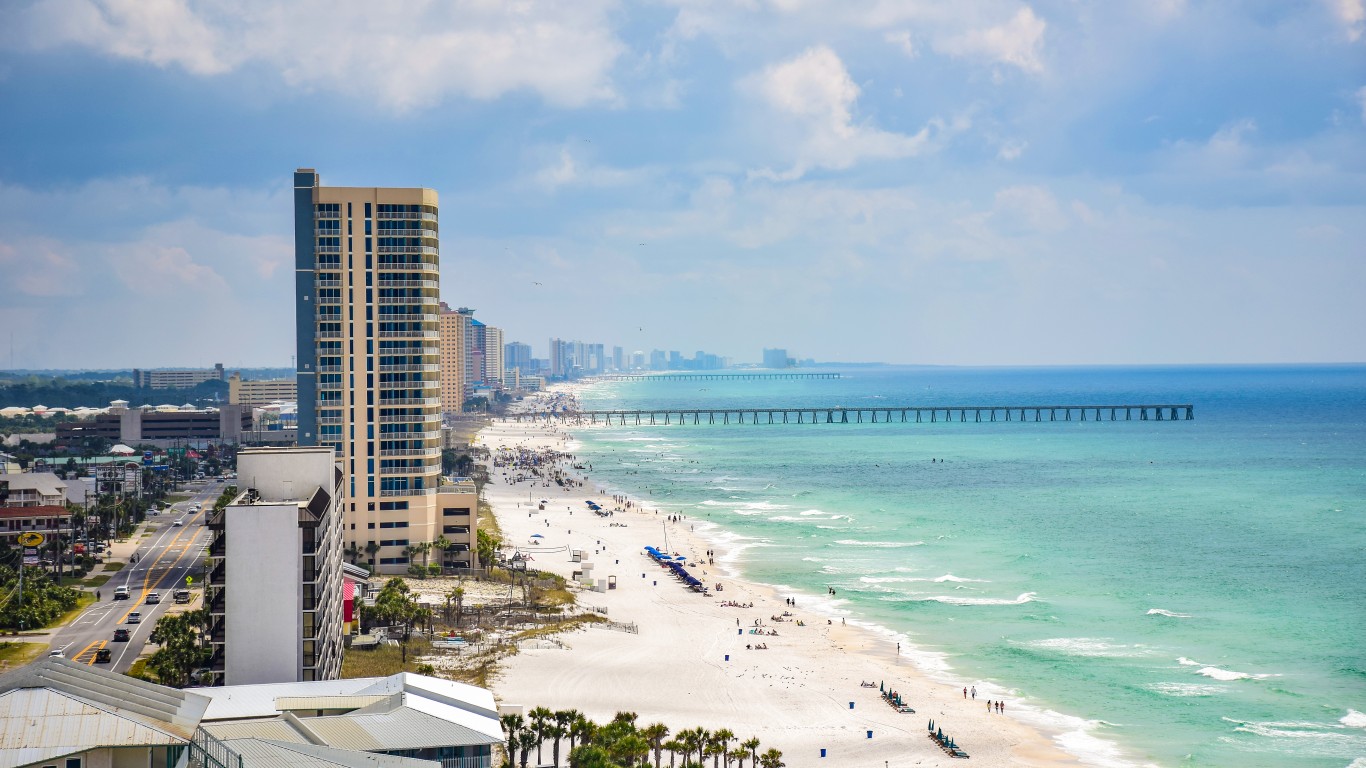
13. Panama City, FL
> 1-yr. chg. in median home sale price: -0.8%
> Median home sale price 2018 Q2: $222,800
> Median home sale price 2019 Q2: $221,100
> Median household income: $51,594
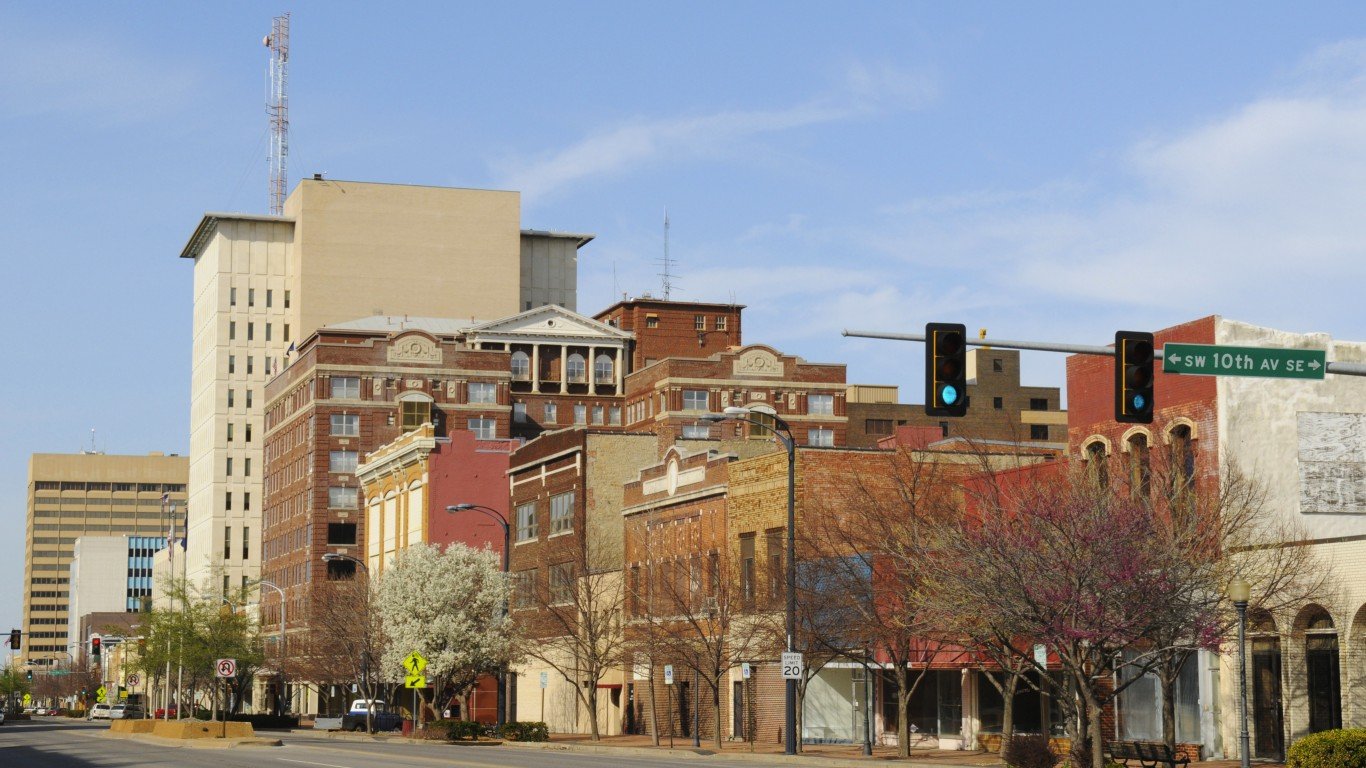
12. Topeka, KS
> 1-yr. chg. in median home sale price: -0.9%
> Median home sale price 2018 Q2: $139,300
> Median home sale price 2019 Q2: $138,100
> Median household income: $56,834

11. Boulder, CO
> 1-yr. chg. in median home sale price: -0.9%
> Median home sale price 2018 Q2: $631,100
> Median home sale price 2019 Q2: $625,300
> Median household income: $80,834
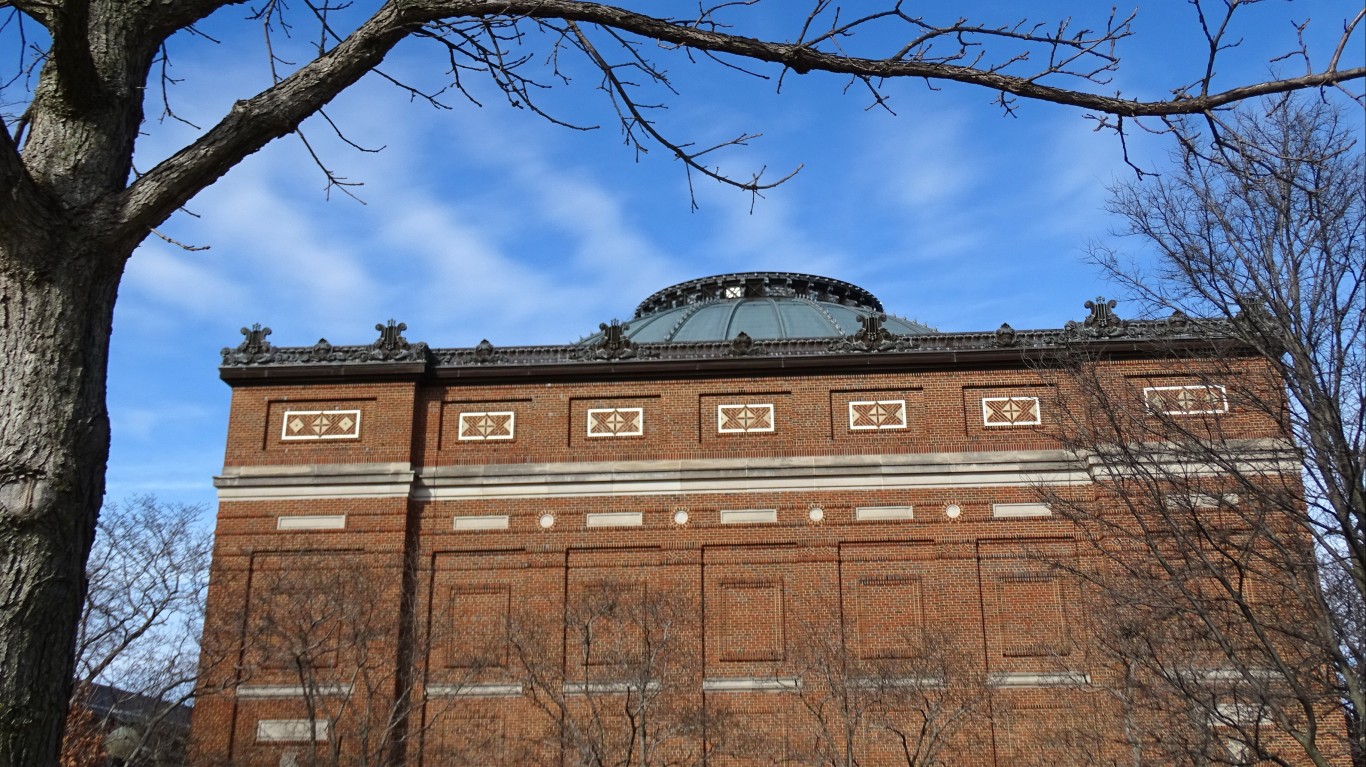
10. Champaign-Urbana, IL
> 1-yr. chg. in median home sale price: -1.0%
> Median home sale price 2018 Q2: $157,700
> Median home sale price 2019 Q2: $156,100
> Median household income: $50,999

9. Urban Honolulu, HI
> 1-yr. chg. in median home sale price: -1.2%
> Median home sale price 2018 Q2: $795,200
> Median home sale price 2019 Q2: $785,500
> Median household income: $81,284

8. Oklahoma City, OK
> 1-yr. chg. in median home sale price: -1.3%
> Median home sale price 2018 Q2: $164,500
> Median home sale price 2019 Q2: $162,400
> Median household income: $56,260

7. San Francisco-Oakland-Hayward, CA
> 1-yr. chg. in median home sale price: -1.9%
> Median home sale price 2018 Q2: $1,070,000
> Median home sale price 2019 Q2: $1,050,000
> Median household income: $101,714

6. Naples-Immokalee-Marco Island, FL
> 1-yr. chg. in median home sale price: -2.4%
> Median home sale price 2018 Q2: $465,000
> Median home sale price 2019 Q2: $454,000
> Median household income: $66,048
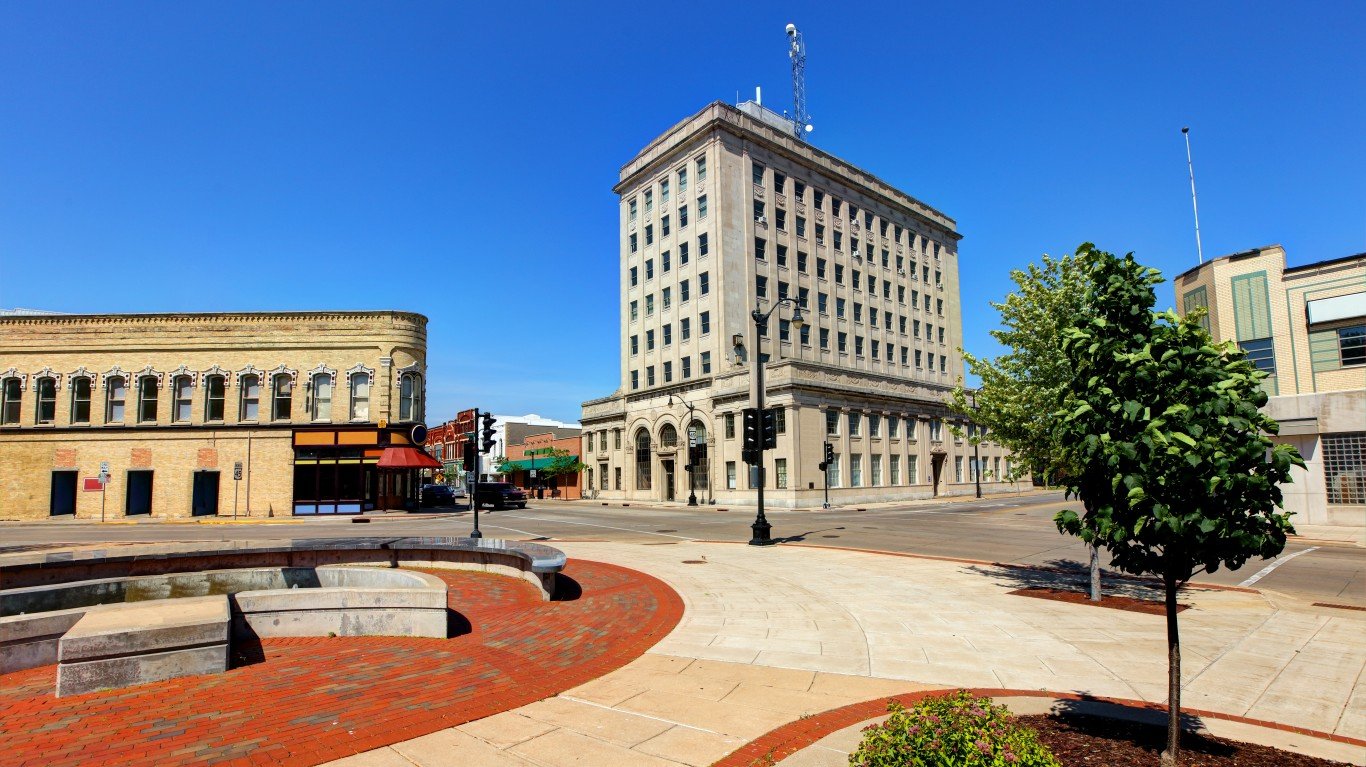
5. Oshkosh-Neenah, WI
> 1-yr. chg. in median home sale price: -2.8%
> Median home sale price 2018 Q2: $157,200
> Median home sale price 2019 Q2: $152,800
> Median household income: $56,678
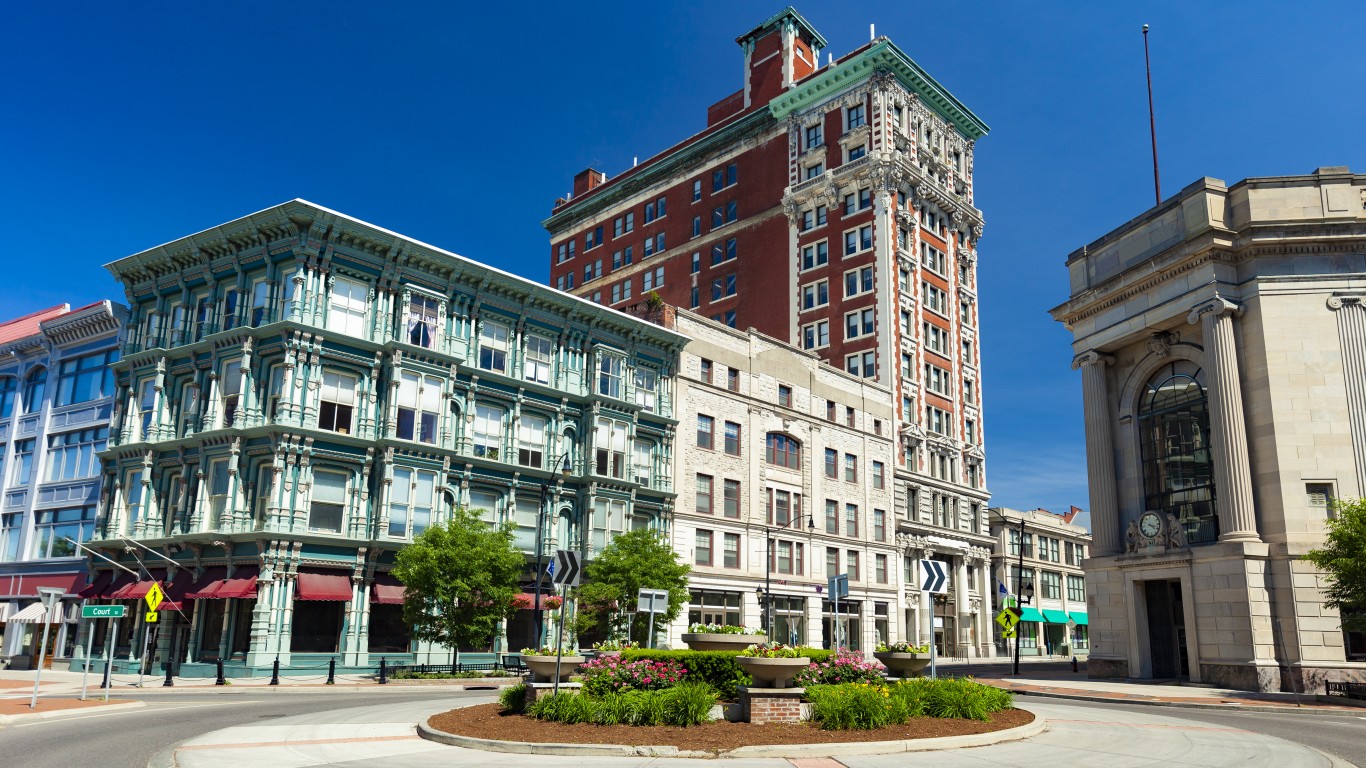
4. Binghamton, NY
> 1-yr. chg. in median home sale price: -2.9%
> Median home sale price 2018 Q2: $122,900
> Median home sale price 2019 Q2: $119,300
> Median household income: $50,545
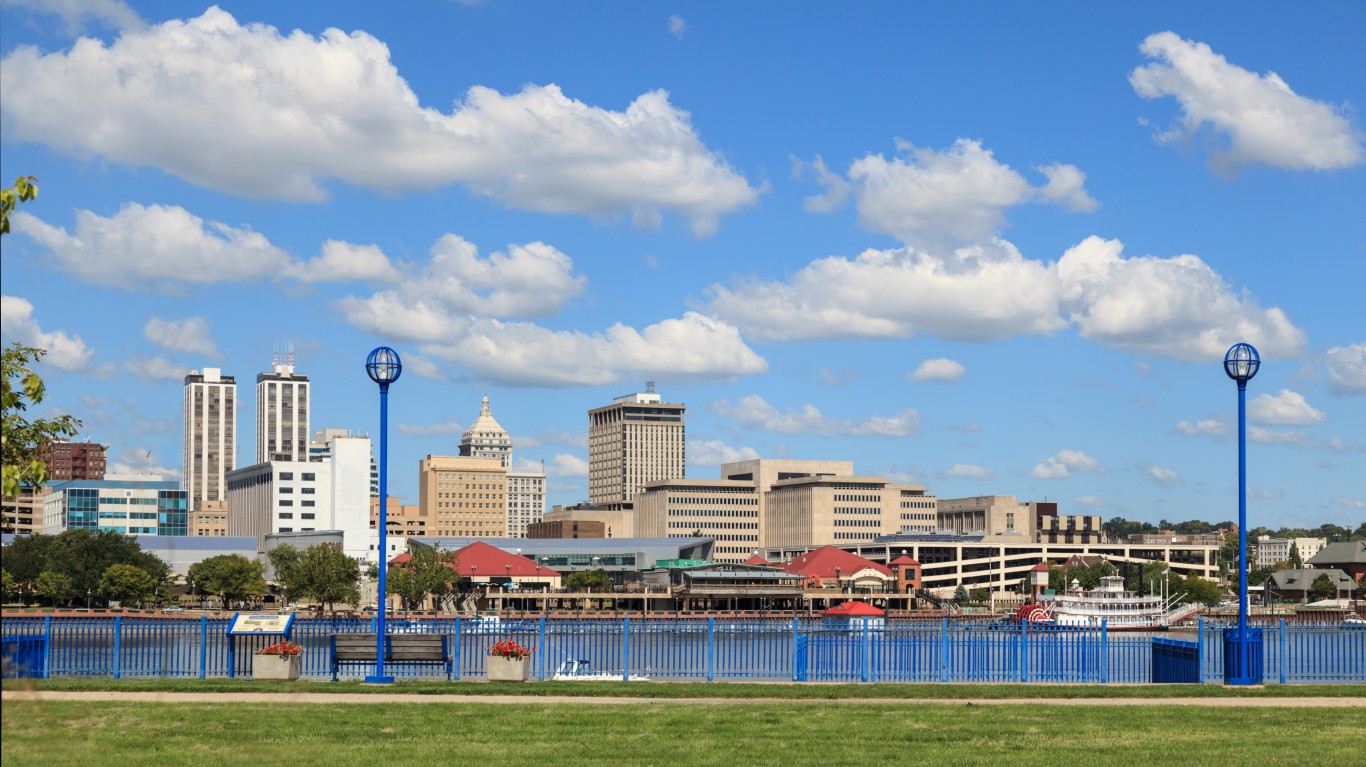
3. Peoria, IL
> 1-yr. chg. in median home sale price: -3.4%
> Median home sale price 2018 Q2: $129,400
> Median home sale price 2019 Q2: $125,000
> Median household income: $57,453

2. San Jose-Sunnyvale-Santa Clara, CA
> 1-yr. chg. in median home sale price: -5.3%
> Median home sale price 2018 Q2: $1,405,000
> Median home sale price 2019 Q2: $1,330,000
> Median household income: $117,474
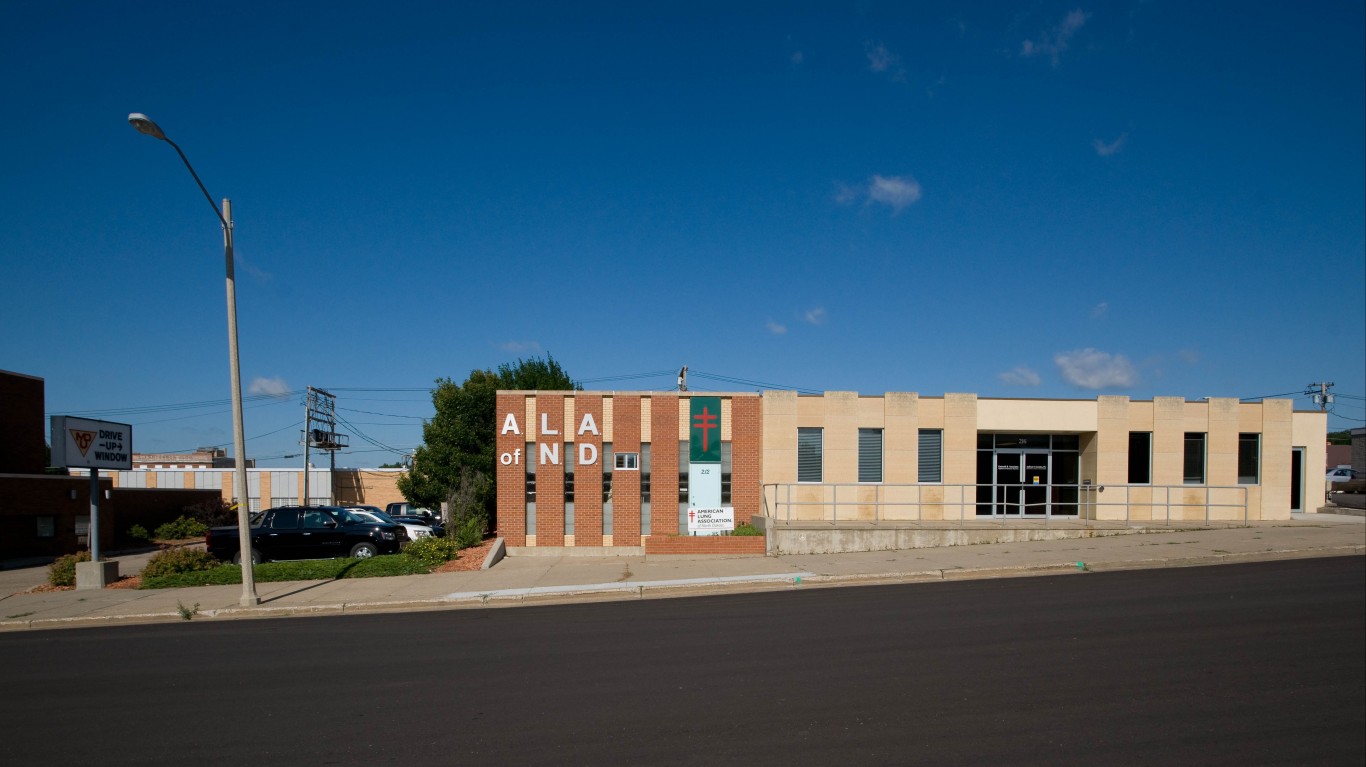
1. Bismarck, ND
> 1-yr. chg. in median home sale price: -5.5%
> Median home sale price 2018 Q2: $263,200
> Median home sale price 2019 Q2: $248,800
> Median household income: $66,087
Contact [email protected] for any questions or corrections.
Michael Sauter is Lead Editor at 24/7 Wall St. He has worked here in various capacities since 2010, starting out as a healthcare industry beat writer. He helped develop the site’s data-driven content, which contributed to 24/7 Wall St. becoming a recognized brand in the field of data journalism, covering a wide range of social and economic issues. Today, he rarely writes but enjoys working with authors and data to find the best way to present information clearly and effectively. In his occasional spare time, Michael loves cycling, listening to audiobooks, and (passably) playing the piano.