Not even a third of American adults exercise on a regular basis, according to the Centers for Disease Control and Prevention. Just about 23% meet the federal guidelines for both aerobic activity and strength training. The Department of Health and Human Services recommends adults ages 18-64 engage in at least 150 minutes a week of moderate exercise — about 20 minutes a day.
To determine the metropolitan area in each state where residents are getting the most exercise, 24/7 Tempo reviewed data from the 2021 County Health Rankings on the percentage of adults who are physically active on a regular basis and the percentage of the population with access to a location appropriate for exercise.
Exercise has been shown to be important in maintaining a healthy weight as it can help maintain weight and build muscle tissue. A sedentary lifestyle may contribute to obesity. Only six of the cities with the highest physical activity rates have an adult obesity rate higher than their state obesity rate. These are the most obese places in America.
In Arkansas and Mississippi, 69.6% of adults regularly exercise, the smallest share of any state in the country. In Arkansas’ most active city, the adult obesity rate is 31.6%, higher than the national adult obesity rate of 29.7% but lower than the state obesity rate of 35.0%. This is also the case in Mississippi’s most active city.
On the other end of the spectrum, in Colorado, the state with the highest share of adults who are physically active on a regular basis, the adult obesity rate is 22.4%, significantly below the national average. The most active city in the state has an even lower obesity rate.
Consistent lack of exercise can contribute to certain unhealthy outcomes. Some research shows that even just 15 minutes a day provides benefits, including lower risk of heart disease, diabetes, and some common types of cancer. Still, seven of the cities with the highest share of adults exercising regularly in their state have a higher rate of adults in poor or fair health than their state rate. This is the least healthy county in every state.
Click here to see where people in every state exercise the most
Methodology
To identify the cities getting the most exercise, 24/7 Tempo reviewed data about adults who are regularly physically active in all 382 metro areas in the United States. The measure came from the 2021 County Health Rankings & Roadmaps, a collaboration between the Robert Wood Johnson Foundation and the University of Wisconsin Population Health Institute.
Obesity rates — the share of adult residents who report a body mass index of 30 or greater — as well as the share of adults who have access to exercise facilities and the share of the population reporting to be in fair or poor health also came from the 2021 CHR.
Population figures, median household income, and poverty rate came from the American Community Survey 2019 5-Year Estimates.
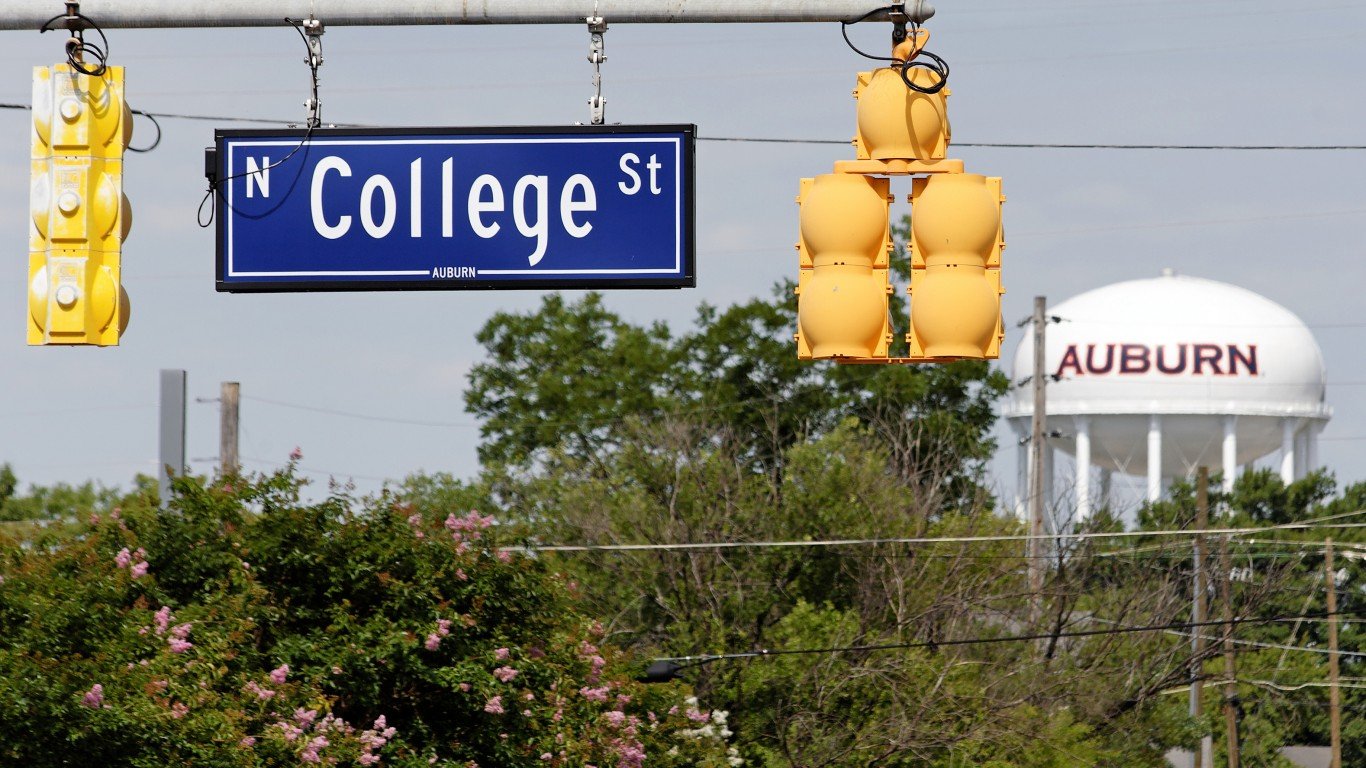
Alabama: Auburn-Opelika
> Adults who exercise: 80.1% (state avg: 70.7%)
> Pop. with access to places for physical activity: 67.7% (state avg: 61.1%)
> Adult obesity rate: 30.8% (state avg: 36.1%)
> Pop. over 20 with diabetes: 10.3% (state avg: 14.5%)
> Adults in poor or fair health: 20.0% (state avg: 21.4%)
> Physically unhealthy days: 4.6 per month (state avg: 4.4 per month)
> Median household income: $53,712 (state avg: $51,734)
> Population: 164,542
[in-text-ad]

Alaska: Anchorage
> Adults who exercise: 82.2% (state avg: 80.7%)
> Pop. with access to places for physical activity: 100.0% (state avg: 100.0%)
> Adult obesity rate: 31.4% (state avg: 31.9%)
> Pop. over 20 with diabetes: 8.5% (state avg: 8.3%)
> Adults in poor or fair health: 14.8% (state avg: 15.6%)
> Physically unhealthy days: 3.8 per month (state avg: 4.1 per month)
> Median household income: $80,676 (state avg: $75,463)
> Population: 396,317
[recirclink id=886865]

Arizona: Flagstaff
> Adults who exercise: 83.5% (state avg: 78.8%)
> Pop. with access to places for physical activity: 82.9% (state avg: 85.1%)
> Adult obesity rate: 24.5% (state avg: 27.9%)
> Pop. over 20 with diabetes: 7.7% (state avg: 9.6%)
> Adults in poor or fair health: 17.9% (state avg: 18.6%)
> Physically unhealthy days: 4.3 per month (state avg: 4.2 per month)
> Median household income: $58,085 (state avg: $62,055)
> Population: 143,476

Arkansas: Fayetteville-Springdale-Rogers
> Adults who exercise: 75.6% (state avg: 69.6%)
> Pop. with access to places for physical activity: 79.1% (state avg: 63.5%)
> Adult obesity rate: 31.6% (state avg: 35.0%)
> Pop. over 20 with diabetes: 9.6% (state avg: 13.5%)
> Adults in poor or fair health: 21.8% (state avg: 23.3%)
> Physically unhealthy days: 4.4 per month (state avg: 4.8 per month)
> Median household income: $61,674 (state avg: $48,952)
> Population: 536,120
[in-text-ad-2]
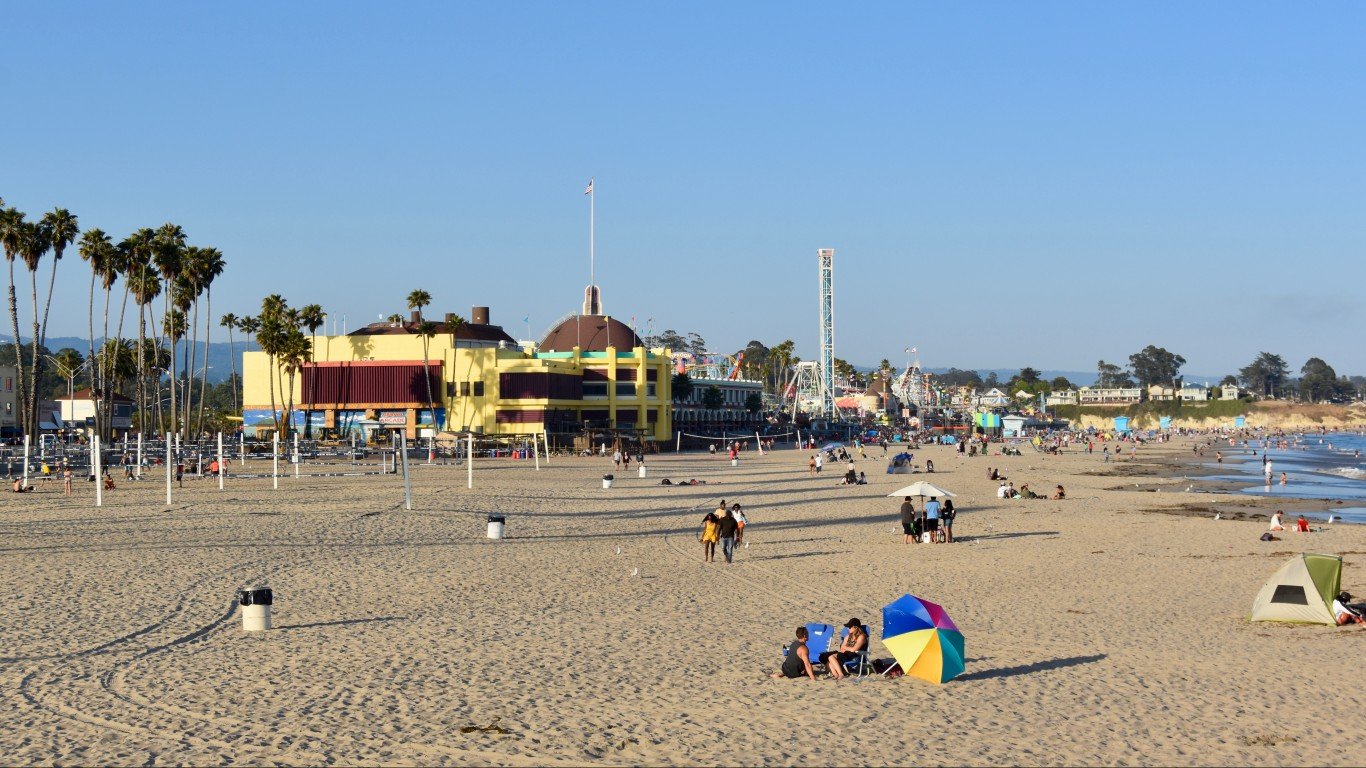
California: Santa Cruz-Watsonville
> Adults who exercise: 88.9% (state avg: 82.3%)
> Pop. with access to places for physical activity: 94.0% (state avg: 93.1%)
> Adult obesity rate: 19.3% (state avg: 24.3%)
> Pop. over 20 with diabetes: 6.2% (state avg: 8.8%)
> Adults in poor or fair health: 16.3% (state avg: 17.6%)
> Physically unhealthy days: 4.0 per month (state avg: 3.9 per month)
> Median household income: $89,269 (state avg: $80,440)
> Population: 273,213
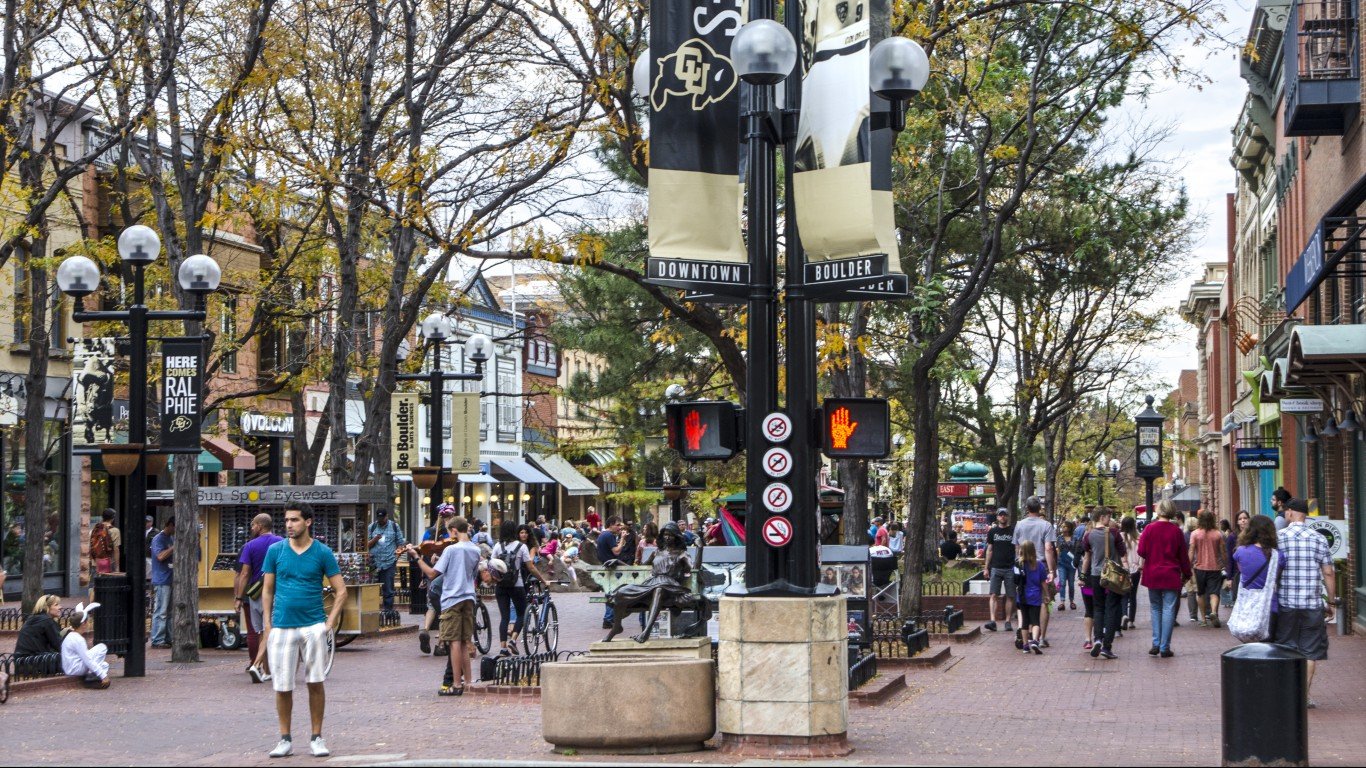
Colorado: Boulder
> Adults who exercise: 91.1% (state avg: 85.2%)
> Pop. with access to places for physical activity: 96.2% (state avg: 90.5%)
> Adult obesity rate: 14.3% (state avg: 22.4%)
> Pop. over 20 with diabetes: 5.5% (state avg: 6.6%)
> Adults in poor or fair health: 11.2% (state avg: 13.8%)
> Physically unhealthy days: 3.0 per month (state avg: 3.3 per month)
> Median household income: $88,535 (state avg: $77,127)
> Population: 326,196
[in-text-ad]

Connecticut: Bridgeport-Stamford-Norwalk
> Adults who exercise: 82.7% (state avg: 80.1%)
> Pop. with access to places for physical activity: 96.8% (state avg: 94.0%)
> Adult obesity rate: 21.2% (state avg: 26.3%)
> Pop. over 20 with diabetes: 7.3% (state avg: 9.2%)
> Adults in poor or fair health: 11.9% (state avg: 13.0%)
> Physically unhealthy days: 3.2 per month (state avg: 3.3 per month)
> Median household income: $97,053 (state avg: $78,833)
> Population: 943,332
[recirclink id=886803]

Delaware: Dover
> Adults who exercise: 69.1% (state avg: 72.7%)
> Pop. with access to places for physical activity: 66.8% (state avg: 86.5%)
> Adult obesity rate: 38.4% (state avg: 32.4%)
> Pop. over 20 with diabetes: 13.9% (state avg: 11.8%)
> Adults in poor or fair health: 21.0% (state avg: 16.3%)
> Physically unhealthy days: 4.5 per month (state avg: 3.7 per month)
> Median household income: $58,001 (state avg: $70,176)
> Population: 180,786
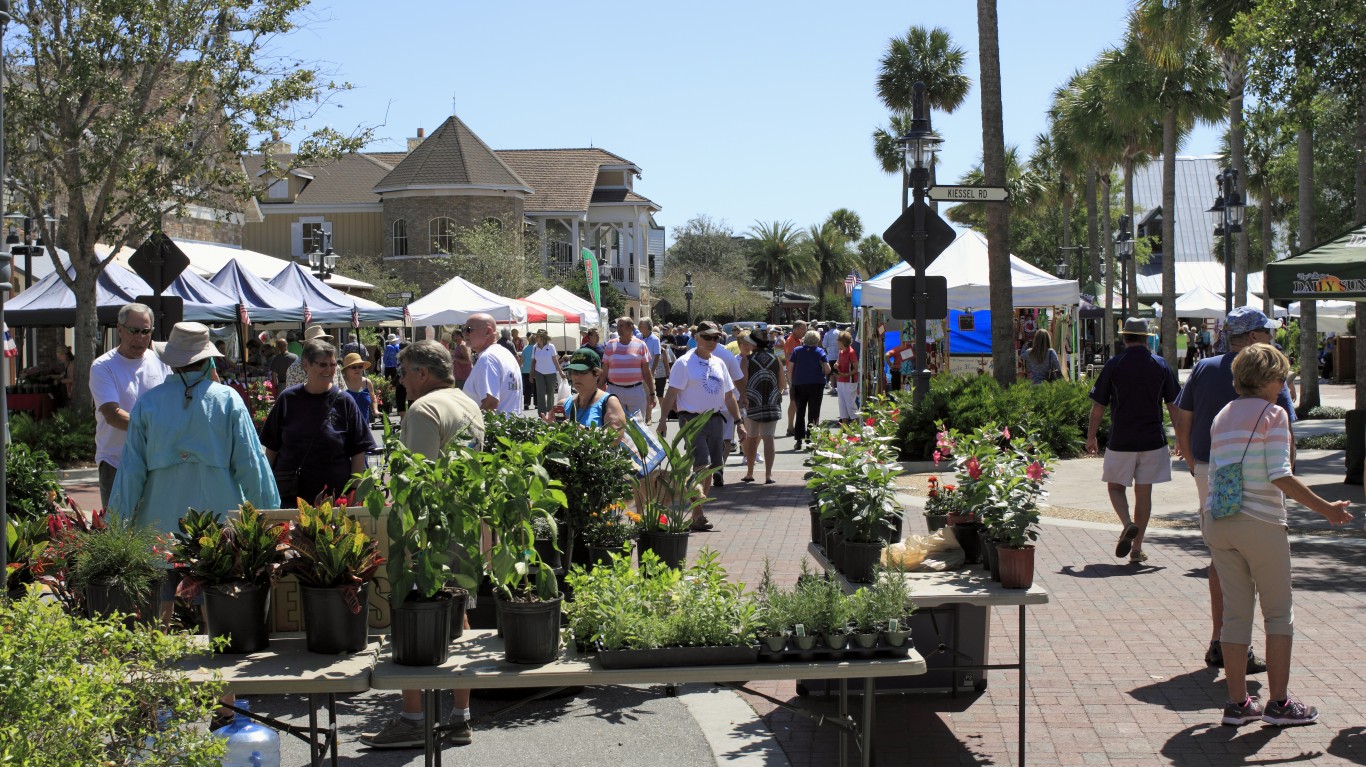
Florida: The Villages
> Adults who exercise: 77.4% (state avg: 74.2%)
> Pop. with access to places for physical activity: 82.1% (state avg: 88.7%)
> Adult obesity rate: 29.3% (state avg: 27.2%)
> Pop. over 20 with diabetes: 16.6% (state avg: 10.8%)
> Adults in poor or fair health: 16.6% (state avg: 19.5%)
> Physically unhealthy days: 4.0 per month (state avg: 4.0 per month)
> Median household income: $60,287 (state avg: $59,227)
> Population: 132,420
[in-text-ad-2]

Georgia: Atlanta-Sandy Springs-Roswell
> Adults who exercise: 76.1% (state avg: 73.6%)
> Pop. with access to places for physical activity: 84.3% (state avg: 75.5%)
> Adult obesity rate: 30.3% (state avg: 32.3%)
> Pop. over 20 with diabetes: 10.5% (state avg: 12.0%)
> Adults in poor or fair health: 16.8% (state avg: 18.4%)
> Physically unhealthy days: 3.7 per month (state avg: 3.9 per month)
> Median household income: $71,742 (state avg: $61,980)
> Population: 6,018,744
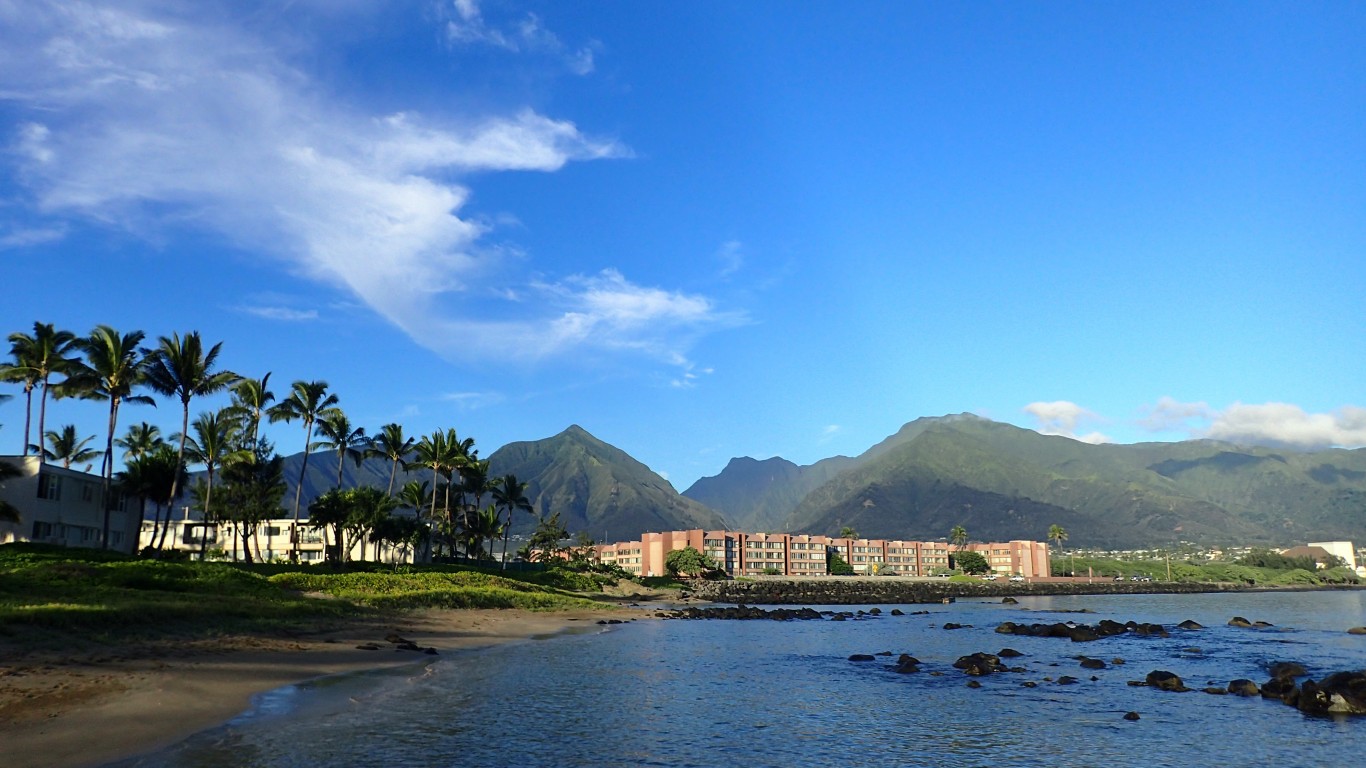
Hawaii: Kahului-Wailuku-Lahaina
> Adults who exercise: 82.3% (state avg: 80.4%)
> Pop. with access to places for physical activity: 92.5% (state avg: 92.5%)
> Adult obesity rate: 24.6% (state avg: 24.6%)
> Pop. over 20 with diabetes: 10.3% (state avg: 11.1%)
> Adults in poor or fair health: 14.7% (state avg: 15.4%)
> Physically unhealthy days: 3.4 per month (state avg: 3.2 per month)
> Median household income: $80,754 (state avg: $83,102)
> Population: 167,488
[in-text-ad]
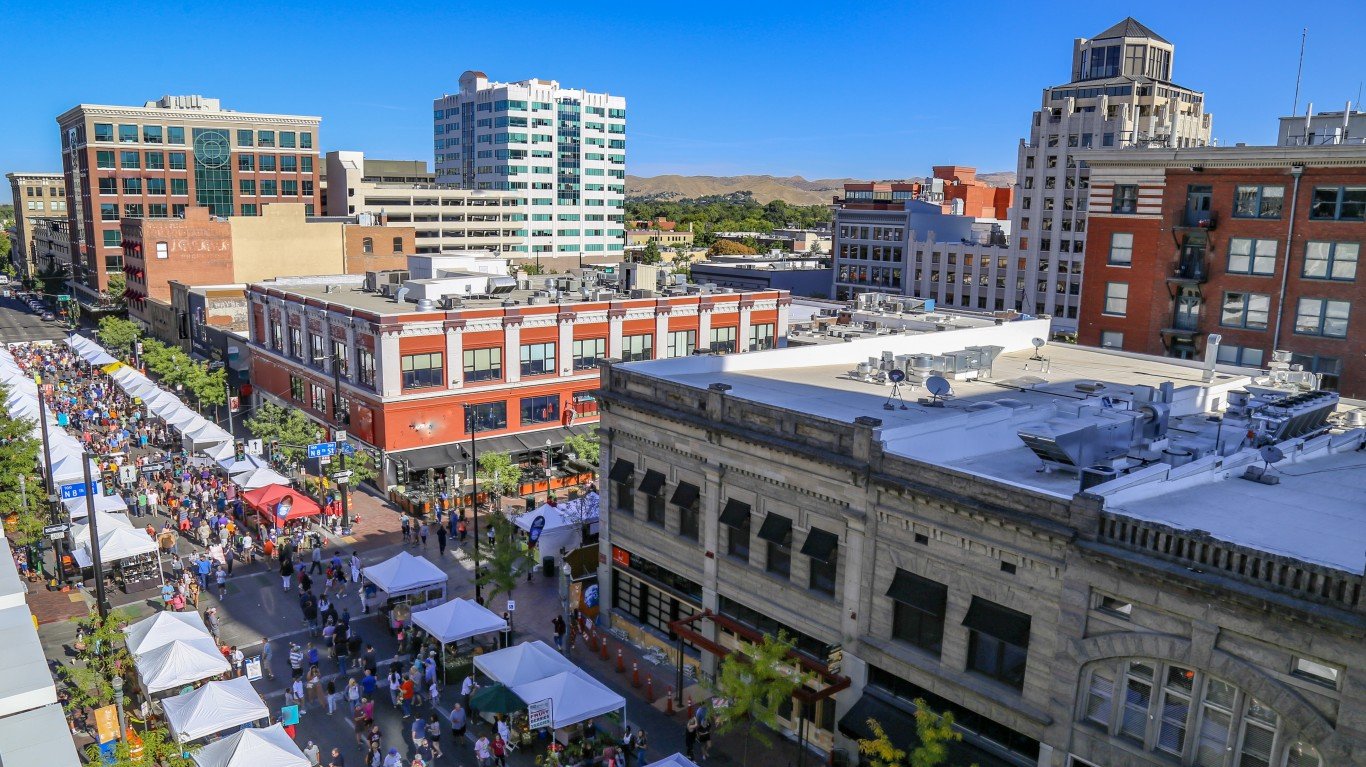
Idaho: Boise City
> Adults who exercise: 81.4% (state avg: 79.6%)
> Pop. with access to places for physical activity: 84.9% (state avg: 78.9%)
> Adult obesity rate: 28.5% (state avg: 29.0%)
> Pop. over 20 with diabetes: 8.8% (state avg: 9.3%)
> Adults in poor or fair health: 15.6% (state avg: 15.1%)
> Physically unhealthy days: 3.8 per month (state avg: 3.7 per month)
> Median household income: $66,466 (state avg: $60,999)
> Population: 749,057
[recirclink id=886501]

Illinois: Chicago-Naperville-Elgin
> Adults who exercise: 79.9% (state avg: 78.4%)
> Pop. with access to places for physical activity: 97.4% (state avg: 90.8%)
> Adult obesity rate: 29.0% (state avg: 29.7%)
> Pop. over 20 with diabetes: 9.4% (state avg: 9.9%)
> Adults in poor or fair health: 17.0% (state avg: 15.9%)
> Physically unhealthy days: 3.7 per month (state avg: 3.6 per month)
> Median household income: $75,379 (state avg: $69,187)
> Population: 9,457,867
Indiana: Bloomington
> Adults who exercise: 78.7% (state avg: 73.3%)
> Pop. with access to places for physical activity: 82.0% (state avg: 75.2%)
> Adult obesity rate: 26.1% (state avg: 33.9%)
> Pop. over 20 with diabetes: 8.5% (state avg: 12.1%)
> Adults in poor or fair health: 17.8% (state avg: 18.2%)
> Physically unhealthy days: 4.2 per month (state avg: 4.0 per month)
> Median household income: $52,526 (state avg: $57,603)
> Population: 169,230
[in-text-ad-2]
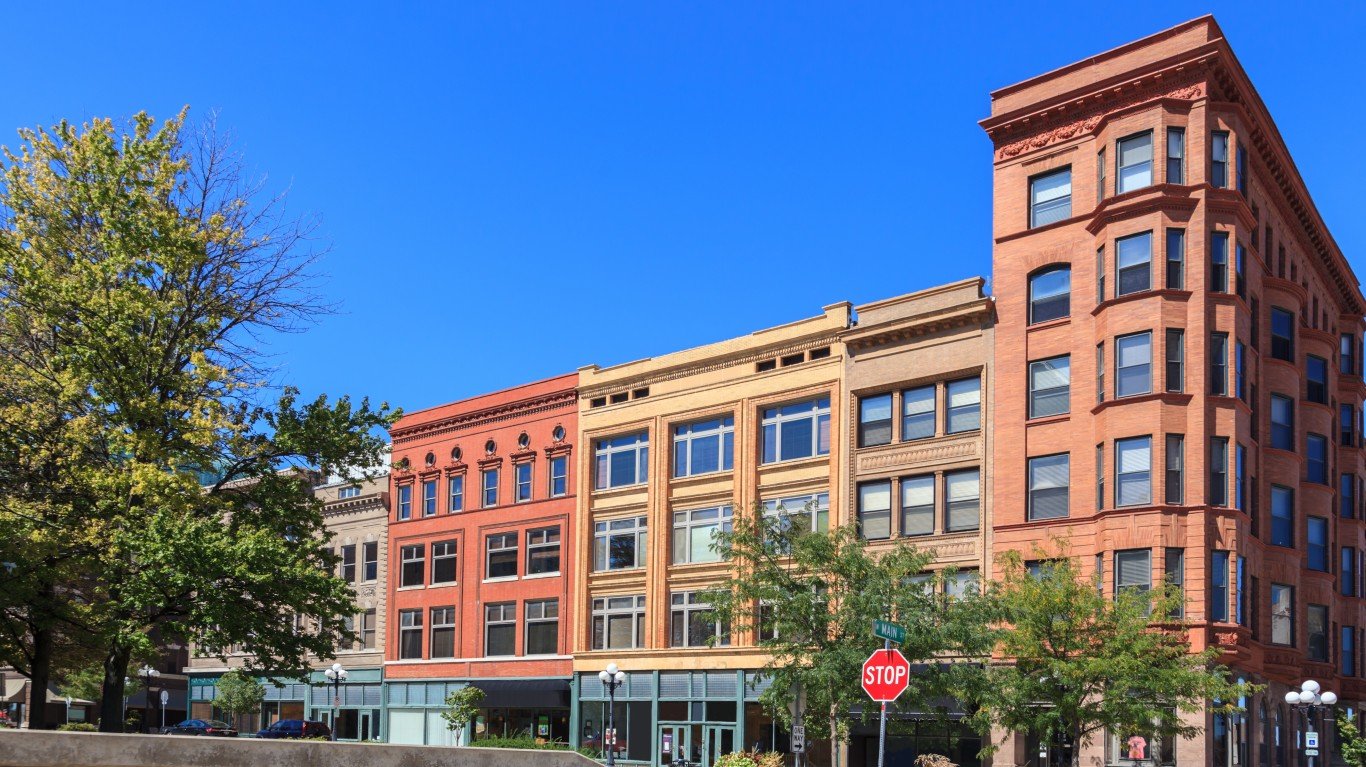
Iowa: Ames
> Adults who exercise: 83.5% (state avg: 77.4%)
> Pop. with access to places for physical activity: 93.1% (state avg: 82.9%)
> Adult obesity rate: 28.9% (state avg: 34.3%)
> Pop. over 20 with diabetes: 7.9% (state avg: 9.9%)
> Adults in poor or fair health: 12.8% (state avg: 13.5%)
> Physically unhealthy days: 3.3 per month (state avg: 3.1 per month)
> Median household income: $62,181 (state avg: $61,691)
> Population: 123,351

Kansas: Lawrence
> Adults who exercise: 83.7% (state avg: 76.1%)
> Pop. with access to places for physical activity: 91.0% (state avg: 80.1%)
> Adult obesity rate: 28.0% (state avg: 33.0%)
> Pop. over 20 with diabetes: 7.0% (state avg: 10.5%)
> Adults in poor or fair health: 14.8% (state avg: 16.3%)
> Physically unhealthy days: 3.5 per month (state avg: 3.6 per month)
> Median household income: $64,233 (state avg: $62,087)
> Population: 122,259
[in-text-ad]
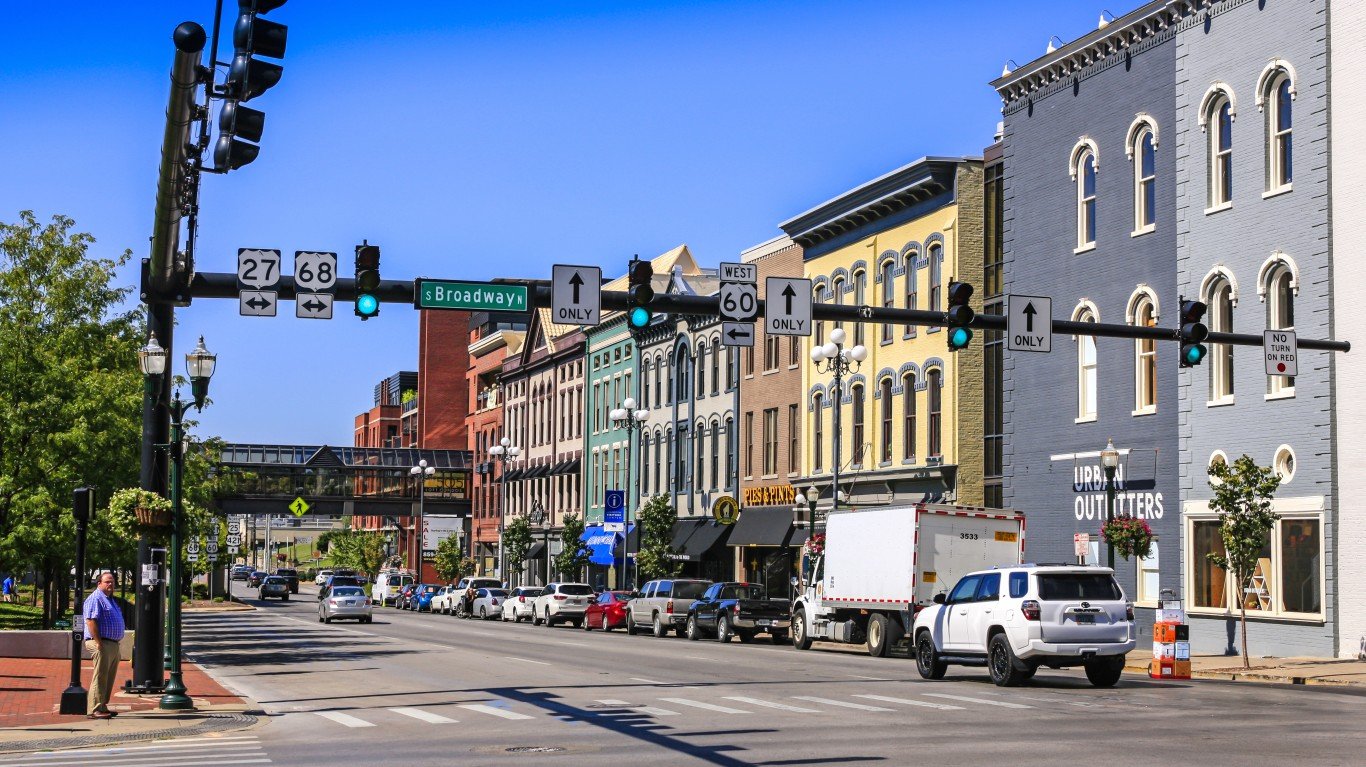
Kentucky: Lexington-Fayette
> Adults who exercise: 76.3% (state avg: 71.3%)
> Pop. with access to places for physical activity: 91.3% (state avg: 71.1%)
> Adult obesity rate: 30.9% (state avg: 34.6%)
> Pop. over 20 with diabetes: 9.9% (state avg: 12.7%)
> Adults in poor or fair health: 19.8% (state avg: 21.8%)
> Physically unhealthy days: 4.5 per month (state avg: 4.6 per month)
> Median household income: $60,492 (state avg: $52,295)
> Population: 517,056
[recirclink id=883047]

Louisiana: New Orleans-Metairie
> Adults who exercise: 75.9% (state avg: 72.0%)
> Pop. with access to places for physical activity: 88.6% (state avg: 75.0%)
> Adult obesity rate: 33.0% (state avg: 36.3%)
> Pop. over 20 with diabetes: 12.5% (state avg: 13.0%)
> Adults in poor or fair health: 20.6% (state avg: 21.4%)
> Physically unhealthy days: 4.2 per month (state avg: 4.3 per month)
> Median household income: $55,710 (state avg: $51,073)
> Population: 1,270,530
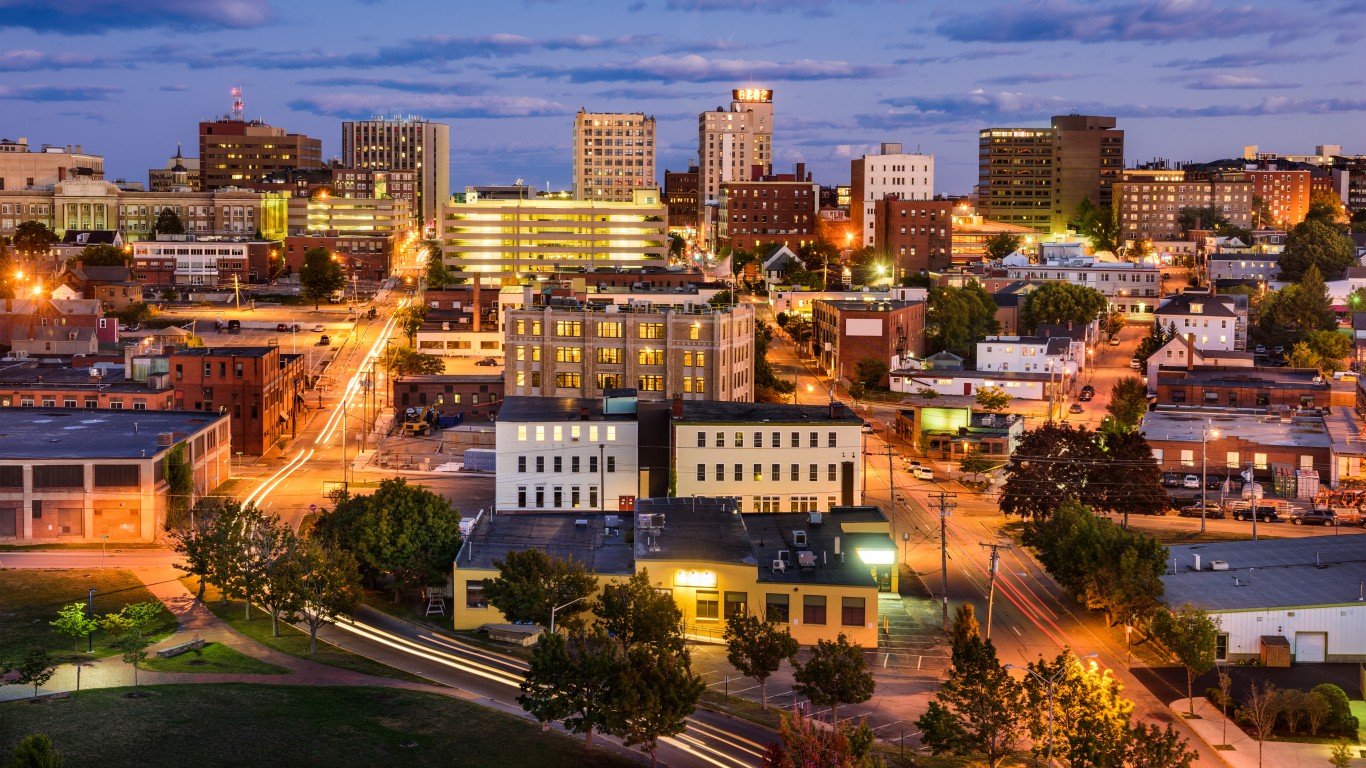
Maine: Portland-South Portland
> Adults who exercise: 82.6% (state avg: 79.2%)
> Pop. with access to places for physical activity: 81.4% (state avg: 70.0%)
> Adult obesity rate: 25.9% (state avg: 29.8%)
> Pop. over 20 with diabetes: 8.9% (state avg: 10.4%)
> Adults in poor or fair health: 13.2% (state avg: 17.1%)
> Physically unhealthy days: 3.4 per month (state avg: 4.2 per month)
> Median household income: $71,913 (state avg: $58,924)
> Population: 538,500
[in-text-ad-2]
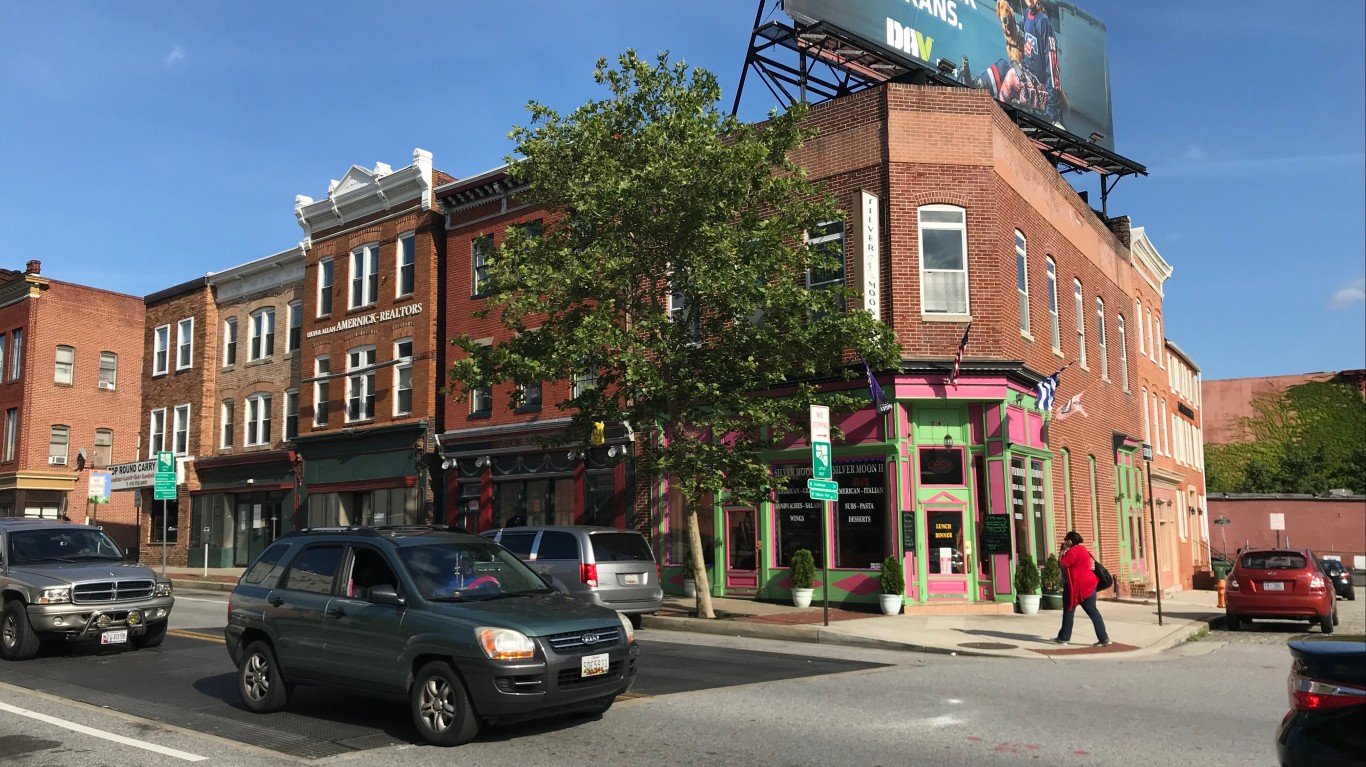
Maryland: Baltimore-Columbia-Towson
> Adults who exercise: 77.7% (state avg: 78.1%)
> Pop. with access to places for physical activity: 94.8% (state avg: 92.6%)
> Adult obesity rate: 31.5% (state avg: 31.6%)
> Pop. over 20 with diabetes: 10.9% (state avg: 11.1%)
> Adults in poor or fair health: 16.0% (state avg: 15.2%)
> Physically unhealthy days: 3.5 per month (state avg: 3.4 per month)
> Median household income: $83,160 (state avg: $86,738)
> Population: 2,800,053

Massachusetts: Barnstable Town
> Adults who exercise: 82.8% (state avg: 80.0%)
> Pop. with access to places for physical activity: 91.6% (state avg: 94.5%)
> Adult obesity rate: 22.5% (state avg: 25.0%)
> Pop. over 20 with diabetes: 10.1% (state avg: 8.7%)
> Adults in poor or fair health: 12.7% (state avg: 13.5%)
> Physically unhealthy days: 3.4 per month (state avg: 3.5 per month)
> Median household income: $85,042 (state avg: $85,843)
> Population: 212,990
[in-text-ad]
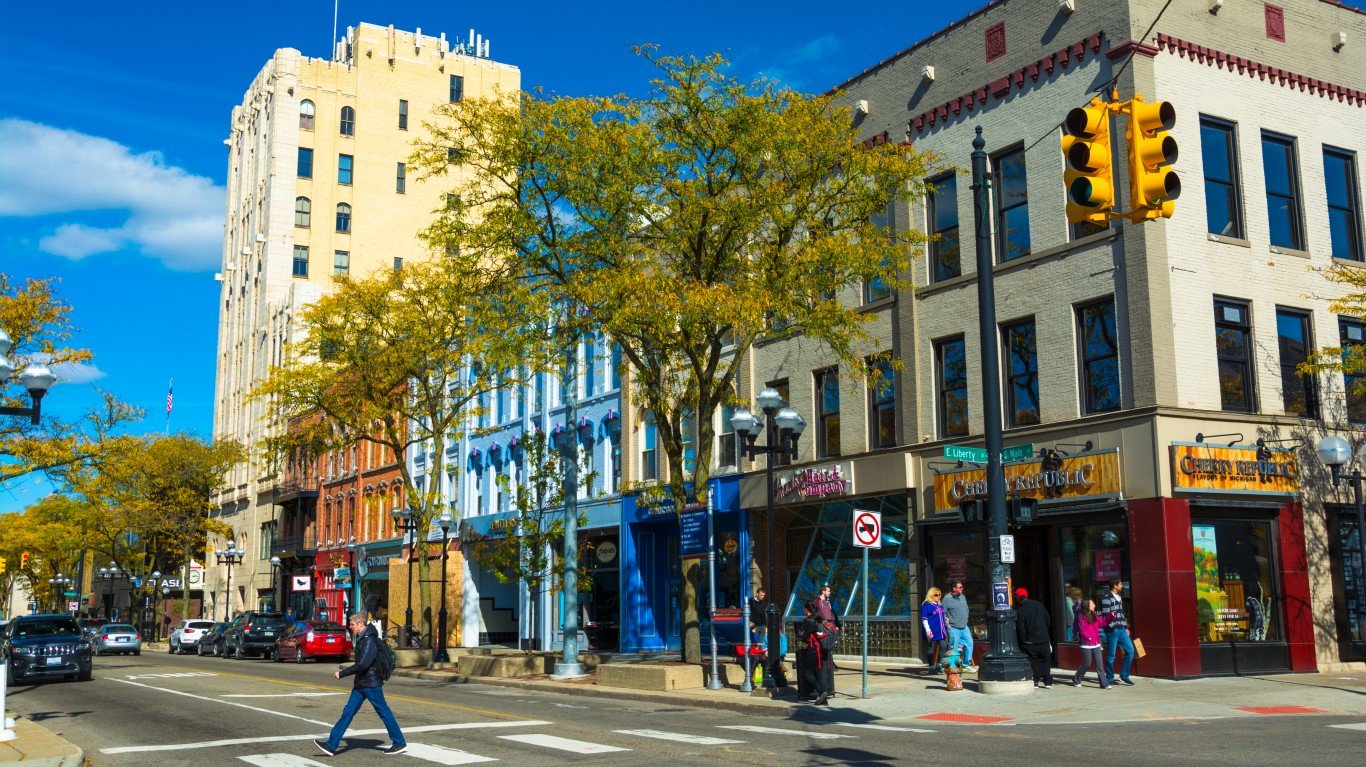
Michigan: Ann Arbor
> Adults who exercise: 84.9% (state avg: 76.9%)
> Pop. with access to places for physical activity: 90.2% (state avg: 85.5%)
> Adult obesity rate: 25.5% (state avg: 32.4%)
> Pop. over 20 with diabetes: 7.5% (state avg: 11.0%)
> Adults in poor or fair health: 14.4% (state avg: 18.3%)
> Physically unhealthy days: 3.8 per month (state avg: 4.3 per month)
> Median household income: $76,576 (state avg: $59,584)
> Population: 367,601
[recirclink id=877802]

Minnesota: Minneapolis-St. Paul-Bloomington
> Adults who exercise: 82.3% (state avg: 80.4%)
> Pop. with access to places for physical activity: 94.8% (state avg: 86.9%)
> Adult obesity rate: 27.2% (state avg: 29.0%)
> Pop. over 20 with diabetes: 7.8% (state avg: 8.5%)
> Adults in poor or fair health: 12.0% (state avg: 12.9%)
> Physically unhealthy days: 3.2 per month (state avg: 3.1 per month)
> Median household income: $83,698 (state avg: $74,593)
> Population: 3,640,043

Mississippi: Gulfport-Biloxi-Pascagoula
> Adults who exercise: 72.7% (state avg: 69.6%)
> Pop. with access to places for physical activity: 70.7% (state avg: 54.5%)
> Adult obesity rate: 35.3% (state avg: 39.1%)
> Pop. over 20 with diabetes: 12.1% (state avg: 14.6%)
> Adults in poor or fair health: 21.3% (state avg: 22.1%)
> Physically unhealthy days: 4.4 per month (state avg: 4.5 per month)
> Median household income: $50,642 (state avg: $45,792)
> Population: 417,665
[in-text-ad-2]
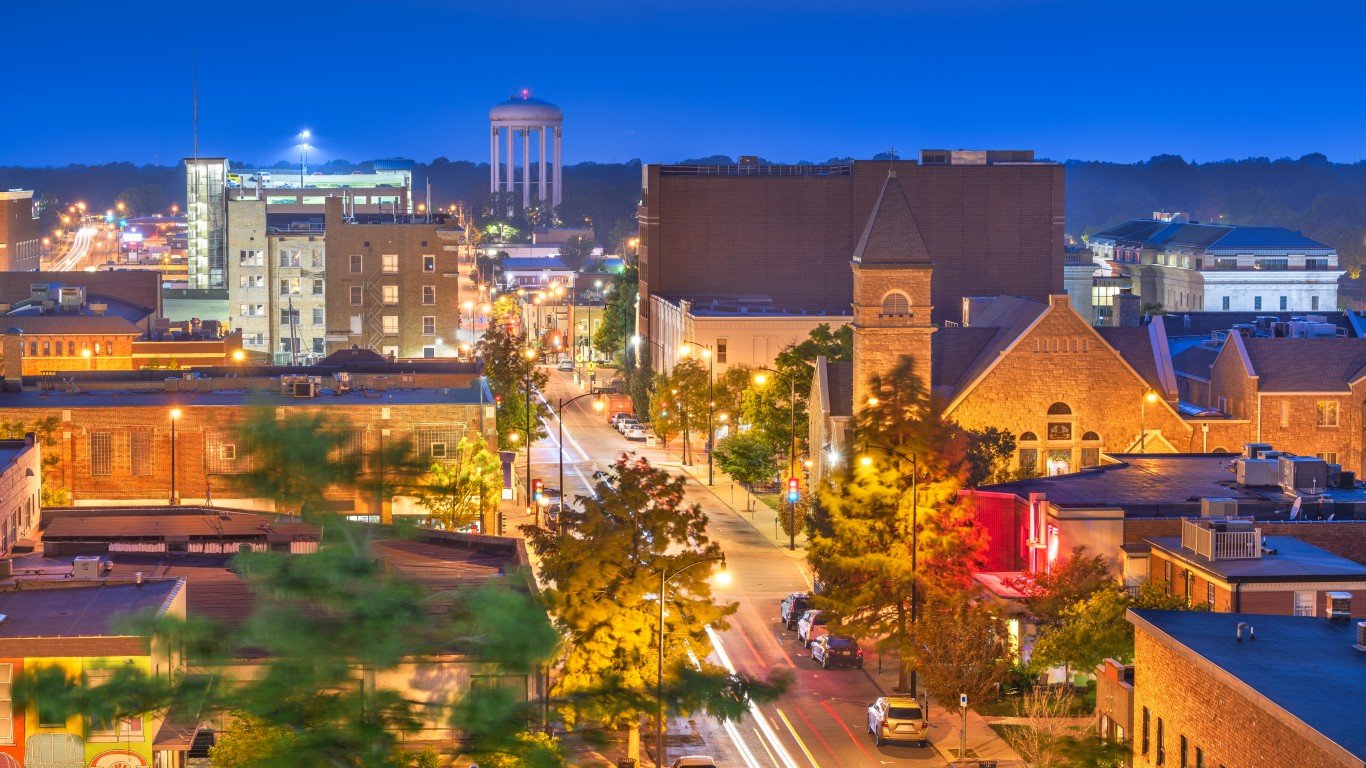
Missouri: Columbia
> Adults who exercise: 81.3% (state avg: 74.5%)
> Pop. with access to places for physical activity: 82.7% (state avg: 76.7%)
> Adult obesity rate: 28.1% (state avg: 32.5%)
> Pop. over 20 with diabetes: 7.2% (state avg: 11.4%)
> Adults in poor or fair health: 17.0% (state avg: 19.5%)
> Physically unhealthy days: 4.0 per month (state avg: 4.2 per month)
> Median household income: $57,359 (state avg: $57,409)
> Population: 208,548

Montana: Missoula
> Adults who exercise: 82.1% (state avg: 78.3%)
> Pop. with access to places for physical activity: 92.6% (state avg: 75.2%)
> Adult obesity rate: 21.4% (state avg: 27.1%)
> Pop. over 20 with diabetes: 6.5% (state avg: 8.9%)
> Adults in poor or fair health: 13.2% (state avg: 14.1%)
> Physically unhealthy days: 3.5 per month (state avg: 3.6 per month)
> Median household income: $57,347 (state avg: $57,153)
> Population: 119,600
[in-text-ad]

Nebraska: Lincoln
> Adults who exercise: 82.4% (state avg: 77.3%)
> Pop. with access to places for physical activity: 94.8% (state avg: 83.5%)
> Adult obesity rate: 30.0% (state avg: 33.4%)
> Pop. over 20 with diabetes: 8.2% (state avg: 10.0%)
> Adults in poor or fair health: 12.5% (state avg: 13.8%)
> Physically unhealthy days: 3.1 per month (state avg: 3.2 per month)
> Median household income: $61,539 (state avg: $63,229)
> Population: 336,541
[recirclink id=832758]
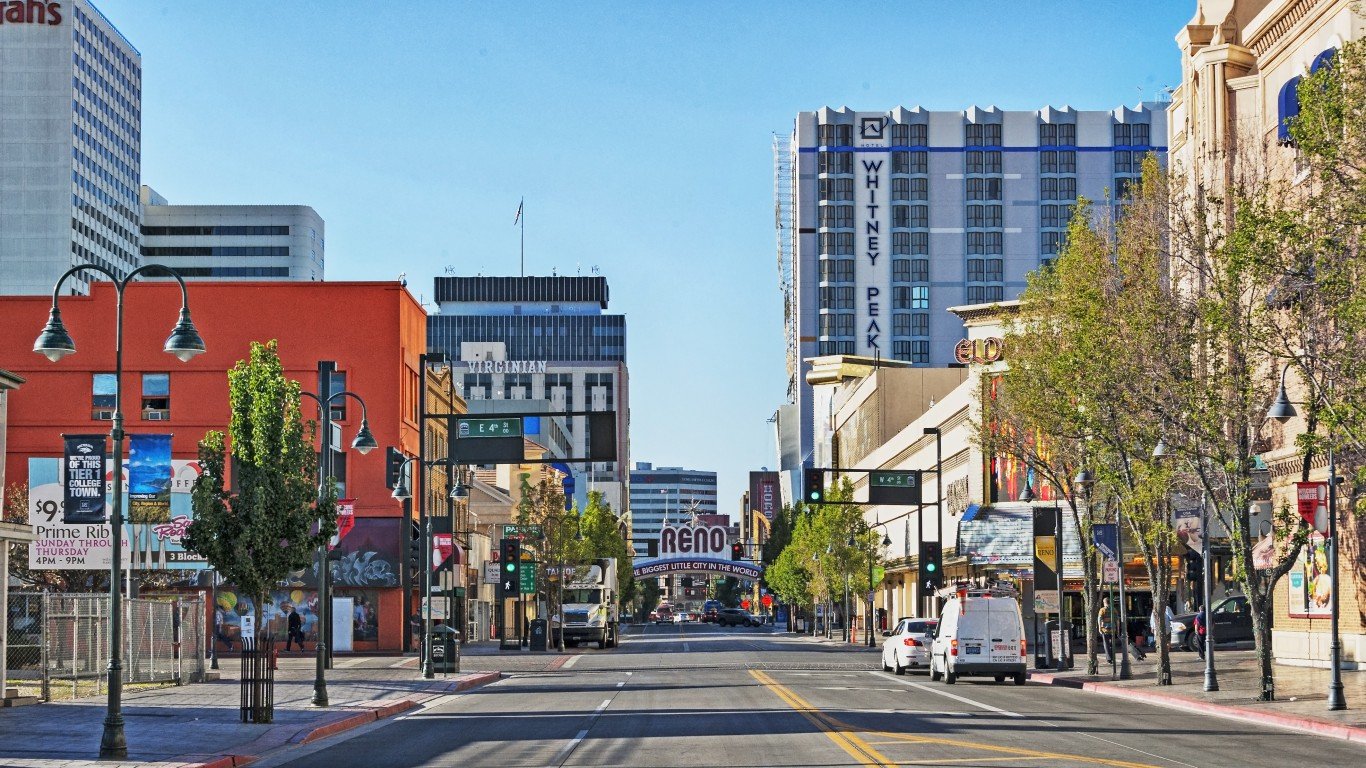
Nevada: Reno
> Adults who exercise: 82.1% (state avg: 77.5%)
> Pop. with access to places for physical activity: 91.2% (state avg: 93.0%)
> Adult obesity rate: 23.7% (state avg: 27.1%)
> Pop. over 20 with diabetes: 7.9% (state avg: 10.5%)
> Adults in poor or fair health: 18.1% (state avg: 19.1%)
> Physically unhealthy days: 4.3 per month (state avg: 4.2 per month)
> Median household income: $72,132 (state avg: $63,276)
> Population: 475,290

New Hampshire: Manchester
> Adults who exercise: 78.3% (state avg: 79.2%)
> Pop. with access to places for physical activity: 91.7% (state avg: 88.2%)
> Adult obesity rate: 28.5% (state avg: 28.6%)
> Pop. over 20 with diabetes: 9.7% (state avg: 9.6%)
> Adults in poor or fair health: 12.2% (state avg: 12.8%)
> Physically unhealthy days: 3.4 per month (state avg: 3.5 per month)
> Median household income: $83,626 (state avg: $77,933)
> Population: 417,025
[in-text-ad-2]
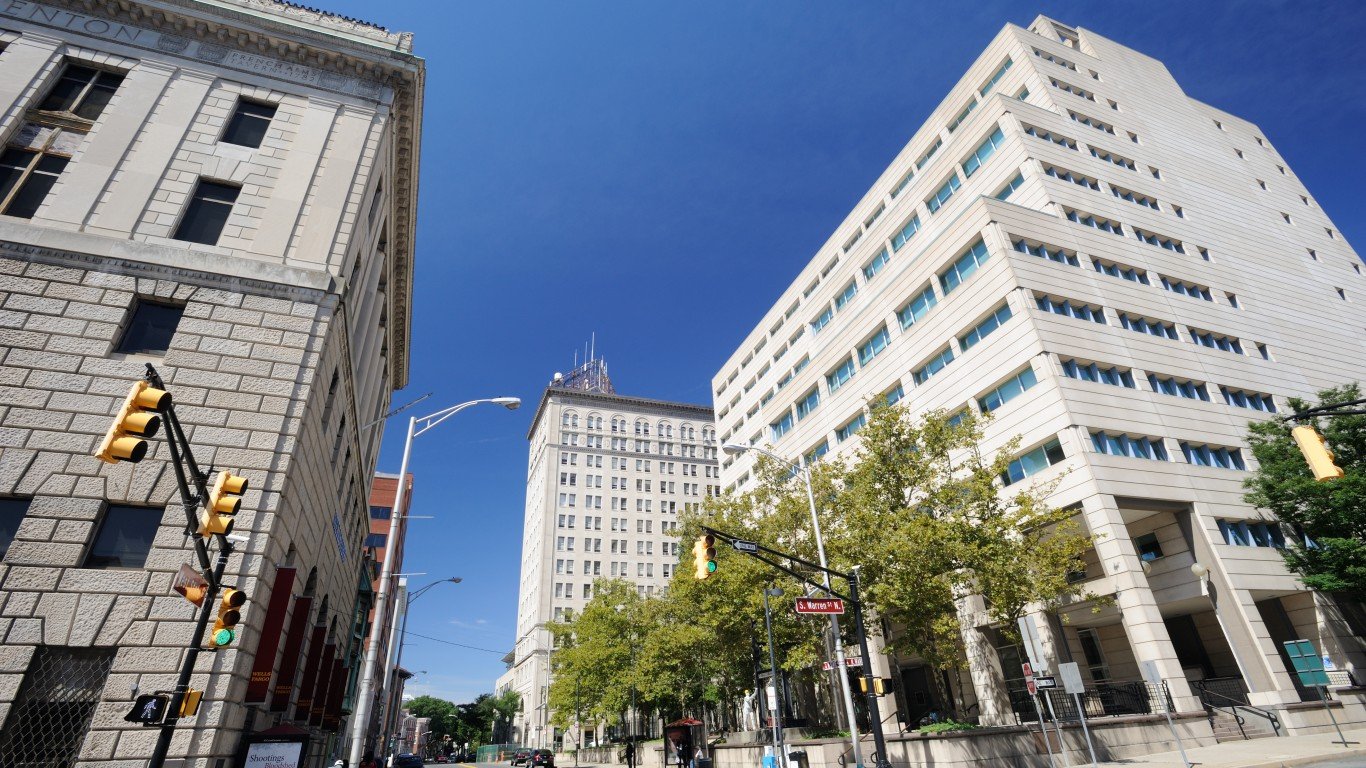
New Jersey: Trenton
> Adults who exercise: 74.2% (state avg: 73.4%)
> Pop. with access to places for physical activity: 99.2% (state avg: 94.7%)
> Adult obesity rate: 27.5% (state avg: 27.0%)
> Pop. over 20 with diabetes: 10.3% (state avg: 9.9%)
> Adults in poor or fair health: 16.8% (state avg: 15.5%)
> Physically unhealthy days: 3.8 per month (state avg: 3.7 per month)
> Median household income: $79,492 (state avg: $85,751)
> Population: 367,430

New Mexico: Santa Fe
> Adults who exercise: 87.3% (state avg: 81.0%)
> Pop. with access to places for physical activity: 78.7% (state avg: 76.9%)
> Adult obesity rate: 16.1% (state avg: 27.3%)
> Pop. over 20 with diabetes: 6.1% (state avg: 9.5%)
> Adults in poor or fair health: 17.8% (state avg: 20.3%)
> Physically unhealthy days: 4.0 per month (state avg: 4.3 per month)
> Median household income: $61,298 (state avg: $51,945)
> Population: 150,358
[in-text-ad]
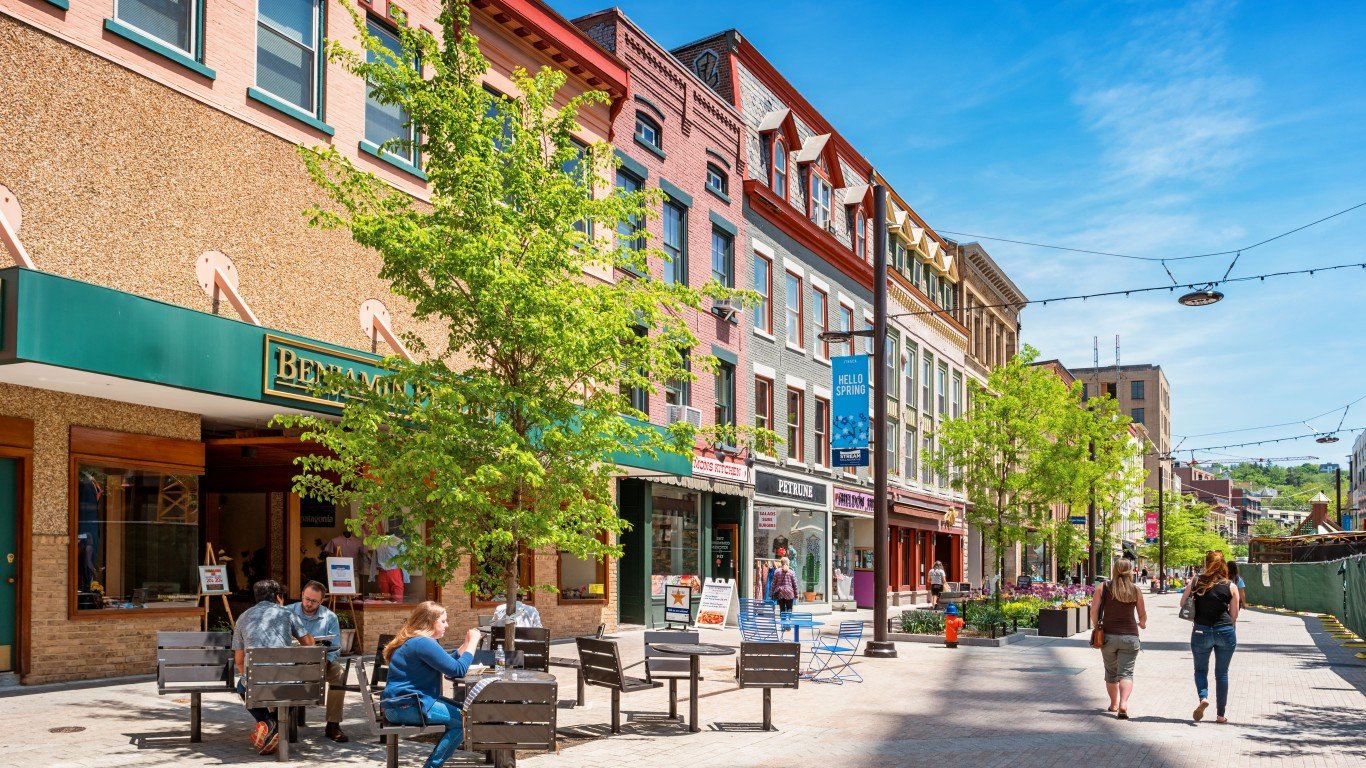
New York: Ithaca
> Adults who exercise: 85.4% (state avg: 76.6%)
> Pop. with access to places for physical activity: 86.2% (state avg: 93.2%)
> Adult obesity rate: 23.0% (state avg: 26.4%)
> Pop. over 20 with diabetes: 6.5% (state avg: 10.1%)
> Adults in poor or fair health: 13.5% (state avg: 16.3%)
> Physically unhealthy days: 3.5 per month (state avg: 3.6 per month)
> Median household income: $58,626 (state avg: $72,108)
> Population: 102,180
[recirclink id=882508]

North Carolina: Raleigh
> Adults who exercise: 82.5% (state avg: 76.7%)
> Pop. with access to places for physical activity: 85.5% (state avg: 73.5%)
> Adult obesity rate: 29.4% (state avg: 32.3%)
> Pop. over 20 with diabetes: 9.3% (state avg: 11.5%)
> Adults in poor or fair health: 14.9% (state avg: 18.0%)
> Physically unhealthy days: 3.4 per month (state avg: 3.6 per month)
> Median household income: $80,096 (state avg: $57,341)
> Population: 1,390,785
North Dakota: Fargo
> Adults who exercise: 81.0% (state avg: 76.9%)
> Pop. with access to places for physical activity: 86.8% (state avg: 74.0%)
> Adult obesity rate: 31.9% (state avg: 33.9%)
> Pop. over 20 with diabetes: 7.6% (state avg: 9.4%)
> Adults in poor or fair health: 12.6% (state avg: 13.6%)
> Physically unhealthy days: 3.2 per month (state avg: 3.2 per month)
> Median household income: $62,820 (state avg: $64,577)
> Population: 246,145
[in-text-ad-2]

Ohio: Columbus
> Adults who exercise: 76.8% (state avg: 73.9%)
> Pop. with access to places for physical activity: 89.3% (state avg: 83.9%)
> Adult obesity rate: 31.6% (state avg: 33.5%)
> Pop. over 20 with diabetes: 10.6% (state avg: 12.2%)
> Adults in poor or fair health: 16.2% (state avg: 17.8%)
> Physically unhealthy days: 3.8 per month (state avg: 4.1 per month)
> Median household income: $67,207 (state avg: $58,642)
> Population: 2,122,271

Oklahoma: Oklahoma City
> Adults who exercise: 74.7% (state avg: 72.2%)
> Pop. with access to places for physical activity: 84.3% (state avg: 71.3%)
> Adult obesity rate: 34.0% (state avg: 34.5%)
> Pop. over 20 with diabetes: 11.2% (state avg: 12.3%)
> Adults in poor or fair health: 19.5% (state avg: 20.9%)
> Physically unhealthy days: 4.4 per month (state avg: 4.5 per month)
> Median household income: $60,605 (state avg: $54,449)
> Population: 1,408,950
[in-text-ad]

Oregon: Corvallis
> Adults who exercise: 86.1% (state avg: 82.7%)
> Pop. with access to places for physical activity: 90.3% (state avg: 87.9%)
> Adult obesity rate: 21.6% (state avg: 29.3%)
> Pop. over 20 with diabetes: 5.7% (state avg: 9.7%)
> Adults in poor or fair health: 16.1% (state avg: 18.2%)
> Physically unhealthy days: 4.1 per month (state avg: 4.7 per month)
> Median household income: $70,835 (state avg: $67,058)
> Population: 93,053
[recirclink id=871993]

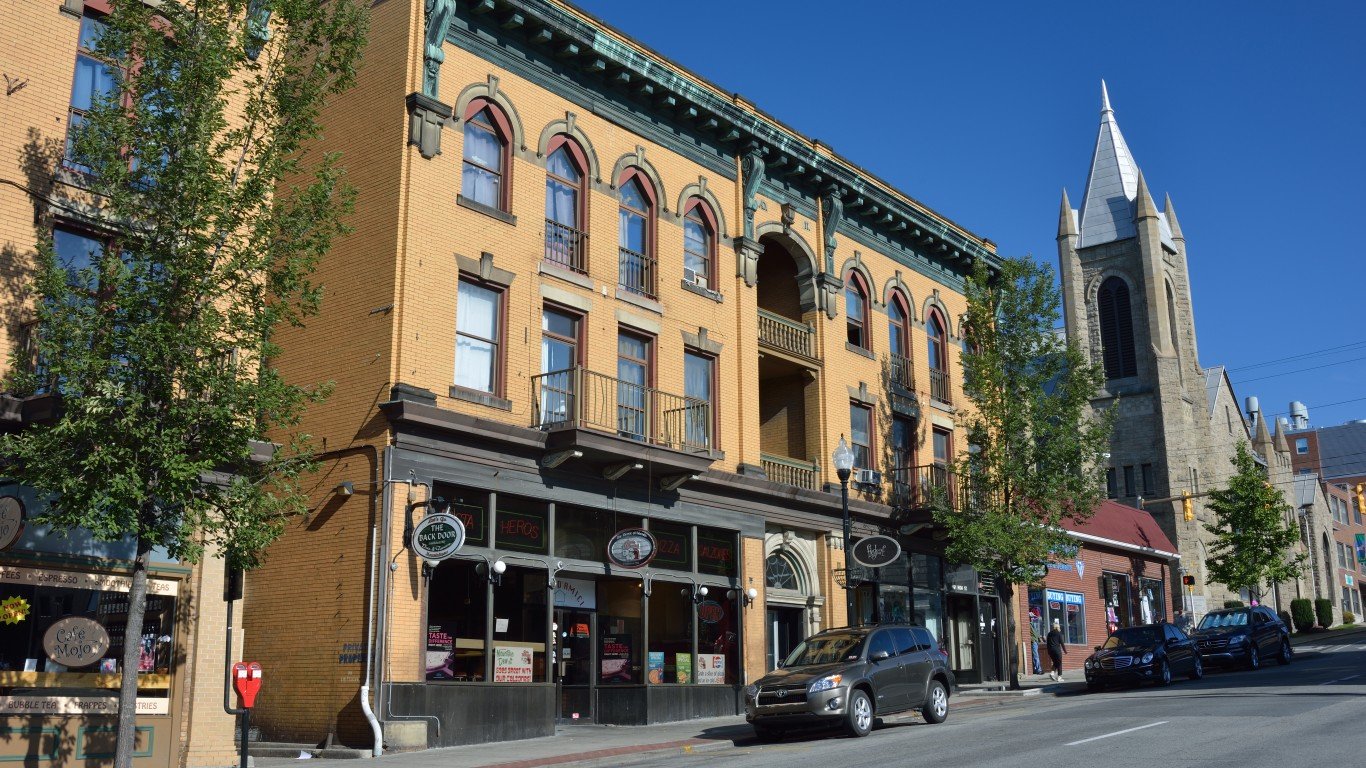
Pennsylvania: State College
> Adults who exercise: 81.7% (state avg: 78.0%)
> Pop. with access to places for physical activity: 86.3% (state avg: 84.4%)
> Adult obesity rate: 24.0% (state avg: 30.8%)
> Pop. over 20 with diabetes: 7.9% (state avg: 11.0%)
> Adults in poor or fair health: 16.0% (state avg: 17.6%)
> Physically unhealthy days: 3.8 per month (state avg: 4.0 per month)
> Median household income: $60,706 (state avg: $63,463)
> Population: 162,385

Rhode Island: Providence-Warwick
> Adults who exercise: 76.2% (state avg: 76.5%)
> Pop. with access to places for physical activity: 95.1% (state avg: 94.9%)
> Adult obesity rate: 28.6% (state avg: 28.5%)
> Pop. over 20 with diabetes: 10.1% (state avg: 10.1%)
> Adults in poor or fair health: 16.8% (state avg: 16.5%)
> Physically unhealthy days: 4.2 per month (state avg: 3.9 per month)
> Median household income: $70,967 (state avg: $71,169)
> Population: 1,624,578
[in-text-ad-2]

South Carolina: Hilton Head Island-Bluffton-Beaufort
> Adults who exercise: 81.9% (state avg: 74.0%)
> Pop. with access to places for physical activity: 78.9% (state avg: 68.3%)
> Adult obesity rate: 26.6% (state avg: 34.0%)
> Pop. over 20 with diabetes: 9.6% (state avg: 13.3%)
> Adults in poor or fair health: 15.7% (state avg: 17.8%)
> Physically unhealthy days: 3.7 per month (state avg: 4.0 per month)
> Median household income: $71,252 (state avg: $56,227)
> Population: 222,195

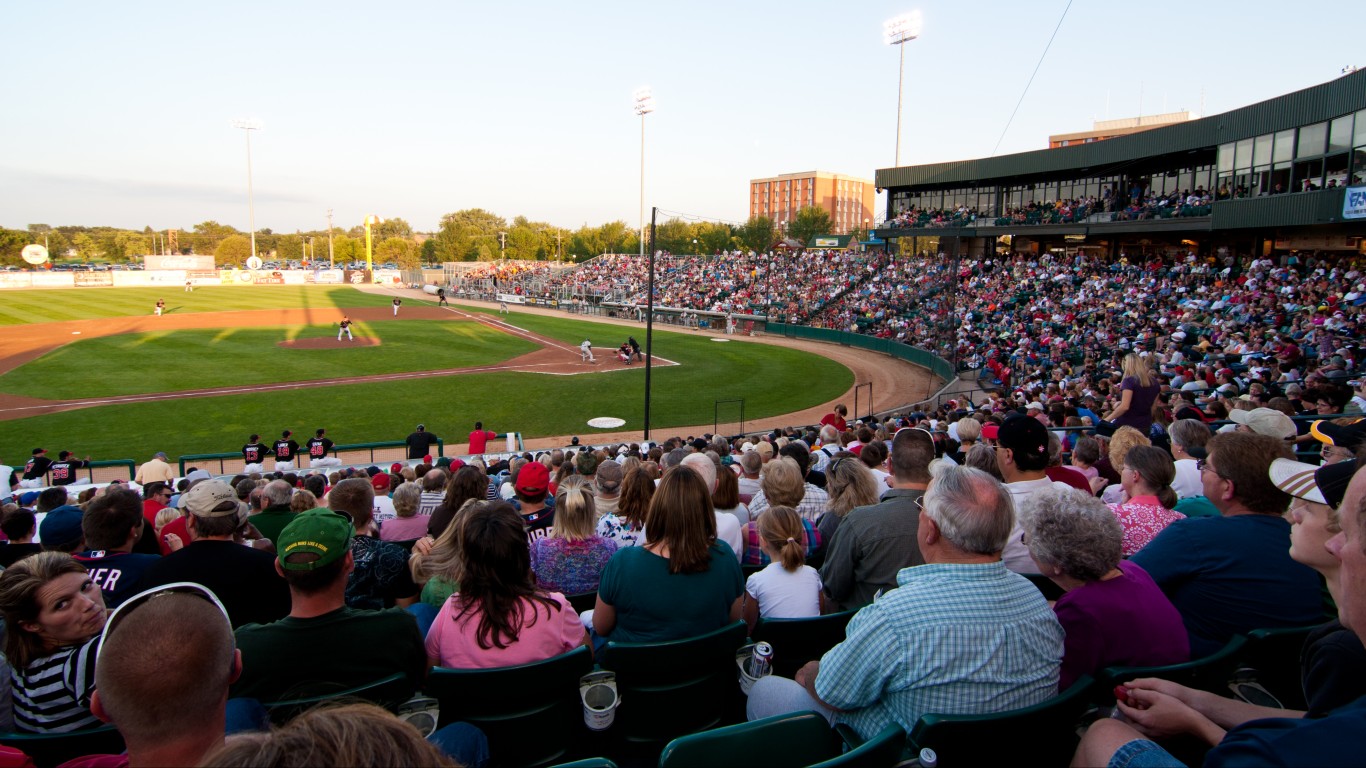
South Dakota: Sioux Falls
> Adults who exercise: 79.3% (state avg: 78.0%)
> Pop. with access to places for physical activity: 86.9% (state avg: 73.5%)
> Adult obesity rate: 31.4% (state avg: 32.4%)
> Pop. over 20 with diabetes: 8.8% (state avg: 10.1%)
> Adults in poor or fair health: 12.3% (state avg: 13.4%)
> Physically unhealthy days: 3.0 per month (state avg: 3.0 per month)
> Median household income: $65,566 (state avg: $59,533)
> Population: 268,833
[in-text-ad]

Tennessee: Nashville-Davidson–Murfreesboro–Franklin
> Adults who exercise: 76.1% (state avg: 72.8%)
> Pop. with access to places for physical activity: 75.6% (state avg: 70.2%)
> Adult obesity rate: 29.9% (state avg: 33.3%)
> Pop. over 20 with diabetes: 10.0% (state avg: 12.5%)
> Adults in poor or fair health: 18.6% (state avg: 21.2%)
> Physically unhealthy days: 4.3 per month (state avg: 4.7 per month)
> Median household income: $70,262 (state avg: $56,071)
> Population: 1,933,860
[recirclink id=864723]

Texas: Austin-Round Rock
> Adults who exercise: 82.8% (state avg: 76.8%)
> Pop. with access to places for physical activity: 87.1% (state avg: 80.5%)
> Adult obesity rate: 27.1% (state avg: 31.4%)
> Pop. over 20 with diabetes: 7.9% (state avg: 10.2%)
> Adults in poor or fair health: 16.3% (state avg: 18.7%)
> Physically unhealthy days: 3.5 per month (state avg: 3.8 per month)
> Median household income: $80,954 (state avg: $64,034)
> Population: 2,227,083

Utah: Provo-Orem
> Adults who exercise: 85.1% (state avg: 83.3%)
> Pop. with access to places for physical activity: 84.3% (state avg: 85.7%)
> Adult obesity rate: 25.8% (state avg: 27.0%)
> Pop. over 20 with diabetes: 6.2% (state avg: 7.5%)
> Adults in poor or fair health: 13.3% (state avg: 14.8%)
> Physically unhealthy days: 3.8 per month (state avg: 3.5 per month)
> Median household income: $79,152 (state avg: $75,780)
> Population: 649,603
[in-text-ad-2]

Vermont: Burlington-South Burlington
> Adults who exercise: 83.3% (state avg: 81.6%)
> Pop. with access to places for physical activity: 77.9% (state avg: 75.8%)
> Adult obesity rate: 25.5% (state avg: 27.0%)
> Pop. over 20 with diabetes: 7.7% (state avg: 8.8%)
> Adults in poor or fair health: 11.9% (state avg: 12.8%)
> Physically unhealthy days: 3.7 per month (state avg: 3.7 per month)
> Median household income: $74,909 (state avg: $63,001)
> Population: 219,433

Virginia: Charlottesville
> Adults who exercise: 80.4% (state avg: 77.8%)
> Pop. with access to places for physical activity: 70.6% (state avg: 82.4%)
> Adult obesity rate: 28.7% (state avg: 30.5%)
> Pop. over 20 with diabetes: 10.1% (state avg: 10.7%)
> Adults in poor or fair health: 16.3% (state avg: 16.6%)
> Physically unhealthy days: 3.8 per month (state avg: 3.5 per month)
> Median household income: $75,907 (state avg: $76,456)
> Population: 218,358
[in-text-ad]

Washington: Bellingham
> Adults who exercise: 87.3% (state avg: 83.6%)
> Pop. with access to places for physical activity: 85.1% (state avg: 86.2%)
> Adult obesity rate: 28.0% (state avg: 28.6%)
> Pop. over 20 with diabetes: 7.9% (state avg: 9.3%)
> Adults in poor or fair health: 15.0% (state avg: 15.0%)
> Physically unhealthy days: 4.2 per month (state avg: 3.7 per month)
> Median household income: $69,372 (state avg: $78,687)
> Population: 229,247
[recirclink id=886501]
West Virginia: Morgantown
> Adults who exercise: 78.2% (state avg: 72.0%)
> Pop. with access to places for physical activity: 69.3% (state avg: 59.4%)
> Adult obesity rate: 31.8% (state avg: 37.8%)
> Pop. over 20 with diabetes: 11.1% (state avg: 15.1%)
> Adults in poor or fair health: 20.8% (state avg: 23.6%)
> Physically unhealthy days: 4.8 per month (state avg: 5.3 per month)
> Median household income: $56,395 (state avg: $48,850)
> Population: 139,044
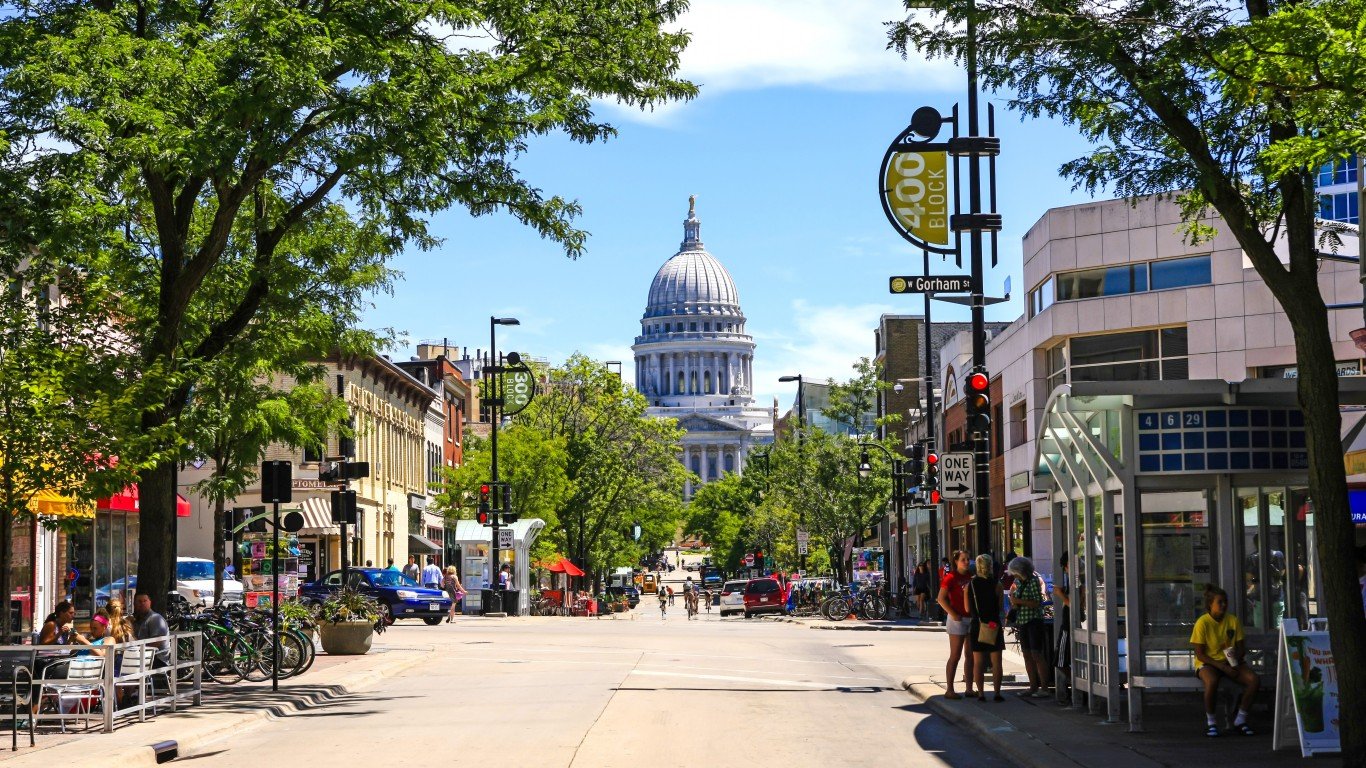
Wisconsin: Madison
> Adults who exercise: 84.5% (state avg: 79.7%)
> Pop. with access to places for physical activity: 88.9% (state avg: 85.2%)
> Adult obesity rate: 25.9% (state avg: 31.7%)
> Pop. over 20 with diabetes: 6.6% (state avg: 9.5%)
> Adults in poor or fair health: 12.5% (state avg: 14.8%)
> Physically unhealthy days: 3.4 per month (state avg: 3.7 per month)
> Median household income: $75,545 (state avg: $64,168)
> Population: 664,865
[in-text-ad-2]
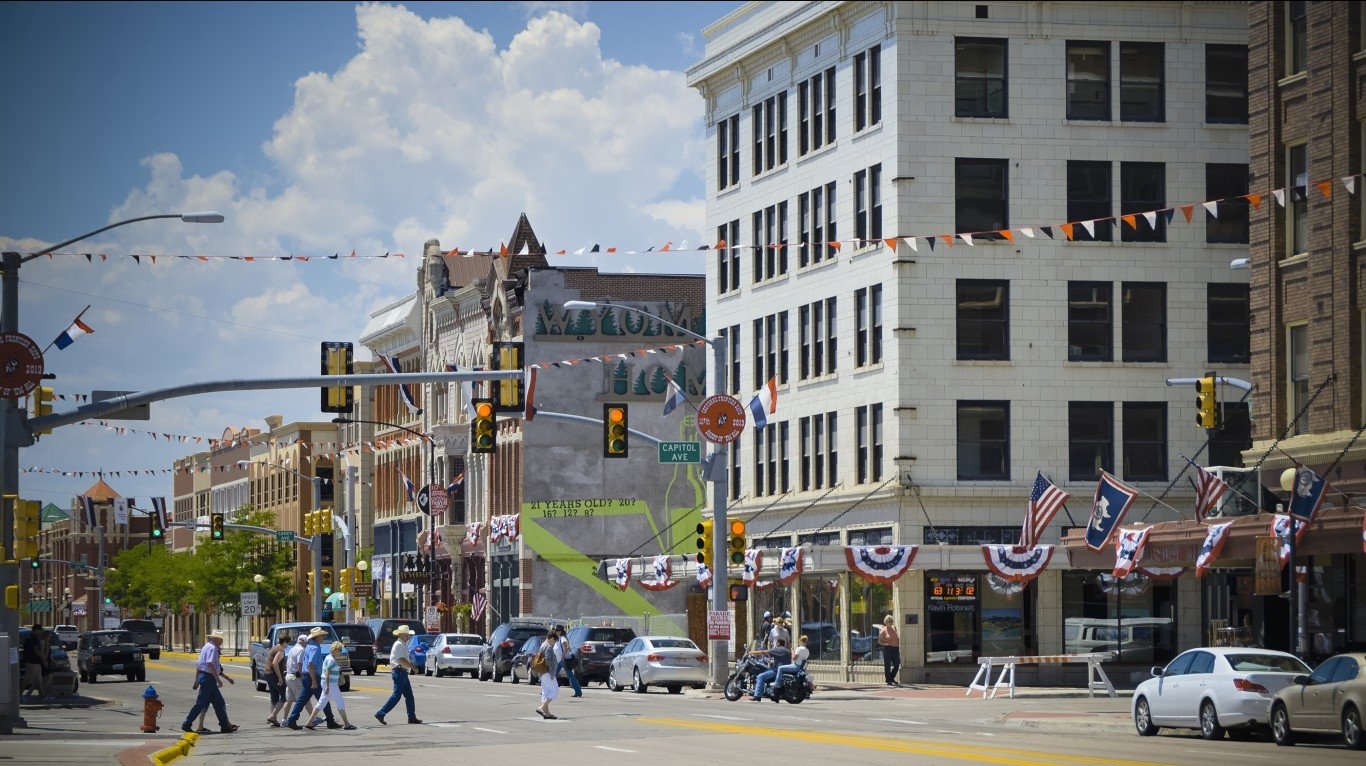
Wyoming: Cheyenne
> Adults who exercise: 77.5% (state avg: 76.9%)
> Pop. with access to places for physical activity: 71.3% (state avg: 76.5%)
> Adult obesity rate: 30.1% (state avg: 29.2%)
> Pop. over 20 with diabetes: 9.9% (state avg: 9.0%)
> Adults in poor or fair health: 15.4% (state avg: 15.3%)
> Physically unhealthy days: 3.8 per month (state avg: 3.5 per month)
> Median household income: $70,567 (state avg: $65,003)
> Population: 99,500
Contact [email protected] for any questions or corrections.