
The aggravated assault rate in the United States is at its highest level since 2007. According to the FBI, about 921,500 cases of violent assault were reported in 2020 nationwide, a 12% spike from the previous year.
The FBI defines aggravated assault as an unlawful physical attack with the purpose of causing severe injury or harm. Aggravated assaults are often carried out using a deadly weapon, such as a knife, handgun, or blunt object. Most cases of aggravated assault are committed in private residences, though a large share also take place on public streets or sidewalks.
While cases of assault are surging across the country, many major metropolitan areas are bucking the national trend, reporting substantial year-over-year declines in cases of aggravated assault per capita.
Using data from the FBI, 24/7 Wall St. identified the 50 metro areas where the aggravated assault rate is falling fastest. Metro areas are ranked by the year-over-year change in the number of violent assaults per 100,000 people in 2020. Among the metro areas on this list, the assault rate fell anywhere from 1 to 166 assaults per 100,000 people. Meanwhile, the national aggravated assault rate climbed by 29 assaults per 100,000 people in 2020.
Aggravated assaults – along with rаpe, robbery, and homicide – is one component of the overall violent crime category, and is by far the most common. Assaults accounted for about 70% of the 1.3 million violent offenses reported in 2020. Partially due to a falling aggravated assault rate, the overall violent crime rate in 2020 also declined in every metro area with available data on this list. Here is a look at the metro areas where crime is falling fastest.
The metro areas that reported the largest declines in assault cases per capita span the country, though California alone is home to six, more than any other state. The majority of metro areas on this list have a lower overall aggravated assault rate than the national rate of 280 per 100,000 people. Here is a look at the U.S. cities with the fewest assaults.
Click here to see the cities where the assault rate is declining fastest
Click here to read our detailed methodology

50. Lafayette, LA
> 1-yr. change in reported aggravated assaults per 100K people: -0.9
> Aggravated assaults reported in 2020: 1,784 — 51st highest of 213 metros
> Aggravated assaults per 100K people in 2020: 364.1 — 49th highest of 213 metros
> 1-yr. change in all violent crime: -16.5 — 36th lowest of 209 metros
> Violent crimes per 100K people in 2020: 450.0 — 62nd highest of 212 metros
> Population: 489,207
[in-text-ad]

49. Bridgeport-Stamford-Norwalk, CT
> 1-yr. change in reported aggravated assaults per 100K people: -1.0
> Aggravated assaults reported in 2020: 810 — 95th highest of 213 metros (tied)
> Aggravated assaults per 100K people in 2020: 87.2 — 7th lowest of 213 metros
> 1-yr. change in all violent crime: -10.3 — 47th lowest of 209 metros
> Violent crimes per 100K people in 2020: 163.9 — 14th lowest of 212 metros
> Population: 943,332
[recirclink id=1055273]

48. Madison, WI
> 1-yr. change in reported aggravated assaults per 100K people: -1.8
> Aggravated assaults reported in 2020: 940 — 88th highest of 213 metros
> Aggravated assaults per 100K people in 2020: 140.1 — 38th lowest of 213 metros
> 1-yr. change in all violent crime: -16.0 — 37th lowest of 209 metros
> Violent crimes per 100K people in 2020: 201.7 — 35th lowest of 212 metros
> Population: 664,865

47. Elmira, NY
> 1-yr. change in reported aggravated assaults per 100K people: -2.2
> Aggravated assaults reported in 2020: 110 — 9th lowest of 213 metros (tied)
> Aggravated assaults per 100K people in 2020: 133.6 — 35th lowest of 213 metros
> 1-yr. change in all violent crime: -3.8 — 66th lowest of 209 metros
> Violent crimes per 100K people in 2020: 210.1 — 37th lowest of 212 metros
> Population: 83,456
[in-text-ad-2]

46. Kankakee, IL
> 1-yr. change in reported aggravated assaults per 100K people: -2.3
> Aggravated assaults reported in 2020: 268 — 45th lowest of 213 metros
> Aggravated assaults per 100K people in 2020: 246.1 — 102nd lowest of 213 metros
> 1-yr. change in all violent crime: -33.2 — 20th lowest of 209 metros
> Violent crimes per 100K people in 2020: 355.4 — 105th lowest of 212 metros
> Population: 109,862
45. Oshkosh-Neenah, WI
> 1-yr. change in reported aggravated assaults per 100K people: -2.5
> Aggravated assaults reported in 2020: 227 — 34th lowest of 213 metros
> Aggravated assaults per 100K people in 2020: 131.7 — 33rd lowest of 213 metros
> 1-yr. change in all violent crime: -4.6 — 65th lowest of 209 metros
> Violent crimes per 100K people in 2020: 192.7 — 30th lowest of 212 metros
> Population: 171,907
[in-text-ad]

44. Burlington-South Burlington, VT
> 1-yr. change in reported aggravated assaults per 100K people: -2.6
> Aggravated assaults reported in 2020: 287 — 48th lowest of 213 metros
> Aggravated assaults per 100K people in 2020: 129.7 — 32nd lowest of 213 metros
> 1-yr. change in all violent crime: -2.1 — 70th lowest of 209 metros
> Violent crimes per 100K people in 2020: 198.4 — 32nd lowest of 212 metros
> Population: 219,433
[recirclink id=1059375]

43. Walla Walla, WA
> 1-yr. change in reported aggravated assaults per 100K people: -2.8
> Aggravated assaults reported in 2020: 88 — 6th lowest of 213 metros
> Aggravated assaults per 100K people in 2020: 144.8 — 42nd lowest of 213 metros
> 1-yr. change in all violent crime: -25.6 — 27th lowest of 209 metros
> Violent crimes per 100K people in 2020: 212.3 — 38th lowest of 212 metros
> Population: 60,760

42. Anchorage, AK
> 1-yr. change in reported aggravated assaults per 100K people: -3.3
> Aggravated assaults reported in 2020: 2,422 — 34th highest of 213 metros
> Aggravated assaults per 100K people in 2020: 793.4 — 4th highest of 213 metros
> 1-yr. change in all violent crime: -23.1 — 32nd lowest of 209 metros
> Violent crimes per 100K people in 2020: 1,171.5 — 2nd highest of 212 metros
> Population: 396,317
[in-text-ad-2]

41. Eau Claire, WI
> 1-yr. change in reported aggravated assaults per 100K people: -3.4
> Aggravated assaults reported in 2020: 209 — 31st lowest of 213 metros
> Aggravated assaults per 100K people in 2020: 122.9 — 26th lowest of 213 metros
> 1-yr. change in all violent crime: -22.6 — 33rd lowest of 209 metros
> Violent crimes per 100K people in 2020: 191.7 — 29th lowest of 212 metros
> Population: 169,304
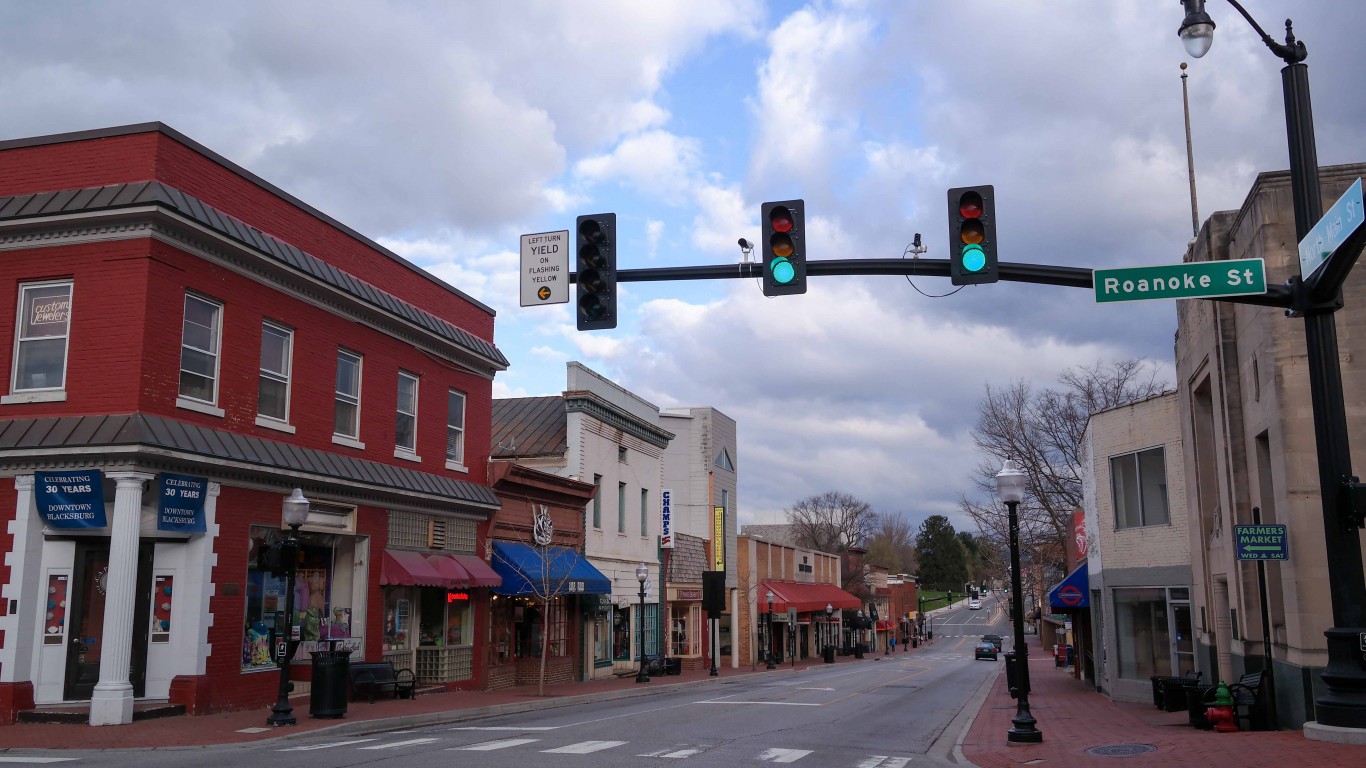
40. Blacksburg-Christiansburg, VA
> 1-yr. change in reported aggravated assaults per 100K people: -3.6
> Aggravated assaults reported in 2020: 189 — 26th lowest of 213 metros
> Aggravated assaults per 100K people in 2020: 112.6 — 17th lowest of 213 metros
> 1-yr. change in all violent crime: -5.9 — 61st lowest of 209 metros
> Violent crimes per 100K people in 2020: 186.4 — 24th lowest of 212 metros
> Population: 166,109
[in-text-ad]
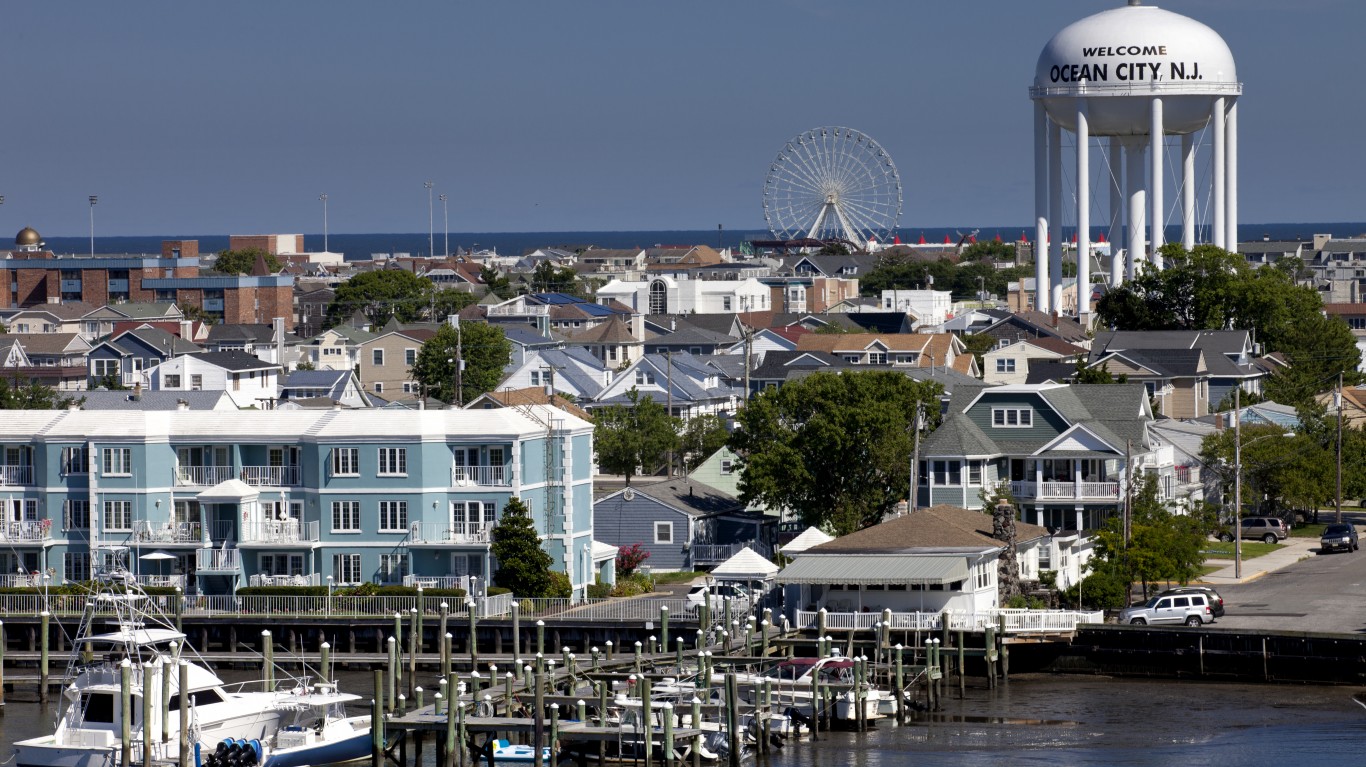
39. Ocean City, NJ
> 1-yr. change in reported aggravated assaults per 100K people: -4.1
> Aggravated assaults reported in 2020: 110 — 9th lowest of 213 metros (tied)
> Aggravated assaults per 100K people in 2020: 120.4 — 22nd lowest of 213 metros
> 1-yr. change in all violent crime: -7.3 — 59th lowest of 209 metros
> Violent crimes per 100K people in 2020: 168.5 — 16th lowest of 212 metros
> Population: 92,039
[recirclink id=990929]
38. California-Lexington Park, MD
> 1-yr. change in reported aggravated assaults per 100K people: -4.8
> Aggravated assaults reported in 2020: 151 — 20th lowest of 213 metros
> Aggravated assaults per 100K people in 2020: 132.4 — 34th lowest of 213 metros
> 1-yr. change in all violent crime: -8.0 — 55th lowest of 209 metros
> Violent crimes per 100K people in 2020: 196.4 — 31st lowest of 212 metros
> Population: 113,510
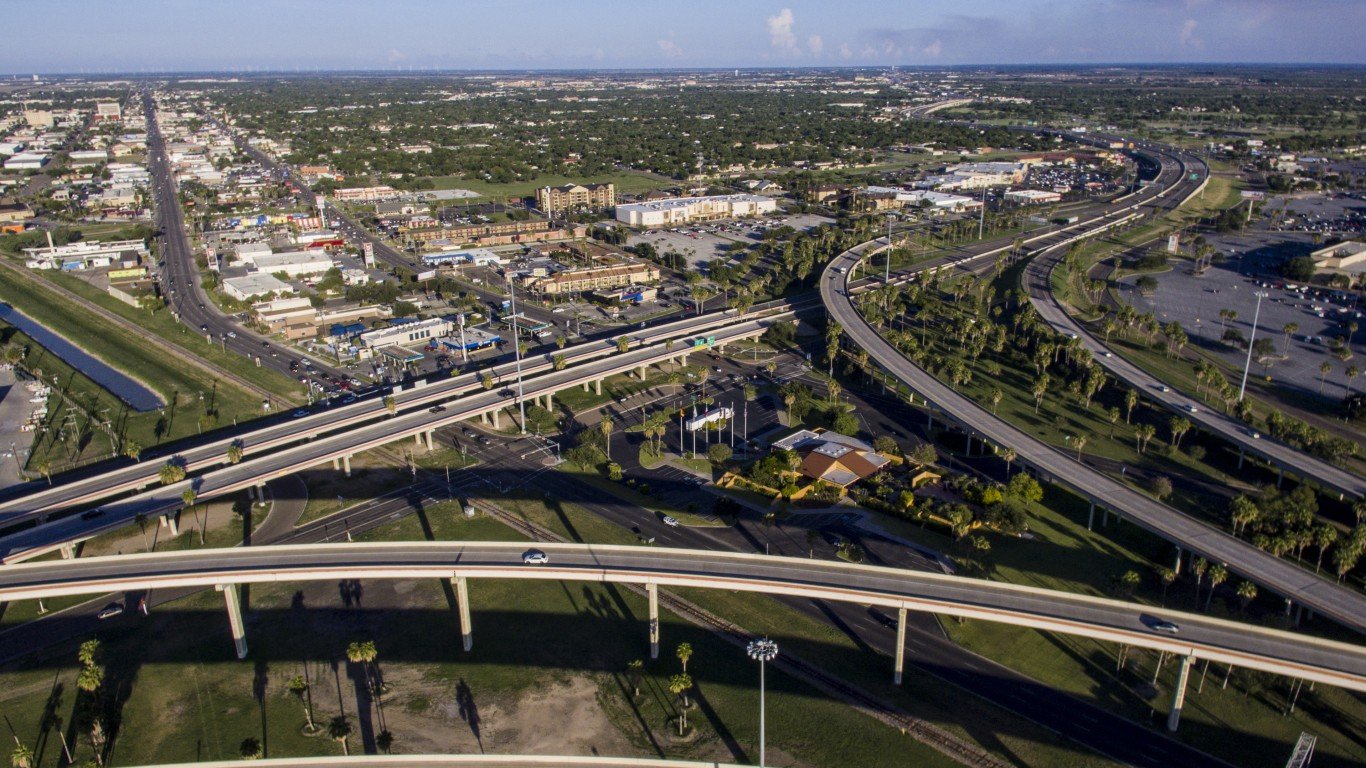
37. Brownsville-Harlingen, TX
> 1-yr. change in reported aggravated assaults per 100K people: -5.5
> Aggravated assaults reported in 2020: 1,092 — 77th highest of 213 metros
> Aggravated assaults per 100K people in 2020: 257.9 — 103rd highest of 213 metros
> 1-yr. change in all violent crime: -14.3 — 42nd lowest of 209 metros
> Violent crimes per 100K people in 2020: 360.8 — 105th highest of 212 metros
> Population: 423,163
[in-text-ad-2]

36. El Centro, CA
> 1-yr. change in reported aggravated assaults per 100K people: -5.6
> Aggravated assaults reported in 2020: 482 — 78th lowest of 213 metros
> Aggravated assaults per 100K people in 2020: 267.6 — 96th highest of 213 metros
> 1-yr. change in all violent crime: -1.3 — 75th lowest of 209 metros
> Violent crimes per 100K people in 2020: 338.1 — 97th lowest of 212 metros
> Population: 181,215

35. Las Vegas-Henderson-Paradise, NV
> 1-yr. change in reported aggravated assaults per 100K people: -5.7
> Aggravated assaults reported in 2020: 7,364 — 12th highest of 213 metros
> Aggravated assaults per 100K people in 2020: 318.2 — 68th highest of 213 metros
> 1-yr. change in all violent crime: -47.0 — 10th lowest of 209 metros
> Violent crimes per 100K people in 2020: 478.7 — 52nd highest of 212 metros
> Population: 2,266,715
[in-text-ad]

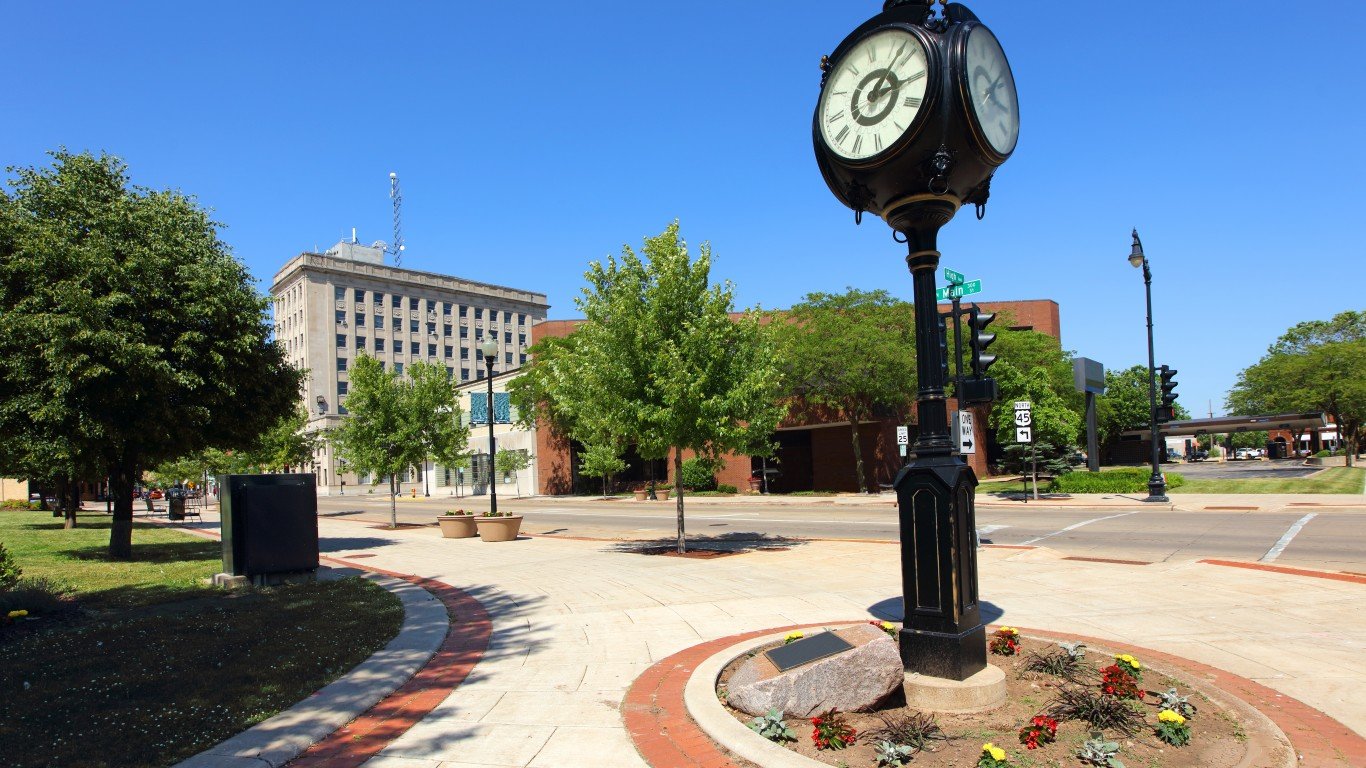
34. Peoria, IL
> 1-yr. change in reported aggravated assaults per 100K people: -7.1
> Aggravated assaults reported in 2020: 1,229 — 71st highest of 213 metros
> Aggravated assaults per 100K people in 2020: 309.7 — 75th highest of 213 metros
> 1-yr. change in all violent crime: -26.3 — 25th lowest of 209 metros
> Violent crimes per 100K people in 2020: 425.7 — 75th highest of 212 metros
> Population: 400,912
[recirclink id=993194]

33. Boston-Cambridge-Newton, MA-NH
> 1-yr. change in reported aggravated assaults per 100K people: -10.4
> Aggravated assaults reported in 2020: 9,362 — 7th highest of 213 metros
> Aggravated assaults per 100K people in 2020: 191.6 — 66th lowest of 213 metros
> 1-yr. change in all violent crime: -24.0 — 30th lowest of 209 metros
> Violent crimes per 100K people in 2020: 253.8 — 61st lowest of 212 metros
> Population: 4,873,019

32. Kingston, NY
> 1-yr. change in reported aggravated assaults per 100K people: -10.7
> Aggravated assaults reported in 2020: 145 — 16th lowest of 213 metros (tied)
> Aggravated assaults per 100K people in 2020: 82.4 — 6th lowest of 213 metros
> 1-yr. change in all violent crime: -10.3 — 46th lowest of 209 metros
> Violent crimes per 100K people in 2020: 139.8 — 5th lowest of 212 metros
> Population: 177,573
[in-text-ad-2]

31. Oxnard-Thousand Oaks-Ventura, CA
> 1-yr. change in reported aggravated assaults per 100K people: -10.7
> Aggravated assaults reported in 2020: 948 — 86th highest of 213 metros
> Aggravated assaults per 100K people in 2020: 112.9 — 19th lowest of 213 metros
> 1-yr. change in all violent crime: -15.3 — 40th lowest of 209 metros
> Violent crimes per 100K people in 2020: 200.7 — 33rd lowest of 212 metros
> Population: 846,006

30. Albuquerque, NM
> 1-yr. change in reported aggravated assaults per 100K people: -11.2
> Aggravated assaults reported in 2020: 7,058 — 13th highest of 213 metros
> Aggravated assaults per 100K people in 2020: 764.1 — 7th highest of 213 metros
> 1-yr. change in all violent crime: -37.1 — 16th lowest of 209 metros
> Violent crimes per 100K people in 2020: 1,006.4 — 5th highest of 212 metros
> Population: 914,480
[in-text-ad]

29. Wilmington, NC
> 1-yr. change in reported aggravated assaults per 100K people: -11.8
> Aggravated assaults reported in 2020: 799 — 98th highest of 213 metros
> Aggravated assaults per 100K people in 2020: 264.0 — 99th highest of 213 metros
> 1-yr. change in all violent crime: -7.9 — 56th lowest of 209 metros
> Violent crimes per 100K people in 2020: 372.1 — 95th highest of 212 metros
> Population: 297,533
[recirclink id=1004956]

28. Olympia-Lacey-Tumwater, WA
> 1-yr. change in reported aggravated assaults per 100K people: -11.9
> Aggravated assaults reported in 2020: 454 — 73rd lowest of 213 metros
> Aggravated assaults per 100K people in 2020: 154.4 — 49th lowest of 213 metros
> 1-yr. change in all violent crime: -23.2 — 31st lowest of 209 metros
> Violent crimes per 100K people in 2020: 223.4 — 43rd lowest of 212 metros
> Population: 290,536

27. Columbia, SC
> 1-yr. change in reported aggravated assaults per 100K people: -12.4
> Aggravated assaults reported in 2020: 3,652 — 23rd highest of 213 metros
> Aggravated assaults per 100K people in 2020: 430.9 — 34th highest of 213 metros
> 1-yr. change in all violent crime: -25.4 — 28th lowest of 209 metros
> Violent crimes per 100K people in 2020: 558.0 — 37th highest of 212 metros
> Population: 839,039
[in-text-ad-2]

26. Spokane-Spokane Valley, WA
> 1-yr. change in reported aggravated assaults per 100K people: -13.3
> Aggravated assaults reported in 2020: 1,300 — 67th highest of 213 metros (tied)
> Aggravated assaults per 100K people in 2020: 226.9 — 87th lowest of 213 metros
> 1-yr. change in all violent crime: -31.0 — 21st lowest of 209 metros
> Violent crimes per 100K people in 2020: 350.0 — 101st lowest of 212 metros
> Population: 568,521

25. Flint, MI
> 1-yr. change in reported aggravated assaults per 100K people: -13.9
> Aggravated assaults reported in 2020: 1,812 — 48th highest of 213 metros
> Aggravated assaults per 100K people in 2020: 450.3 — 29th highest of 213 metros
> 1-yr. change in all violent crime: -2.1 — 69th lowest of 209 metros
> Violent crimes per 100K people in 2020: 577.6 — 32nd highest of 212 metros
> Population: 405,813
[in-text-ad]
24. Ames, IA
> 1-yr. change in reported aggravated assaults per 100K people: -15.2
> Aggravated assaults reported in 2020: 141 — 15th lowest of 213 metros
> Aggravated assaults per 100K people in 2020: 113.7 — 20th lowest of 213 metros
> 1-yr. change in all violent crime: -15.5 — 39th lowest of 209 metros
> Violent crimes per 100K people in 2020: 183.8 — 21st lowest of 212 metros
> Population: 123,351
[recirclink id=1055273]
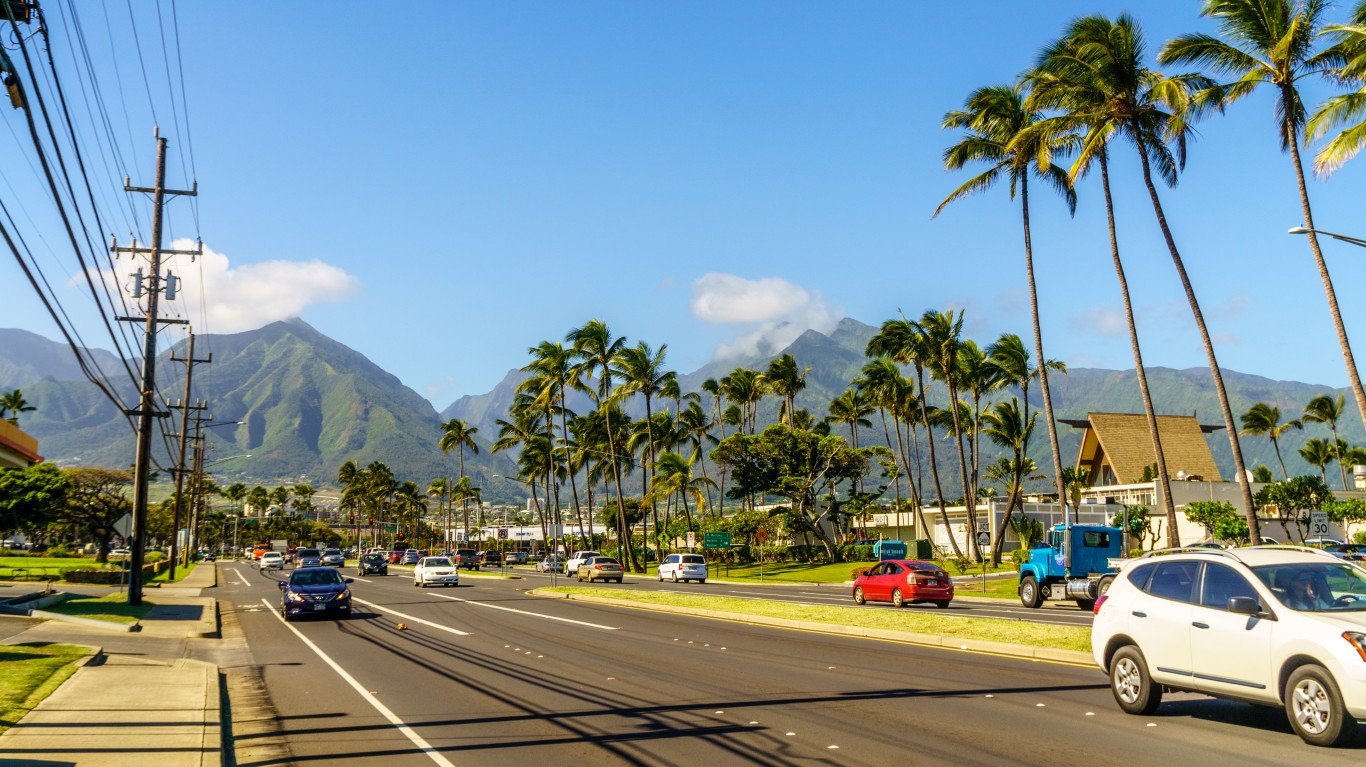
23. Kahului-Wailuku-Lahaina, HI
> 1-yr. change in reported aggravated assaults per 100K people: -15.9
> Aggravated assaults reported in 2020: 244 — 39th lowest of 213 metros (tied)
> Aggravated assaults per 100K people in 2020: 146.0 — 44th lowest of 213 metros
> 1-yr. change in all violent crime: -41.4 — 14th lowest of 209 metros
> Violent crimes per 100K people in 2020: 226.7 — 47th lowest of 212 metros
> Population: 167,488

22. Barnstable Town, MA
> 1-yr. change in reported aggravated assaults per 100K people: -16.6
> Aggravated assaults reported in 2020: 512 — 84th lowest of 213 metros (tied)
> Aggravated assaults per 100K people in 2020: 242.0 — 99th lowest of 213 metros
> 1-yr. change in all violent crime: -26.6 — 24th lowest of 209 metros
> Violent crimes per 100K people in 2020: 300.2 — 80th lowest of 212 metros
> Population: 212,990
[in-text-ad-2]
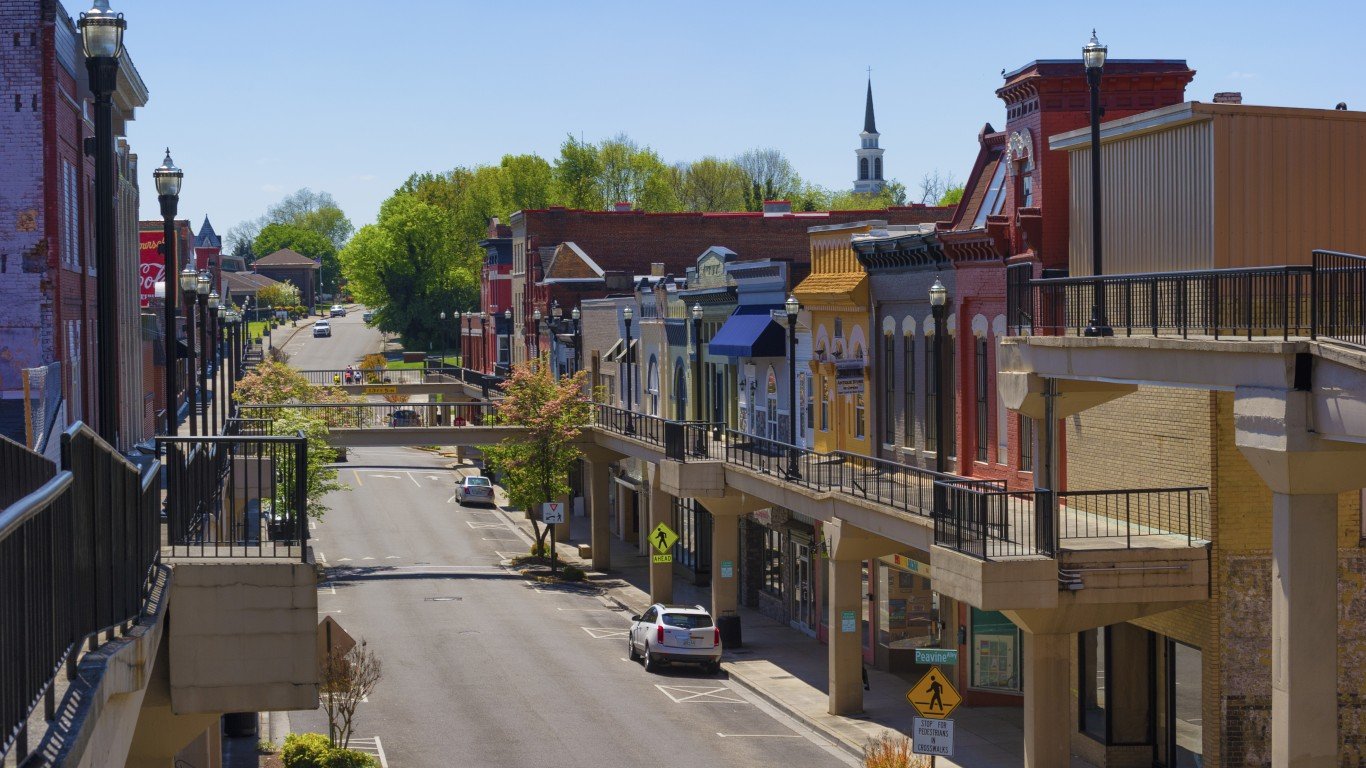
21. Morristown, TN
> 1-yr. change in reported aggravated assaults per 100K people: -19.1
> Aggravated assaults reported in 2020: 448 — 72nd lowest of 213 metros
> Aggravated assaults per 100K people in 2020: 312.4 — 72nd highest of 213 metros
> 1-yr. change in all violent crime: -25.8 — 26th lowest of 209 metros
> Violent crimes per 100K people in 2020: 361.9 — 104th highest of 212 metros
> Population: 142,749

20. Bay City, MI
> 1-yr. change in reported aggravated assaults per 100K people: -23.9
> Aggravated assaults reported in 2020: 259 — 43rd lowest of 213 metros
> Aggravated assaults per 100K people in 2020: 253.2 — 106th highest of 213 metros
> 1-yr. change in all violent crime: -8.3 — 52nd lowest of 209 metros
> Violent crimes per 100K people in 2020: 375.4 — 94th highest of 212 metros
> Population: 103,126
[in-text-ad]

19. Coeur d’Alene, ID
> 1-yr. change in reported aggravated assaults per 100K people: -24.2
> Aggravated assaults reported in 2020: 244 — 39th lowest of 213 metros (tied)
> Aggravated assaults per 100K people in 2020: 143.3 — 41st lowest of 213 metros
> 1-yr. change in all violent crime: -17.5 — 35th lowest of 209 metros
> Violent crimes per 100K people in 2020: 201.5 — 34th lowest of 212 metros
> Population: 165,697
[recirclink id=1059375]
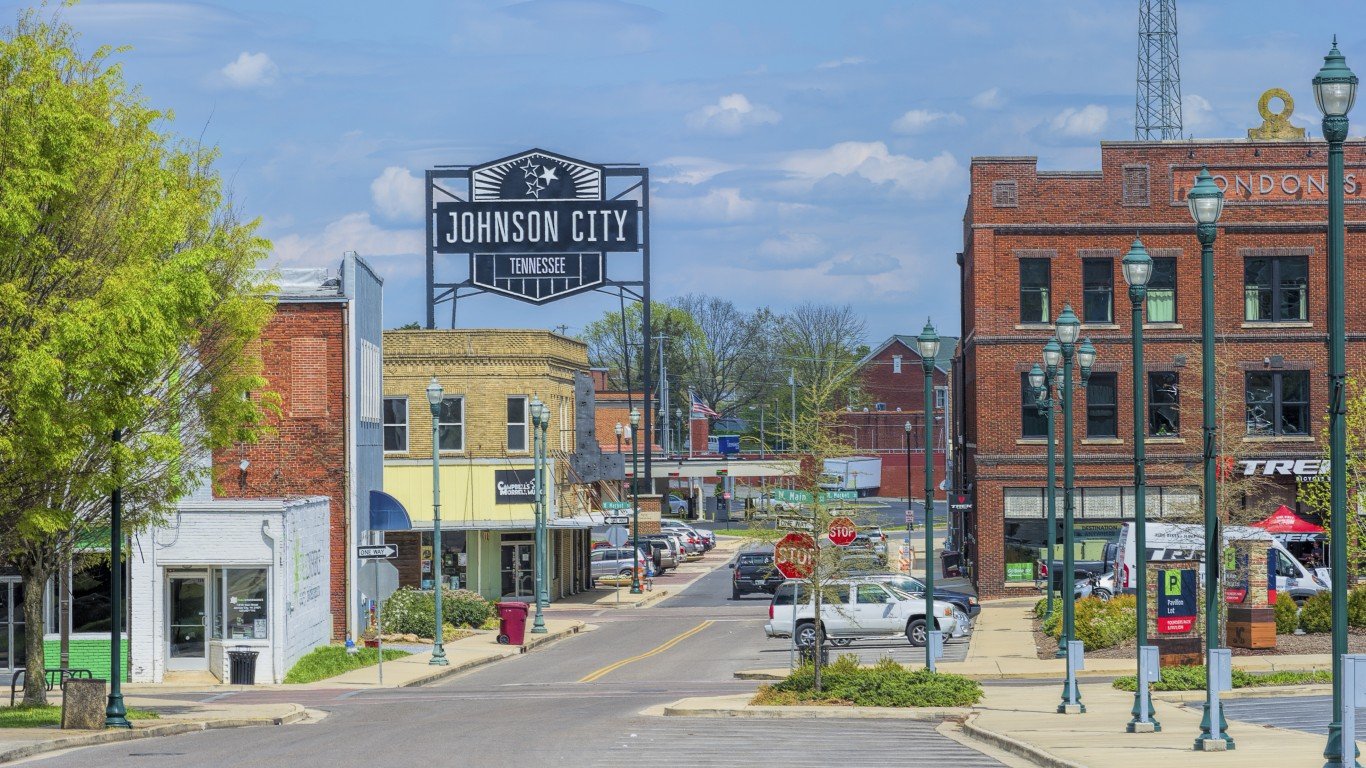
18. Johnson City, TN
> 1-yr. change in reported aggravated assaults per 100K people: -24.2
> Aggravated assaults reported in 2020: 512 — 84th lowest of 213 metros (tied)
> Aggravated assaults per 100K people in 2020: 250.7 — 105th lowest of 213 metros
> 1-yr. change in all violent crime: -22.5 — 34th lowest of 209 metros
> Violent crimes per 100K people in 2020: 306.1 — 84th lowest of 212 metros
> Population: 203,697

17. Bremerton-Silverdale-Port Orchard, WA
> 1-yr. change in reported aggravated assaults per 100K people: -24.9
> Aggravated assaults reported in 2020: 402 — 65th lowest of 213 metros
> Aggravated assaults per 100K people in 2020: 147.3 — 45th lowest of 213 metros
> 1-yr. change in all violent crime: -42.6 — 13th lowest of 209 metros
> Violent crimes per 100K people in 2020: 218.8 — 42nd lowest of 212 metros
> Population: 271,473
[in-text-ad-2]

16. Bellingham, WA
> 1-yr. change in reported aggravated assaults per 100K people: -25.5
> Aggravated assaults reported in 2020: 261 — 44th lowest of 213 metros
> Aggravated assaults per 100K people in 2020: 112.6 — 18th lowest of 213 metros
> 1-yr. change in all violent crime: -35.4 — 17th lowest of 209 metros
> Violent crimes per 100K people in 2020: 184.7 — 23rd lowest of 212 metros
> Population: 229,247

15. Stockton, CA
> 1-yr. change in reported aggravated assaults per 100K people: -25.9
> Aggravated assaults reported in 2020: 3,888 — 21st highest of 213 metros
> Aggravated assaults per 100K people in 2020: 509.4 — 20th highest of 213 metros
> 1-yr. change in all violent crime: -65.7 — 7th lowest of 209 metros
> Violent crimes per 100K people in 2020: 722.8 — 14th highest of 212 metros
> Population: 762,148
[in-text-ad]

14. Huntington-Ashland, WV-KY-OH
> 1-yr. change in reported aggravated assaults per 100K people: -27.2
> Aggravated assaults reported in 2020: 571 — 89th lowest of 213 metros
> Aggravated assaults per 100K people in 2020: 161.3 — 51st lowest of 213 metros
> 1-yr. change in all violent crime: -25.0 — 29th lowest of 209 metros
> Violent crimes per 100K people in 2020: 240.2 — 53rd lowest of 212 metros
> Population: 355,873
[recirclink id=990929]

13. Crestview-Fort Walton Beach-Destin, FL
> 1-yr. change in reported aggravated assaults per 100K people: -31.4
> Aggravated assaults reported in 2020: 603 — 95th lowest of 213 metros (tied)
> Aggravated assaults per 100K people in 2020: 207.9 — 79th lowest of 213 metros
> 1-yr. change in all violent crime: -44.3 — 11th lowest of 209 metros
> Violent crimes per 100K people in 2020: 268.9 — 67th lowest of 212 metros
> Population: 284,809

12. Hilton Head Island-Bluffton, SC
> 1-yr. change in reported aggravated assaults per 100K people: -33.5
> Aggravated assaults reported in 2020: 587 — 91st lowest of 213 metros (tied)
> Aggravated assaults per 100K people in 2020: 259.0 — 102nd highest of 213 metros
> 1-yr. change in all violent crime: -70.6 — 6th lowest of 209 metros
> Violent crimes per 100K people in 2020: 326.9 — 91st lowest of 212 metros
> Population: 222,195
[in-text-ad-2]

11. Santa Cruz-Watsonville, CA
> 1-yr. change in reported aggravated assaults per 100K people: -34.6
> Aggravated assaults reported in 2020: 682 — 104th highest of 213 metros
> Aggravated assaults per 100K people in 2020: 251.1 — 106th lowest of 213 metros
> 1-yr. change in all violent crime: -47.5 — 9th lowest of 209 metros
> Violent crimes per 100K people in 2020: 357.1 — 106th lowest of 212 metros
> Population: 273,213

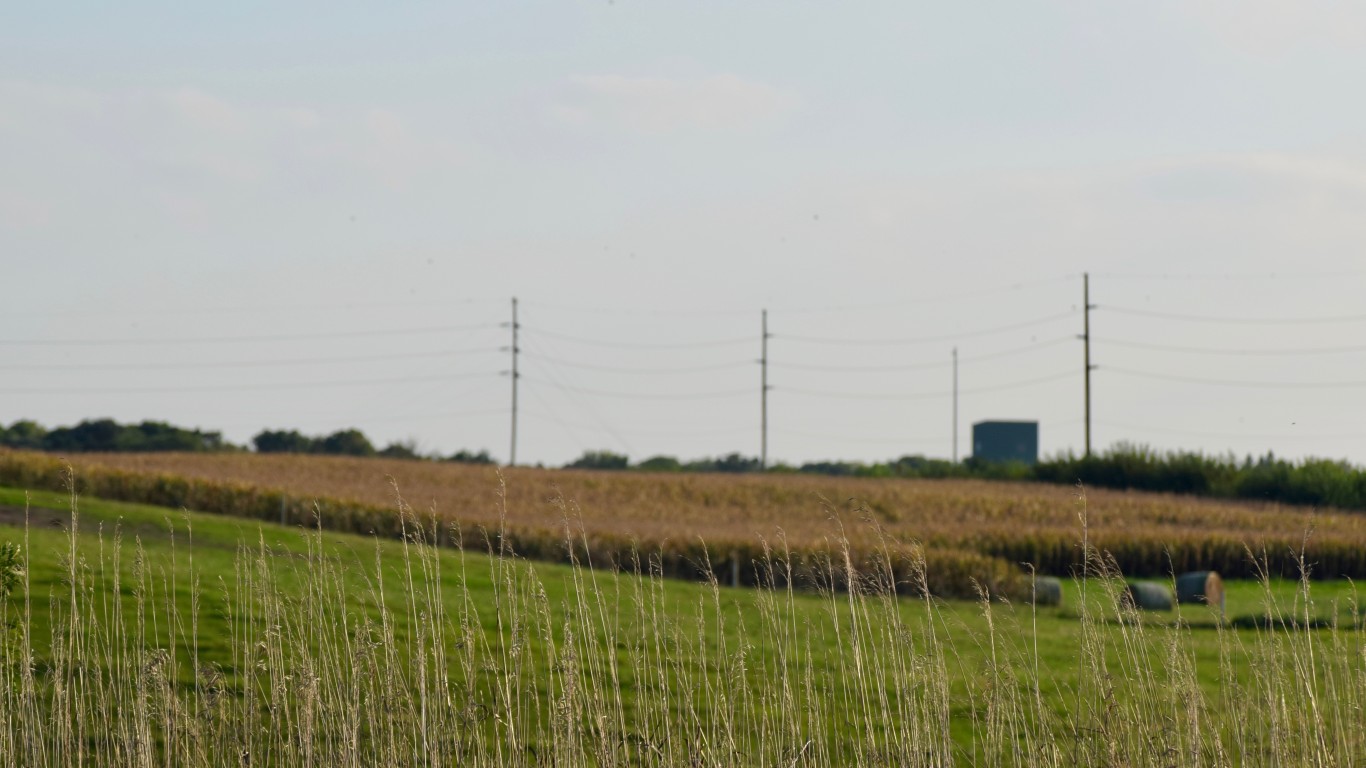
10. Grand Island, NE
> 1-yr. change in reported aggravated assaults per 100K people: -35.7
> Aggravated assaults reported in 2020: 181 — 25th lowest of 213 metros
> Aggravated assaults per 100K people in 2020: 239.8 — 97th lowest of 213 metros
> 1-yr. change in all violent crime: -35.2 — 18th lowest of 209 metros
> Violent crimes per 100K people in 2020: 340.5 — 98th lowest of 212 metros
> Population: 75,553
[in-text-ad]
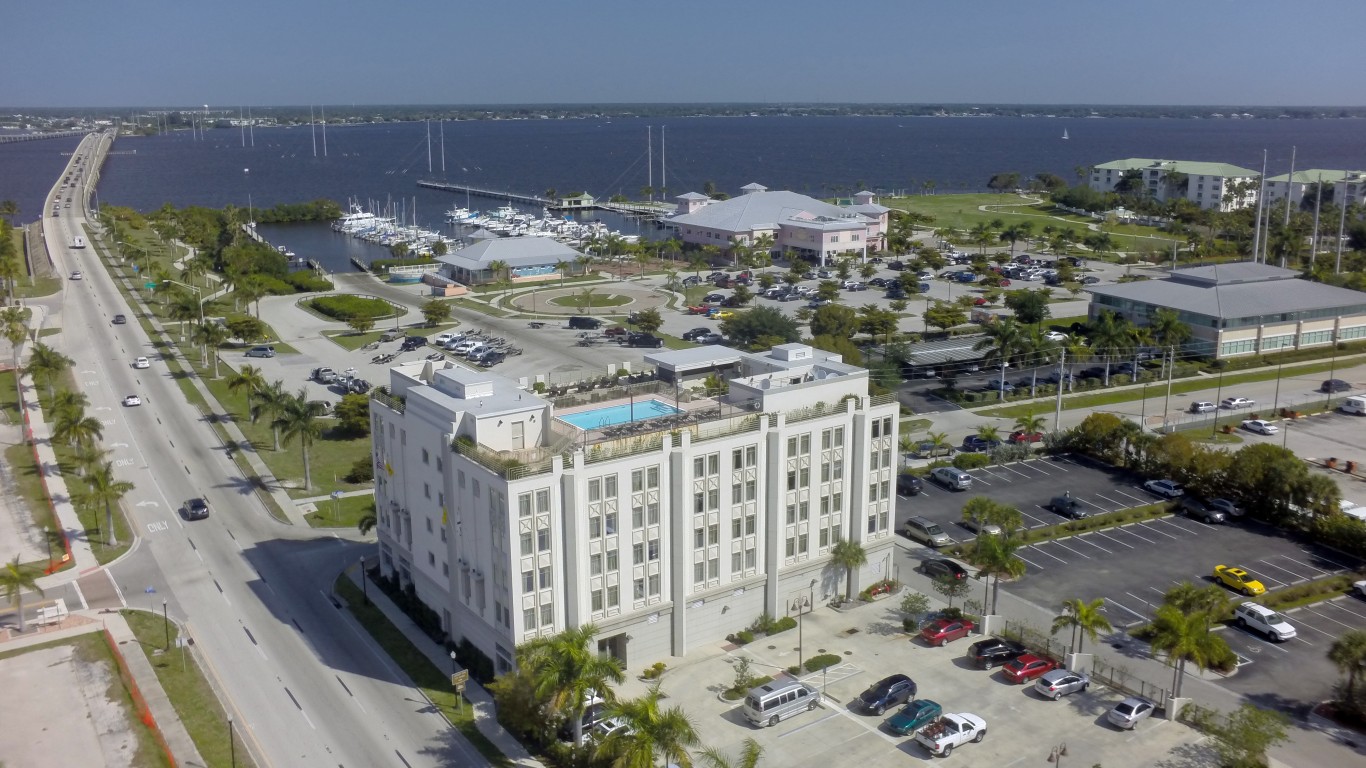
9. Punta Gorda, FL
> 1-yr. change in reported aggravated assaults per 100K people: -38.5
> Aggravated assaults reported in 2020: 238 — 38th lowest of 213 metros
> Aggravated assaults per 100K people in 2020: 124.0 — 28th lowest of 213 metros
> 1-yr. change in all violent crime: -44.0 — 12th lowest of 209 metros
> Violent crimes per 100K people in 2020: 152.2 — 10th lowest of 212 metros
> Population: 188,910
[recirclink id=993194]

8. Manhattan, KS
> 1-yr. change in reported aggravated assaults per 100K people: -41.2
> Aggravated assaults reported in 2020: 396 — 63rd lowest of 213 metros
> Aggravated assaults per 100K people in 2020: 304.0 — 80th highest of 213 metros
> 1-yr. change in all violent crime: -54.8 — 8th lowest of 209 metros
> Violent crimes per 100K people in 2020: 376.1 — 93rd highest of 212 metros
> Population: 130,285
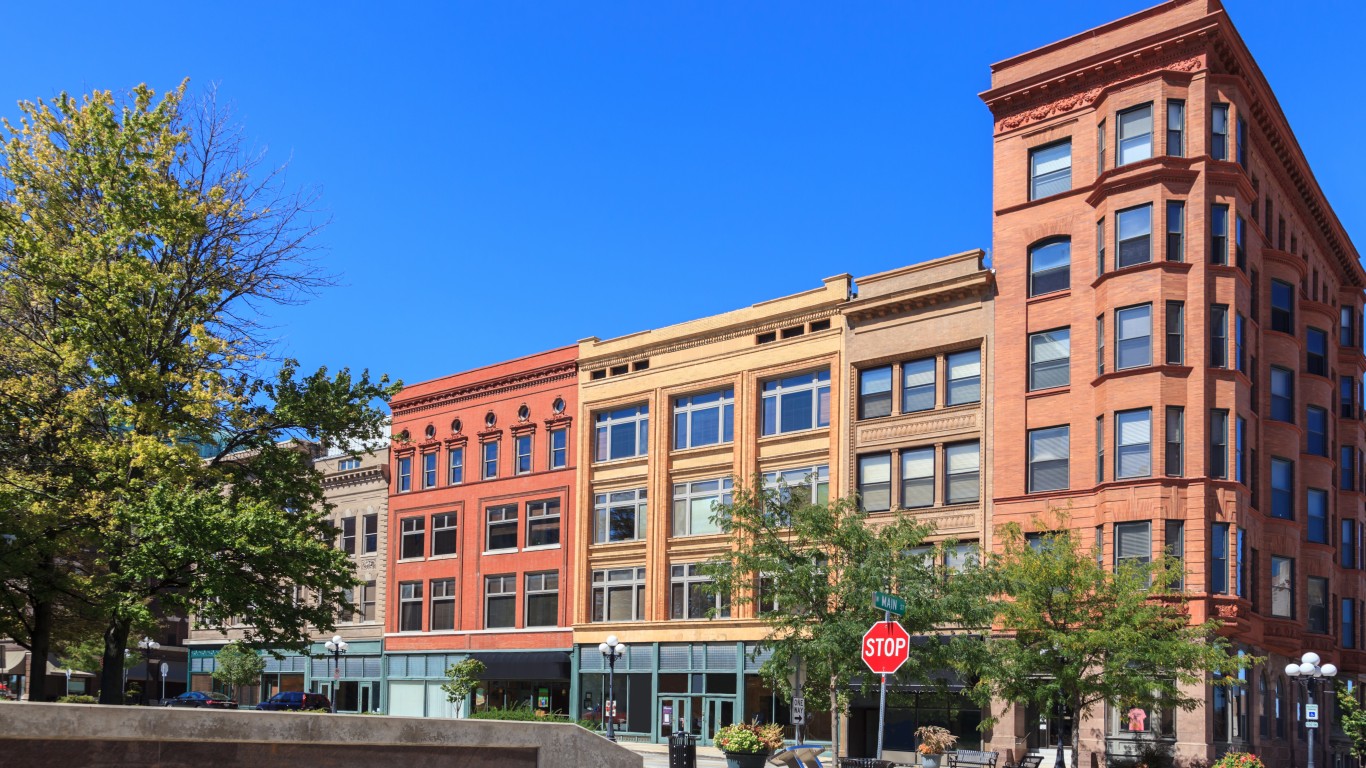
7. Bloomington, IL
> 1-yr. change in reported aggravated assaults per 100K people: -42.3
> Aggravated assaults reported in 2020: 331 — 53rd lowest of 213 metros (tied)
> Aggravated assaults per 100K people in 2020: 193.8 — 70th lowest of 213 metros
> 1-yr. change in all violent crime: -71.0 — 5th lowest of 209 metros
> Violent crimes per 100K people in 2020: 282.8 — 73rd lowest of 212 metros
> Population: 171,517
[in-text-ad-2]

6. Prescott Valley-Prescott, AZ
> 1-yr. change in reported aggravated assaults per 100K people: -47.0
> Aggravated assaults reported in 2020: 477 — 77th lowest of 213 metros
> Aggravated assaults per 100K people in 2020: 199.5 — 72nd lowest of 213 metros
> 1-yr. change in all violent crime: -34.2 — 19th lowest of 209 metros
> Violent crimes per 100K people in 2020: 242.9 — 54th lowest of 212 metros
> Population: 235,099

5. Great Falls, MT
> 1-yr. change in reported aggravated assaults per 100K people: -47.1
> Aggravated assaults reported in 2020: 276 — 47th lowest of 213 metros
> Aggravated assaults per 100K people in 2020: 338.5 — 58th highest of 213 metros
> 1-yr. change in all violent crime: N/A
> Violent crimes per 100K people in 2020: 440.3 — 67th highest of 212 metros
> Population: 81,366
[in-text-ad]

4. Sebastian-Vero Beach, FL
> 1-yr. change in reported aggravated assaults per 100K people: -68.3
> Aggravated assaults reported in 2020: 174 — 24th lowest of 213 metros
> Aggravated assaults per 100K people in 2020: 107.4 — 14th lowest of 213 metros
> 1-yr. change in all violent crime: -86.5 — 4th lowest of 209 metros
> Violent crimes per 100K people in 2020: 135.1 — 4th lowest of 212 metros
> Population: 159,923
[recirclink id=1004956]

3. Lawton, OK
> 1-yr. change in reported aggravated assaults per 100K people: -104.5
> Aggravated assaults reported in 2020: 552 — 88th lowest of 213 metros
> Aggravated assaults per 100K people in 2020: 438.6 — 33rd highest of 213 metros
> 1-yr. change in all violent crime: -113.4 — 3rd lowest of 209 metros
> Violent crimes per 100K people in 2020: 603.0 — 29th highest of 212 metros
> Population: 126,043

2. Napa, CA
> 1-yr. change in reported aggravated assaults per 100K people: -123.9
> Aggravated assaults reported in 2020: 414 — 68th lowest of 213 metros
> Aggravated assaults per 100K people in 2020: 303.4 — 81st highest of 213 metros
> 1-yr. change in all violent crime: -148.5 — 2nd lowest of 209 metros
> Violent crimes per 100K people in 2020: 394.9 — 85th highest of 212 metros
> Population: 137,744
[in-text-ad-2]

1. Madera, CA
> 1-yr. change in reported aggravated assaults per 100K people: -165.5
> Aggravated assaults reported in 2020: 403 — 66th lowest of 213 metros
> Aggravated assaults per 100K people in 2020: 257.6 — 104th highest of 213 metros
> 1-yr. change in all violent crime: -158.6 — the lowest of 209 metros
> Violent crimes per 100K people in 2020: 369.4 — 97th highest of 212 metros
> Population: 157,327
Methodology
To determine the metro areas where the aggravated assault rate is falling fastest, 24/7 Wall St. reviewed the change in aggravated assaults per 100,000 people from the FBI’s 2019 and 2020 Uniform Crime Reports.
Limited data was available in the 2020 UCR for areas in Alabama, Maryland, Pennsylvania, and Illinois, though metro areas in these states were not excluded from analysis. Only metro areas for which the boundaries defined by the FBI match the boundaries as defined by the U.S. Census Bureau were considered. Because some state and local agencies changed reporting practices between 2019 and 2020, the figures are not comparable, and the areas were excluded.
Population figures are one-year estimates from the U.S. Census Bureau’s 2019 American Community Survey. However, these estimates were not used to calculate crime rates. Crime rates per 100,000 people were calculated using population figures provided by the FBI in the 2020 and 2019 UCR.
Contact [email protected] for any questions or corrections.