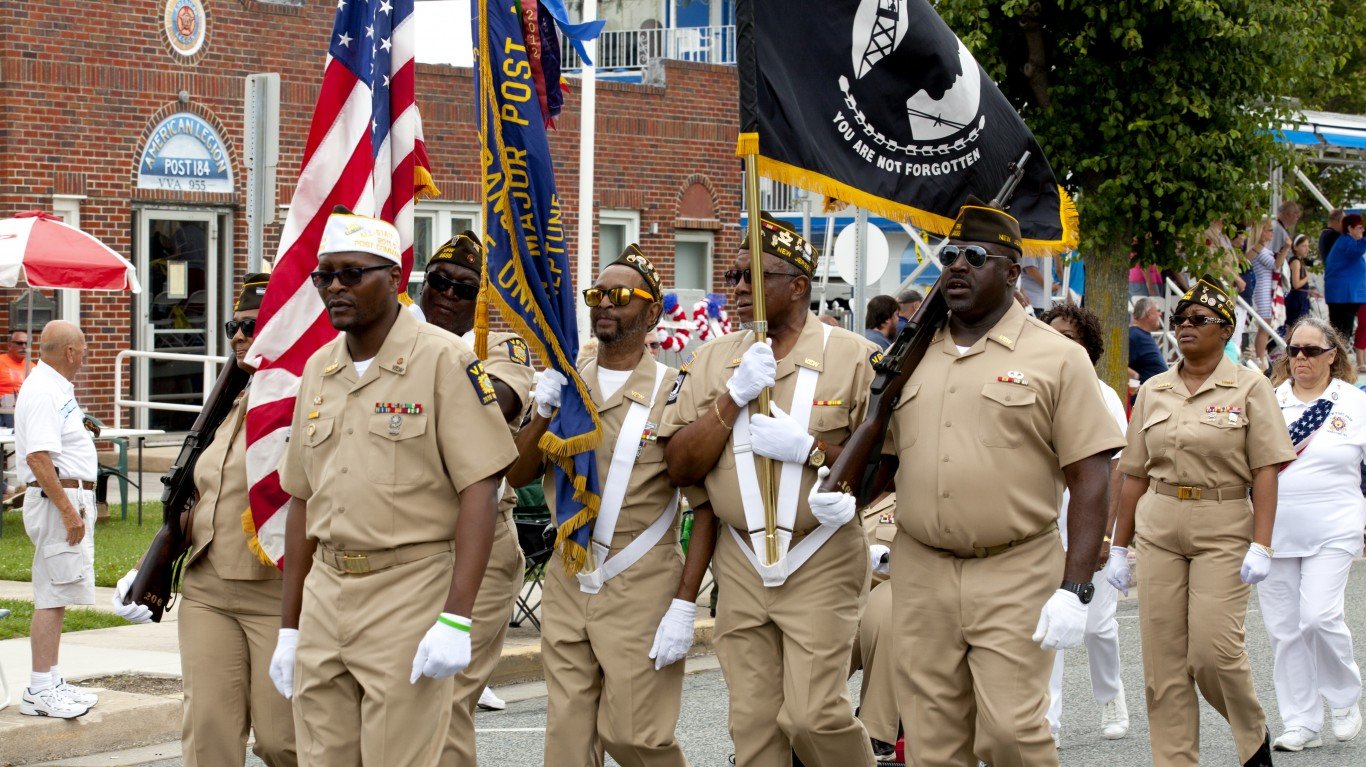
There are over 17.8 million military veterans living in the United States. These men and women, who have sacrificed more for their country than most lifelong civilians ever will, reside in cities and towns across the country, and are an important part of the social and economic fabric of their communities.
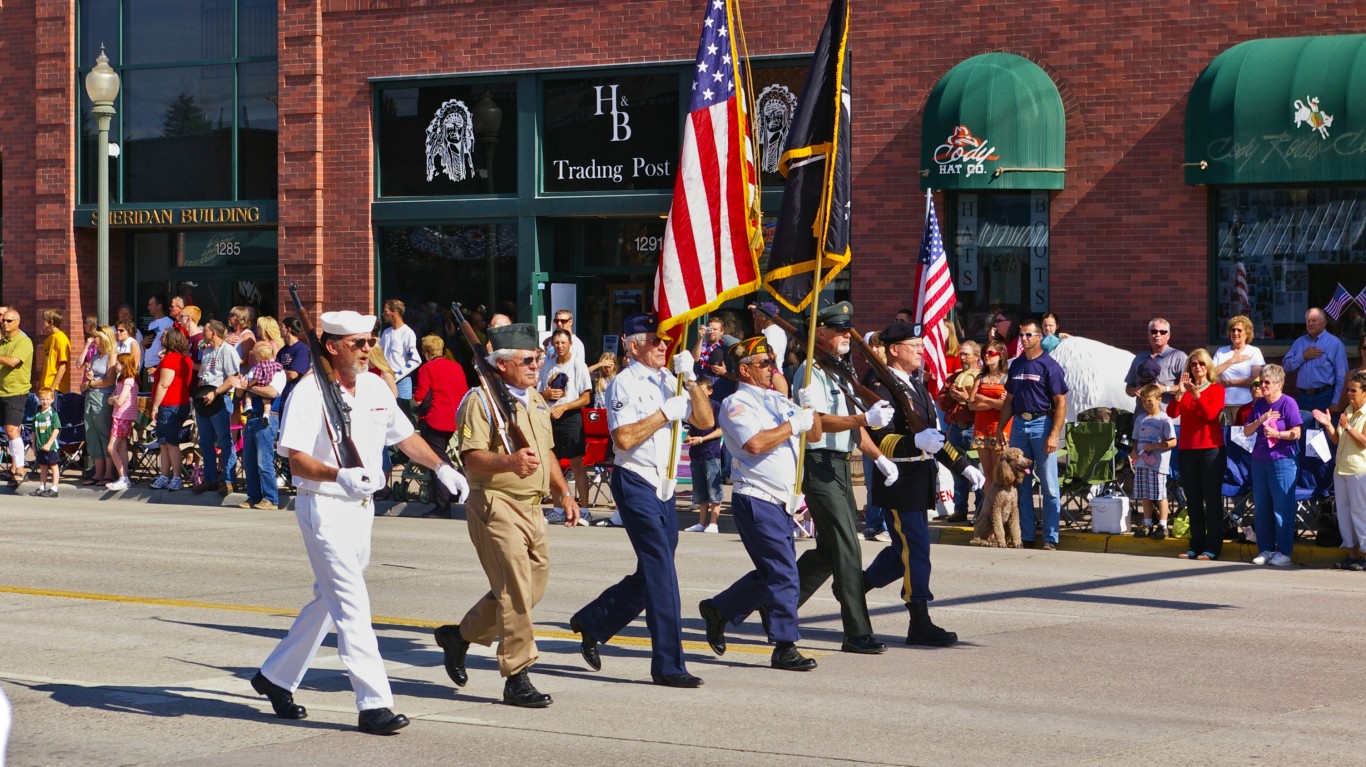
Young Americans enlist in the armed services for many reasons. In addition to service to their country, the reasons often include the opportunity to get physically fit and gain new skills. And many of these skills appear to pay off beyond their military service. A Pew Research study found that over half of all veterans say their service provided them with useful training for the civilian job market. Veterans are also less likely to live in poverty and more likely to have higher incomes than their non-veteran counterparts.
Nationwide, 7.1% of the total U.S. civilian adult population are veterans. This amount can vary considerably from place to place, however, and in some U.S. counties, veteran populations are relatively small. Using data from the U.S. Census Bureau, 24/7 Wall St. identified the county or county equivalent with the fewest veterans in every state.
Among the counties on this list, veteran populations range from as little as 1.3% to 8.1% of all civilians 18 and older, and in most cases, falls below the statewide share by at least 3 percentage points. Many counties on this list are in, or in close proximity to, a major city. These include San Francisco County, California; Miami-Dade County, Florida; Kings County, New York; and Philadelphia County, Pennsylvania.
Military veterans are slightly less likely than non-veterans to have a bachelor’s degree, and several of the places on this list are home to large colleges and universities, including Providence County, Rhode Island, and Utah County, Utah. Here is a look at the U.S. presidents who have served in the military.
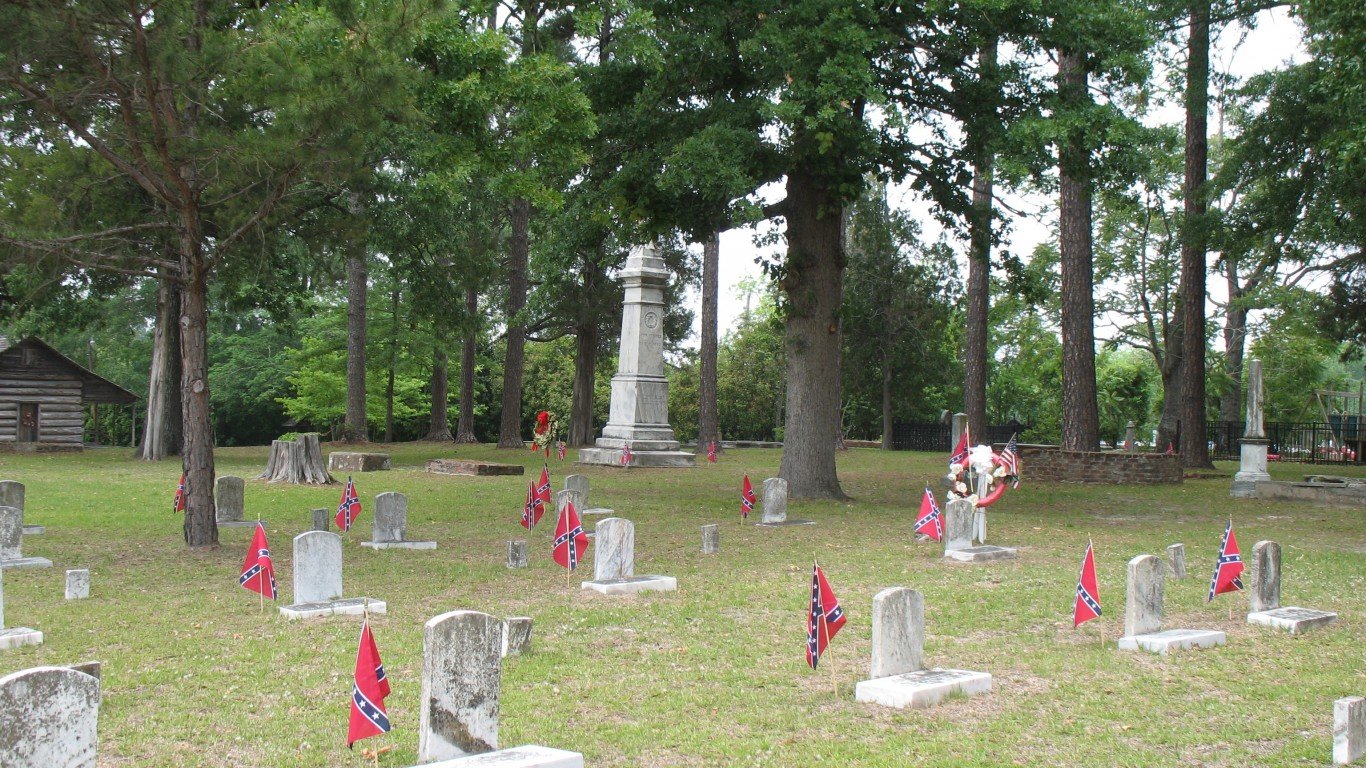
While many veterans chose to enlist out of a sense of patriotic duty, many living veterans did not choose to serve and were drafted into the military during the Vietnam War. In nearly every county on this list, those whose period of service is confined to the Vietnam Era account for over 25% of the total veteran population. Here is a look at the wars that claimed the most American lives.
Click here to see the county with the fewest veterans in every state
Click here to read our detailed methodology
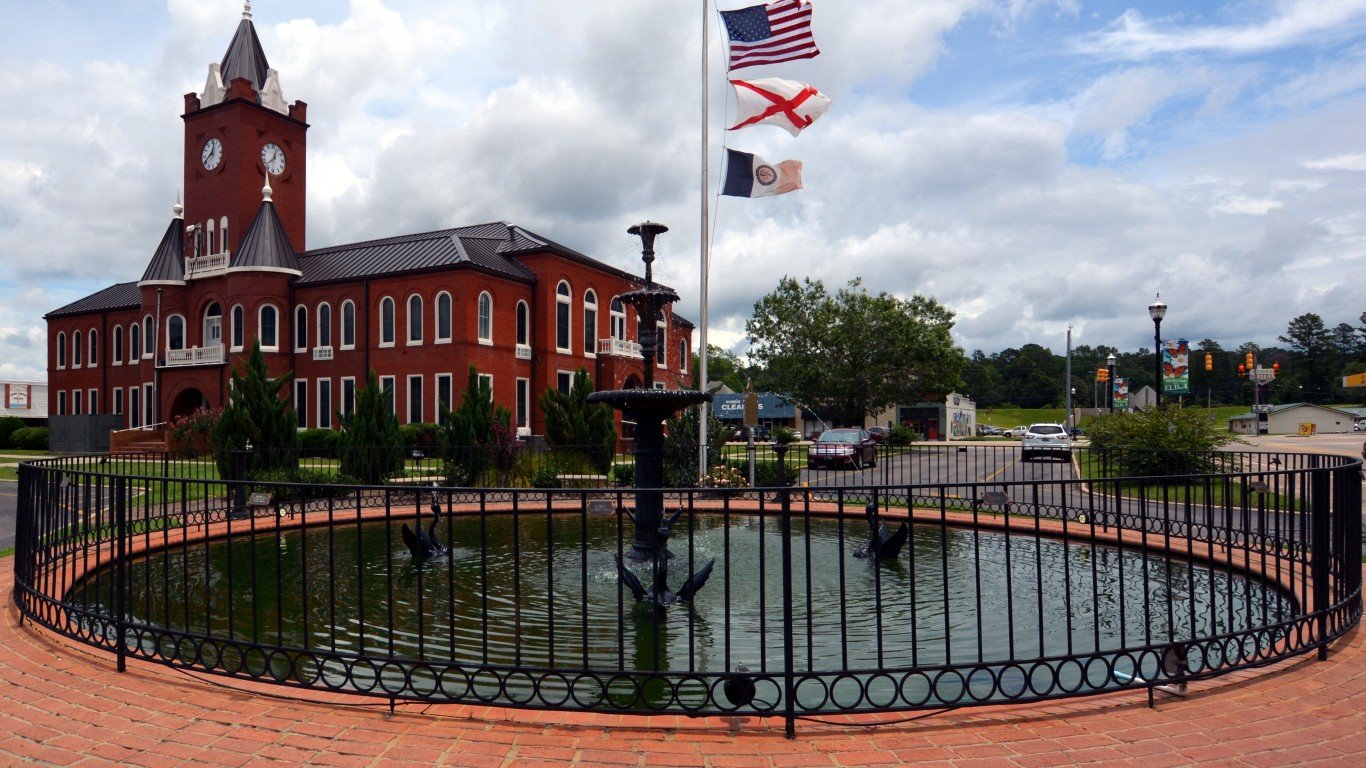
Alabama: Bullock County
> Civilian adults who have served in the military: 3.7% (Alabama: 8.6%)
> Veterans who first enlisted after 9/11: 12.0% (Alabama: 13.7%)
> Veterans who served in the Vietnam Era only: 28.8% (Alabama: 31.6%)
> Veterans who served during the Korean War only: 0.0% reported (Alabama: 5.4%)
> No. of counties considered in ranking: 66
[in-text-ad]
Alaska: Dillingham Census Area
> Civilian adults who have served in the military: 4.3% (Alaska: 12.1%)
> Veterans who first enlisted after 9/11: 19.7% (Alaska: 21.8%)
> Veterans who served in the Vietnam Era only: 47.6% (Alaska: 26.2%)
> Veterans who served during the Korean War only: 2.7% (Alaska: 2.5%)
> No. of counties considered in ranking: 25
[recirclink id=1099737]

Arizona: Santa Cruz County
> Civilian adults who have served in the military: 4.7% (Arizona: 8.9%)
> Veterans who first enlisted after 9/11: 8.0% (Arizona: 13.0%)
> Veterans who served in the Vietnam Era only: 30.6% (Arizona: 34.2%)
> Veterans who served during the Korean War only: 9.4% (Arizona: 6.8%)
> No. of counties considered in ranking: 15

Arkansas: Lee County
> Civilian adults who have served in the military: 4.2% (Arkansas: 8.3%)
> Veterans who first enlisted after 9/11: 9.8% (Arkansas: 13.1%)
> Veterans who served in the Vietnam Era only: 41.8% (Arkansas: 34.0%)
> Veterans who served during the Korean War only: 6.9% (Arkansas: 5.9%)
> No. of counties considered in ranking: 75
[in-text-ad-2]

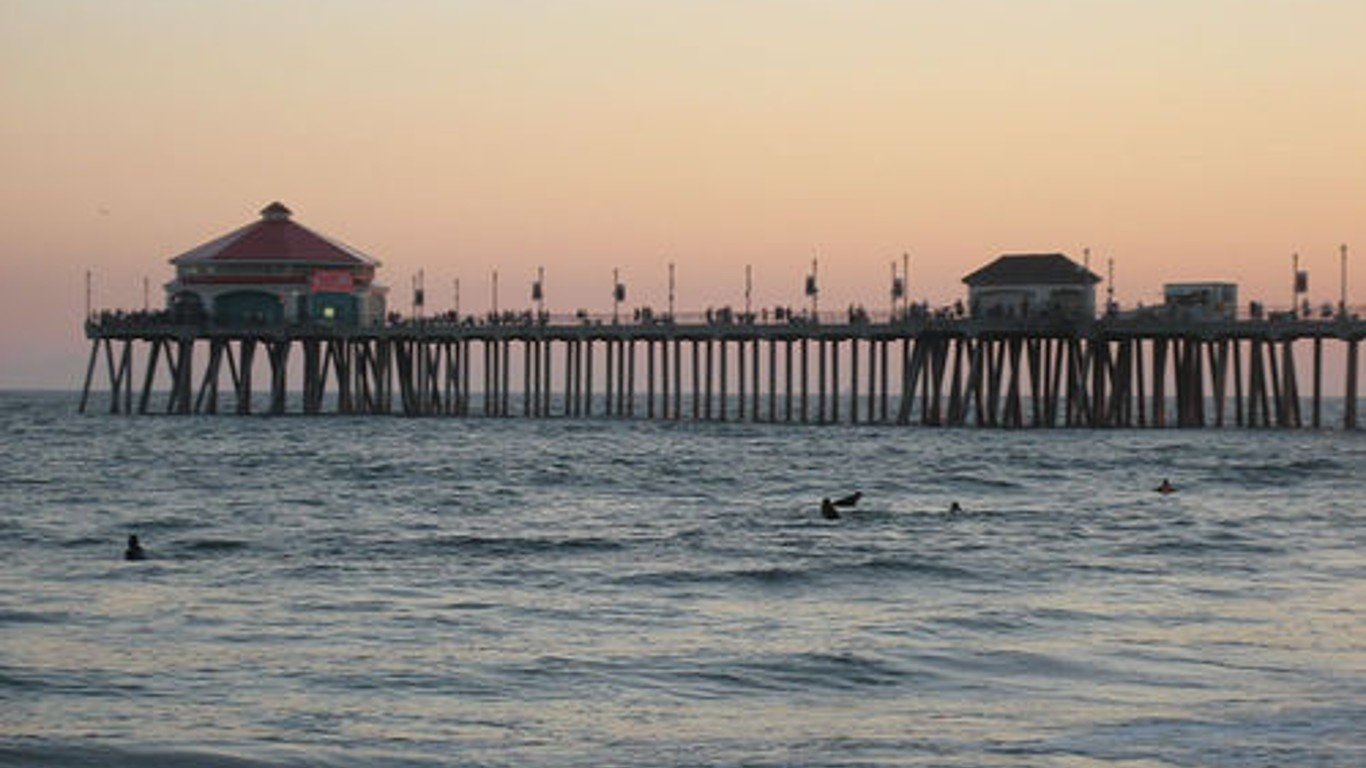
California: San Francisco County
> Civilian adults who have served in the military: 2.9% (California: 5.0%)
> Veterans who first enlisted after 9/11: 15.0% (California: 14.9%)
> Veterans who served in the Vietnam Era only: 32.3% (California: 32.5%)
> Veterans who served during the Korean War only: 9.6% (California: 7.5%)
> No. of counties considered in ranking: 57
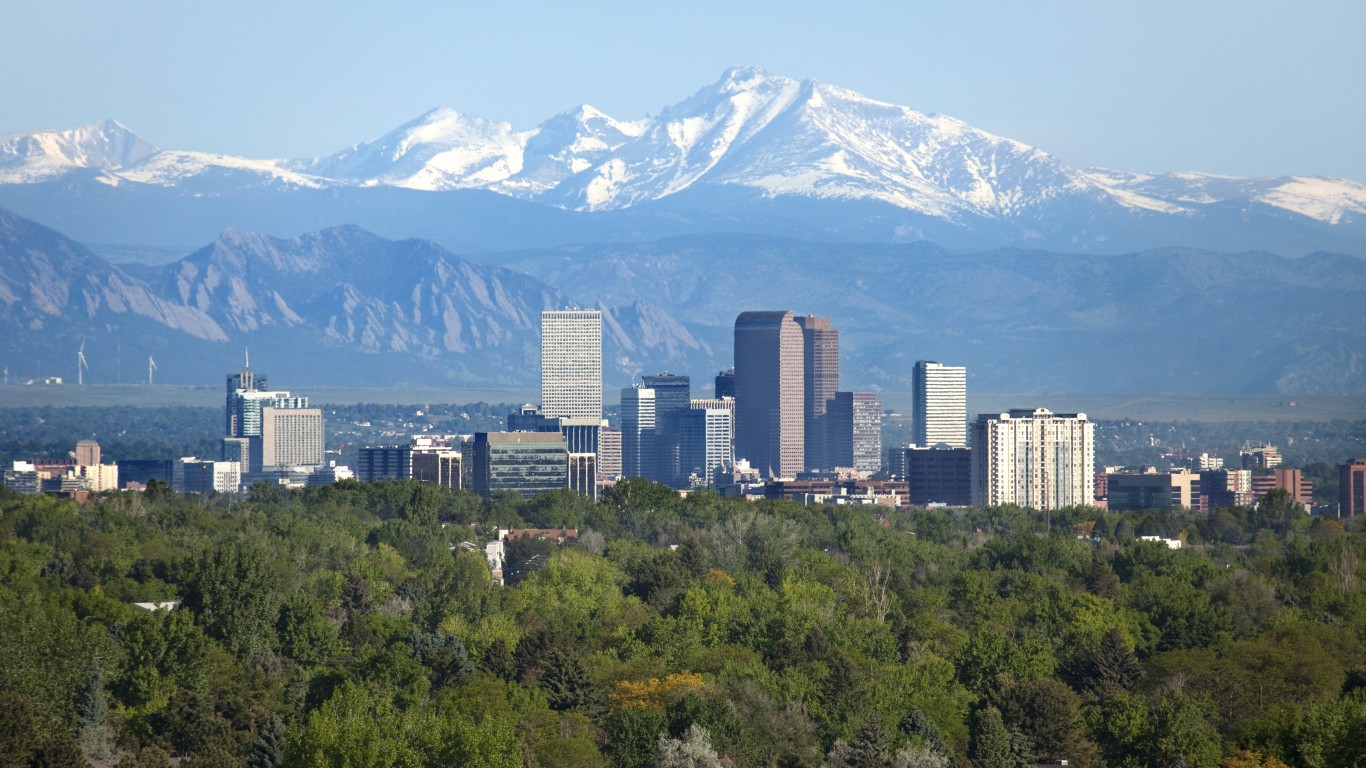
Colorado: Denver County
> Civilian adults who have served in the military: 5.0% (Colorado: 8.4%)
> Veterans who first enlisted after 9/11: 19.9% (Colorado: 16.8%)
> Veterans who served in the Vietnam Era only: 31.6% (Colorado: 30.3%)
> Veterans who served during the Korean War only: 6.2% (Colorado: 5.0%)
> No. of counties considered in ranking: 61
[in-text-ad]

Connecticut: Fairfield County
> Civilian adults who have served in the military: 4.0% (Connecticut: 5.7%)
> Veterans who first enlisted after 9/11: 7.8% (Connecticut: 10.9%)
> Veterans who served in the Vietnam Era only: 36.1% (Connecticut: 34.3%)
> Veterans who served during the Korean War only: 11.0% (Connecticut: 10.3%)
> No. of counties considered in ranking: 8
[recirclink id=1097724]
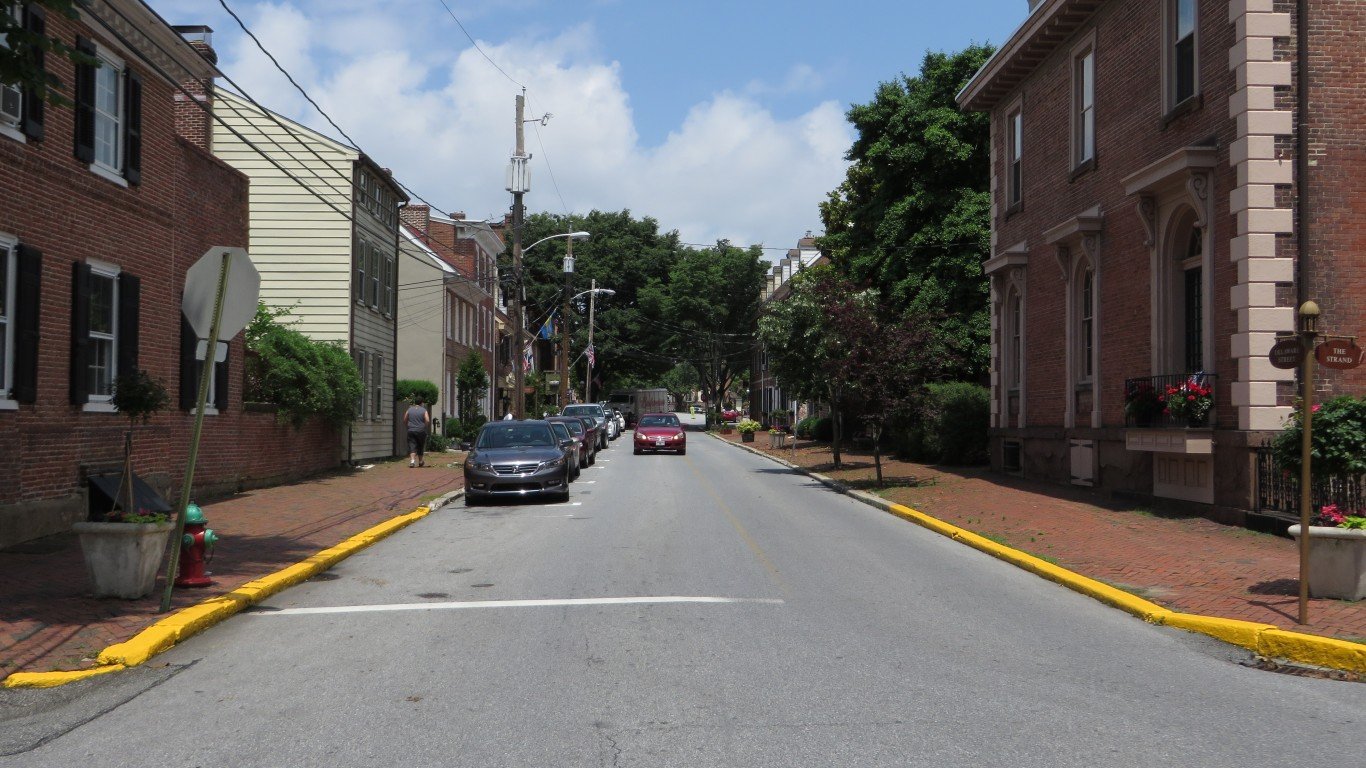
Delaware: New Castle County
> Civilian adults who have served in the military: 6.9% (Delaware: 8.6%)
> Veterans who first enlisted after 9/11: 10.7% (Delaware: 10.3%)
> Veterans who served in the Vietnam Era only: 33.8% (Delaware: 35.9%)
> Veterans who served during the Korean War only: 5.5% (Delaware: 6.1%)
> No. of counties considered in ranking: 3
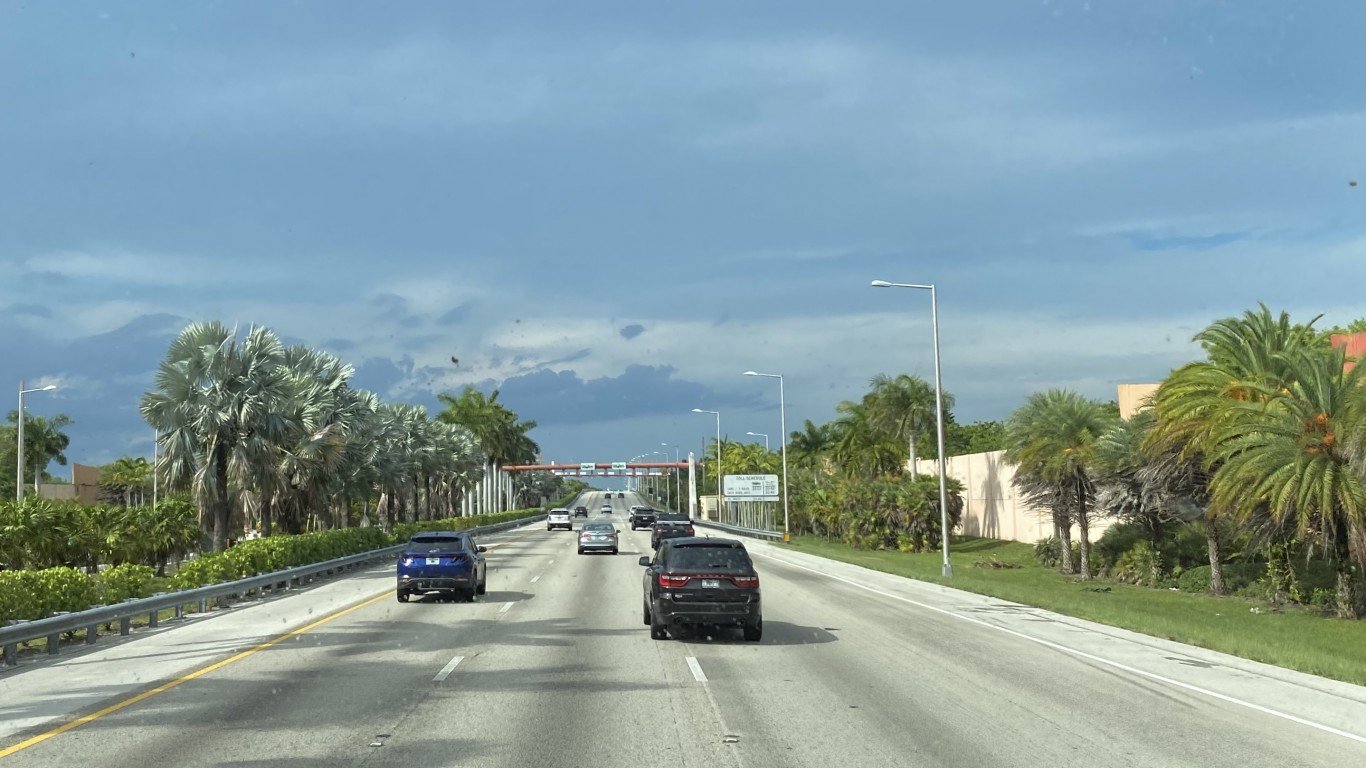
Florida: Miami-Dade County
> Civilian adults who have served in the military: 2.2% (Florida: 8.4%)
> Veterans who first enlisted after 9/11: 20.0% (Florida: 11.2%)
> Veterans who served in the Vietnam Era only: 27.7% (Florida: 32.1%)
> Veterans who served during the Korean War only: 4.7% (Florida: 7.5%)
> No. of counties considered in ranking: 67
[in-text-ad-2]
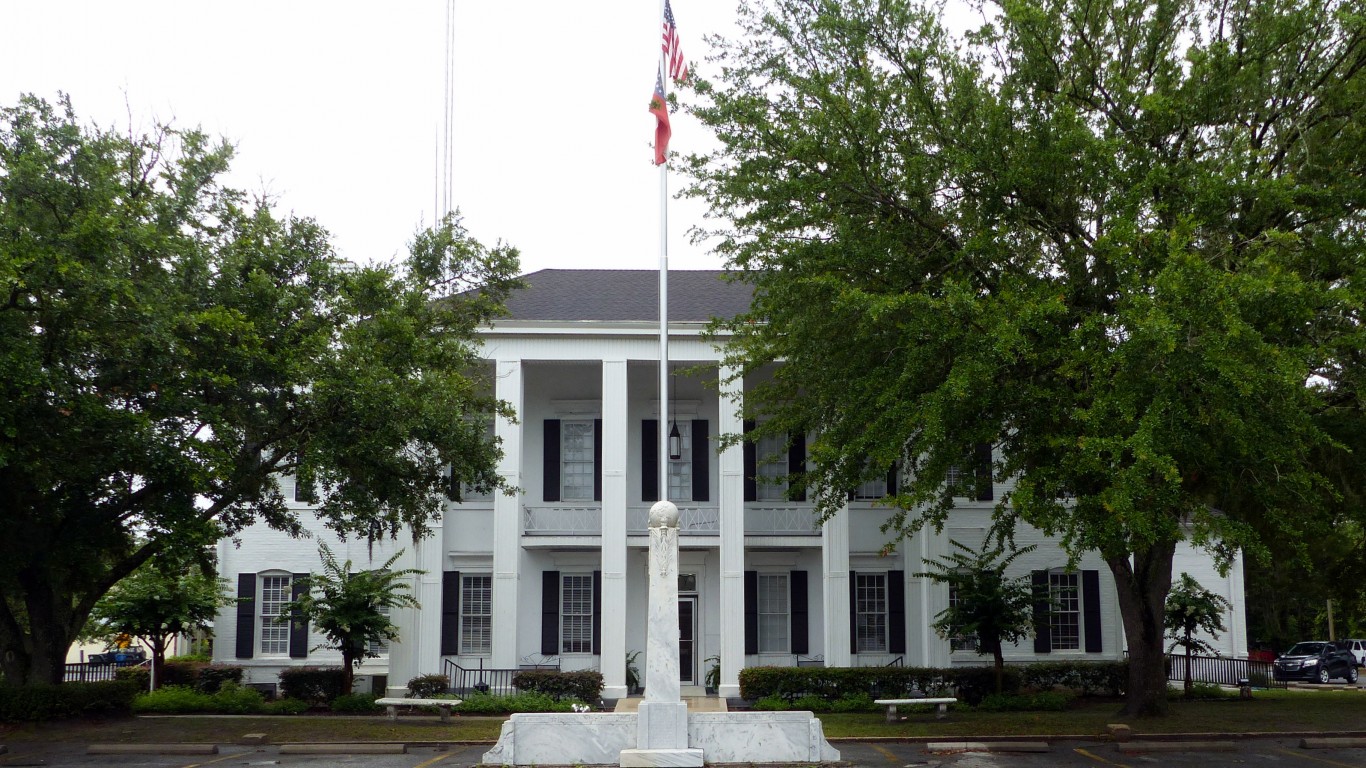
Georgia: Clinch County
> Civilian adults who have served in the military: 4.5% (Georgia: 7.9%)
> Veterans who first enlisted after 9/11: 12.7% (Georgia: 14.9%)
> Veterans who served in the Vietnam Era only: 38.0% (Georgia: 29.1%)
> Veterans who served during the Korean War only: 0.0% reported (Georgia: 4.2%)
> No. of counties considered in ranking: 152

Hawaii: Maui County
> Civilian adults who have served in the military: 6.4% (Hawaii: 9.1%)
> Veterans who first enlisted after 9/11: 9.9% (Hawaii: 19.5%)
> Veterans who served in the Vietnam Era only: 40.7% (Hawaii: 30.7%)
> Veterans who served during the Korean War only: 5.9% (Hawaii: 6.0%)
> No. of counties considered in ranking: 4
[in-text-ad]

Idaho: Madison County
> Civilian adults who have served in the military: 2.6% (Idaho: 8.9%)
> Veterans who first enlisted after 9/11: 17.6% (Idaho: 11.6%)
> Veterans who served in the Vietnam Era only: 47.2% (Idaho: 35.6%)
> Veterans who served during the Korean War only: 5.9% (Idaho: 6.2%)
> No. of counties considered in ranking: 41
[recirclink id=1095742]

Illinois: Cook County
> Civilian adults who have served in the military: 3.8% (Illinois: 5.6%)
> Veterans who first enlisted after 9/11: 11.8% (Illinois: 11.9%)
> Veterans who served in the Vietnam Era only: 34.8% (Illinois: 34.6%)
> Veterans who served during the Korean War only: 8.5% (Illinois: 7.9%)
> No. of counties considered in ranking: 102

Indiana: Tippecanoe County
> Civilian adults who have served in the military: 4.5% (Indiana: 7.3%)
> Veterans who first enlisted after 9/11: 13.2% (Indiana: 12.1%)
> Veterans who served in the Vietnam Era only: 28.6% (Indiana: 33.7%)
> Veterans who served during the Korean War only: 7.9% (Indiana: 6.8%)
> No. of counties considered in ranking: 92
[in-text-ad-2]
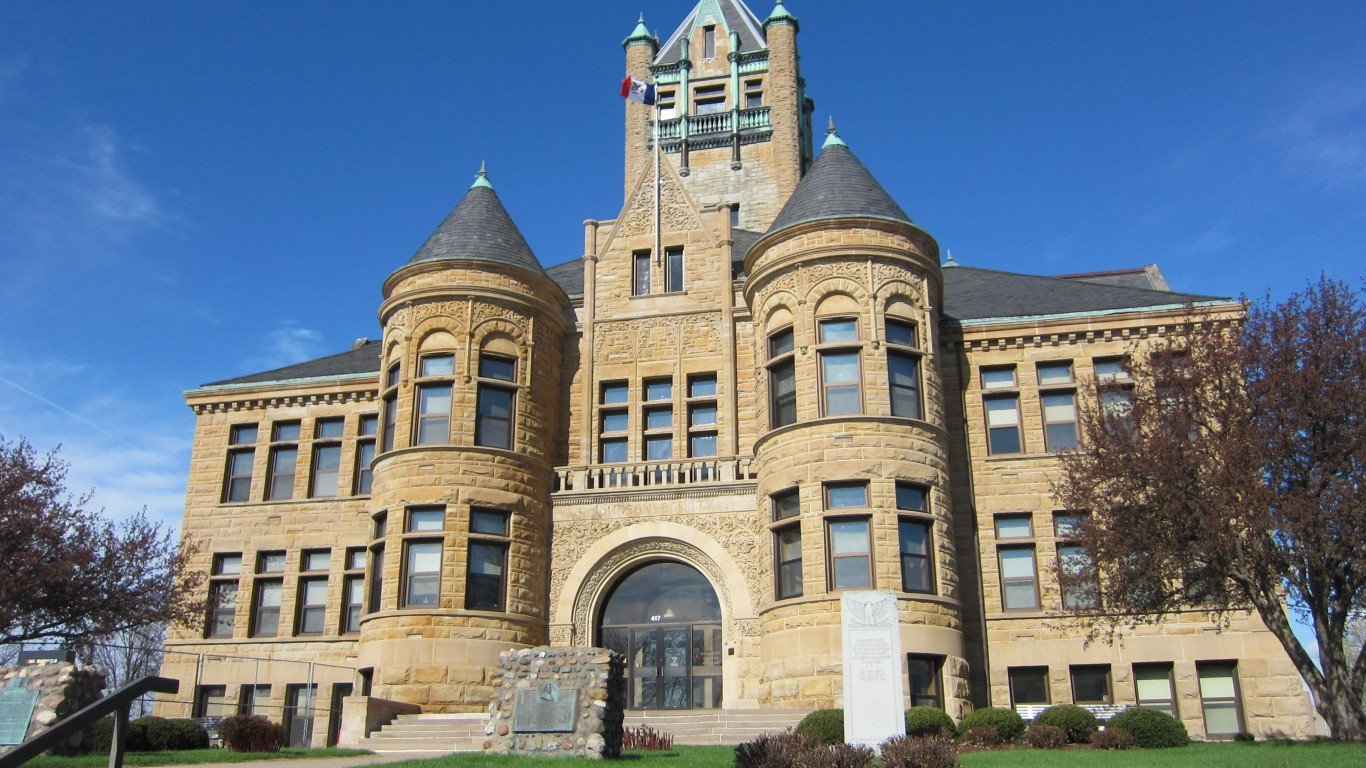
Iowa: Johnson County
> Civilian adults who have served in the military: 4.1% (Iowa: 7.4%)
> Veterans who first enlisted after 9/11: 15.9% (Iowa: 11.2%)
> Veterans who served in the Vietnam Era only: 28.0% (Iowa: 35.1%)
> Veterans who served during the Korean War only: 12.0% (Iowa: 9.0%)
> No. of counties considered in ranking: 99
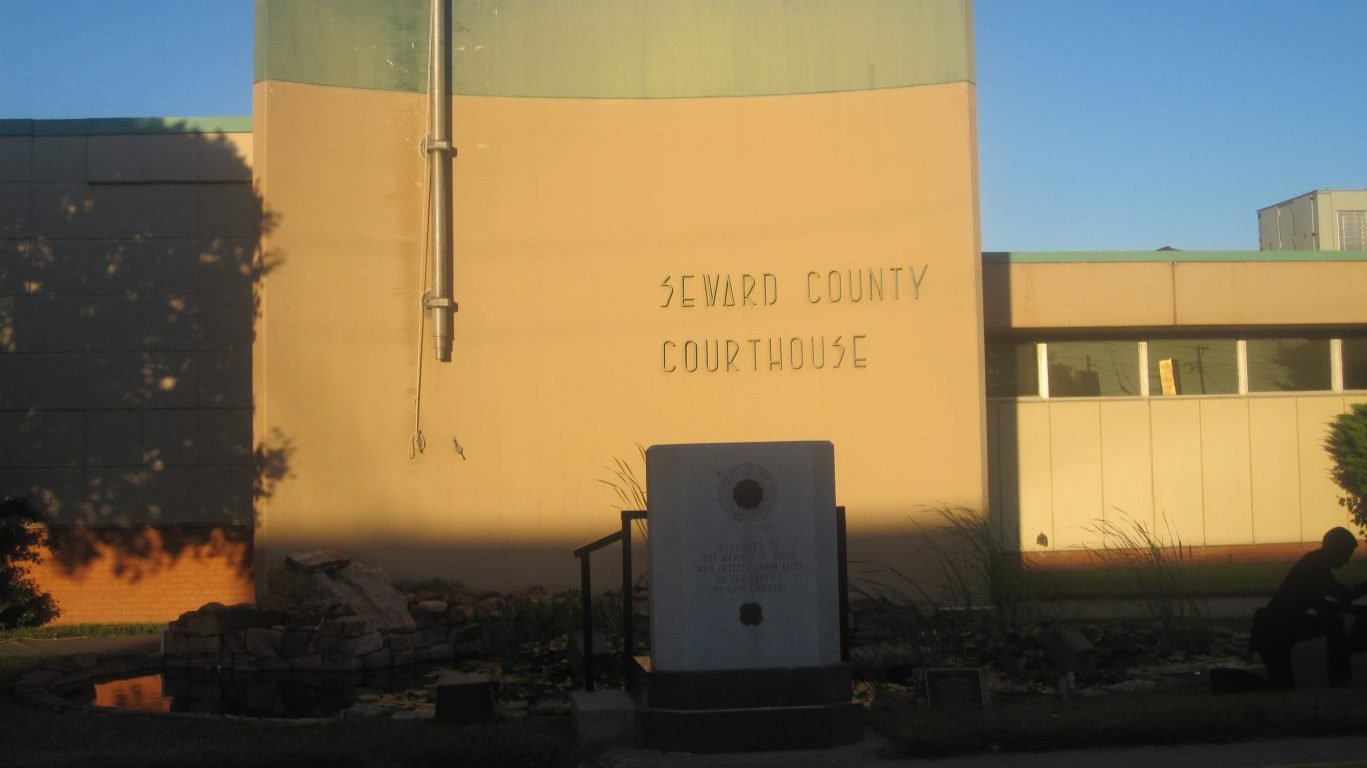
Kansas: Seward County
> Civilian adults who have served in the military: 3.3% (Kansas: 7.9%)
> Veterans who first enlisted after 9/11: 11.5% (Kansas: 14.8%)
> Veterans who served in the Vietnam Era only: 30.6% (Kansas: 32.9%)
> Veterans who served during the Korean War only: 14.8% (Kansas: 7.3%)
> No. of counties considered in ranking: 95
[in-text-ad]
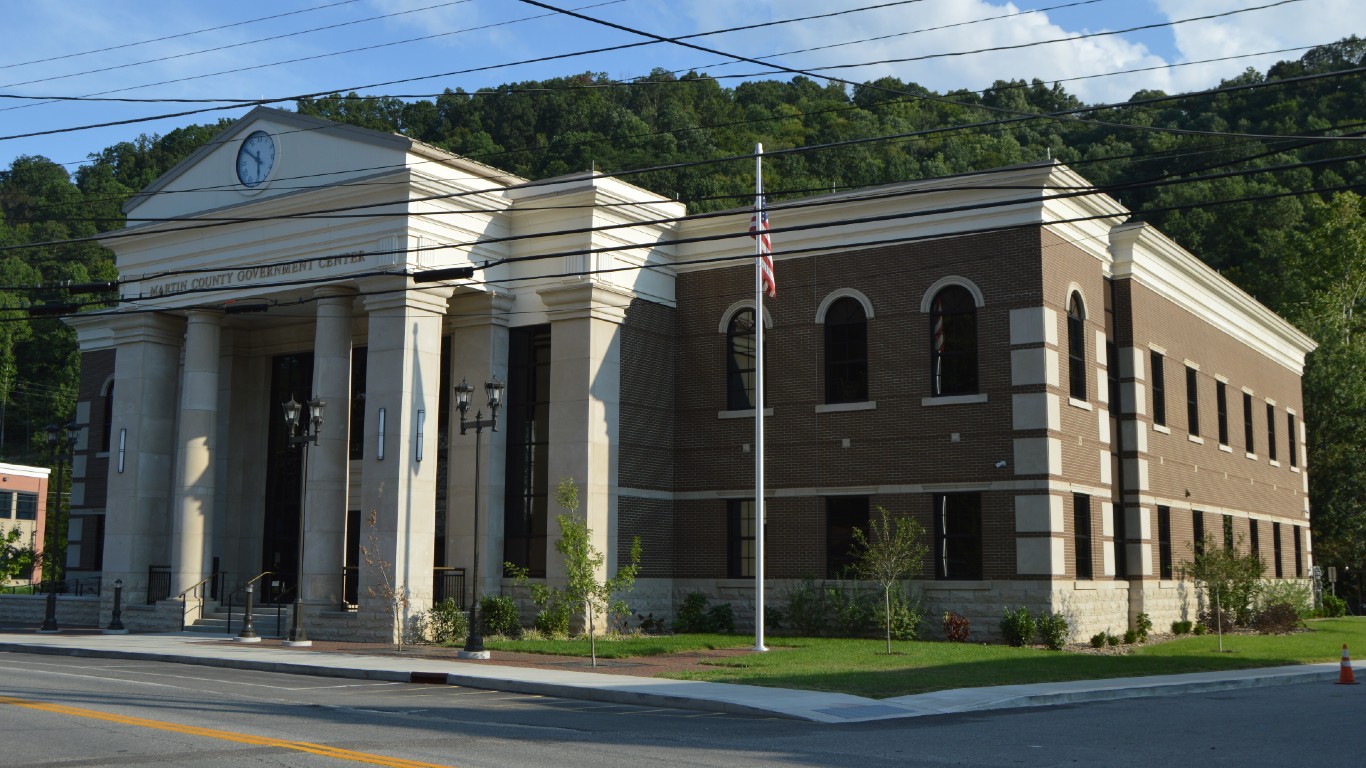
Kentucky: Martin County
> Civilian adults who have served in the military: 3.7% (Kentucky: 7.5%)
> Veterans who first enlisted after 9/11: 16.6% (Kentucky: 12.0%)
> Veterans who served in the Vietnam Era only: 44.8% (Kentucky: 34.4%)
> Veterans who served during the Korean War only: 5.9% (Kentucky: 5.4%)
> No. of counties considered in ranking: 117
[recirclink id=1085653]

Louisiana: East Carroll Parish
> Civilian adults who have served in the military: 3.5% (Louisiana: 6.8%)
> Veterans who first enlisted after 9/11: 10.3% (Louisiana: 14.0%)
> Veterans who served in the Vietnam Era only: 39.7% (Louisiana: 33.3%)
> Veterans who served during the Korean War only: 12.5% (Louisiana: 5.7%)
> No. of counties considered in ranking: 62

Maine: Cumberland County
> Civilian adults who have served in the military: 7.2% (Maine: 9.3%)
> Veterans who first enlisted after 9/11: 9.3% (Maine: 8.5%)
> Veterans who served in the Vietnam Era only: 35.3% (Maine: 35.7%)
> Veterans who served during the Korean War only: 8.2% (Maine: 7.0%)
> No. of counties considered in ranking: 16
[in-text-ad-2]

Maryland: Montgomery County
> Civilian adults who have served in the military: 4.9% (Maryland: 7.7%)
> Veterans who first enlisted after 9/11: 16.3% (Maryland: 14.2%)
> Veterans who served in the Vietnam Era only: 25.6% (Maryland: 27.8%)
> Veterans who served during the Korean War only: 7.4% (Maryland: 5.5%)
> No. of counties considered in ranking: 24

Massachusetts: Suffolk County
> Civilian adults who have served in the military: 2.7% (Massachusetts: 5.3%)
> Veterans who first enlisted after 9/11: 21.4% (Massachusetts: 11.4%)
> Veterans who served in the Vietnam Era only: 29.1% (Massachusetts: 33.5%)
> Veterans who served during the Korean War only: 8.5% (Massachusetts: 10.1%)
> No. of counties considered in ranking: 14
[in-text-ad]
Michigan: Washtenaw County
> Civilian adults who have served in the military: 4.4% (Michigan: 6.8%)
> Veterans who first enlisted after 9/11: 11.5% (Michigan: 9.8%)
> Veterans who served in the Vietnam Era only: 34.4% (Michigan: 36.5%)
> Veterans who served during the Korean War only: 6.7% (Michigan: 7.8%)
> No. of counties considered in ranking: 83
[recirclink id=1090054]
Minnesota: Stevens County
> Civilian adults who have served in the military: 3.9% (Minnesota: 6.8%)
> Veterans who first enlisted after 9/11: 12.0% (Minnesota: 11.4%)
> Veterans who served in the Vietnam Era only: 30.4% (Minnesota: 36.8%)
> Veterans who served during the Korean War only: 13.7% (Minnesota: 9.2%)
> No. of counties considered in ranking: 87

Mississippi: Leflore County
> Civilian adults who have served in the military: 2.6% (Mississippi: 7.3%)
> Veterans who first enlisted after 9/11: 0.0% reported (Mississippi: 14.6%)
> Veterans who served in the Vietnam Era only: 42.3% (Mississippi: 30.4%)
> Veterans who served during the Korean War only: 6.0% (Mississippi: 5.1%)
> No. of counties considered in ranking: 79
[in-text-ad-2]
Missouri: Adair County
> Civilian adults who have served in the military: 4.8% (Missouri: 8.3%)
> Veterans who first enlisted after 9/11: 11.3% (Missouri: 12.0%)
> Veterans who served in the Vietnam Era only: 37.2% (Missouri: 35.2%)
> Veterans who served during the Korean War only: 10.3% (Missouri: 6.9%)
> No. of counties considered in ranking: 115
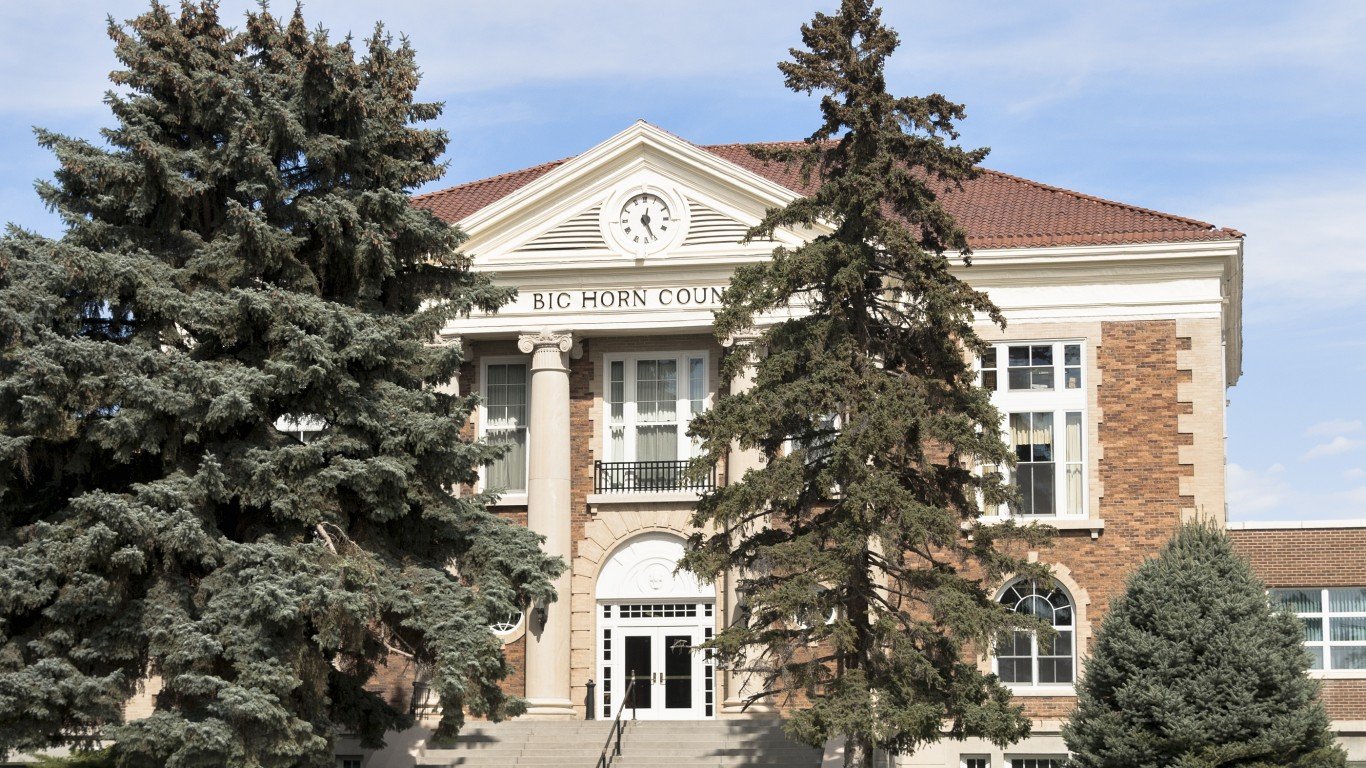
Montana: Big Horn County
> Civilian adults who have served in the military: 6.4% (Montana: 10.3%)
> Veterans who first enlisted after 9/11: 6.4% (Montana: 14.6%)
> Veterans who served in the Vietnam Era only: 39.3% (Montana: 35.4%)
> Veterans who served during the Korean War only: 16.0% (Montana: 5.8%)
> No. of counties considered in ranking: 49
[in-text-ad]
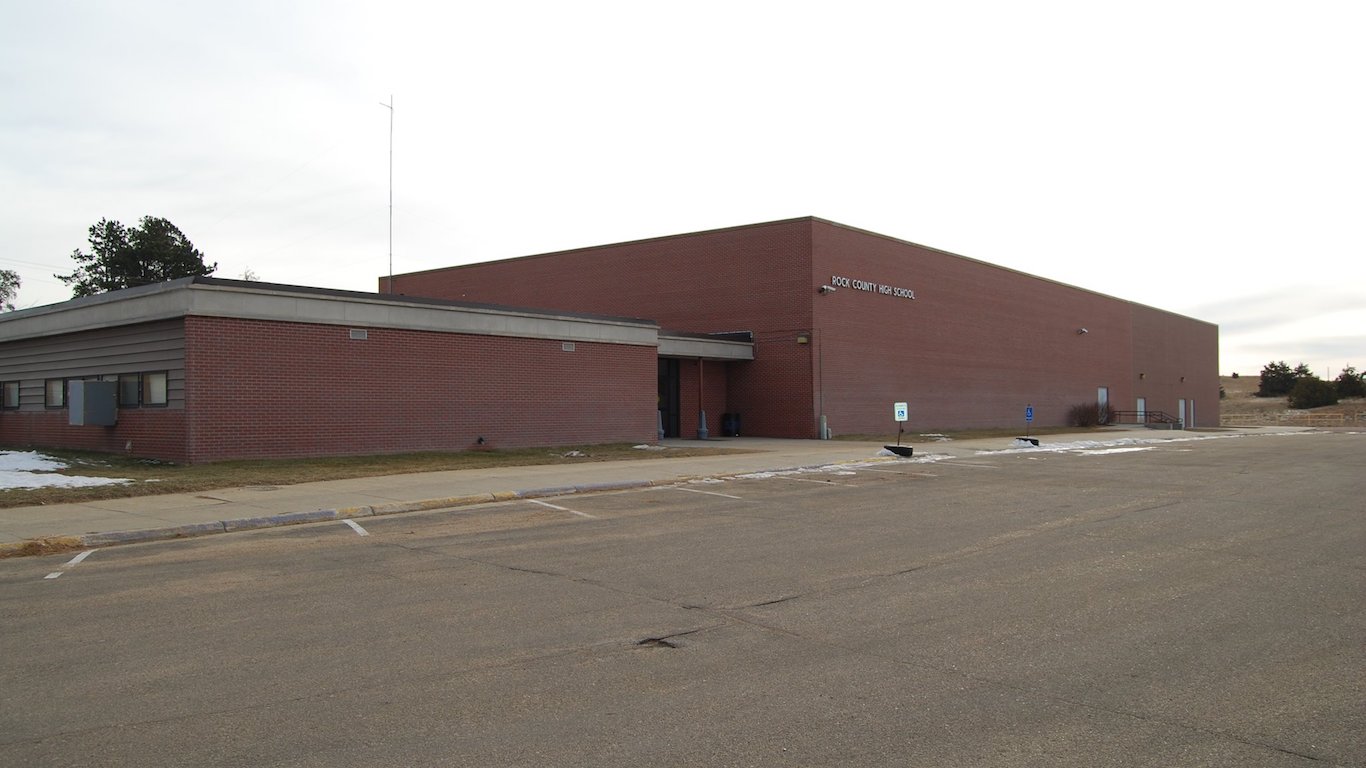
Nebraska: Rock County
> Civilian adults who have served in the military: 5.6% (Nebraska: 7.9%)
> Veterans who first enlisted after 9/11: 0.0% reported (Nebraska: 13.1%)
> Veterans who served in the Vietnam Era only: 49.2% (Nebraska: 32.4%)
> Veterans who served during the Korean War only: 15.9% (Nebraska: 7.9%)
> No. of counties considered in ranking: 80
[recirclink id=1099737]
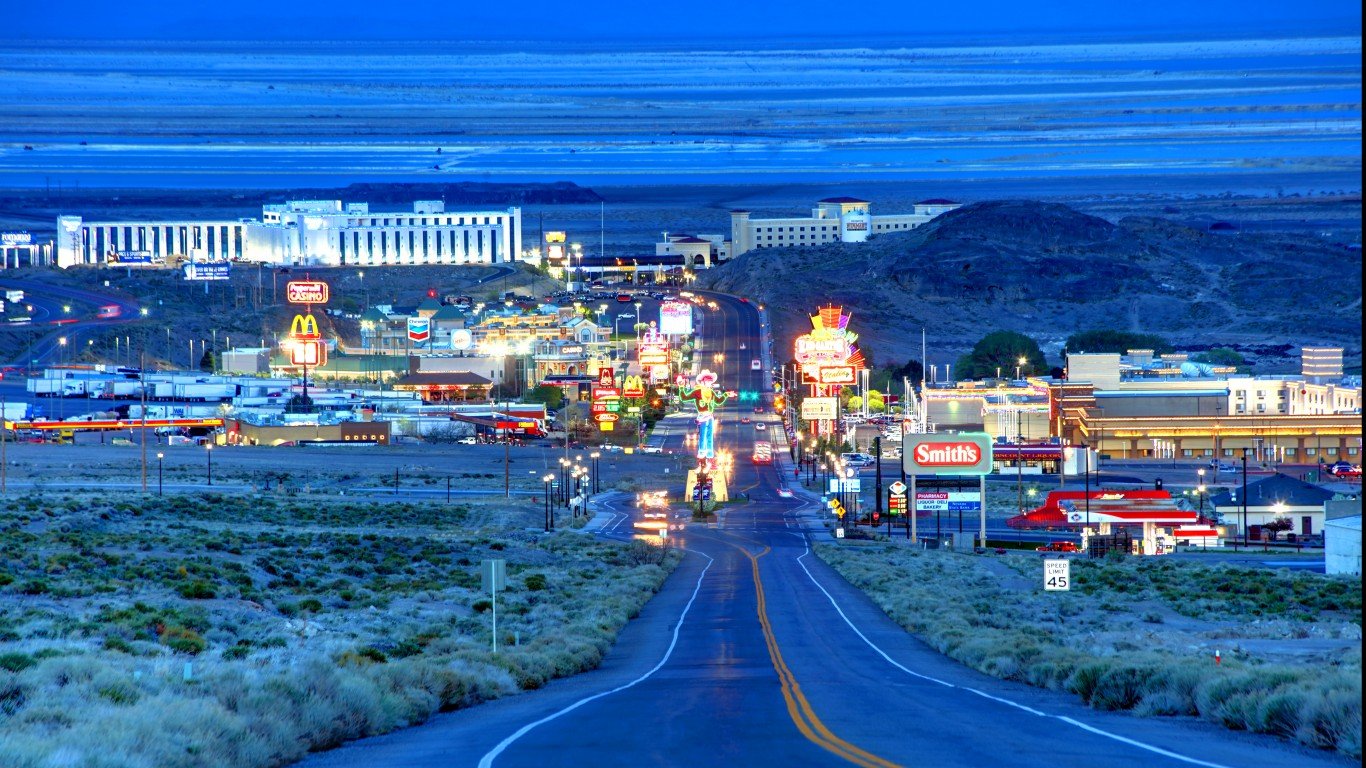
Nevada: Elko County
> Civilian adults who have served in the military: 8.1% (Nevada: 8.8%)
> Veterans who first enlisted after 9/11: 23.3% (Nevada: 13.5%)
> Veterans who served in the Vietnam Era only: 28.3% (Nevada: 32.6%)
> Veterans who served during the Korean War only: 3.2% (Nevada: 5.3%)
> No. of counties considered in ranking: 15
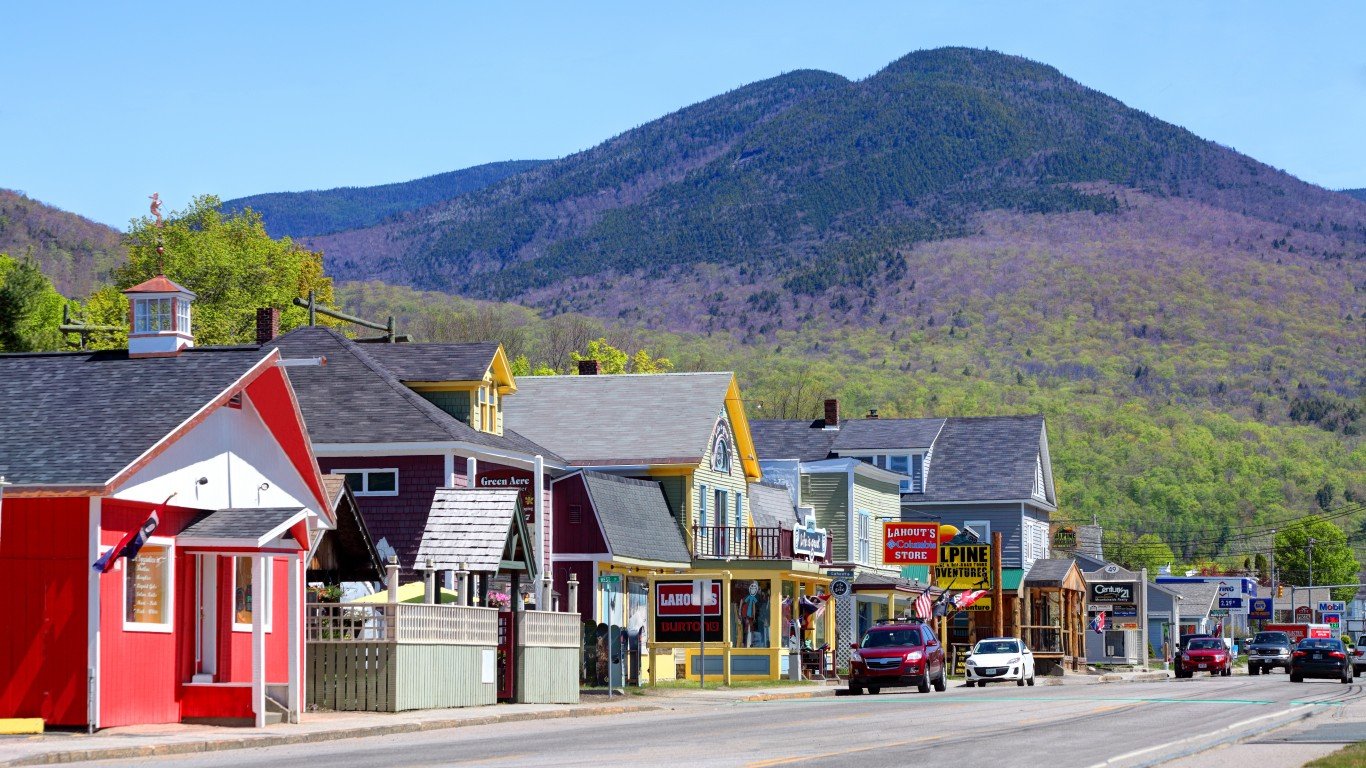
New Hampshire: Grafton County
> Civilian adults who have served in the military: 7.7% (New Hampshire: 8.5%)
> Veterans who first enlisted after 9/11: 8.1% (New Hampshire: 9.9%)
> Veterans who served in the Vietnam Era only: 39.7% (New Hampshire: 34.4%)
> Veterans who served during the Korean War only: 6.7% (New Hampshire: 7.0%)
> No. of counties considered in ranking: 10
[in-text-ad-2]

New Jersey: Hudson County
> Civilian adults who have served in the military: 2.0% (New Jersey: 4.5%)
> Veterans who first enlisted after 9/11: 18.5% (New Jersey: 10.8%)
> Veterans who served in the Vietnam Era only: 30.2% (New Jersey: 35.3%)
> Veterans who served during the Korean War only: 9.5% (New Jersey: 10.5%)
> No. of counties considered in ranking: 21
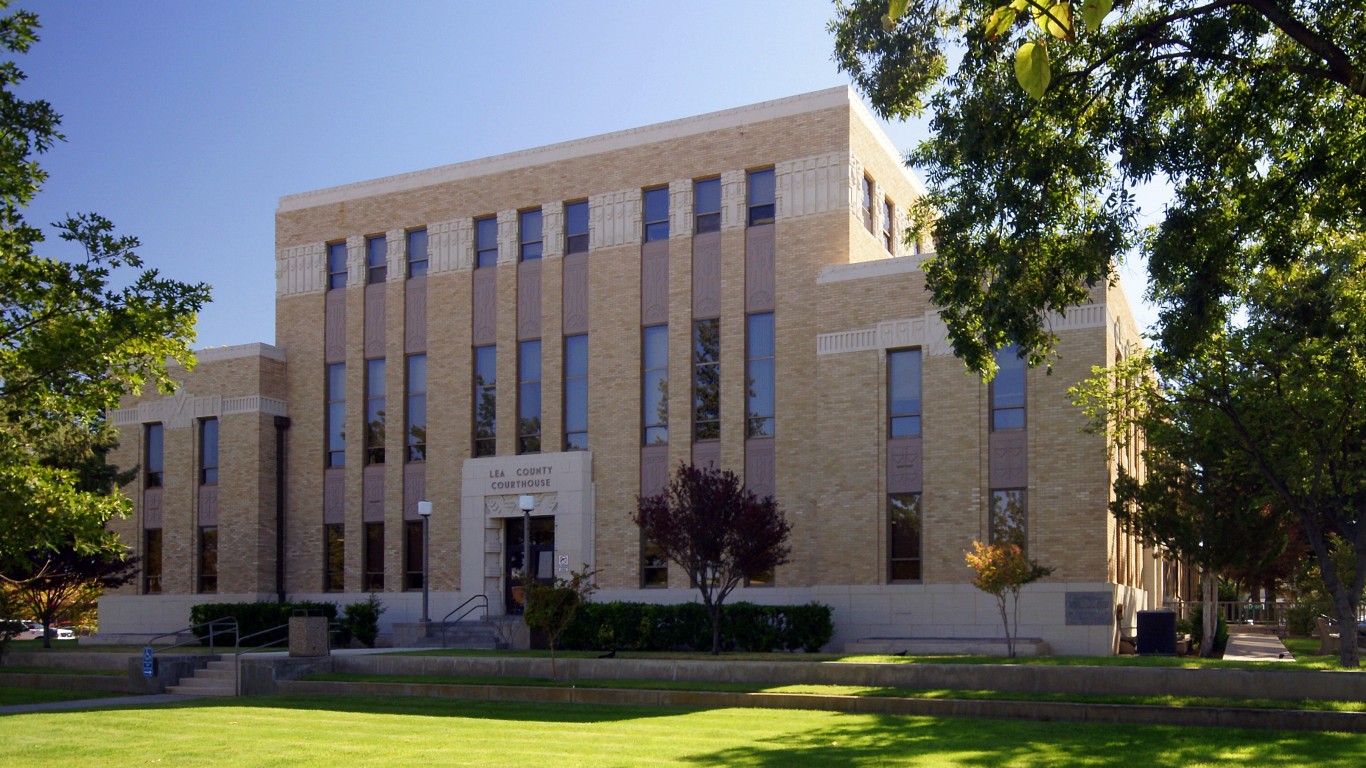
New Mexico: Lea County
> Civilian adults who have served in the military: 3.8% (New Mexico: 8.8%)
> Veterans who first enlisted after 9/11: 14.5% (New Mexico: 13.0%)
> Veterans who served in the Vietnam Era only: 37.5% (New Mexico: 34.2%)
> Veterans who served during the Korean War only: 6.1% (New Mexico: 6.2%)
> No. of counties considered in ranking: 30
[in-text-ad]
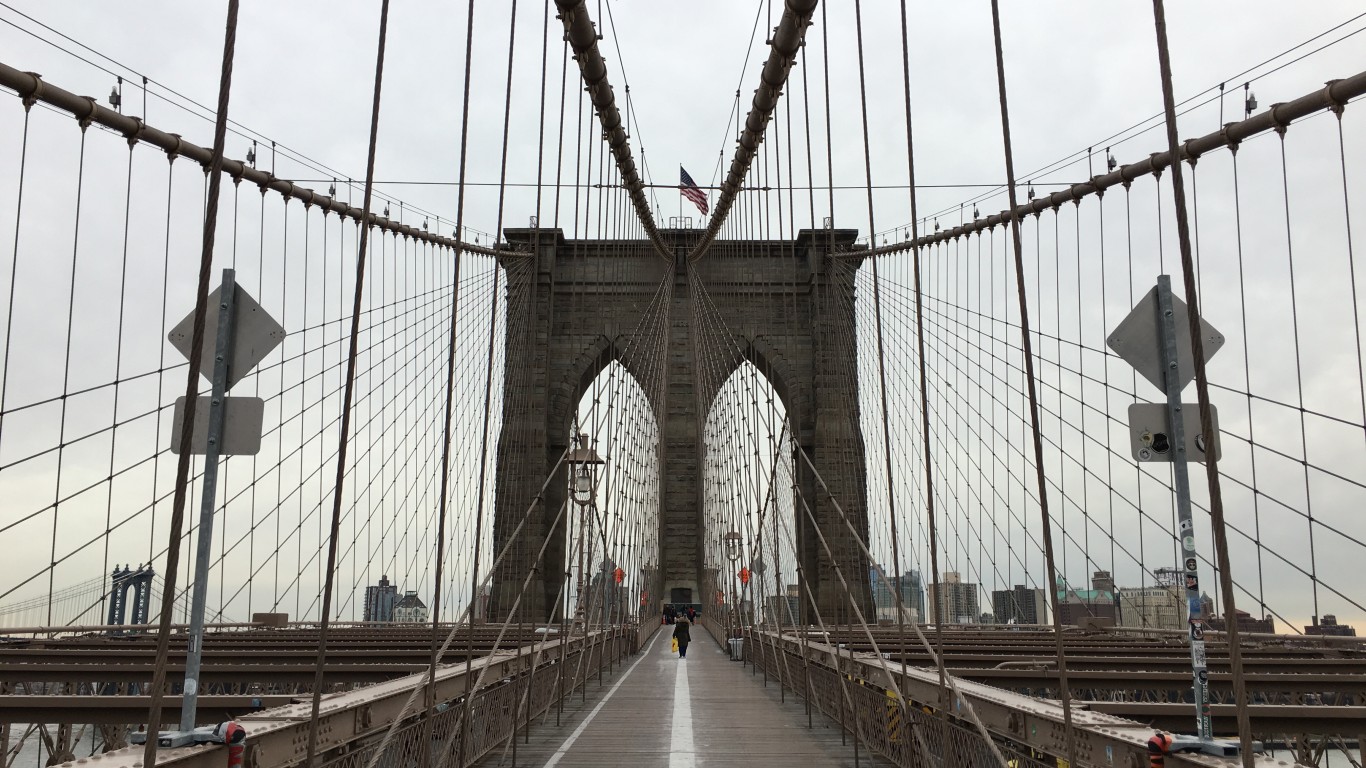
New York: Kings County
> Civilian adults who have served in the military: 1.8% (New York: 4.4%)
> Veterans who first enlisted after 9/11: 15.7% (New York: 11.6%)
> Veterans who served in the Vietnam Era only: 31.3% (New York: 33.5%)
> Veterans who served during the Korean War only: 7.8% (New York: 9.7%)
> No. of counties considered in ranking: 62
[recirclink id=1097724]
North Carolina: Orange County
> Civilian adults who have served in the military: 4.7% (North Carolina: 8.2%)
> Veterans who first enlisted after 9/11: 13.3% (North Carolina: 14.9%)
> Veterans who served in the Vietnam Era only: 30.3% (North Carolina: 30.7%)
> Veterans who served during the Korean War only: 4.1% (North Carolina: 5.2%)
> No. of counties considered in ranking: 99
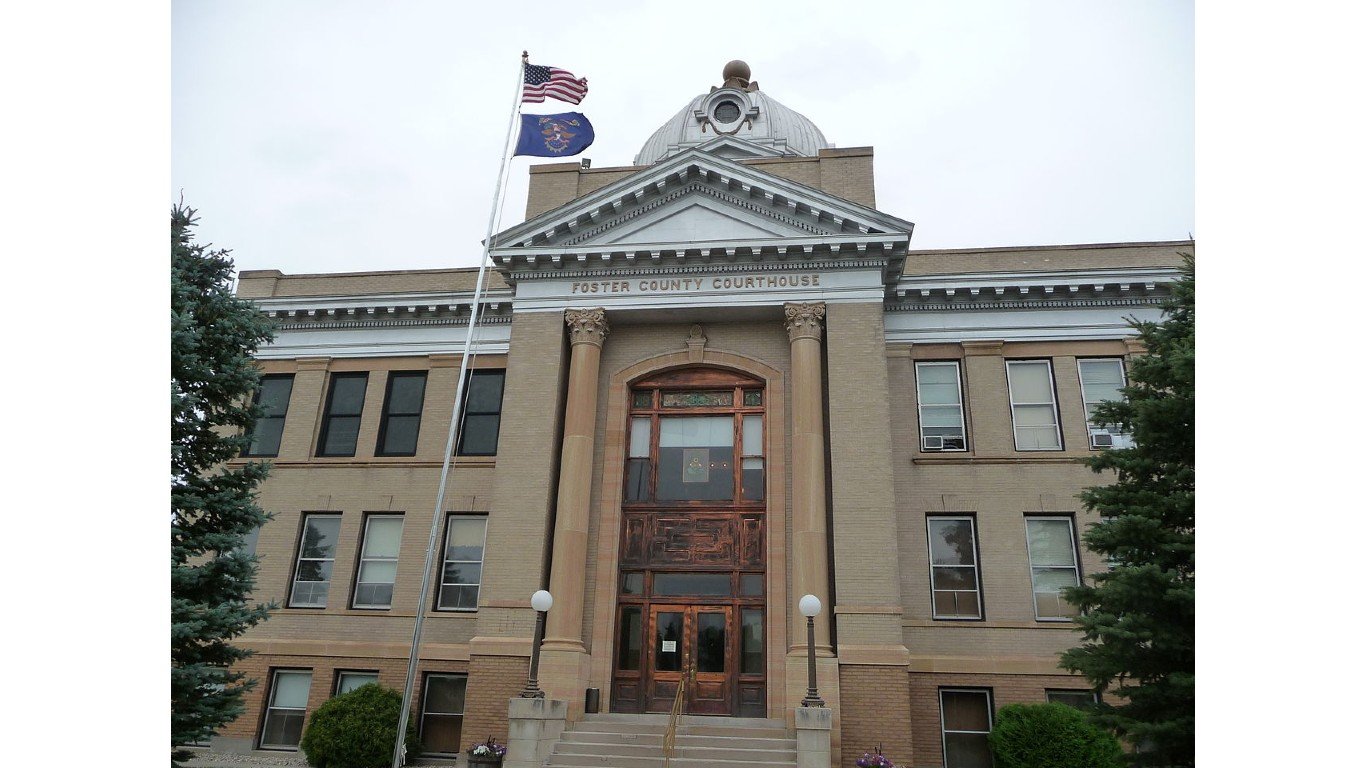
North Dakota: Foster County
> Civilian adults who have served in the military: 5.5% (North Dakota: 8.0%)
> Veterans who first enlisted after 9/11: 5.1% (North Dakota: 18.2%)
> Veterans who served in the Vietnam Era only: 28.3% (North Dakota: 31.1%)
> Veterans who served during the Korean War only: 20.3% (North Dakota: 6.2%)
> No. of counties considered in ranking: 51
[in-text-ad-2]
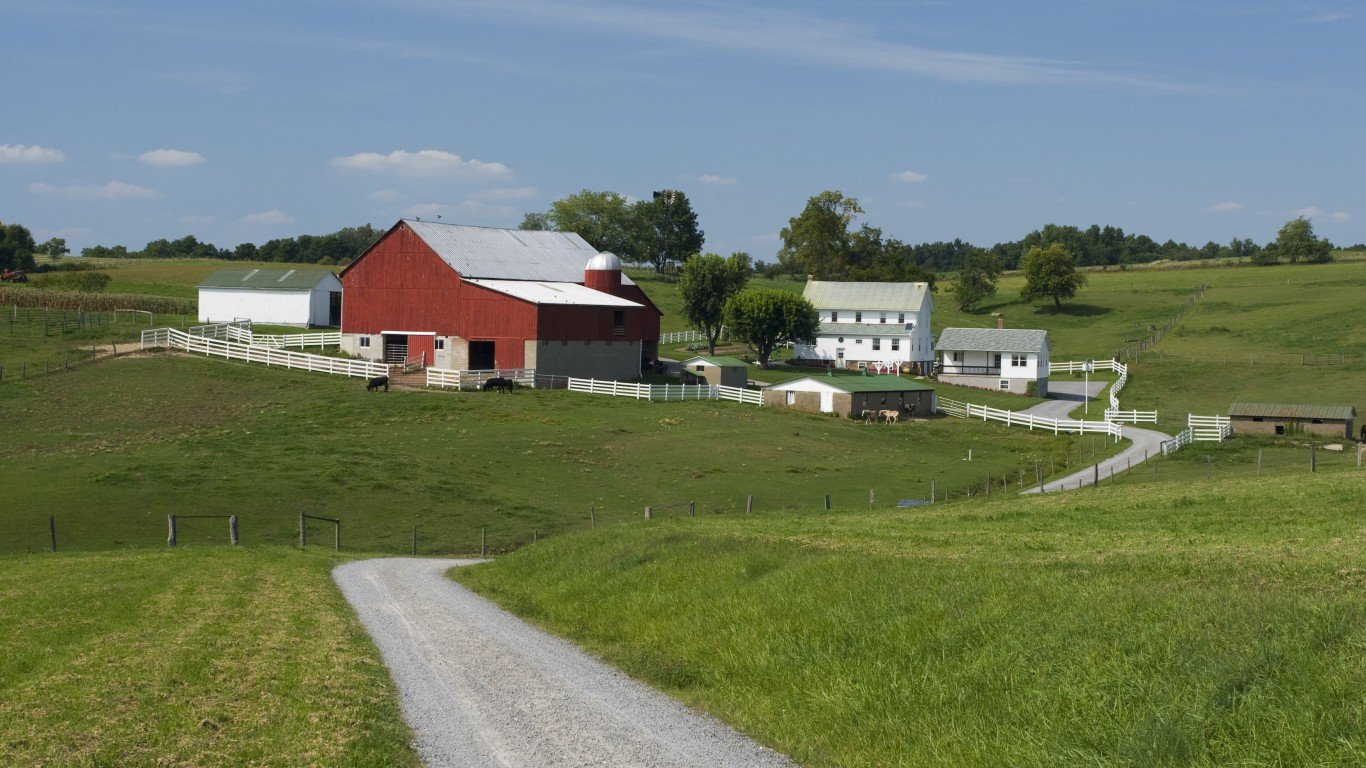
Ohio: Holmes County
> Civilian adults who have served in the military: 4.2% (Ohio: 7.6%)
> Veterans who first enlisted after 9/11: 4.0% (Ohio: 11.1%)
> Veterans who served in the Vietnam Era only: 43.8% (Ohio: 34.5%)
> Veterans who served during the Korean War only: 12.7% (Ohio: 6.9%)
> No. of counties considered in ranking: 88
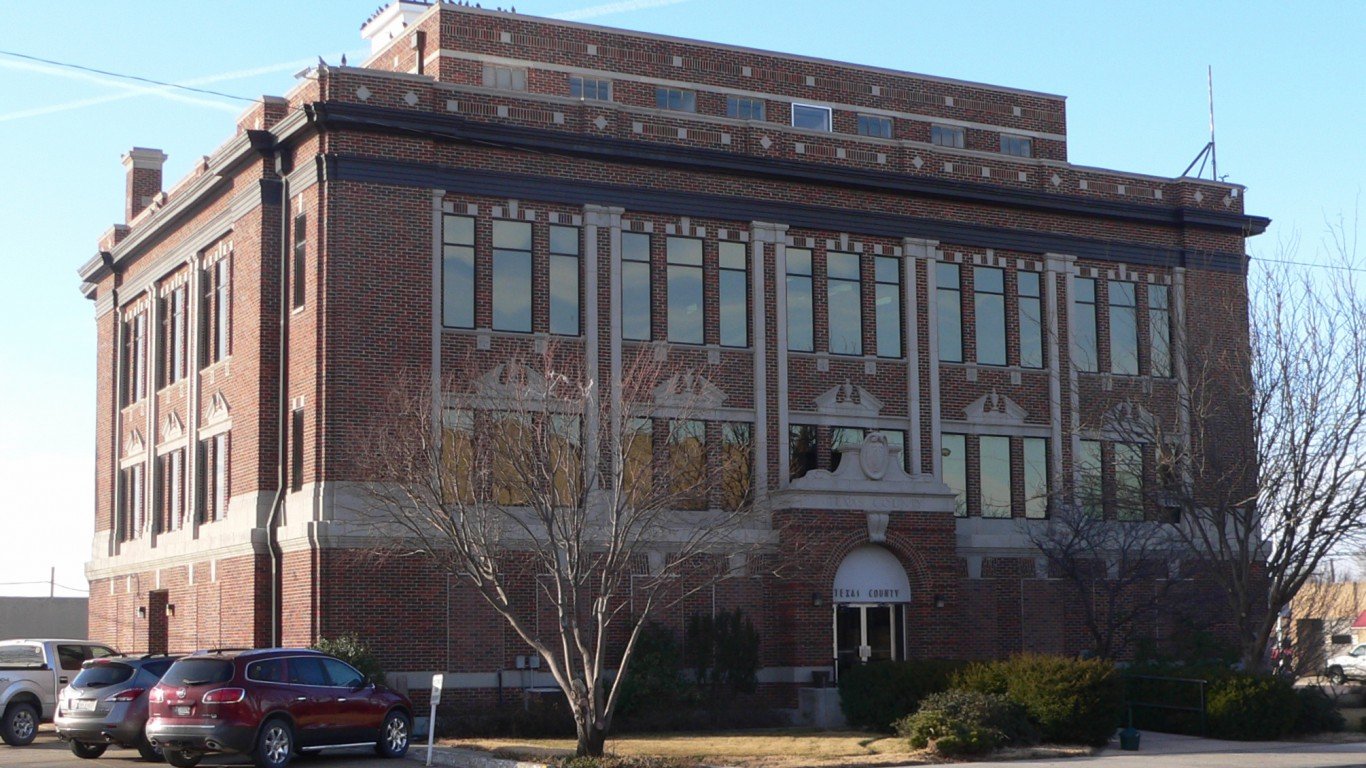
Oklahoma: Texas County
> Civilian adults who have served in the military: 2.5% (Oklahoma: 9.0%)
> Veterans who first enlisted after 9/11: 5.4% (Oklahoma: 14.9%)
> Veterans who served in the Vietnam Era only: 40.3% (Oklahoma: 33.7%)
> Veterans who served during the Korean War only: 23.7% (Oklahoma: 5.6%)
> No. of counties considered in ranking: 76
[in-text-ad]

Oregon: Multnomah County
> Civilian adults who have served in the military: 5.5% (Oregon: 8.3%)
> Veterans who first enlisted after 9/11: 14.0% (Oregon: 11.8%)
> Veterans who served in the Vietnam Era only: 35.0% (Oregon: 36.3%)
> Veterans who served during the Korean War only: 5.8% (Oregon: 7.1%)
> No. of counties considered in ranking: 36
[recirclink id=1095742]

Pennsylvania: Philadelphia County
> Civilian adults who have served in the military: 4.5% (Pennsylvania: 7.2%)
> Veterans who first enlisted after 9/11: 13.1% (Pennsylvania: 10.3%)
> Veterans who served in the Vietnam Era only: 34.4% (Pennsylvania: 35.0%)
> Veterans who served during the Korean War only: 7.4% (Pennsylvania: 8.6%)
> No. of counties considered in ranking: 67

Rhode Island: Providence County
> Civilian adults who have served in the military: 4.9% (Rhode Island: 6.1%)
> Veterans who first enlisted after 9/11: 12.9% (Rhode Island: 11.7%)
> Veterans who served in the Vietnam Era only: 32.9% (Rhode Island: 35.5%)
> Veterans who served during the Korean War only: 10.7% (Rhode Island: 9.0%)
> No. of counties considered in ranking: 5
[in-text-ad-2]

South Carolina: Marion County
> Civilian adults who have served in the military: 4.9% (South Carolina: 9.1%)
> Veterans who first enlisted after 9/11: 5.3% (South Carolina: 13.3%)
> Veterans who served in the Vietnam Era only: 49.8% (South Carolina: 32.7%)
> Veterans who served during the Korean War only: 5.1% (South Carolina: 4.7%)
> No. of counties considered in ranking: 46

South Dakota: Todd County
> Civilian adults who have served in the military: 4.6% (South Dakota: 8.5%)
> Veterans who first enlisted after 9/11: 0.0% reported (South Dakota: 13.4%)
> Veterans who served in the Vietnam Era only: 37.1% (South Dakota: 34.1%)
> Veterans who served during the Korean War only: 7.6% (South Dakota: 7.8%)
> No. of counties considered in ranking: 61
[in-text-ad]

Tennessee: Davidson County
> Civilian adults who have served in the military: 5.4% (Tennessee: 8.2%)
> Veterans who first enlisted after 9/11: 15.3% (Tennessee: 13.6%)
> Veterans who served in the Vietnam Era only: 33.0% (Tennessee: 33.2%)
> Veterans who served during the Korean War only: 5.1% (Tennessee: 5.5%)
> No. of counties considered in ranking: 95
[recirclink id=1085653]
Texas: Maverick County
> Civilian adults who have served in the military: 1.3% (Texas: 6.8%)
> Veterans who first enlisted after 9/11: 23.6% (Texas: 18.1%)
> Veterans who served in the Vietnam Era only: 29.0% (Texas: 29.1%)
> Veterans who served during the Korean War only: 2.1% (Texas: 4.7%)
> No. of counties considered in ranking: 222

Utah: Utah County
> Civilian adults who have served in the military: 3.6% (Utah: 5.4%)
> Veterans who first enlisted after 9/11: 19.3% (Utah: 16.4%)
> Veterans who served in the Vietnam Era only: 27.6% (Utah: 31.5%)
> Veterans who served during the Korean War only: 7.3% (Utah: 6.8%)
> No. of counties considered in ranking: 26
[in-text-ad-2]
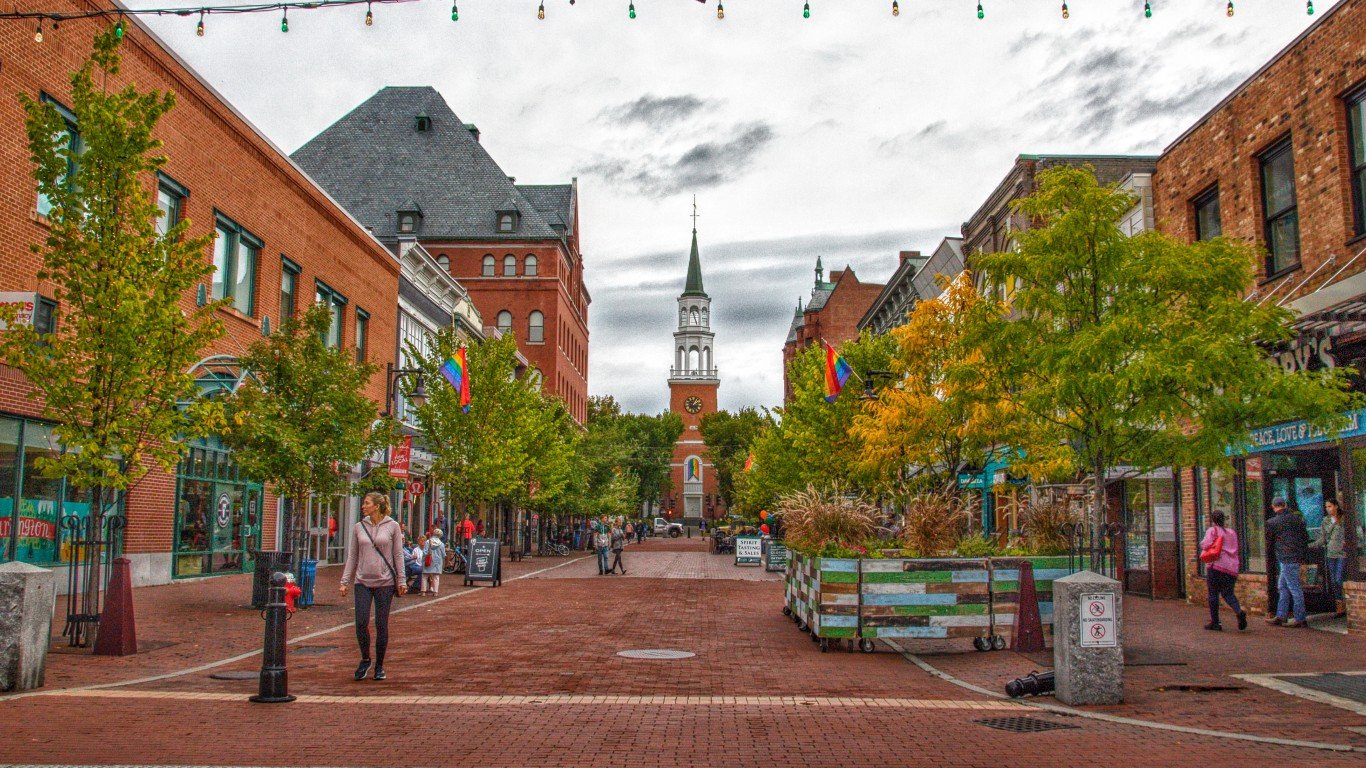
Vermont: Chittenden County
> Civilian adults who have served in the military: 5.5% (Vermont: 6.9%)
> Veterans who first enlisted after 9/11: 15.5% (Vermont: 9.5%)
> Veterans who served in the Vietnam Era only: 30.5% (Vermont: 36.8%)
> Veterans who served during the Korean War only: 9.4% (Vermont: 7.7%)
> No. of counties considered in ranking: 14

Virginia: Harrisonburg city
> Civilian adults who have served in the military: 2.8% (Virginia: 10.3%)
> Veterans who first enlisted after 9/11: 27.0% (Virginia: 17.0%)
> Veterans who served in the Vietnam Era only: 23.6% (Virginia: 24.4%)
> Veterans who served during the Korean War only: 3.6% (Virginia: 4.0%)
> No. of counties considered in ranking: 131
[in-text-ad]
Washington: Adams County
> Civilian adults who have served in the military: 4.5% (Washington: 8.9%)
> Veterans who first enlisted after 9/11: 13.7% (Washington: 14.8%)
> Veterans who served in the Vietnam Era only: 29.0% (Washington: 32.1%)
> Veterans who served during the Korean War only: 5.5% (Washington: 5.0%)
> No. of counties considered in ranking: 39
[recirclink id=1090054]
West Virginia: Monongalia County
> Civilian adults who have served in the military: 5.7% (West Virginia: 8.7%)
> Veterans who first enlisted after 9/11: 14.8% (West Virginia: 10.3%)
> Veterans who served in the Vietnam Era only: 36.5% (West Virginia: 37.3%)
> Veterans who served during the Korean War only: 5.5% (West Virginia: 6.8%)
> No. of counties considered in ranking: 55

Wisconsin: Milwaukee County
> Civilian adults who have served in the military: 5.1% (Wisconsin: 7.0%)
> Veterans who first enlisted after 9/11: 14.0% (Wisconsin: 11.1%)
> Veterans who served in the Vietnam Era only: 32.3% (Wisconsin: 35.3%)
> Veterans who served during the Korean War only: 9.0% (Wisconsin: 8.2%)
> No. of counties considered in ranking: 72
[in-text-ad-2]

Wyoming: Teton County
> Civilian adults who have served in the military: 4.3% (Wyoming: 10.0%)
> Veterans who first enlisted after 9/11: 5.4% (Wyoming: 14.2%)
> Veterans who served in the Vietnam Era only: 51.3% (Wyoming: 35.2%)
> Veterans who served during the Korean War only: 5.0% (Wyoming: 5.5%)
> No. of counties considered in ranking: 22
Methodology
To determine the county or county equivalent with the fewest veterans in every state, 24/7 Wall St. reviewed five-year estimates of the share of the civilian population 18 years and over who are veterans from the U.S. Census Bureau’s 2020 American Community Survey.
Counties were excluded if the share of veterans was not available in the 2020 ACS, if the civilian population 18 and over was less than 1,000, or if the sampling error associated with a county’s data was deemed too high.
The sampling error was defined as too high if the coefficient of variation — a statistical assessment of how reliable an estimate is — for a county’s share of veterans was above 15% and greater than two standard deviations above the mean CV for all counties’ veteran shares. We similarly excluded counties that had a sampling error too high for their population, using the same definition.
Counties were ranked based on the share of the population 18 and over who are veterans. To break ties, we used the number of veterans.
Additional information on the share of veterans who served after 9/11, in the Vietnam Era, and during the Korean War are also five-year estimates from the 2020 ACS. Because the Census Bureau didn’t release one-year estimates for 2020 due to data collection issues caused by the COVID-19 pandemic, all ACS data are five-year estimates.
Contact [email protected] for any questions or corrections.