The Biden Administration and House Republicans recently reached a bi-partisan deal to raise the debt ceiling. To reach the compromise, and keep the United States from a catastrophic debt default, the White House agreed to a series of spending cuts to social safety net programs, including the Supplemental Nutrition Assistance Program, or food stamps. (Here is a look at the American presidents who added the most to the national debt.)
SNAP is a federal program designed to help needy families and households afford food. The debt-ceiling deal includes considerable changes to SNAP eligibility.
While the new rules would expand access to SNAP for veteran and homeless populations, it would also increase work requirements for certain populations. Under the current law, able-bodied adults aged 49 or younger who do not care for young children are required to work at least 80 hours a month to be eligible for SNAP. The new law would raise the work requirement age to 54.
According to the latest available data from the U.S. Census Bureau’s American Community Survey, more than 15.8 million American households — or 12.4% of all households — received SNAP benefits in 2021. And in some parts of the country, the share of the population who depend on SNAP is far higher. Exactly how many Americans would be directly impacted if the latest eligibility changes are passed remains to be seen.
Using 2021 metro area level data from the ACS, 24/7 Wall St. identified the city in each state with the most people on food stamps. Metro areas within each state are ranked by the share of households who received SNAP benefits in 2021. With the exception of Wyoming, every state had at least one metro area with available data. In the states with only one metro area, the city listed ranks as having the highest SNAP recipiency rate by default only. These are noted.
SNAP eligibility is ultimately based on levels of need, and as a result, the cities on this list tend to have higher than average poverty rates. Of the 49 metro areas on this list, all but 10 have a higher poverty rate than the state as a whole – and the higher poverty is likely due in part to limited employment opportunities, as most of these same cities have a higher unemployment rate than statewide average. (Here is a look at the city with the poorest middle class in each state.)
Click here to see the city in each state with the most people on food stamps.
Click here to see our detailed methodology.

Alabama: Mobile
> Households receiving SNAP benefits, 2021: 19.5% (Alabama: 14.1%)
> Poverty rate, 2021: 17.9% (Alabama: 16.1%)
> Median household income, 2021: $49,691 (Alabama: $53,913)
> Unemployment rate, 2022: 3.2% (Alabama: 2.6%)
> Total population, 2021: 430,714
> No. of metros considered in ranking: 12
[in-text-ad]

Alaska: Anchorage*
> Households receiving SNAP benefits, 2021: 8.7% (Alaska: 10.4%)
> Poverty rate, 2021: 9.6% (Alaska: 10.5%)
> Median household income, 2021: $84,476 (Alaska: $77,845)
> Unemployment rate, 2022: 3.6% (Alaska: 4.0%)
> Total population, 2021: 398,807
> No. of metros considered in ranking: 1
*Because Anchorage is the only eligible metro in Alaska, it is on this list by default.
[recirclink id=1198939]

Arizona: Yuma
> Households receiving SNAP benefits, 2021: 22.3% (Arizona: 11.2%)
> Poverty rate, 2021: 16.9% (Arizona: 12.8%)
> Median household income, 2021: $57,304 (Arizona: $69,056)
> Unemployment rate, 2022: 12.5% (Arizona: 3.8%)
> Total population, 2021: 206,990
> No. of metros considered in ranking: 7

Arkansas: Fort Smith
> Households receiving SNAP benefits, 2021: 15.1% (Arkansas: 10.9%)
> Poverty rate, 2021: 19.6% (Arkansas: 16.3%)
> Median household income, 2021: $49,065 (Arkansas: $52,528)
> Unemployment rate, 2022: 3.3% (Arkansas: 3.3%)
> Total population, 2021: 247,661
> No. of metros considered in ranking: 6
[in-text-ad-2]

California: El Centro
> Households receiving SNAP benefits, 2021: 25.9% (California: 12.0%)
> Poverty rate, 2021: 16.4% (California: 12.3%)
> Median household income, 2021: $51,809 (California: $84,907)
> Unemployment rate, 2022: 14.7% (California: 4.2%)
> Total population, 2021: 179,851
> No. of metros considered in ranking: 26

Colorado: Pueblo
> Households receiving SNAP benefits, 2021: 19.4% (Colorado: 8.4%)
> Poverty rate, 2021: 16.3% (Colorado: 9.7%)
> Median household income, 2021: $56,689 (Colorado: $82,254)
> Unemployment rate, 2022: 4.4% (Colorado: 3.0%)
> Total population, 2021: 169,622
> No. of metros considered in ranking: 7
[in-text-ad]

Connecticut: New Haven-Milford
> Households receiving SNAP benefits, 2021: 14.4% (Connecticut: 11.7%)
> Poverty rate, 2021: 11.8% (Connecticut: 10.1%)
> Median household income, 2021: $75,295 (Connecticut: $83,771)
> Unemployment rate, 2022: 3.9% (Connecticut: 4.2%)
> Total population, 2021: 863,700
> No. of metros considered in ranking: 4
[recirclink id=1218406]

Delaware: Dover*
> Households receiving SNAP benefits, 2021: 12.9% (Delaware: 10.5%)
> Poverty rate, 2021: 12.3% (Delaware: 11.6%)
> Median household income, 2021: $64,308 (Delaware: $71,091)
> Unemployment rate, 2022: 5.2% (Delaware: 4.5%)
> Total population, 2021: 184,149
> No. of metros considered in ranking: 1
*Because Dover is the only eligible metro in Delaware, it is on this list by default.

Florida: Miami-Fort Lauderdale-Pompano Beach
> Households receiving SNAP benefits, 2021: 18.6% (Florida: 14.1%)
> Poverty rate, 2021: 13.3% (Florida: 13.1%)
> Median household income, 2021: $63,814 (Florida: $63,062)
> Unemployment rate, 2022: 2.8% (Florida: 2.9%)
> Total population, 2021: 6,091,747
> No. of metros considered in ranking: 21
[in-text-ad-2]

Georgia: Columbus
> Households receiving SNAP benefits, 2021: 22.0% (Georgia: 12.4%)
> Poverty rate, 2021: 19.5% (Georgia: 14.0%)
> Median household income, 2021: $52,802 (Georgia: $66,559)
> Unemployment rate, 2022: 3.6% (Georgia: 3.0%)
> Total population, 2021: 326,491
> No. of metros considered in ranking: 14

Hawaii: Kahului-Wailuku-Lahaina
> Households receiving SNAP benefits, 2021: 11.4% (Hawaii: 12.6%)
> Poverty rate, 2021: 12.1% (Hawaii: 11.2%)
> Median household income, 2021: $76,273 (Hawaii: $84,857)
> Unemployment rate, 2022: 3.5% (Hawaii: 3.5%)
> Total population, 2021: 164,268
> No. of metros considered in ranking: 2
[in-text-ad]

Idaho: Pocatello
> Households receiving SNAP benefits, 2021: 16.2% (Idaho: 8.4%)
> Poverty rate, 2021: 11.8% (Idaho: 11.0%)
> Median household income, 2021: $60,475 (Idaho: $66,474)
> Unemployment rate, 2022: 2.7% (Idaho: 2.7%)
> Total population, 2021: 97,645
> No. of metros considered in ranking: 6
[recirclink id=1168052]

Illinois: Decatur
> Households receiving SNAP benefits, 2021: 20.4% (Illinois: 14.1%)
> Poverty rate, 2021: 17.6% (Illinois: 12.1%)
> Median household income, 2021: $46,807 (Illinois: $72,205)
> Unemployment rate, 2022: 5.5% (Illinois: 4.6%)
> Total population, 2021: 102,432
> No. of metros considered in ranking: 10

Indiana: Kokomo
> Households receiving SNAP benefits, 2021: 13.8% (Indiana: 9.4%)
> Poverty rate, 2021: 10.6% (Indiana: 12.2%)
> Median household income, 2021: $55,088 (Indiana: $62,743)
> Unemployment rate, 2022: 5.0% (Indiana: 3.0%)
> Total population, 2021: 83,687
> No. of metros considered in ranking: 11
[in-text-ad-2]

Iowa: Davenport-Moline-Rock Island
> Households receiving SNAP benefits, 2021: 15.8% (Iowa: 9.8%)
> Poverty rate, 2021: 14.3% (Iowa: 11.1%)
> Median household income, 2021: $61,166 (Iowa: $65,600)
> Unemployment rate, 2022: 3.8% (Iowa: 2.7%)
> Total population, 2021: 381,447
> No. of metros considered in ranking: 7

Kansas: Wichita
> Households receiving SNAP benefits, 2021: 10.0% (Kansas: 7.3%)
> Poverty rate, 2021: 12.6% (Kansas: 11.7%)
> Median household income, 2021: $61,131 (Kansas: $64,124)
> Unemployment rate, 2022: 3.0% (Kansas: 2.7%)
> Total population, 2021: 647,919
> No. of metros considered in ranking: 2
[in-text-ad]

Kentucky: Bowling Green
> Households receiving SNAP benefits, 2021: 15.5% (Kentucky: 14.2%)
> Poverty rate, 2021: 15.6% (Kentucky: 16.5%)
> Median household income, 2021: $57,057 (Kentucky: $55,573)
> Unemployment rate, 2022: 3.7% (Kentucky: 3.9%)
> Total population, 2021: 186,107
> No. of metros considered in ranking: 5
[recirclink id=1251444]

Louisiana: Lake Charles
> Households receiving SNAP benefits, 2021: 22.9% (Louisiana: 19.0%)
> Poverty rate, 2021: 18.7% (Louisiana: 19.6%)
> Median household income, 2021: $58,736 (Louisiana: $52,087)
> Unemployment rate, 2022: 3.5% (Louisiana: 3.7%)
> Total population, 2021: 208,680
> No. of metros considered in ranking: 9

Maine: Lewiston-Auburn
> Households receiving SNAP benefits, 2021: 13.5% (Maine: 11.5%)
> Poverty rate, 2021: 15.9% (Maine: 11.5%)
> Median household income, 2021: $62,958 (Maine: $64,767)
> Unemployment rate, 2022: 3.0% (Maine: 3.0%)
> Total population, 2021: 111,034
> No. of metros considered in ranking: 3
[in-text-ad-2]

Maryland: Cumberland
> Households receiving SNAP benefits, 2021: 18.0% (Maryland: 12.6%)
> Poverty rate, 2021: 13.5% (Maryland: 10.3%)
> Median household income, 2021: $51,440 (Maryland: $90,203)
> Unemployment rate, 2022: 4.0% (Maryland: 3.2%)
> Total population, 2021: 94,586
> No. of metros considered in ranking: 5

Massachusetts: Springfield
> Households receiving SNAP benefits, 2021: 20.1% (Massachusetts: 14.6%)
> Poverty rate, 2021: 15.4% (Massachusetts: 10.4%)
> Median household income, 2021: $65,520 (Massachusetts: $89,645)
> Unemployment rate, 2022: 4.4% (Massachusetts: 3.8%)
> Total population, 2021: 695,305
> No. of metros considered in ranking: 5
[in-text-ad]

Michigan: Saginaw
> Households receiving SNAP benefits, 2021: 19.6% (Michigan: 13.4%)
> Poverty rate, 2021: 21.8% (Michigan: 13.1%)
> Median household income, 2021: $50,606 (Michigan: $63,498)
> Unemployment rate, 2022: 5.6% (Michigan: 4.2%)
> Total population, 2021: 189,591
> No. of metros considered in ranking: 14
[recirclink id=1249770]

Minnesota: Duluth
> Households receiving SNAP benefits, 2021: 9.4% (Minnesota: 7.9%)
> Poverty rate, 2021: 13.8% (Minnesota: 9.3%)
> Median household income, 2021: $64,960 (Minnesota: $77,720)
> Unemployment rate, 2022: 3.4% (Minnesota: 2.7%)
> Total population, 2021: 292,285
> No. of metros considered in ranking: 5

Mississippi: Hattiesburg
> Households receiving SNAP benefits, 2021: 12.7% (Mississippi: 13.5%)
> Poverty rate, 2021: 16.0% (Mississippi: 19.4%)
> Median household income, 2021: $55,444 (Mississippi: $48,716)
> Unemployment rate, 2022: 3.5% (Mississippi: 3.9%)
> Total population, 2021: 172,507
> No. of metros considered in ranking: 3
[in-text-ad-2]

Missouri: St. Joseph
> Households receiving SNAP benefits, 2021: 12.3% (Missouri: 10.2%)
> Poverty rate, 2021: 17.7% (Missouri: 12.7%)
> Median household income, 2021: $54,702 (Missouri: $61,847)
> Unemployment rate, 2022: 2.4% (Missouri: 2.5%)
> Total population, 2021: 120,274
> No. of metros considered in ranking: 8

Montana: Great Falls
> Households receiving SNAP benefits, 2021: 11.5% (Montana: 8.6%)
> Poverty rate, 2021: 13.2% (Montana: 11.9%)
> Median household income, 2021: $57,706 (Montana: $63,249)
> Unemployment rate, 2022: 2.6% (Montana: 2.6%)
> Total population, 2021: 84,511
> No. of metros considered in ranking: 3
[in-text-ad]

Nebraska: Omaha-Council Bluffs
> Households receiving SNAP benefits, 2021: 9.2% (Nebraska: 8.5%)
> Poverty rate, 2021: 10.5% (Nebraska: 10.8%)
> Median household income, 2021: $73,720 (Nebraska: $66,817)
> Unemployment rate, 2022: 2.6% (Nebraska: 2.3%)
> Total population, 2021: 972,195
> No. of metros considered in ranking: 3
[recirclink id=1198939]

Nevada: Las Vegas-Henderson-Paradise
> Households receiving SNAP benefits, 2021: 14.3% (Nevada: 13.6%)
> Poverty rate, 2021: 15.1% (Nevada: 14.1%)
> Median household income, 2021: $63,677 (Nevada: $66,274)
> Unemployment rate, 2022: 6.0% (Nevada: 5.4%)
> Total population, 2021: 2,292,476
> No. of metros considered in ranking: 2

New Hampshire: Manchester-Nashua*
> Households receiving SNAP benefits, 2021: 5.9% (New Hampshire: 6.0%)
> Poverty rate, 2021: 7.2% (New Hampshire: 7.2%)
> Median household income, 2021: $91,627 (New Hampshire: $88,465)
> Unemployment rate, 2022: 2.4% (New Hampshire: 2.5%)
> Total population, 2021: 424,079
> No. of metros considered in ranking: 1
*Because Manchester-Nashua is the only eligible metro in New Hampshire, it is on this list by default.
[in-text-ad-2]

New Jersey: Vineland-Bridgeton
> Households receiving SNAP benefits, 2021: 15.9% (New Jersey: 9.1%)
> Poverty rate, 2021: 13.3% (New Jersey: 10.2%)
> Median household income, 2021: $58,389 (New Jersey: $89,296)
> Unemployment rate, 2022: 5.1% (New Jersey: 3.7%)
> Total population, 2021: 153,627
> No. of metros considered in ranking: 3

New Mexico: Farmington
> Households receiving SNAP benefits, 2021: 28.4% (New Mexico: 20.7%)
> Poverty rate, 2021: 26.7% (New Mexico: 18.4%)
> Median household income, 2021: $47,819 (New Mexico: $53,992)
> Unemployment rate, 2022: 4.6% (New Mexico: 4.0%)
> Total population, 2021: 120,993
> No. of metros considered in ranking: 4
[in-text-ad]

New York: Buffalo-Cheektowaga
> Households receiving SNAP benefits, 2021: 16.4% (New York: 15.0%)
> Poverty rate, 2021: 13.5% (New York: 13.9%)
> Median household income, 2021: $62,794 (New York: $74,314)
> Unemployment rate, 2022: 3.6% (New York: 4.3%)
> Total population, 2021: 1,162,336
> No. of metros considered in ranking: 12
[recirclink id=1218406]

North Carolina: Goldsboro
> Households receiving SNAP benefits, 2021: 25.5% (North Carolina: 13.9%)
> Poverty rate, 2021: 19.9% (North Carolina: 13.4%)
> Median household income, 2021: $47,595 (North Carolina: $61,972)
> Unemployment rate, 2022: 4.0% (North Carolina: 3.7%)
> Total population, 2021: 116,835
> No. of metros considered in ranking: 15

North Dakota: Fargo
> Households receiving SNAP benefits, 2021: 6.6% (North Dakota: 6.2%)
> Poverty rate, 2021: 11.6% (North Dakota: 11.1%)
> Median household income, 2021: $66,216 (North Dakota: $66,519)
> Unemployment rate, 2022: 1.9% (North Dakota: 2.1%)
> Total population, 2021: 252,136
> No. of metros considered in ranking: 2
[in-text-ad-2]

Ohio: Lima
> Households receiving SNAP benefits, 2021: 20.1% (Ohio: 13.0%)
> Poverty rate, 2021: 15.5% (Ohio: 13.4%)
> Median household income, 2021: $51,497 (Ohio: $62,262)
> Unemployment rate, 2022: 4.2% (Ohio: 4.0%)
> Total population, 2021: 101,670
> No. of metros considered in ranking: 11

Oklahoma: Lawton
> Households receiving SNAP benefits, 2021: 13.4% (Oklahoma: 13.8%)
> Poverty rate, 2021: 20.1% (Oklahoma: 15.6%)
> Median household income, 2021: $49,422 (Oklahoma: $55,826)
> Unemployment rate, 2022: 3.6% (Oklahoma: 3.0%)
> Total population, 2021: 127,078
> No. of metros considered in ranking: 3
[in-text-ad]
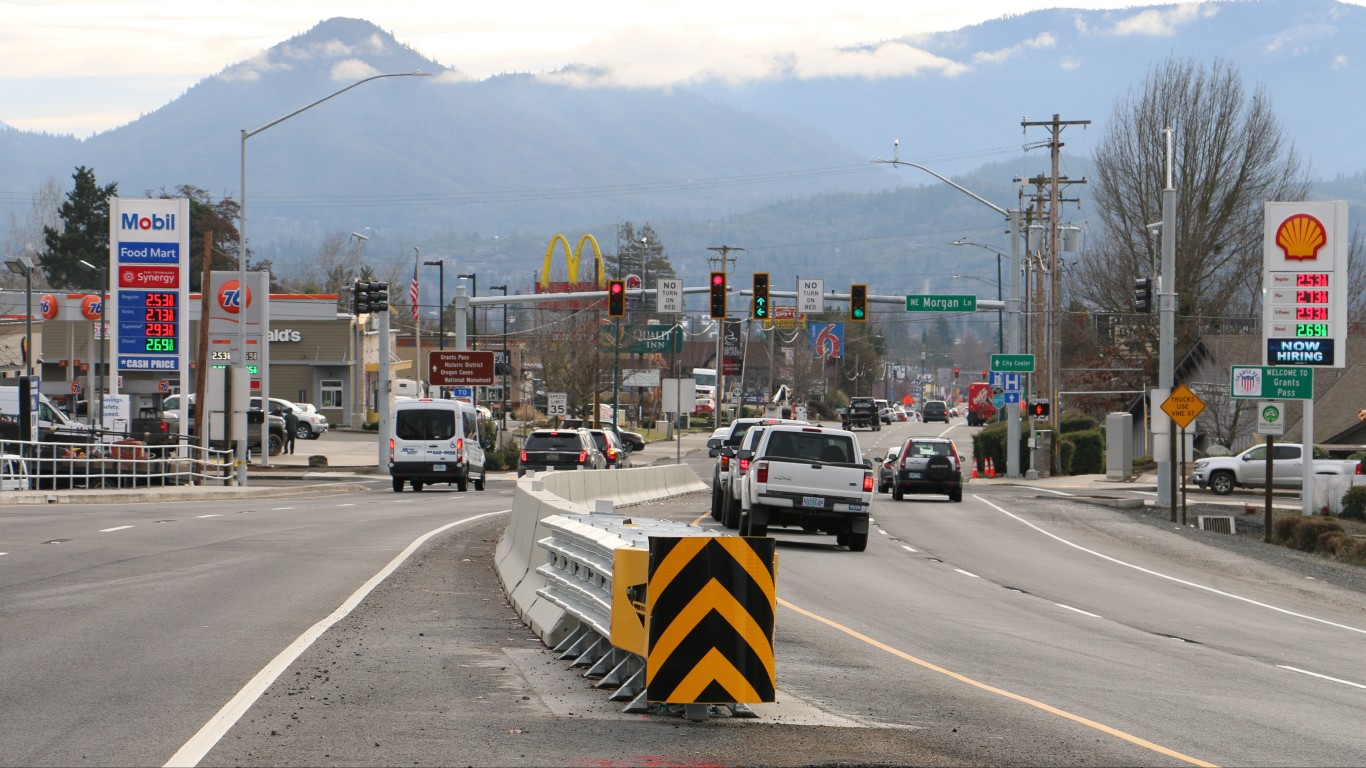
Oregon: Grants Pass
> Households receiving SNAP benefits, 2021: 24.7% (Oregon: 15.9%)
> Poverty rate, 2021: 16.7% (Oregon: 12.2%)
> Median household income, 2021: $48,785 (Oregon: $71,562)
> Unemployment rate, 2022: 5.6% (Oregon: 4.2%)
> Total population, 2021: 88,346
> No. of metros considered in ranking: 8
[recirclink id=1168052]

Pennsylvania: Erie
> Households receiving SNAP benefits, 2021: 19.6% (Pennsylvania: 14.1%)
> Poverty rate, 2021: 16.5% (Pennsylvania: 12.1%)
> Median household income, 2021: $56,851 (Pennsylvania: $68,957)
> Unemployment rate, 2022: 5.0% (Pennsylvania: 4.4%)
> Total population, 2021: 269,011
> No. of metros considered in ranking: 18

Rhode Island: Providence-Warwick*
> Households receiving SNAP benefits, 2021: 16.4% (Rhode Island: 14.9%)
> Poverty rate, 2021: 11.6% (Rhode Island: 11.4%)
> Median household income, 2021: $73,788 (Rhode Island: $74,008)
> Unemployment rate, 2022: 3.5% (Rhode Island: 3.2%)
> Total population, 2021: 1,675,774
> No. of metros considered in ranking: 1
*Because Providence-Warwick is the only eligible metro in Rhode Island, it is on this list by default.
[in-text-ad-2]

South Carolina: Florence
> Households receiving SNAP benefits, 2021: 20.9% (South Carolina: 11.1%)
> Poverty rate, 2021: 19.3% (South Carolina: 14.6%)
> Median household income, 2021: $49,724 (South Carolina: $59,318)
> Unemployment rate, 2022: 3.3% (South Carolina: 3.2%)
> Total population, 2021: 199,259
> No. of metros considered in ranking: 8

South Dakota: Rapid City
> Households receiving SNAP benefits, 2021: 7.8% (South Dakota: 8.0%)
> Poverty rate, 2021: 11.1% (South Dakota: 12.3%)
> Median household income, 2021: $63,342 (South Dakota: $66,143)
> Unemployment rate, 2022: 2.1% (South Dakota: 2.1%)
> Total population, 2021: 141,190
> No. of metros considered in ranking: 2
[in-text-ad]

Tennessee: Kingsport-Bristol
> Households receiving SNAP benefits, 2021: 15.3% (Tennessee: 11.9%)
> Poverty rate, 2021: 16.9% (Tennessee: 13.6%)
> Median household income, 2021: $48,771 (Tennessee: $59,695)
> Unemployment rate, 2022: 3.4% (Tennessee: 3.4%)
> Total population, 2021: 307,318
> No. of metros considered in ranking: 10
[recirclink id=1251444]

Texas: McAllen-Edinburg-Mission
> Households receiving SNAP benefits, 2021: 30.9% (Texas: 12.2%)
> Poverty rate, 2021: 29.3% (Texas: 14.2%)
> Median household income, 2021: $44,818 (Texas: $66,963)
> Unemployment rate, 2022: 6.5% (Texas: 3.9%)
> Total population, 2021: 880,356
> No. of metros considered in ranking: 23

Utah: Ogden-Clearfield
> Households receiving SNAP benefits, 2021: 6.3% (Utah: 5.6%)
> Poverty rate, 2021: 7.6% (Utah: 8.6%)
> Median household income, 2021: $81,364 (Utah: $79,449)
> Unemployment rate, 2022: 2.3% (Utah: 2.3%)
> Total population, 2021: 708,543
> No. of metros considered in ranking: 4
[in-text-ad-2]

Vermont: Burlington-South Burlington*
> Households receiving SNAP benefits, 2021: 9.9% (Vermont: 10.9%)
> Poverty rate, 2021: 10.7% (Vermont: 10.3%)
> Median household income, 2021: $81,852 (Vermont: $72,431)
> Unemployment rate, 2022: 2.2% (Vermont: 2.6%)
> Total population, 2021: 226,715
> No. of metros considered in ranking: 1
*Because Burlington-South Burlington is the only eligible metro in Vermont, it is on this list by default.

Virginia: Virginia Beach-Norfolk-Newport News
> Households receiving SNAP benefits, 2021: 10.6% (Virginia: 8.8%)
> Poverty rate, 2021: 10.7% (Virginia: 10.2%)
> Median household income, 2021: $72,686 (Virginia: $80,963)
> Unemployment rate, 2022: 3.2% (Virginia: 2.9%)
> Total population, 2021: 1,806,423
> No. of metros considered in ranking: 9
[in-text-ad]

Washington: Yakima
> Households receiving SNAP benefits, 2021: 23.9% (Washington: 12.3%)
> Poverty rate, 2021: 14.0% (Washington: 9.9%)
> Median household income, 2021: $61,012 (Washington: $84,247)
> Unemployment rate, 2022: 6.4% (Washington: 4.2%)
> Total population, 2021: 256,035
> No. of metros considered in ranking: 10
[recirclink id=1249770]

West Virginia: Beckley
> Households receiving SNAP benefits, 2021: 22.1% (West Virginia: 18.3%)
> Poverty rate, 2021: 22.7% (West Virginia: 16.8%)
> Median household income, 2021: $38,737 (West Virginia: $51,248)
> Unemployment rate, 2022: 4.0% (West Virginia: 3.9%)
> Total population, 2021: 113,698
> No. of metros considered in ranking: 7

Wisconsin: Milwaukee-Waukesha
> Households receiving SNAP benefits, 2021: 15.6% (Wisconsin: 11.8%)
> Poverty rate, 2021: 12.4% (Wisconsin: 10.8%)
> Median household income, 2021: $68,449 (Wisconsin: $67,125)
> Unemployment rate, 2022: 3.2% (Wisconsin: 2.9%)
> Total population, 2021: 1,566,487
> No. of metros considered in ranking: 12
[in-text-ad-2]

Wyoming: No eligible metros
> Households receiving SNAP benefits, 2021: N/A (Wyoming: 5.5%)
> Poverty rate, 2021: N/A (Wyoming: 11.4%)
> Median household income, 2021: N/A (Wyoming: $65,204)
> Unemployment rate, 2022: N/A (Wyoming: 3.6%)
> Total population, 2021: N/A (Wyoming: 578,803)
Methodology
To determine the metro with the highest SNAP recipiency rate in every state, 24/7 Wall St. reviewed one-year estimates of the share of households that received SNAP benefits in the 12 months prior to the survey from the U.S. Census Bureau’s 2021 American Community Survey. Metro areas are ranked based on the share of households that received SNAP benefits in 2021.
We used the 366 metropolitan statistical areas as delineated by the United States Office of Management and Budget and used by the Census Bureau as our definition of metros.
Metros were excluded if the SNAP recipiency rate was not available in the 2021 ACS, if there were fewer than 500 households, or if the sampling error associated with a metro’s data was deemed too high.
The sampling error was defined as too high if the coefficient of variation — a statistical assessment of how reliable an estimate is — for a metro’s SNAP recipiency rate was above 15% and greater than two standard deviations above the mean CV for all metros’ SNAP recipiency rates. We similarly excluded metros that had a sampling error too high for their population, using the same definition.
Additional information on poverty rate, median household income, and total population are also one-year estimates from the 2021 ACS. Data on the 2022 unemployment rate is from the Bureau of Labor Statistics.
Contact [email protected] for any questions or corrections.