The American middle class has long been a pillar of stability in the U.S. economy and a driver of economic growth. However, stagnating wages and a rising cost of living, coupled with the decline of once dominant industries, have been eroding the ranks of the American middle class for decades.
While there is no universally accepted, strict definition of what it means to be middle class, there are some broad guidelines. For example, middle class households typically have some disposable income for luxuries such as vacations and eating at restaurants, and they are able to put away money for savings and retirement. However, for larger expenses, like buying a house, a car, or a college education, middle-class households generally rely on loans.
But, in much of the country, because of deteriorating economic conditions, many households that fall in the middle of the income spectrum may no longer meet some of these established benchmarks of middle-class status.
Using metro area data from the U.S. Census Bureau’s 2021 American Community Survey, 24/7 Wall St. identified the city with the weakest middle class in each state. For the purposes of this story, the middle class is defined as the middle 20% of earners at the household level — that is, 40% of households earn higher incomes than the top range of the middle quintile, while 40% have a lower income than the middle class’s bottom income range. For each state, the metro area with the lowest income ceiling for the middle quintile of earners ranks as having the poorest middle class. All data is for 2021.
It is important to note that Delaware, New Hampshire, Rhode Island, and Vermont are each home to only one metro area. As a result, the city listed for each of these states ranks as having the poorest middle class by default only. And though each metro area on this list ranks as having the weakest middle class in the state, there are several cases in which middle class households in these places earn more than the middle income households across the state as a whole.
Not only are middle class earnings relatively low in most of the cities on this list, but the broader population in general also tends to be poorer. In all but four of the metro areas listed, the typical household earns less than the statewide median household income – and in all but six metro areas on this list, the median household income is below $69,717, the annual income of the typical American household. Several of these places rank among the poorest cities in the United States. (Here is a look at America’s poorest big cities.)
Unlike in decades past, where someone could get a well-paying job with just a high school diploma, today, the vast majority of high-paying positions require a college education. Perhaps not surprisingly, in all but eight metro areas on this list, the share of adults with a bachelor’s degree or higher is below the share of adults with a bachelor’s degree across the state as a whole. (Here is a look at the highest paying college majors.)
Click here to see city with the poorest middle class in each state.
Click here to see our detailed methodology.

Alabama: Gadsden
> Middle-income range: $36,325 – $55,795 (state: $50,397 – $78,729)
> Median household income: $45,298 (state: $53,913)
> Share of income earned by middle class: 15.5% (state: 14.3%)
> Share of income earned by wealthiest 5% of households: 19.2% (state: 22.5%)
> Adults with a bachelor’s degree or higher: 18.2% (state: 27.4%)
> Metro areas considered in state: 12
[in-text-ad]
Source: lippyjr / iStock Editorial via Getty Images
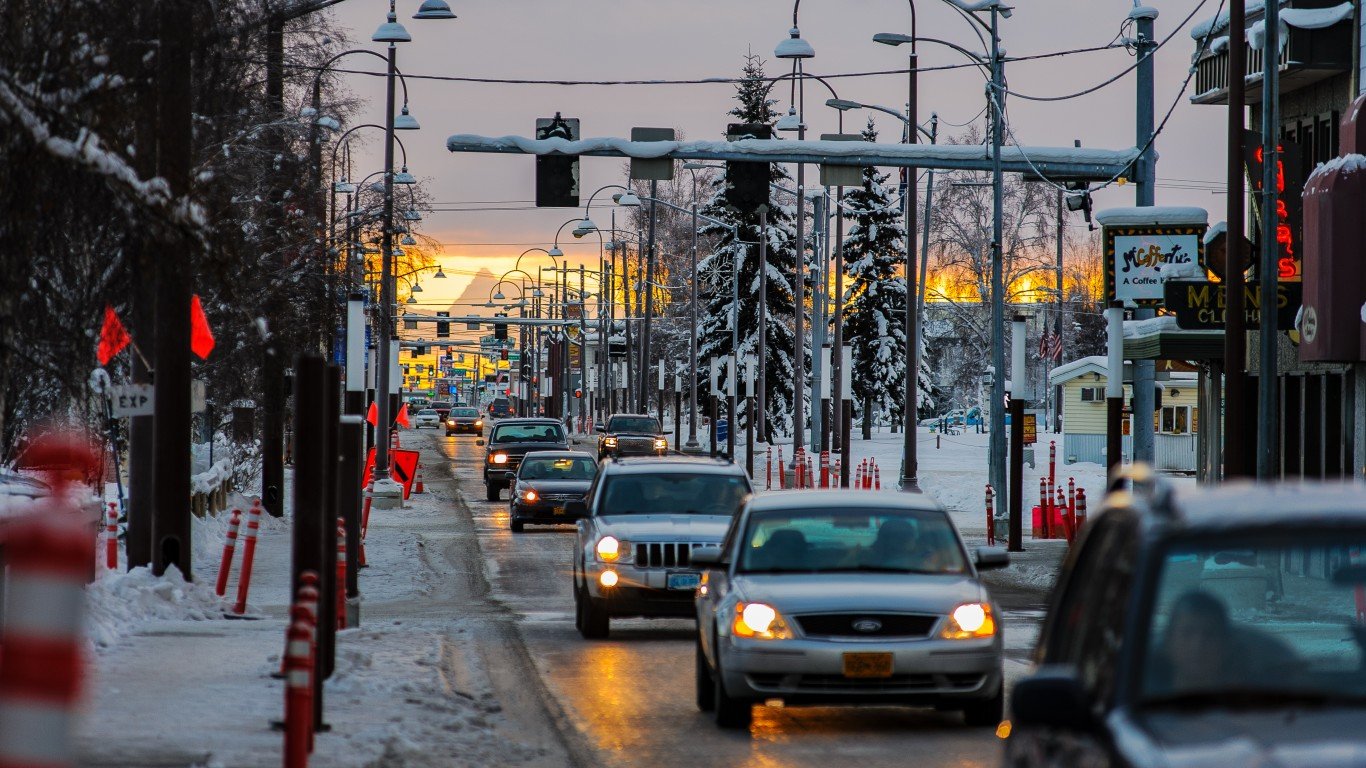
Alaska: Fairbanks
> Middle-income range: $60,983 – $89,054 (state: $71,175 – $111,220)
> Median household income: $72,149 (state: $77,845)
> Share of income earned by middle class: 16.0% (state: 15.7%)
> Share of income earned by wealthiest 5% of households: 16.4% (state: 18.9%)
> Adults with a bachelor’s degree or higher: 38.1% (state: 32.8%)
> Metro areas considered in state: 2
 24/7 Wall St.
Source: DenisTangneyJr / iStock via Getty Images
Arizona: Lake Havasu City-Kingman
> Middle-income range: $35,900 – $59,491 (state: $52,295 – $82,996)
> Median household income: $46,616 (state: $69,056)
> Share of income earned by middle class: 14.3% (state: 14.8%)
> Share of income earned by wealthiest 5% of households: 22.8% (state: 22.3%)
> Adults with a bachelor’s degree or higher: 15.1% (state: 32.4%)
> Metro areas considered in state: 7
Source: peeterv / iStock via Getty Images
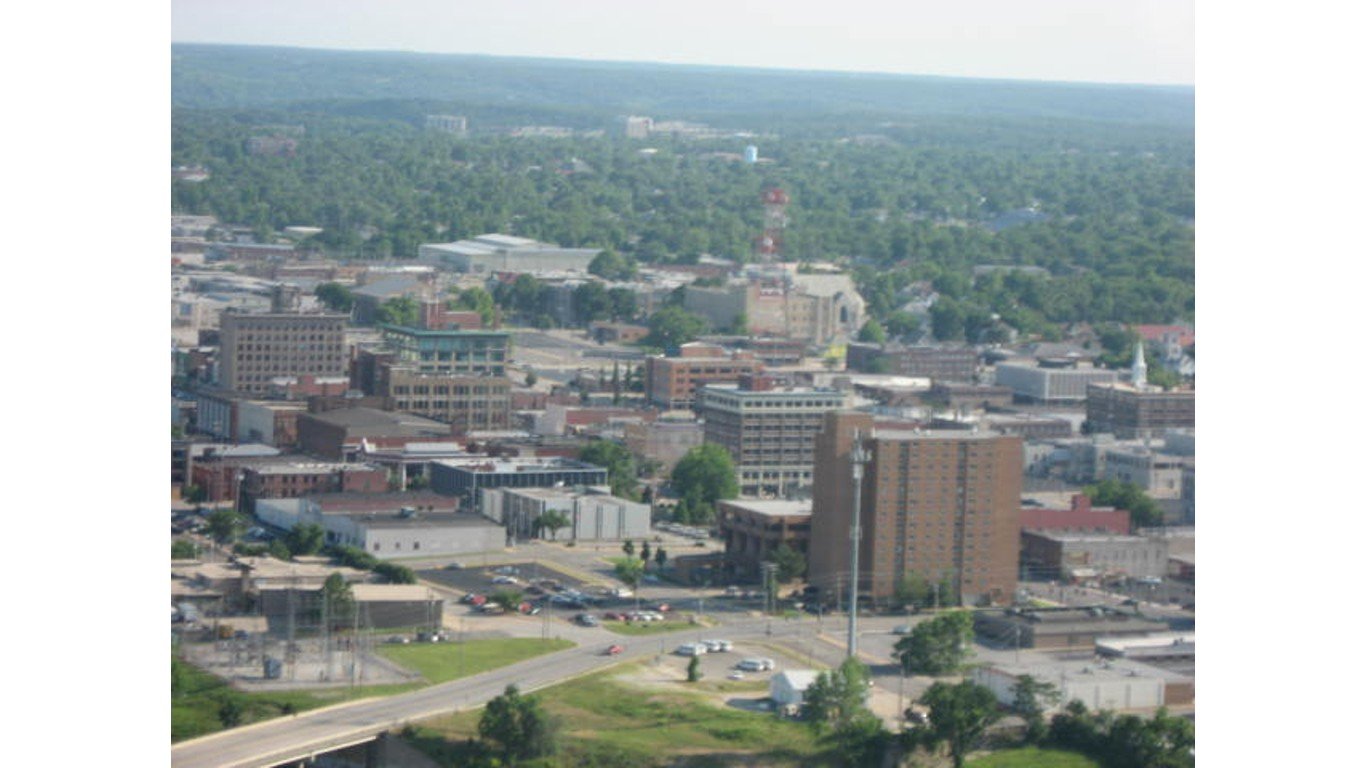
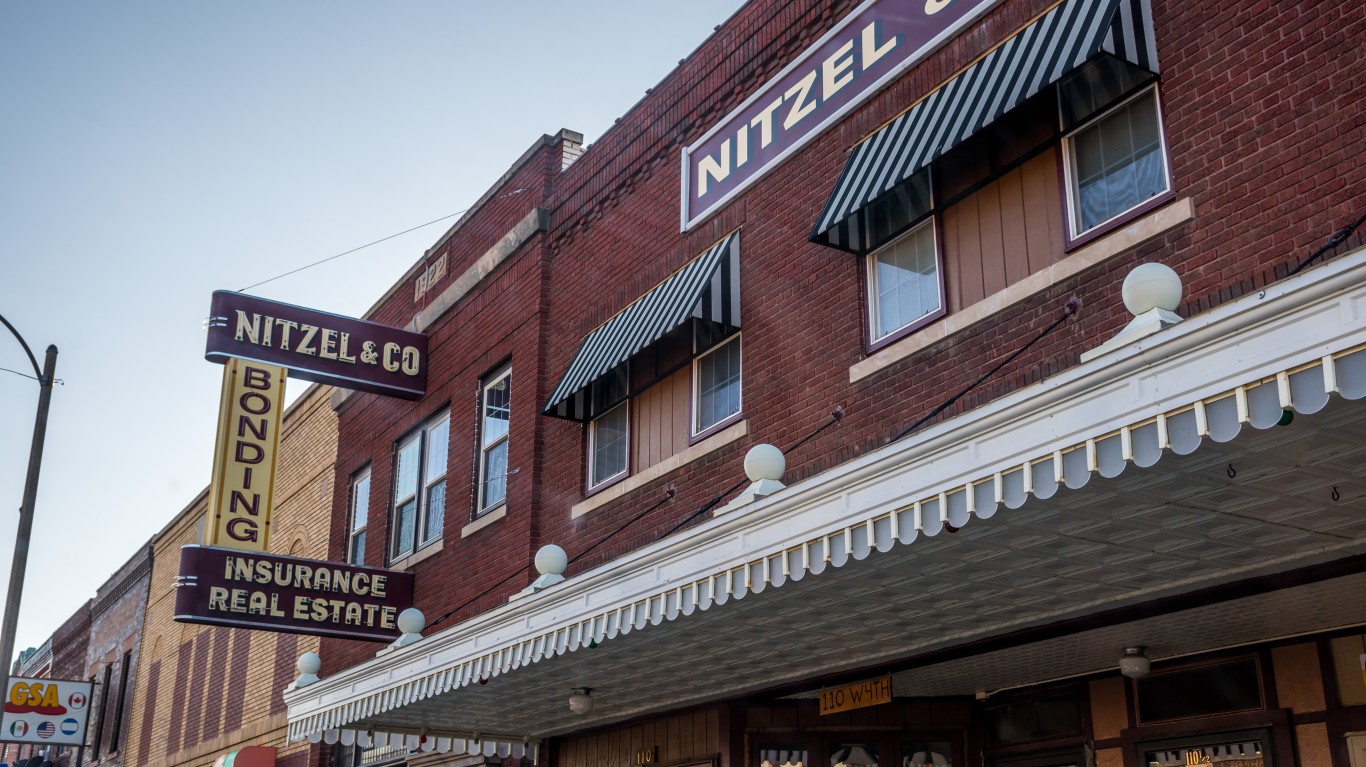
Arkansas: Fort Smith
> Middle-income range: $39,500 – $59,478 (state: $56,948 – $94,304)
> Median household income: $49,065 (state: $52,528)
> Share of income earned by middle class: 14.6% (state: 14.5%)
> Share of income earned by wealthiest 5% of households: 23.2% (state: 22.5%)
> Adults with a bachelor’s degree or higher: 20.3% (state: 25.3%)
> Metro areas considered in state: 6
[in-text-ad-2]

Source: diegograndi / iStock via Getty Images
California: Merced
> Middle-income range: $43,011 – $68,166 (state: $66,612 – $105,995)
> Median household income: $53,992 (state: $84,907)
> Share of income earned by middle class: 15.0% (state: 14.2%)
> Share of income earned by wealthiest 5% of households: 22.3% (state: 23.6%)
> Adults with a bachelor’s degree or higher: 14.4% (state: 36.2%)
> Metro areas considered in state: 26
Source: btimages / iStock via Getty Images
Colorado: Pueblo
> Middle-income range: $43,029 – $70,546 (state: $53,713 – $85,848)
> Median household income: $56,689 (state: $82,254)
> Share of income earned by middle class: 15.0% (state: 14.9%)
> Share of income earned by wealthiest 5% of households: 22.6% (state: 22.0%)
> Adults with a bachelor’s degree or higher: 26.6% (state: 44.4%)
> Metro areas considered in state: 7
[in-text-ad]
Source: Jon Bilous / iStock via Getty Images
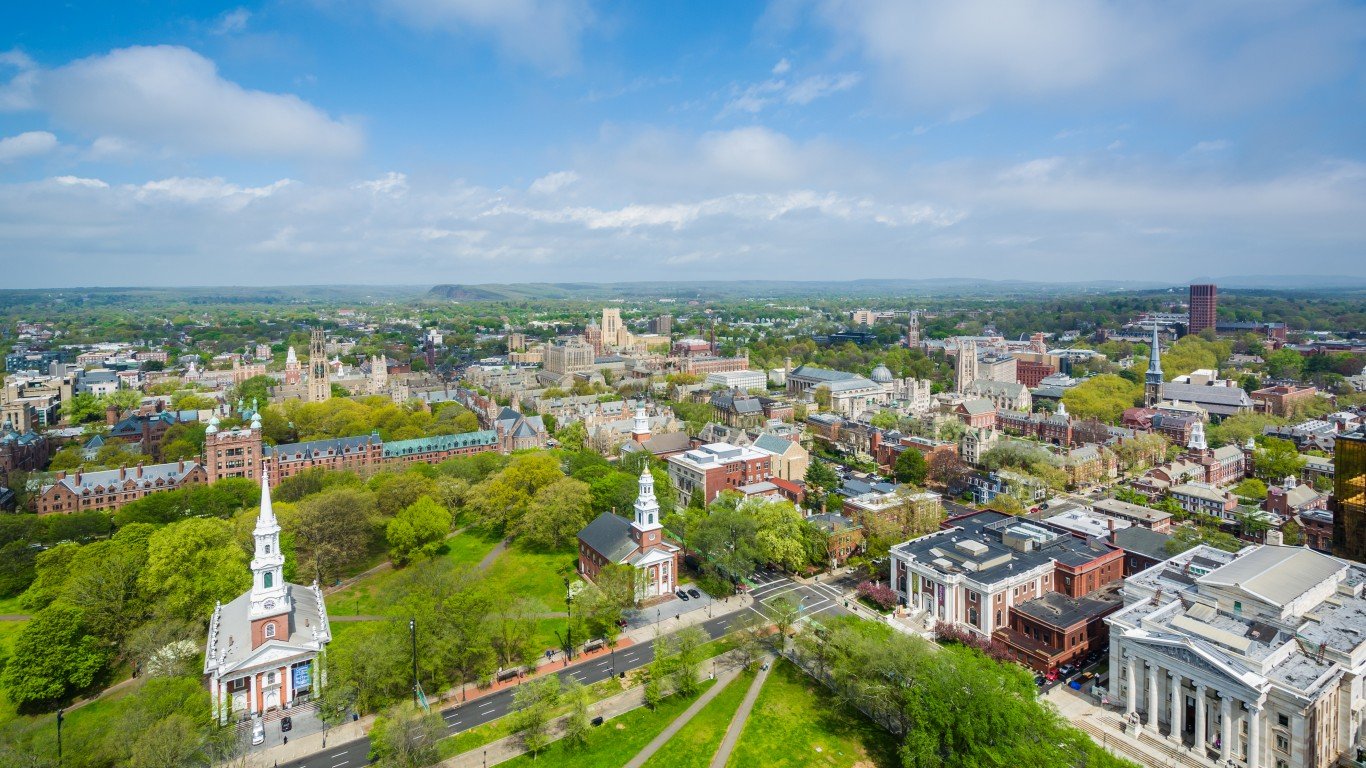
Connecticut: New Haven-Milford
> Middle-income range: $58,427 – $95,712 (state: $50,200 – $78,317)
> Median household income: $75,295 (state: $83,771)
> Share of income earned by middle class: 14.7% (state: 14.0%)
> Share of income earned by wealthiest 5% of households: 22.5% (state: 24.9%)
> Adults with a bachelor’s degree or higher: 39.5% (state: 42.1%)
> Metro areas considered in state: 4
 24/7 Wall St.
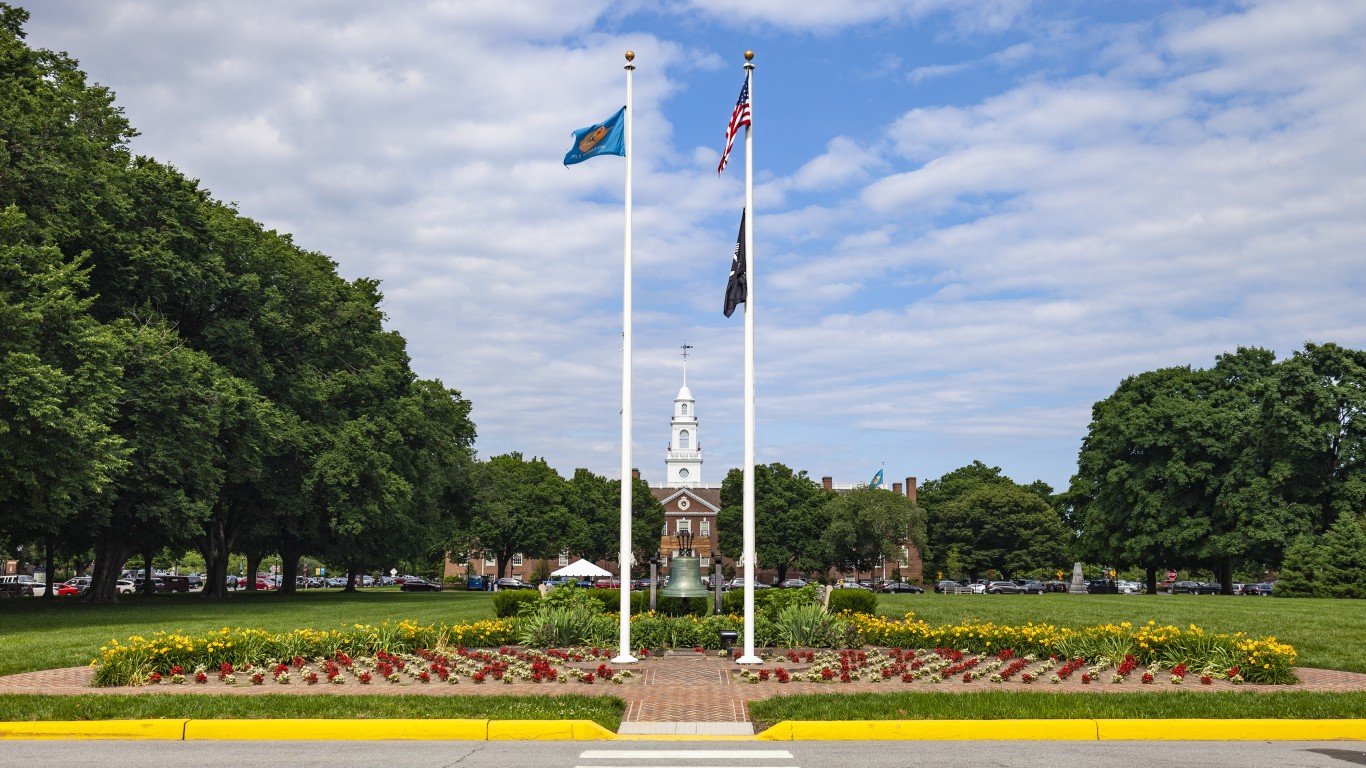
Source: traveler1116 / iStock via Getty Images
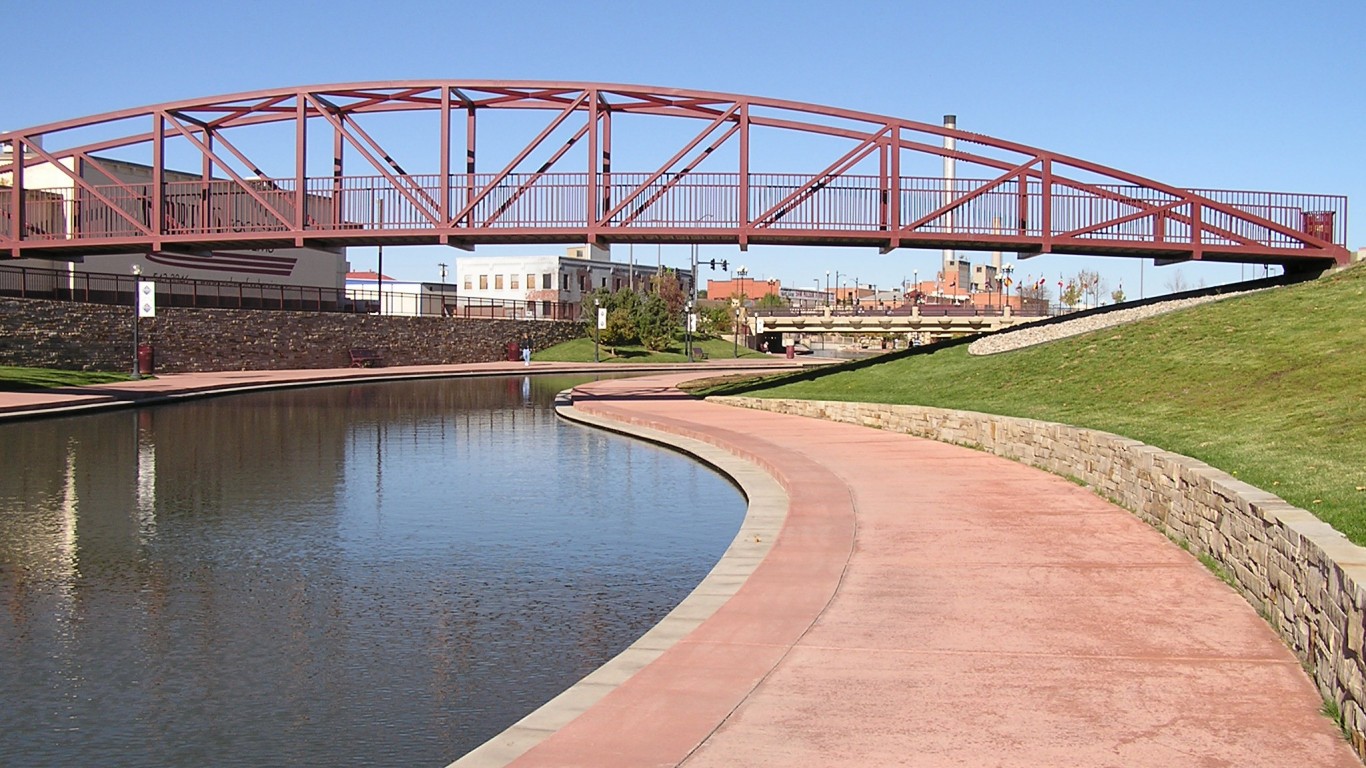
Delaware: Dover
> Middle-income range: $52,778 – $79,512 (state: $56,948 – $94,304)
> Median household income: $64,308 (state: $71,091)
> Share of income earned by middle class: 16.6% (state: 15.0%)
> Share of income earned by wealthiest 5% of households: 16.9% (state: 21.2%)
> Adults with a bachelor’s degree or higher: 27.0% (state: 35.6%)
> Metro areas considered in state: 1
Because Dover is the only metro area with available data in Delaware, it ranks as having the poorest middle class by default.
Source: felixmizioznikov / iStock via Getty Images
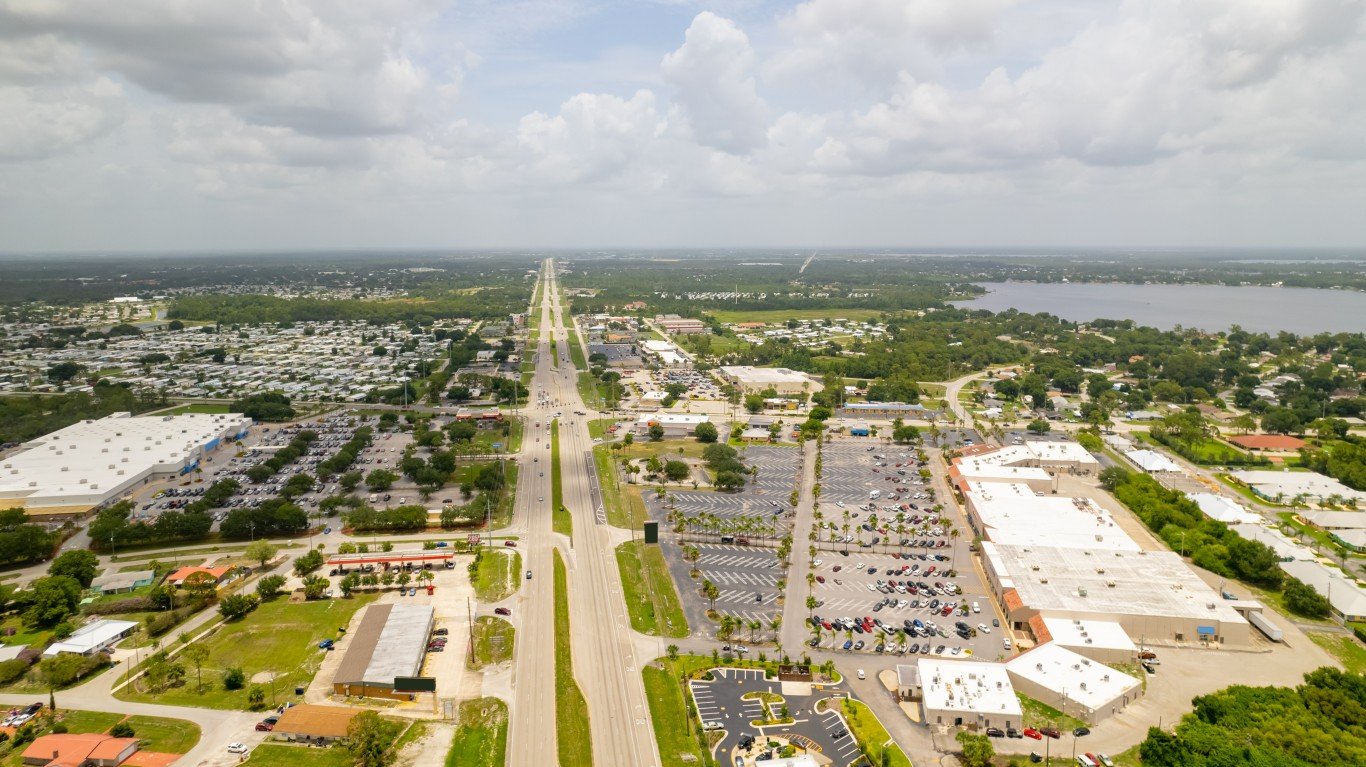
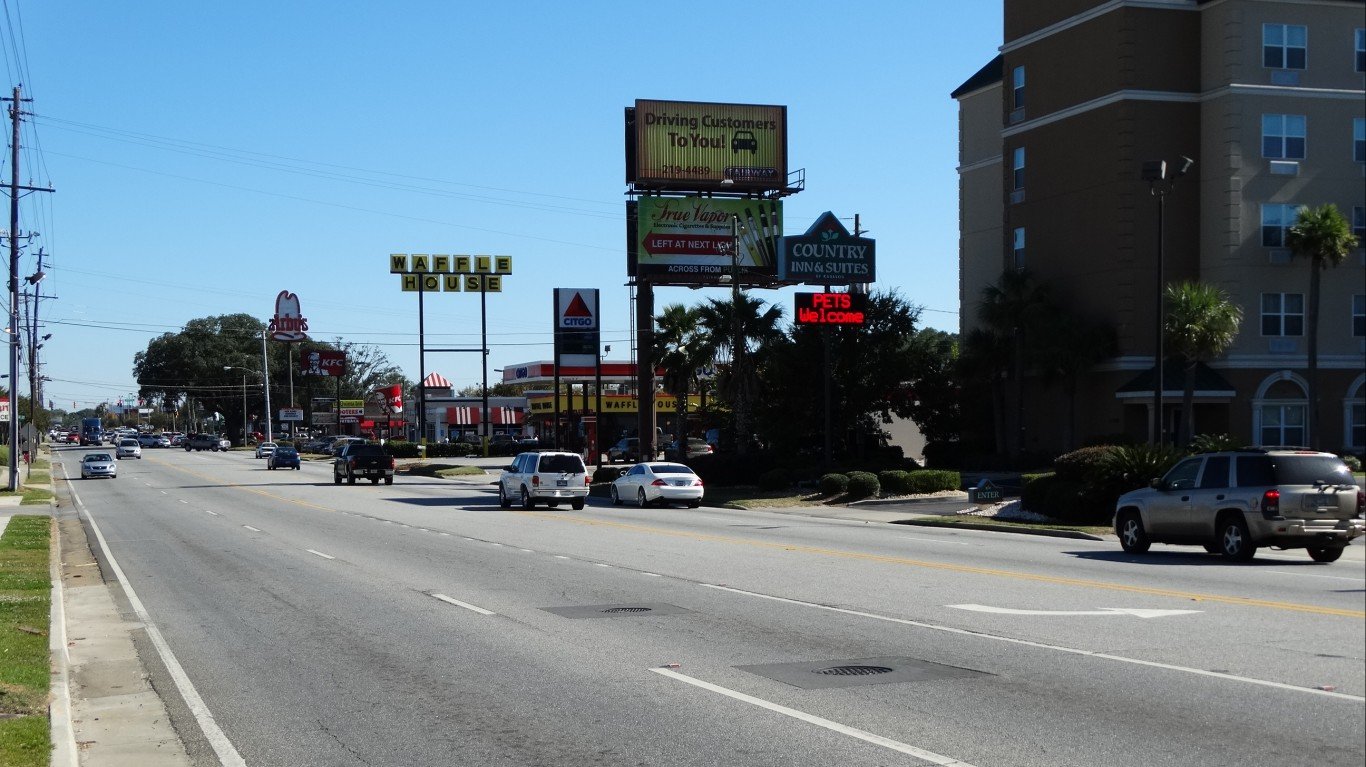
Florida: Sebring-Avon Park
> Middle-income range: $38,307 – $60,298 (state: $41,926 – $68,599)
> Median household income: $48,564 (state: $63,062)
> Share of income earned by middle class: 16.1% (state: 14.1%)
> Share of income earned by wealthiest 5% of households: 18.8% (state: 24.4%)
> Adults with a bachelor’s degree or higher: 18.3% (state: 33.2%)
> Metro areas considered in state: 22
[in-text-ad-2]
Source: Janabi / iStock Editorial via Getty Images
Georgia: Valdosta
> Middle-income range: $30,099 – $53,975 (state: $52,295 – $82,996)
> Median household income: $42,233 (state: $66,559)
> Share of income earned by middle class: 14.6% (state: 14.5%)
> Share of income earned by wealthiest 5% of households: 22.0% (state: 22.9%)
> Adults with a bachelor’s degree or higher: 22.3% (state: 34.6%)
> Metro areas considered in state: 14

Source: Art Wager / E+ via Getty Images
Hawaii: Kahului-Wailuku-Lahaina
> Middle-income range: $59,808 – $95,322 (state: $50,200 – $78,317)
> Median household income: $76,273 (state: $84,857)
> Share of income earned by middle class: 13.9% (state: 15.2%)
> Share of income earned by wealthiest 5% of households: 22.6% (state: 20.8%)
> Adults with a bachelor’s degree or higher: 30.0% (state: 35.3%)
> Metro areas considered in state: 2
[in-text-ad]
Source: peeterv / iStock via Getty Images
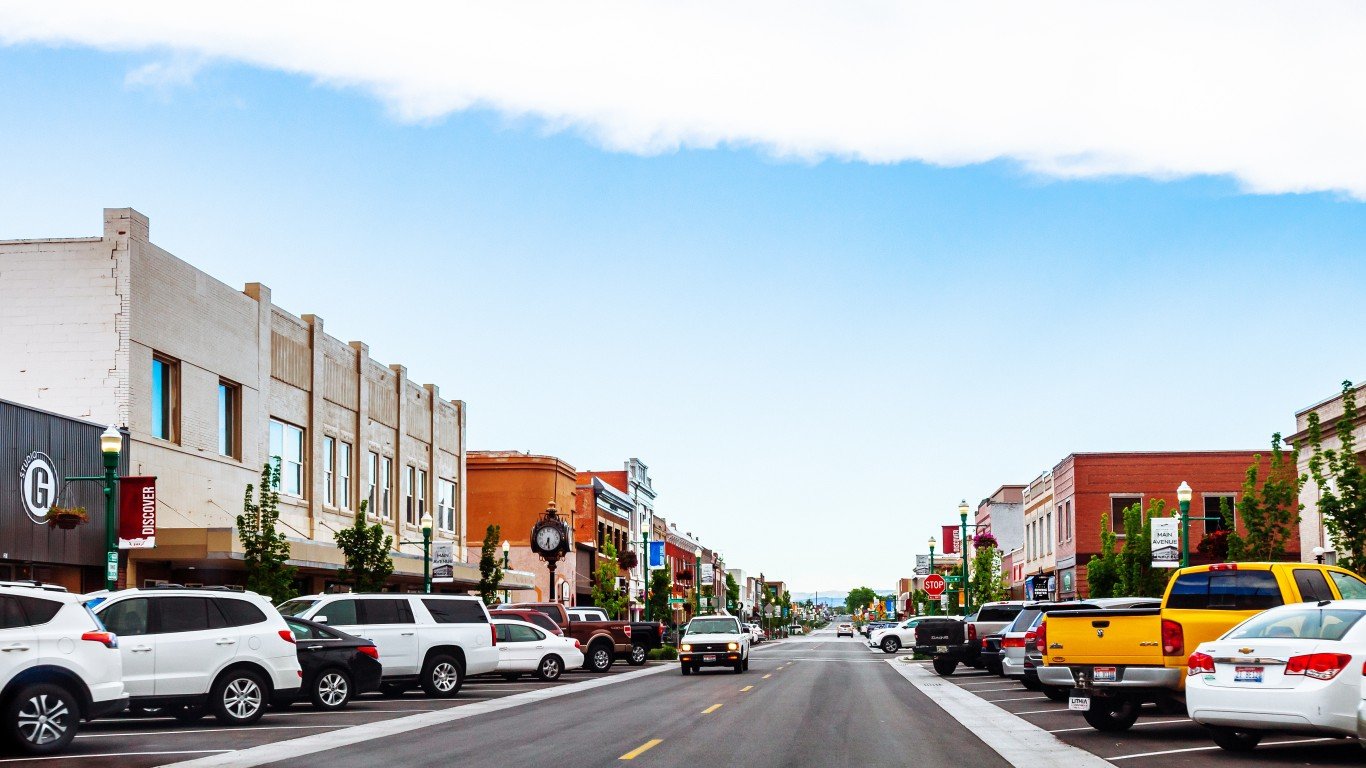
Idaho: Twin Falls
> Middle-income range: $45,071 – $69,129 (state: $53,802 – $82,323)
> Median household income: $55,519 (state: $66,474)
> Share of income earned by middle class: 14.3% (state: 14.9%)
> Share of income earned by wealthiest 5% of households: 23.9% (state: 23.3%)
> Adults with a bachelor’s degree or higher: 21.4% (state: 30.7%)
> Metro areas considered in state: 6

Illinois: Danville
> Middle-income range: $38,728 – $60,164 (state: $54,292 – $81,556)
> Median household income: $49,091 (state: $72,205)
> Share of income earned by middle class: 15.3% (state: 14.5%)
> Share of income earned by wealthiest 5% of households: 20.2% (state: 23.1%)
> Adults with a bachelor’s degree or higher: 15.9% (state: 37.1%)
> Metro areas considered in state: 10
Source: Roberto Galan / iStock Editorial via Getty Images
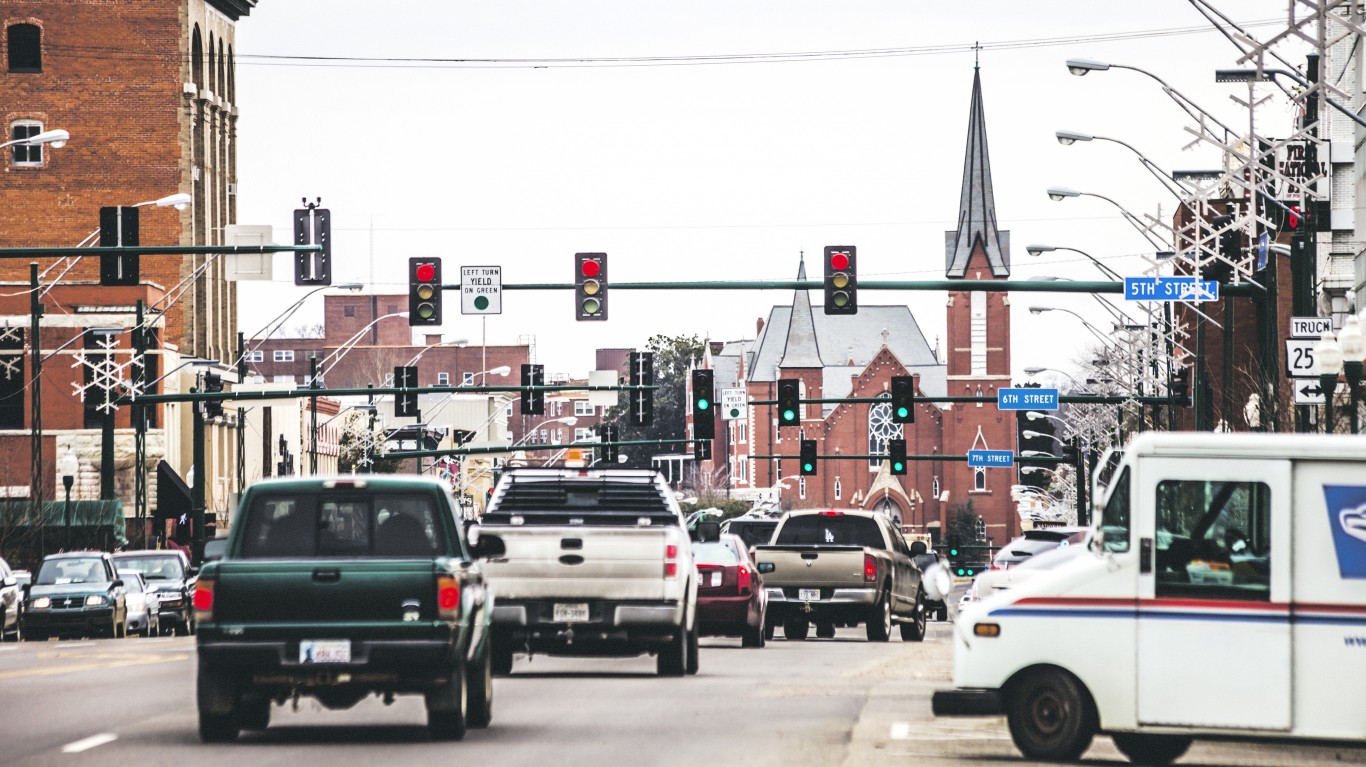
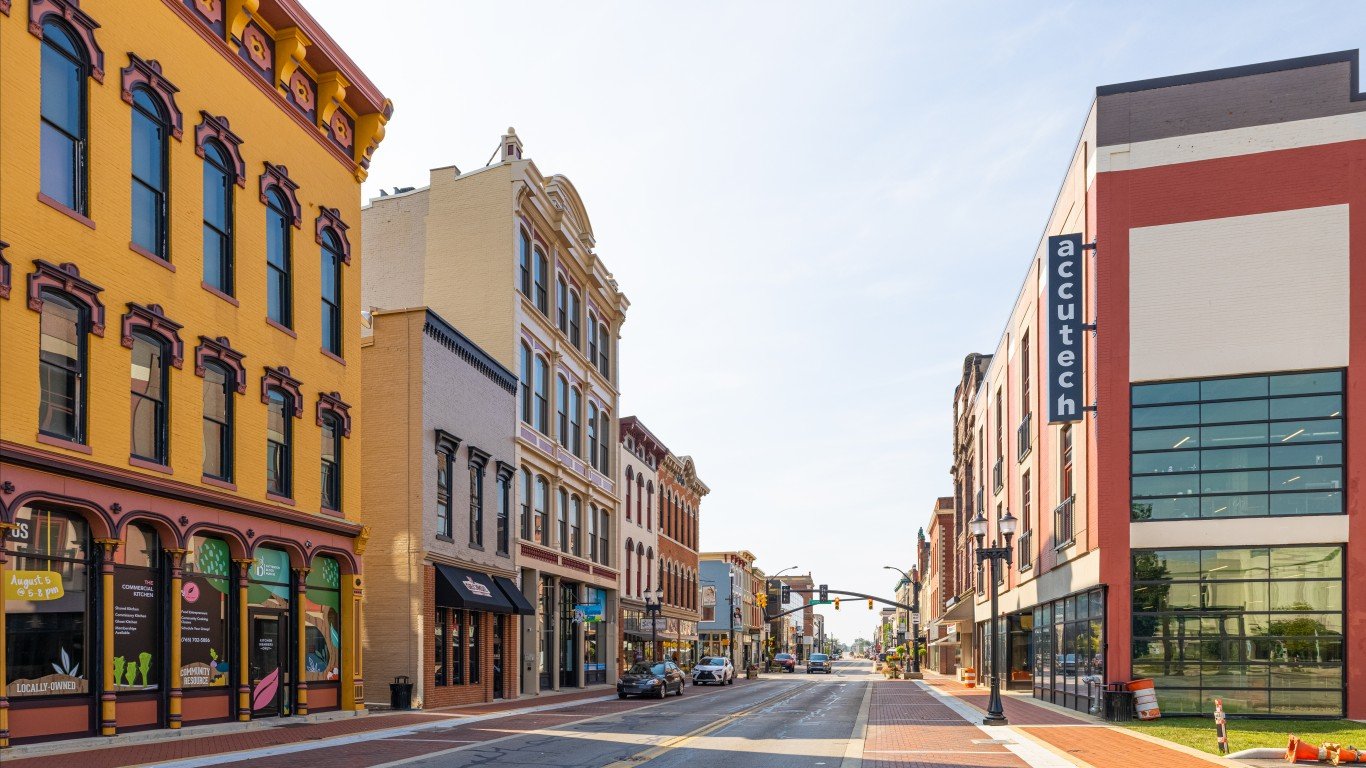
Indiana: Muncie
> Middle-income range: $40,180 – $60,572 (state: $66,968 – $104,584)
> Median household income: $50,497 (state: $62,743)
> Share of income earned by middle class: 15.6% (state: 15.3%)
> Share of income earned by wealthiest 5% of households: 20.3% (state: 20.9%)
> Adults with a bachelor’s degree or higher: 24.5% (state: 28.9%)
> Metro areas considered in state: 12
[in-text-ad-2]

Source: 129679309@N05 / Flickr
Iowa: Waterloo-Cedar Falls
> Middle-income range: $49,051 – $76,772 (state: $53,802 – $82,323)
> Median household income: $61,833 (state: $65,600)
> Share of income earned by middle class: 15.7% (state: 15.3%)
> Share of income earned by wealthiest 5% of households: 21.7% (state: 21.5%)
> Adults with a bachelor’s degree or higher: 29.5% (state: 30.5%)
> Metro areas considered in state: 8
Source: BergmannD / iStock via Getty Images
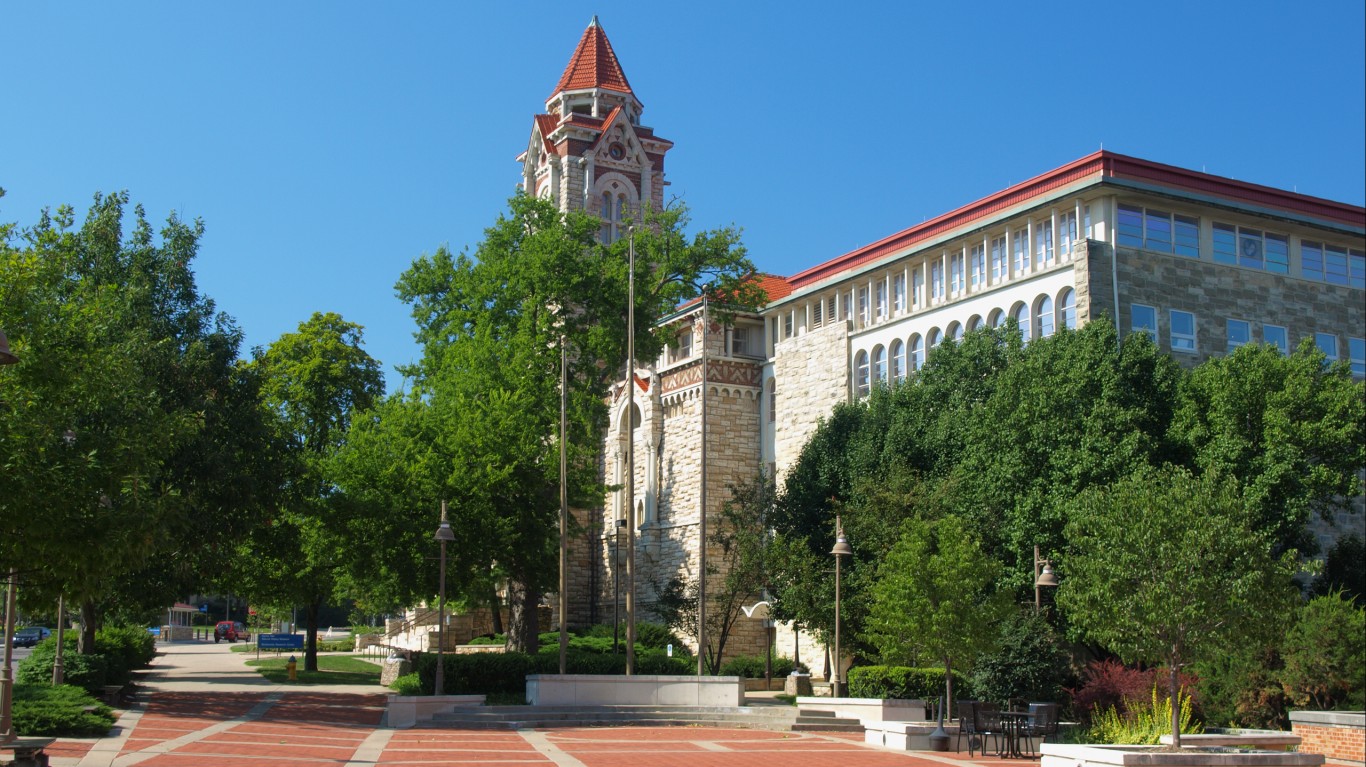
Kansas: Lawrence
> Middle-income range: $45,193 – $71,072 (state: $54,292 – $81,556)
> Median household income: $56,576 (state: $64,124)
> Share of income earned by middle class: 15.2% (state: 14.9%)
> Share of income earned by wealthiest 5% of households: 19.2% (state: 22.1%)
> Adults with a bachelor’s degree or higher: -100.0% (state: 35.4%)
> Metro areas considered in state: 4
[in-text-ad]

Kentucky: Elizabethtown-Fort Knox
> Middle-income range: $50,476 – $70,797 (state: $41,926 – $68,599)
> Median household income: $60,025 (state: $55,573)
> Share of income earned by middle class: 16.0% (state: 14.7%)
> Share of income earned by wealthiest 5% of households: 15.8% (state: 22.4%)
> Adults with a bachelor’s degree or higher: 24.5% (state: 27.0%)
> Metro areas considered in state: 5
 24/7 Wall St.
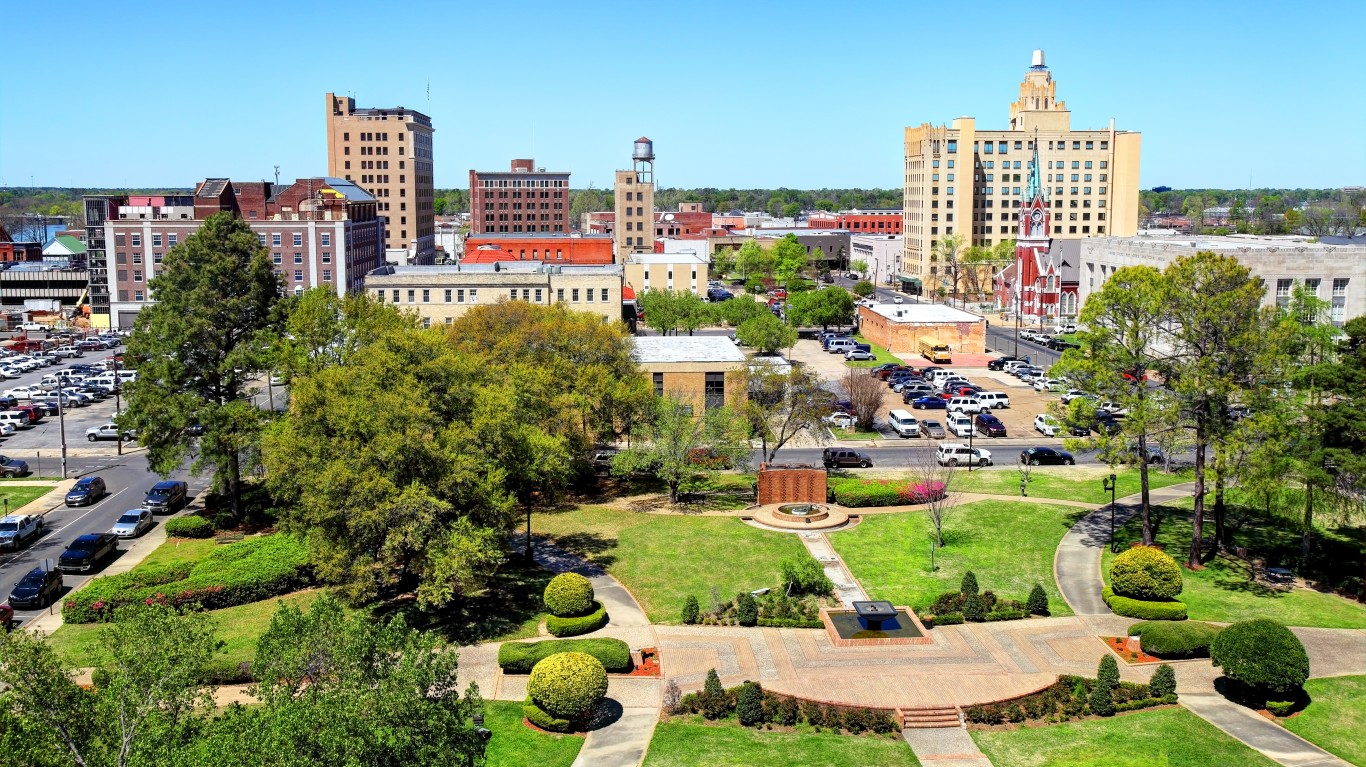
Source: DenisTangneyJr / iStock via Getty Images
Louisiana: Monroe
> Middle-income range: $31,493 – $56,223 (state: $56,295 – $88,426)
> Median household income: $45,001 (state: $52,087)
> Share of income earned by middle class: 14.0% (state: 14.0%)
> Share of income earned by wealthiest 5% of households: 22.3% (state: 23.2%)
> Adults with a bachelor’s degree or higher: 23.9% (state: 26.4%)
> Metro areas considered in state: 9
Source: DenisTangneyJr / iStock via Getty Images
Maine: Bangor
> Middle-income range: $43,354 – $70,831 (state: $65,032 – $96,596)
> Median household income: $56,250 (state: $64,767)
> Share of income earned by middle class: 15.3% (state: 14.9%)
> Share of income earned by wealthiest 5% of households: 18.8% (state: 22.9%)
> Adults with a bachelor’s degree or higher: 31.3% (state: 36.0%)
> Metro areas considered in state: 3
[in-text-ad-2]
Source: DenisTangneyJr / iStock via Getty Images
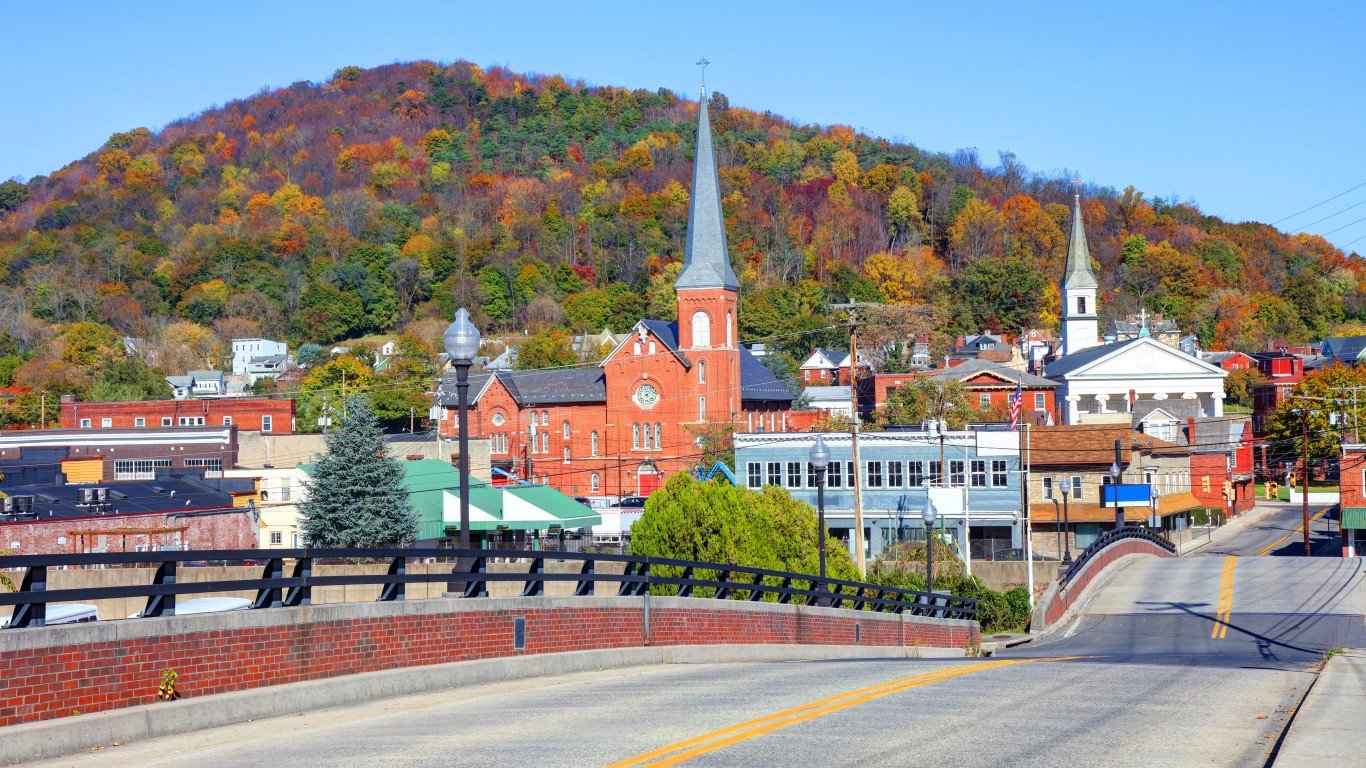
Maryland: Cumberland
> Middle-income range: $43,767 – $66,821 (state: $56,295 – $88,426)
> Median household income: $51,440 (state: $90,203)
> Share of income earned by middle class: 14.0% (state: 15.1%)
> Share of income earned by wealthiest 5% of households: 24.6% (state: 21.4%)
> Adults with a bachelor’s degree or higher: 22.8% (state: 42.5%)
> Metro areas considered in state: 5
Source: DenisTangneyJr / iStock via Getty Images
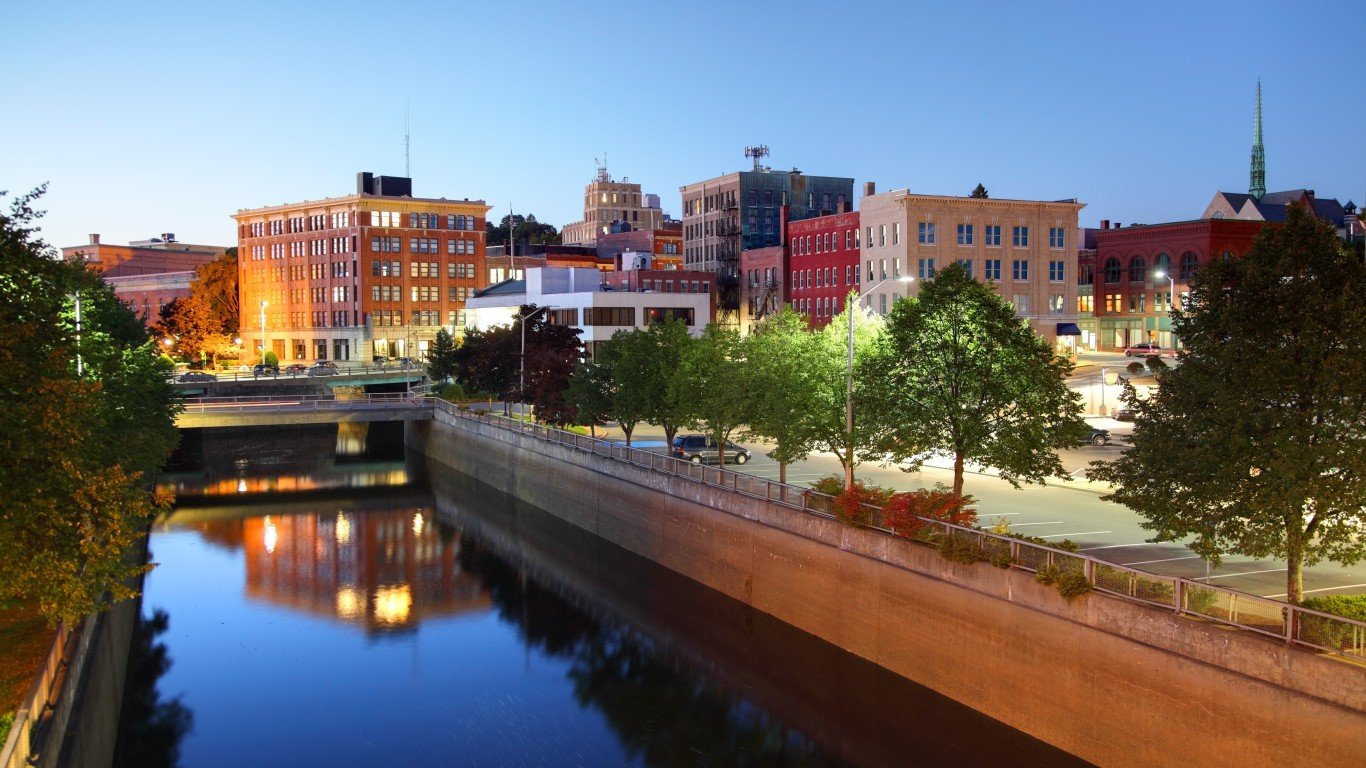
Massachusetts: Pittsfield
> Middle-income range: $48,013 – $75,760 (state: $44,235 – $69,505)
> Median household income: $60,749 (state: $89,645)
> Share of income earned by middle class: 12.7% (state: 14.5%)
> Share of income earned by wealthiest 5% of households: 27.0% (state: 22.7%)
> Adults with a bachelor’s degree or higher: 38.4% (state: 46.6%)
> Metro areas considered in state: 5
[in-text-ad]
Source: ehrlif / iStock Editorial via Getty Images
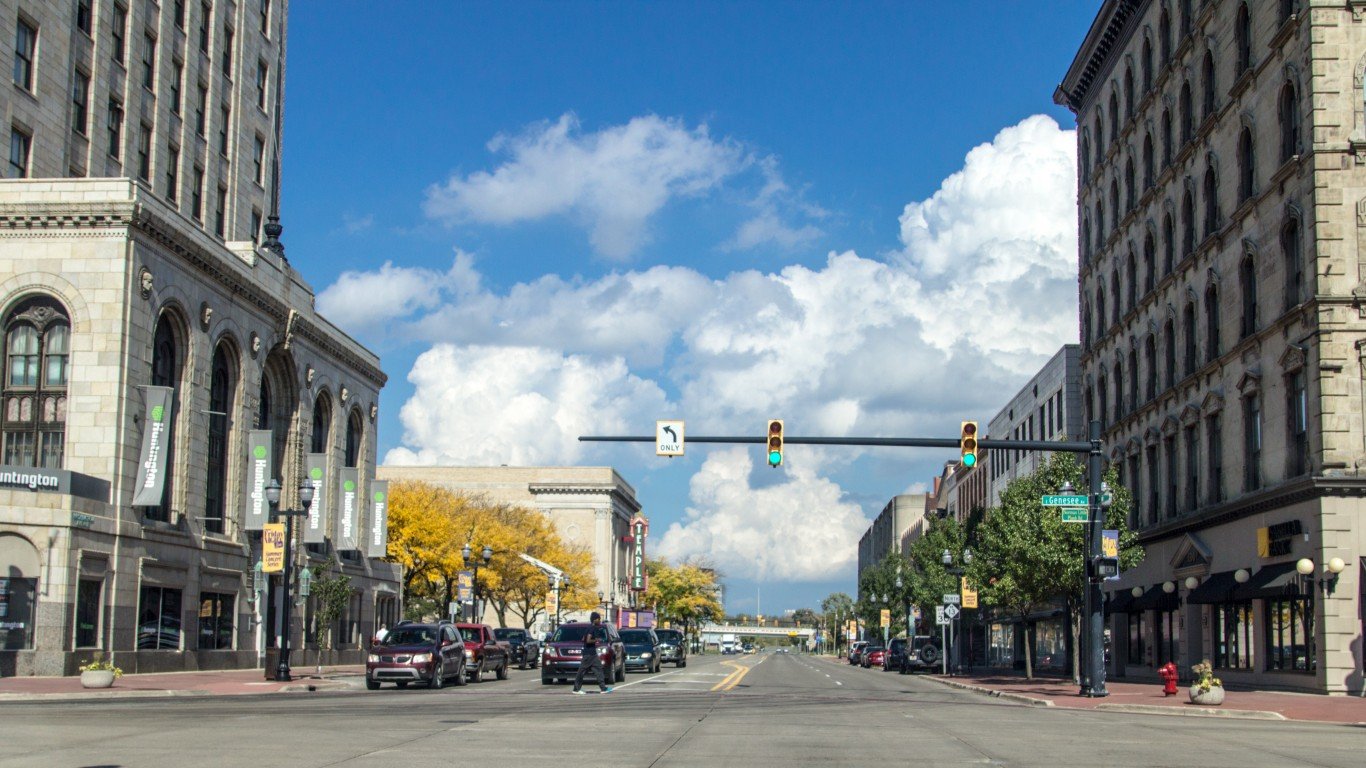
Michigan: Saginaw
> Middle-income range: $38,559 – $63,798 (state: $50,228 – $77,958)
> Median household income: $50,606 (state: $63,498)
> Share of income earned by middle class: 15.5% (state: 14.8%)
> Share of income earned by wealthiest 5% of households: 18.9% (state: 22.1%)
> Adults with a bachelor’s degree or higher: 22.5% (state: 31.7%)
> Metro areas considered in state: 14
 24/7 Wall St.
Source: LIKE HE / iStock via Getty Images
Minnesota: Duluth
> Middle-income range: $49,622 – $79,095 (state: $48,732 – $77,231)
> Median household income: $64,960 (state: $77,720)
> Share of income earned by middle class: 15.5% (state: 15.2%)
> Share of income earned by wealthiest 5% of households: 21.6% (state: 21.3%)
> Adults with a bachelor’s degree or higher: 30.9% (state: 38.9%)
> Metro areas considered in state: 5

Source: DenisTangneyJr / iStock via Getty Images
Mississippi: Hattiesburg
> Middle-income range: $41,805 – $66,642 (state: $52,379 – $83,764)
> Median household income: $55,444 (state: $48,716)
> Share of income earned by middle class: 13.9% (state: 14.4%)
> Share of income earned by wealthiest 5% of households: 25.4% (state: 22.1%)
> Adults with a bachelor’s degree or higher: 28.5% (state: 24.8%)
> Metro areas considered in state: 3
[in-text-ad-2]
Source: Public Domain / Wikimedia Commons
Missouri: Joplin
> Middle-income range: $43,428 – $65,889 (state: $66,612 – $105,995)
> Median household income: $55,045 (state: $61,847)
> Share of income earned by middle class: 15.0% (state: 14.6%)
> Share of income earned by wealthiest 5% of households: 22.1% (state: 22.9%)
> Adults with a bachelor’s degree or higher: 24.3% (state: 31.7%)
> Metro areas considered in state: 8

Source: leezsnow / iStock via Getty Images
Montana: Great Falls
> Middle-income range: $44,850 – $70,523 (state: $50,618 – $77,150)
> Median household income: $57,706 (state: $63,249)
> Share of income earned by middle class: 15.6% (state: 14.5%)
> Share of income earned by wealthiest 5% of households: 18.3% (state: 22.9%)
> Adults with a bachelor’s degree or higher: 27.4% (state: 34.8%)
> Metro areas considered in state: 3
[in-text-ad]
Source: Cheri Alguire / iStock Editorial via Getty Images
Nebraska: Grand Island
> Middle-income range: $50,686 – $76,558 (state: $56,320 – $89,984)
> Median household income: $61,749 (state: $66,817)
> Share of income earned by middle class: 14.7% (state: 15.1%)
> Share of income earned by wealthiest 5% of households: 24.9% (state: 21.9%)
> Adults with a bachelor’s degree or higher: 21.2% (state: 34.4%)
> Metro areas considered in state: 3
Source: DenisTangneyJr / iStock via Getty Images
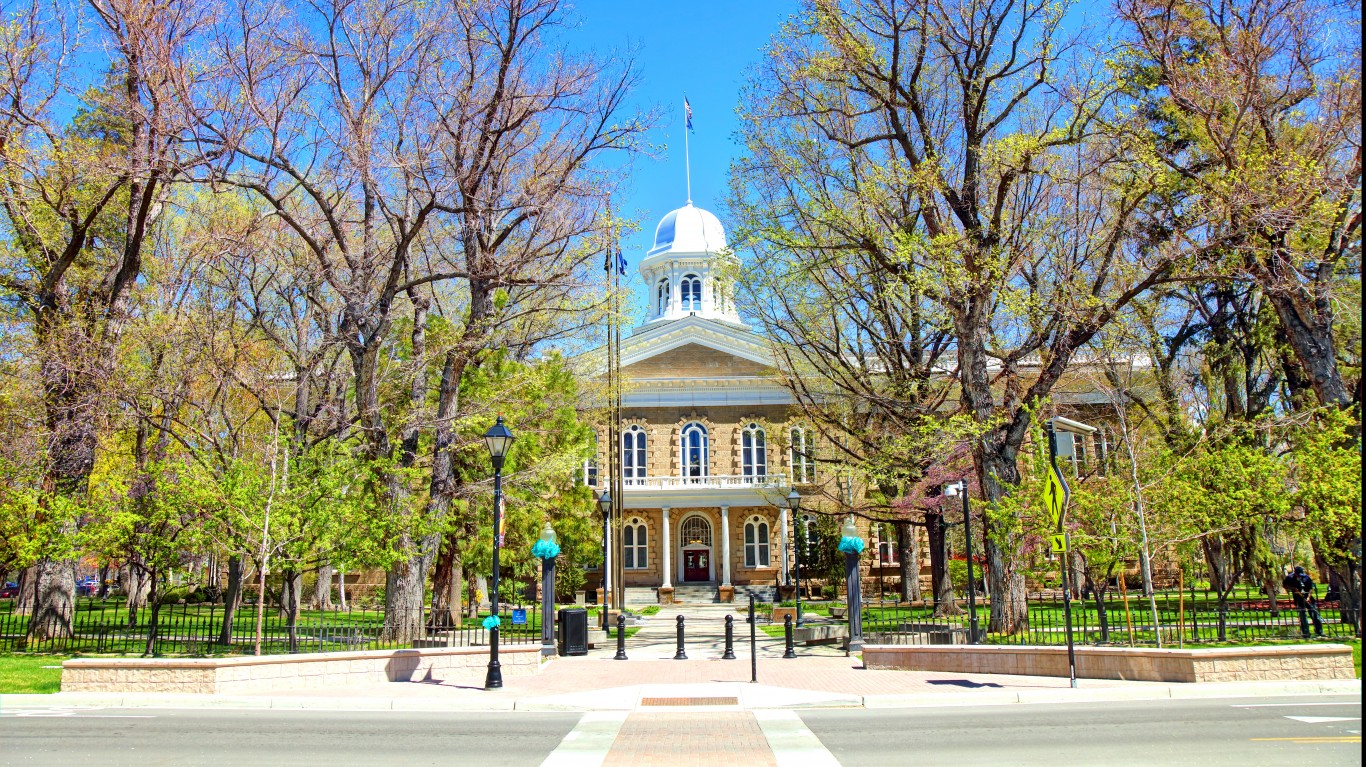
Nevada: Carson City
> Middle-income range: $49,917 – $77,620 (state: $49,218 – $77,486)
> Median household income: $65,330 (state: $66,274)
> Share of income earned by middle class: 16.0% (state: 14.8%)
> Share of income earned by wealthiest 5% of households: 18.6% (state: 22.4%)
> Adults with a bachelor’s degree or higher: 25.5% (state: 27.6%)
> Metro areas considered in state: 3

Source: Sean Pavone / iStock via Getty Images
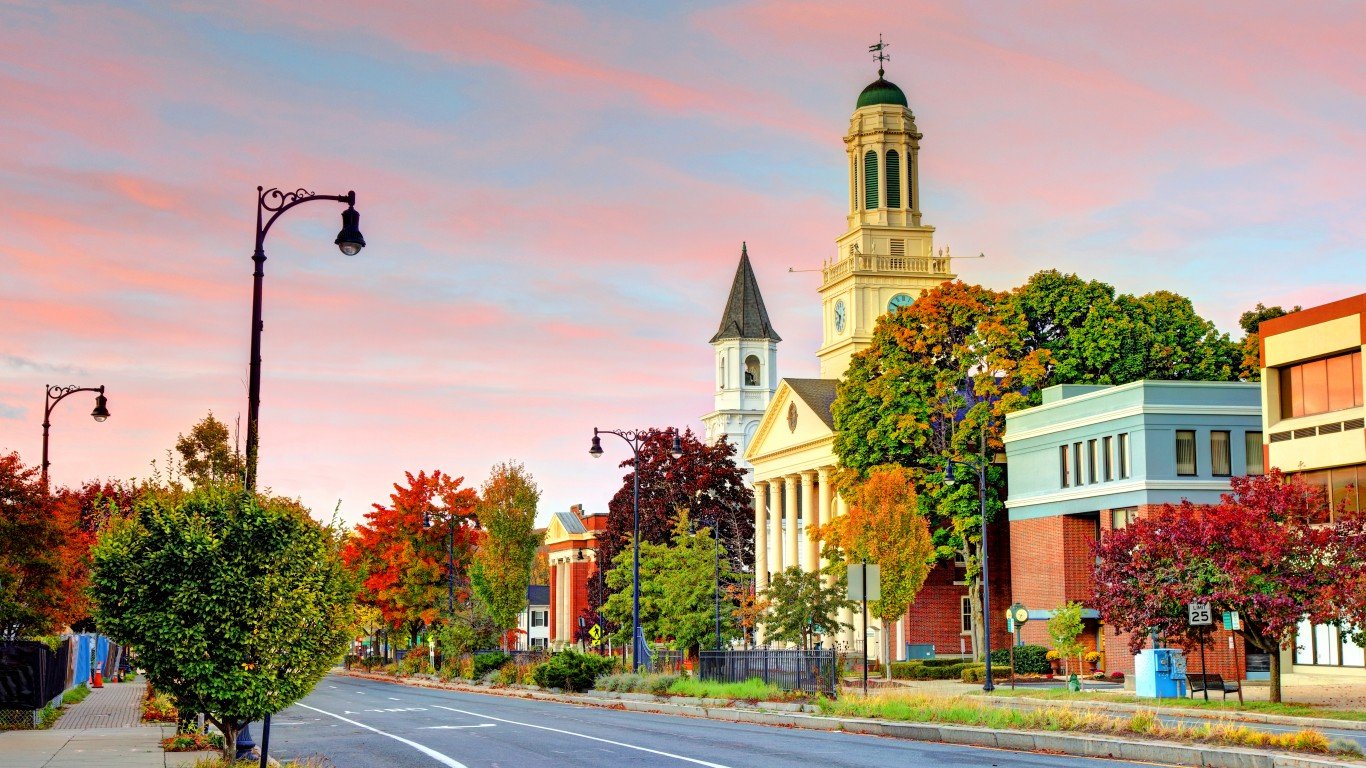
New Hampshire: Manchester-Nashua
> Middle-income range: $73,687 – $108,394 (state: $50,618 – $77,150)
> Median household income: $91,627 (state: $88,465)
> Share of income earned by middle class: 15.6% (state: 15.8%)
> Share of income earned by wealthiest 5% of households: 20.8% (state: 20.2%)
> Adults with a bachelor’s degree or higher: 41.4% (state: 40.2%)
> Metro areas considered in state: 1
Because Manchester is the only metro area with available data in New Hampshire, it ranks as having the poorest middle class by default.
[in-text-ad-2]

Source: Ultima_Gaina / iStock via Getty Images
New Jersey: Vineland-Bridgeton
> Middle-income range: $46,988 – $73,239 (state: $66,612 – $105,995)
> Median household income: $58,389 (state: $89,296)
> Share of income earned by middle class: 14.6% (state: 14.4%)
> Share of income earned by wealthiest 5% of households: 21.2% (state: 22.9%)
> Adults with a bachelor’s degree or higher: 18.3% (state: 43.1%)
> Metro areas considered in state: 4
Source: SWCargill / iStock via Getty Images
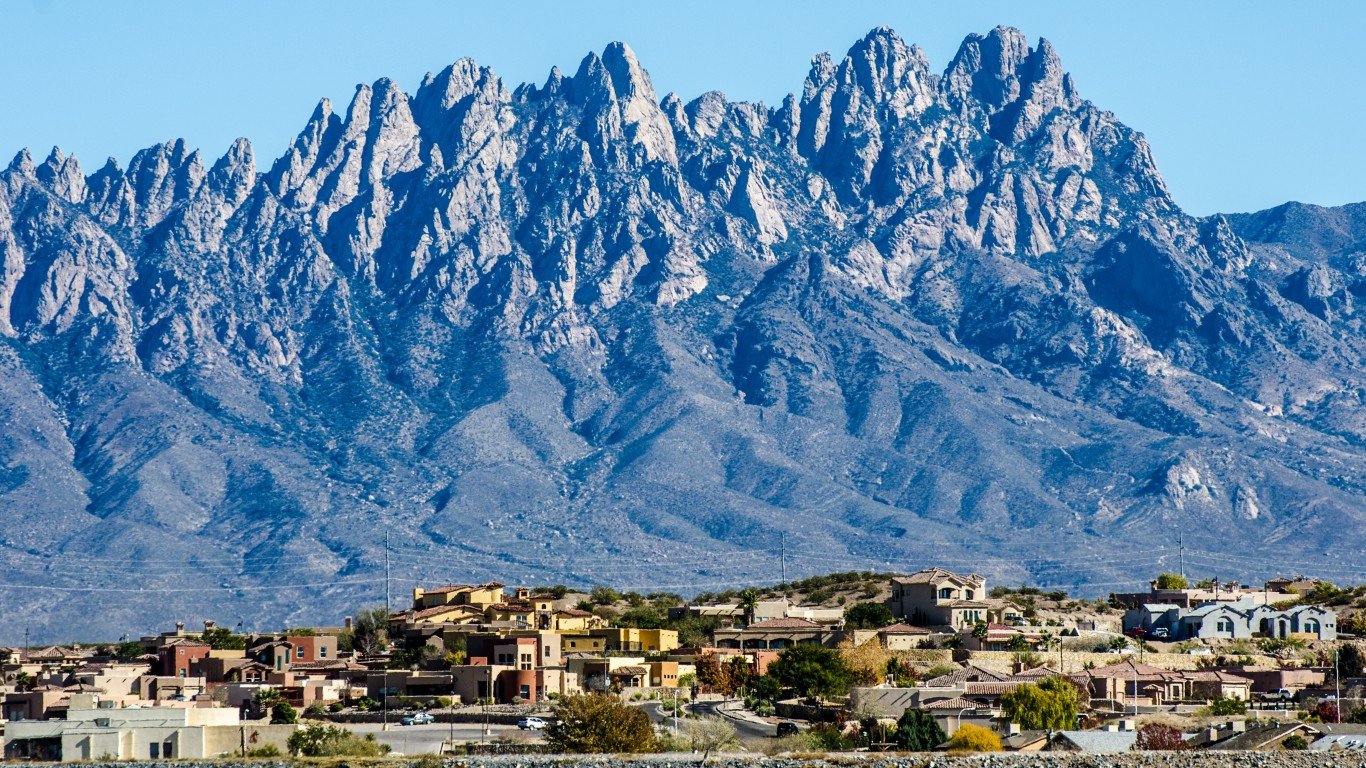
New Mexico: Las Cruces
> Middle-income range: $35,794 – $57,491 (state: $63,308 – $101,711)
> Median household income: $45,178 (state: $53,992)
> Share of income earned by middle class: 13.6% (state: 14.3%)
> Share of income earned by wealthiest 5% of households: 21.7% (state: 22.3%)
> Adults with a bachelor’s degree or higher: 30.1% (state: 30.1%)
> Metro areas considered in state: 4
[in-text-ad]

New York: Watertown-Fort Drum
> Middle-income range: $51,913 – $71,893 (state: $41,926 – $68,599)
> Median household income: $60,398 (state: $74,314)
> Share of income earned by middle class: 15.4% (state: 13.6%)
> Share of income earned by wealthiest 5% of households: 20.1% (state: 25.3%)
> Adults with a bachelor’s degree or higher: 29.6% (state: 39.9%)
> Metro areas considered in state: 13
Source: CRobertson / iStock Editorial via Getty Images
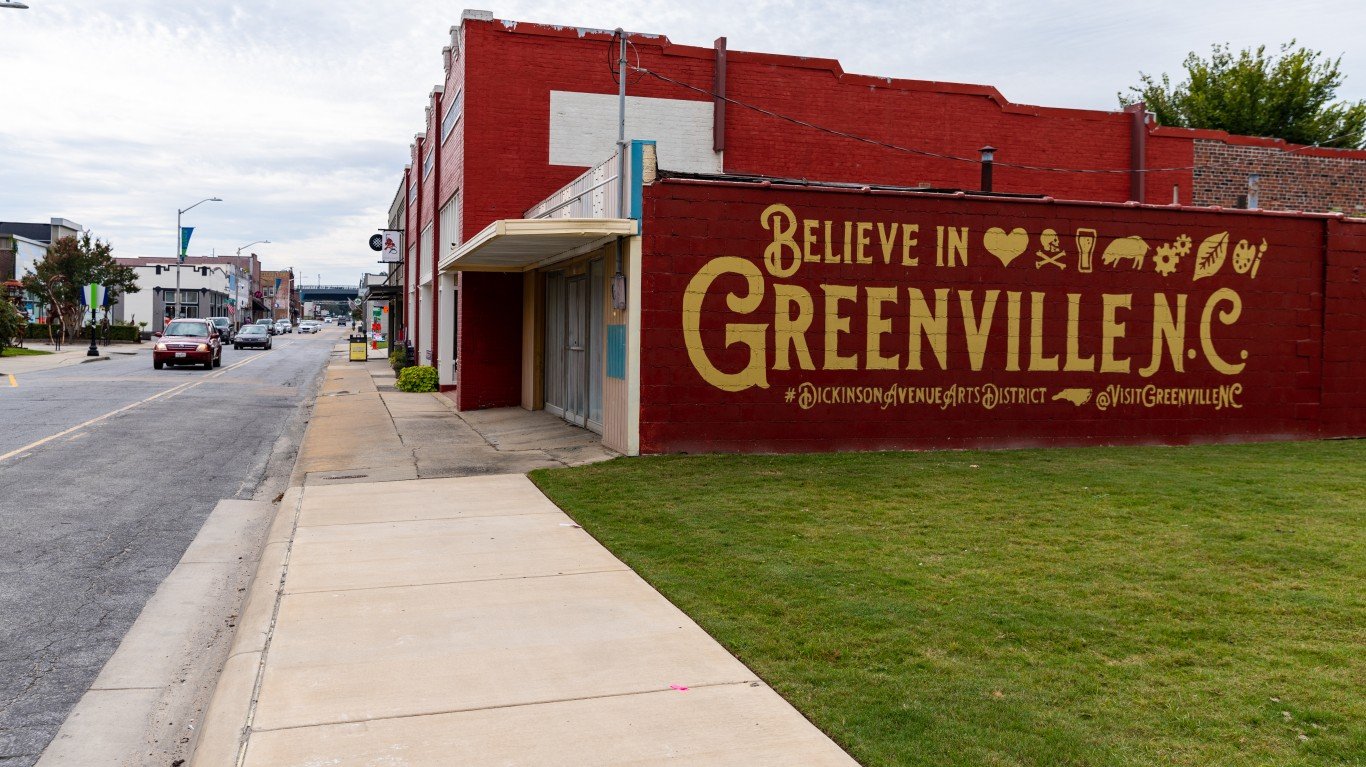
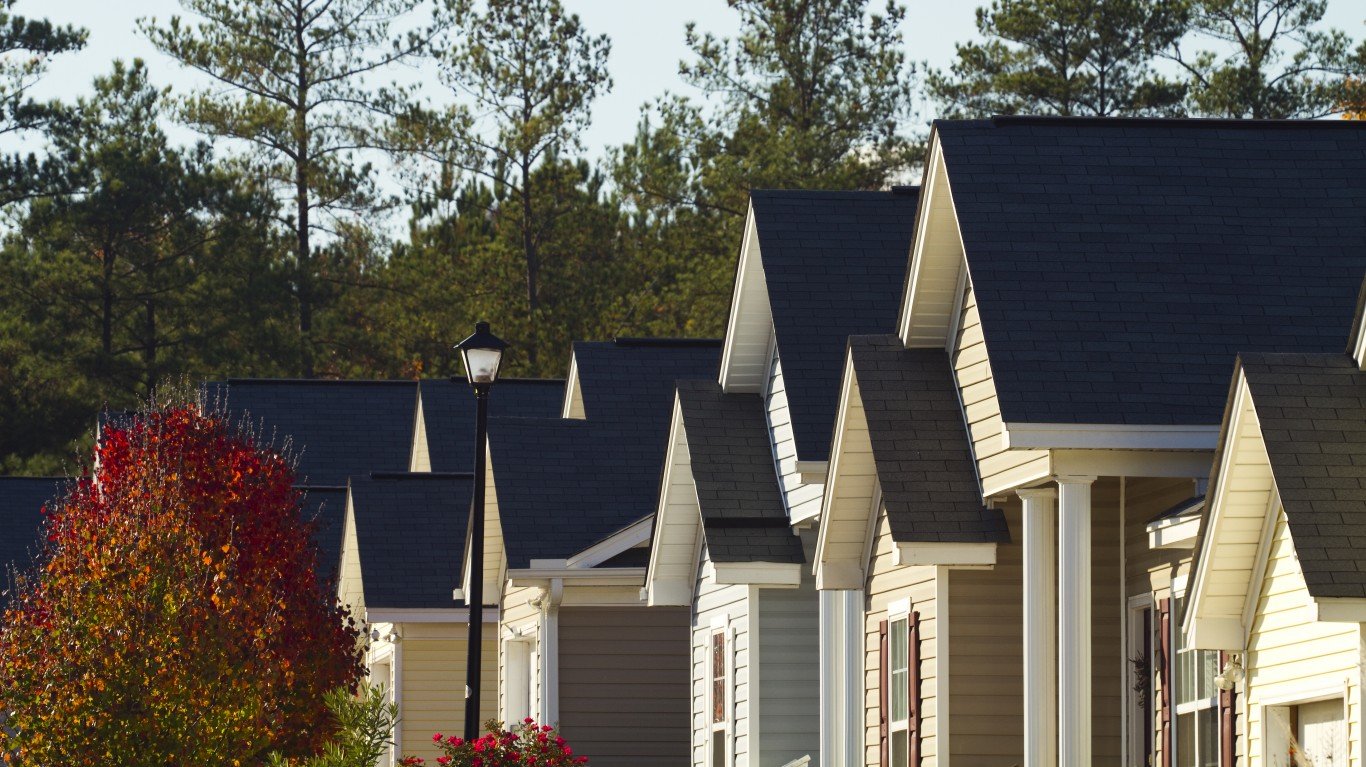
North Carolina: Greenville
> Middle-income range: $34,127 – $60,854 (state: $53,802 – $82,323)
> Median household income: $44,450 (state: $61,972)
> Share of income earned by middle class: 13.7% (state: 14.4%)
> Share of income earned by wealthiest 5% of households: 22.9% (state: 23.1%)
> Adults with a bachelor’s degree or higher: 33.6% (state: 34.9%)
> Metro areas considered in state: 15
Source: DenisTangneyJr / iStock via Getty Images
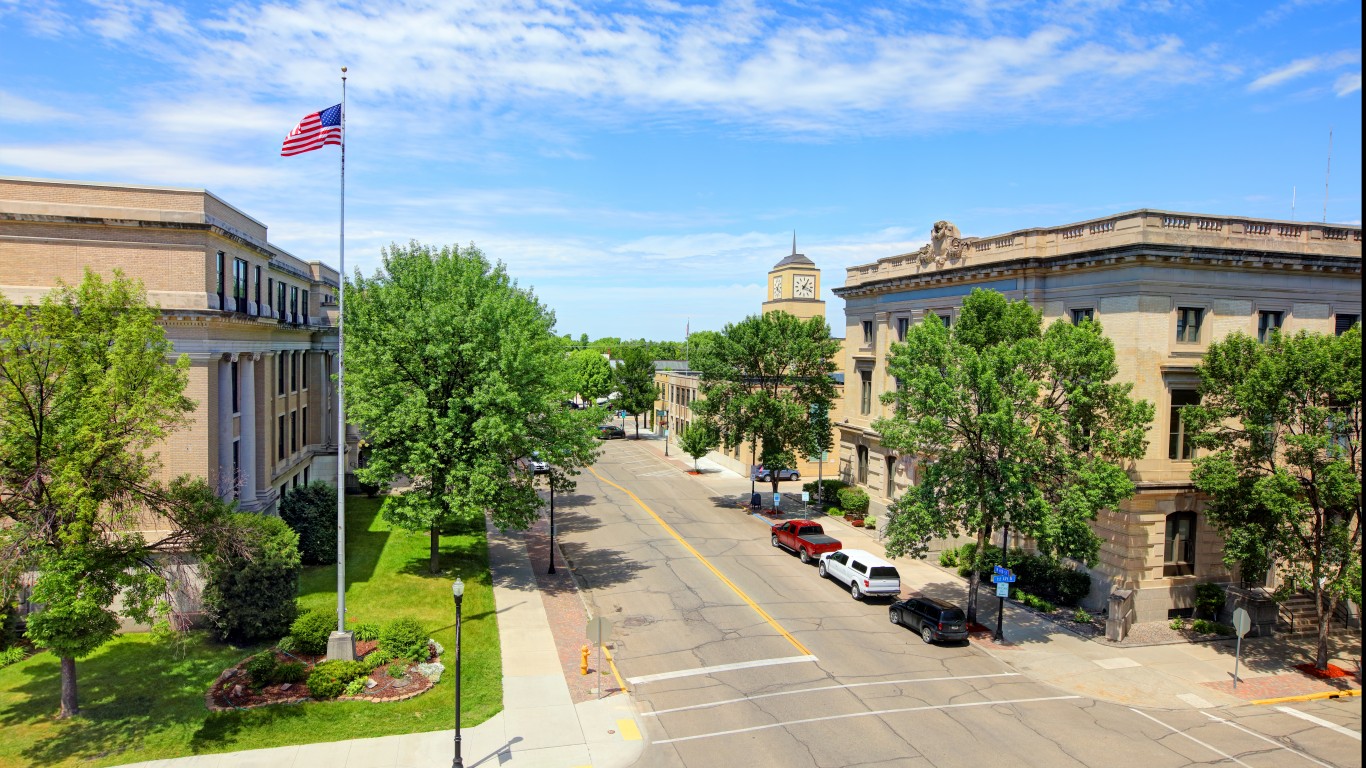
North Dakota: Grand Forks
> Middle-income range: $49,819 – $79,449 (state: $50,200 – $78,317)
> Median household income: $62,568 (state: $66,519)
> Share of income earned by middle class: 15.9% (state: 15.4%)
> Share of income earned by wealthiest 5% of households: 20.5% (state: 21.3%)
> Adults with a bachelor’s degree or higher: 33.1% (state: 31.7%)
> Metro areas considered in state: 3
[in-text-ad-2]

Ohio: Mansfield
> Middle-income range: $40,266 – $62,272 (state: $66,968 – $104,584)
> Median household income: $51,158 (state: $62,262)
> Share of income earned by middle class: 14.6% (state: 14.8%)
> Share of income earned by wealthiest 5% of households: 23.9% (state: 22.3%)
> Adults with a bachelor’s degree or higher: 17.4% (state: 30.7%)
> Metro areas considered in state: 11

Source: DenisTangneyJr / iStock via Getty Images
Oklahoma: Lawton
> Middle-income range: $39,460 – $62,236 (state: $56,948 – $94,304)
> Median household income: $49,422 (state: $55,826)
> Share of income earned by middle class: 15.1% (state: 14.9%)
> Share of income earned by wealthiest 5% of households: 20.8% (state: 21.2%)
> Adults with a bachelor’s degree or higher: 24.3% (state: 27.9%)
> Metro areas considered in state: 4
[in-text-ad]

Oregon: Grants Pass
> Middle-income range: $38,208 – $61,038 (state: $39,906 – $65,189)
> Median household income: $48,785 (state: $71,562)
> Share of income earned by middle class: 14.1% (state: 15.0%)
> Share of income earned by wealthiest 5% of households: 21.6% (state: 21.4%)
> Adults with a bachelor’s degree or higher: 21.0% (state: 36.3%)
> Metro areas considered in state: 8
 24/7 Wall St.
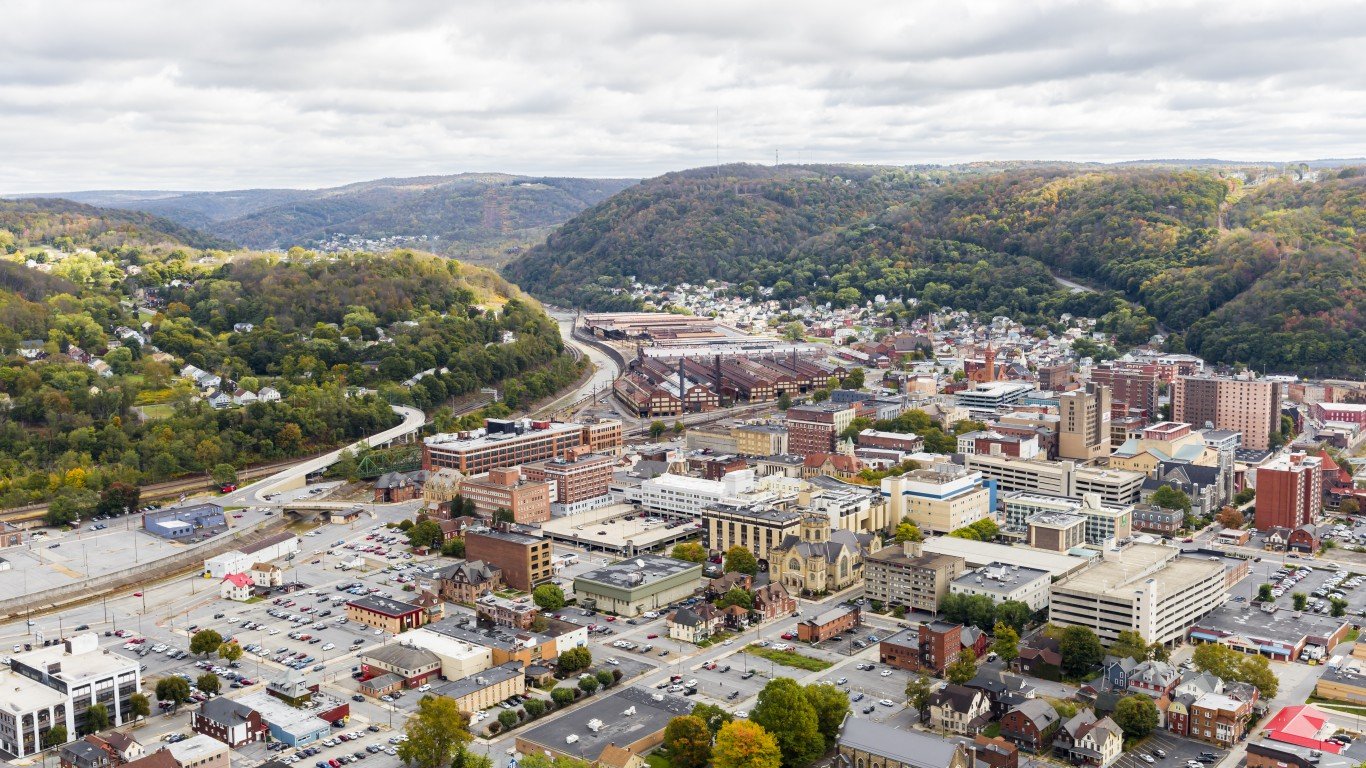
Source: WilliamSherman / iStock via Getty Images
Pennsylvania: Johnstown
> Middle-income range: $41,576 – $67,910 (state: $66,968 – $104,584)
> Median household income: $52,995 (state: $68,957)
> Share of income earned by middle class: 14.4% (state: 14.7%)
> Share of income earned by wealthiest 5% of households: 24.8% (state: 22.2%)
> Adults with a bachelor’s degree or higher: 23.4% (state: 34.5%)
> Metro areas considered in state: 18

Source: SeanPavonePhoto / iStock via Getty Images
Rhode Island: Providence-Warwick
> Middle-income range: $57,443 – $93,753 (state: $50,200 – $78,317)
> Median household income: $73,788 (state: $74,008)
> Share of income earned by middle class: 15.2% (state: 15.0%)
> Share of income earned by wealthiest 5% of households: 20.6% (state: 21.2%)
> Adults with a bachelor’s degree or higher: 34.1% (state: 36.5%)
> Metro areas considered in state: 1
Because Providence is the only metro area with available data in Rhode Island, it ranks as having the poorest middle class by default.
[in-text-ad-2]

South Carolina: Sumter
> Middle-income range: $32,605 – $54,036 (state: $50,200 – $78,317)
> Median household income: $43,210 (state: $59,318)
> Share of income earned by middle class: 14.9% (state: 14.6%)
> Share of income earned by wealthiest 5% of households: 20.3% (state: 22.8%)
> Adults with a bachelor’s degree or higher: 22.0% (state: 31.5%)
> Metro areas considered in state: 8
Source: EunikaSopotnicka / iStock via Getty Images
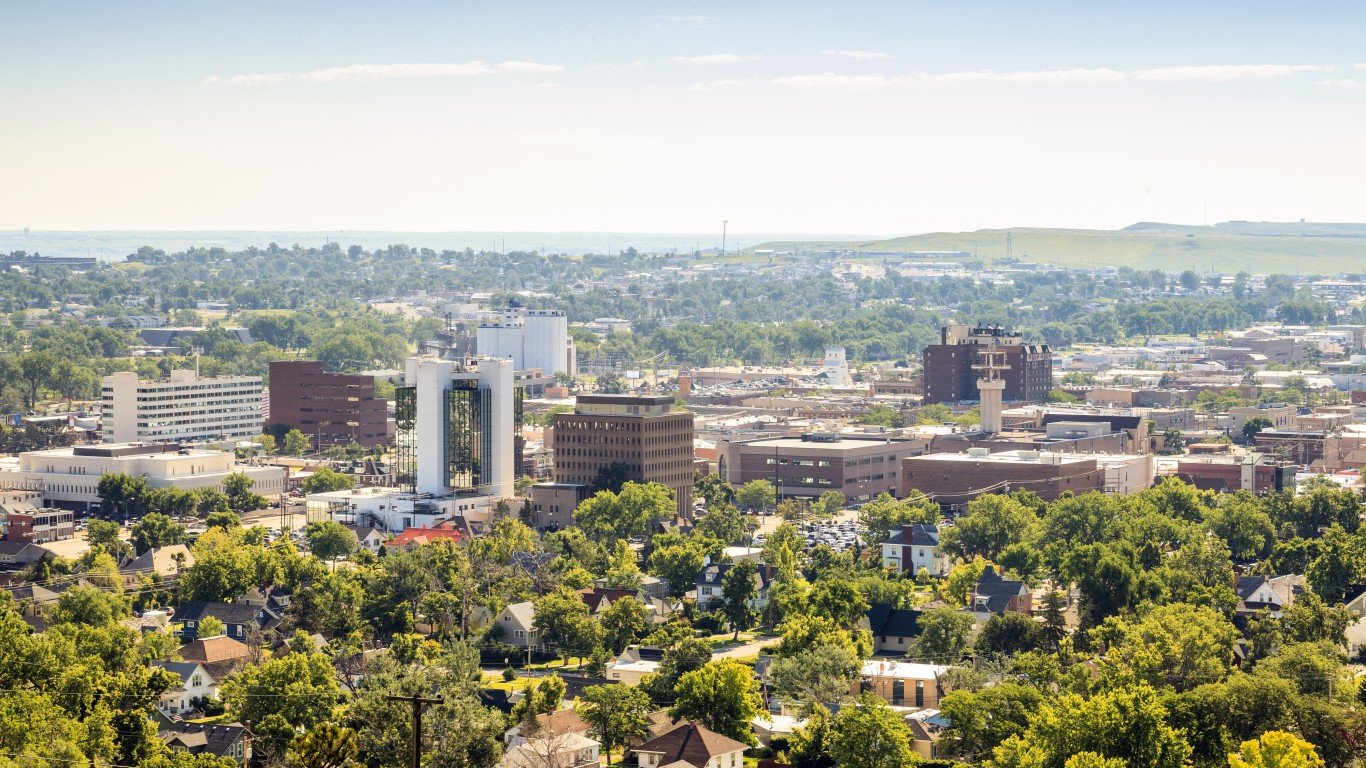
South Dakota: Rapid City
> Middle-income range: $51,138 – $74,901 (state: $39,906 – $65,189)
> Median household income: $63,342 (state: $66,143)
> Share of income earned by middle class: 15.6% (state: 15.3%)
> Share of income earned by wealthiest 5% of households: 20.7% (state: 23.0%)
> Adults with a bachelor’s degree or higher: 34.6% (state: 31.7%)
> Metro areas considered in state: 2
[in-text-ad]
Source: Dee / iStock Editorial via Getty Images
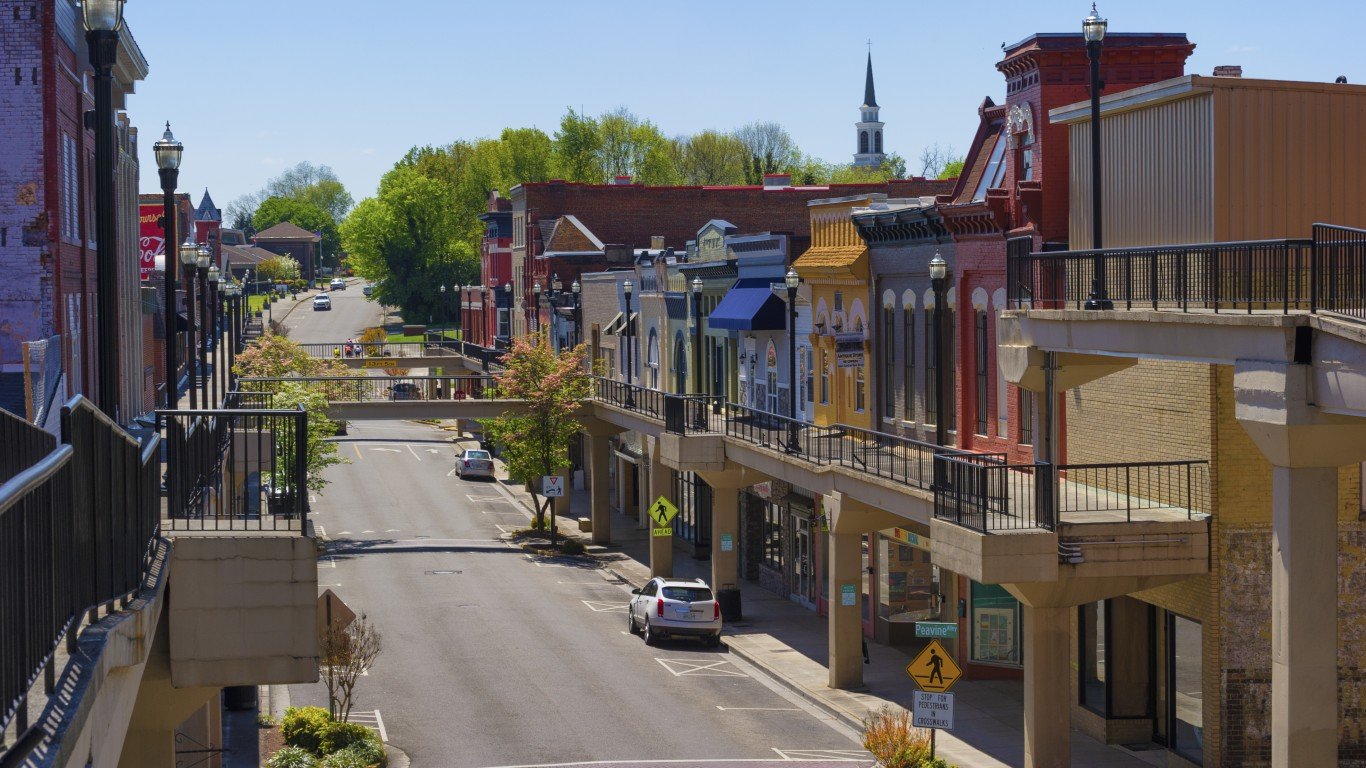
Tennessee: Morristown
> Middle-income range: $33,595 – $54,763 (state: $48,732 – $77,231)
> Median household income: $43,213 (state: $59,695)
> Share of income earned by middle class: 14.0% (state: 14.3%)
> Share of income earned by wealthiest 5% of households: 22.6% (state: 23.9%)
> Adults with a bachelor’s degree or higher: 18.2% (state: 30.5%)
> Metro areas considered in state: 10
Source: tirc83 / iStock Unreleased via Getty Images
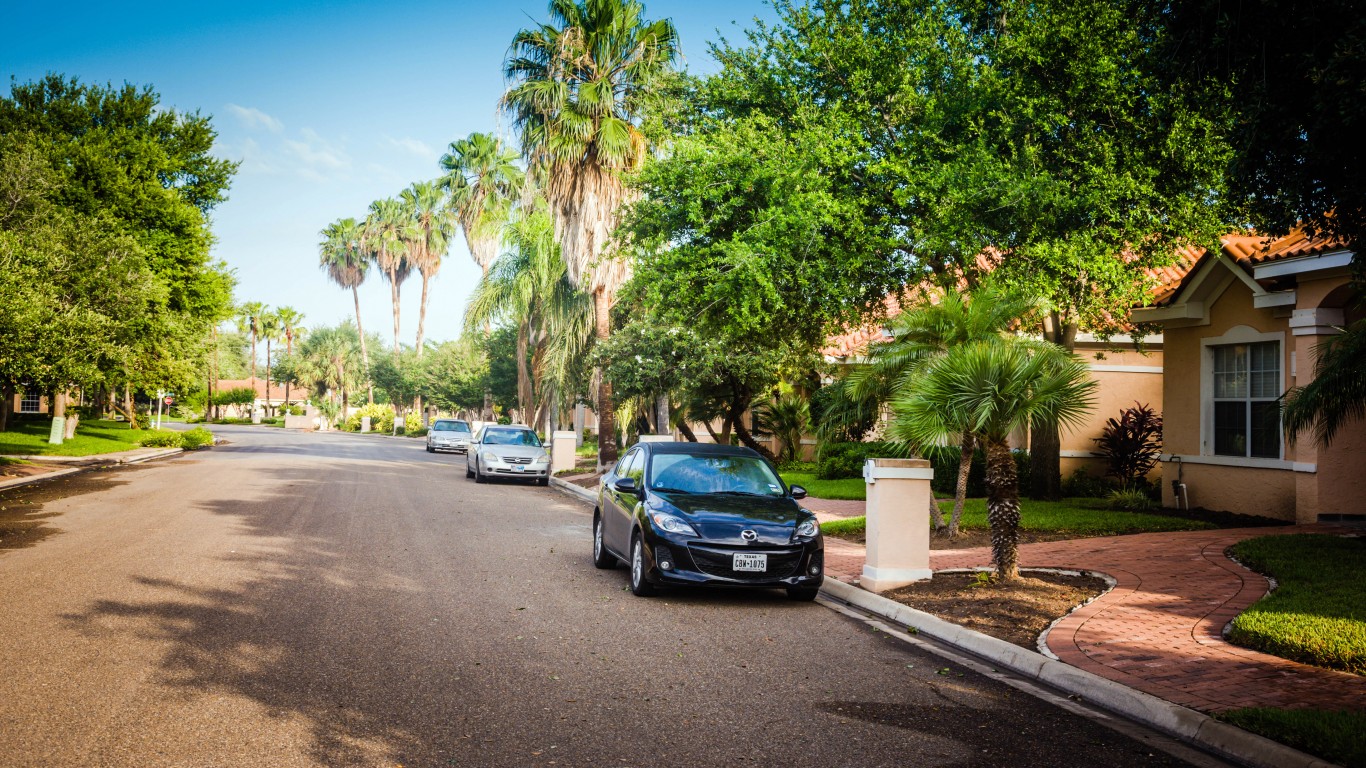
Texas: McAllen-Edinburg-Mission
> Middle-income range: $33,517 – $57,357 (state: $40,459 – $66,840)
> Median household income: $44,818 (state: $66,963)
> Share of income earned by middle class: 14.8% (state: 14.4%)
> Share of income earned by wealthiest 5% of households: 20.2% (state: 22.8%)
> Adults with a bachelor’s degree or higher: 20.0% (state: 33.1%)
> Metro areas considered in state: 25
Source: DenisTangneyJr / iStock via Getty Images
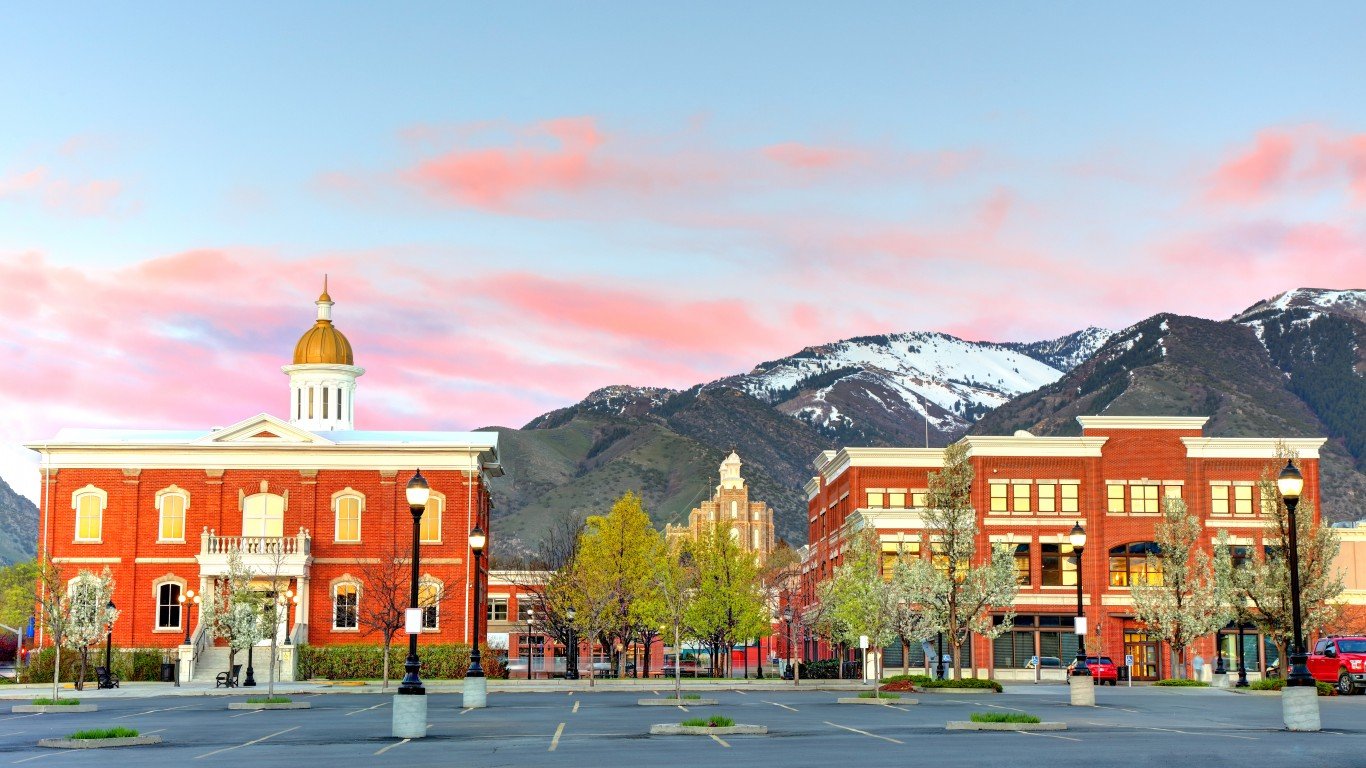
Utah: Logan
> Middle-income range: $53,402 – $79,926 (state: $48,960 – $76,524)
> Median household income: $67,022 (state: $79,449)
> Share of income earned by middle class: 14.9% (state: 15.2%)
> Share of income earned by wealthiest 5% of households: 23.1% (state: 22.0%)
> Adults with a bachelor’s degree or higher: 37.9% (state: 36.8%)
> Metro areas considered in state: 5
[in-text-ad-2]
Source: halbergman / iStock via Getty Images
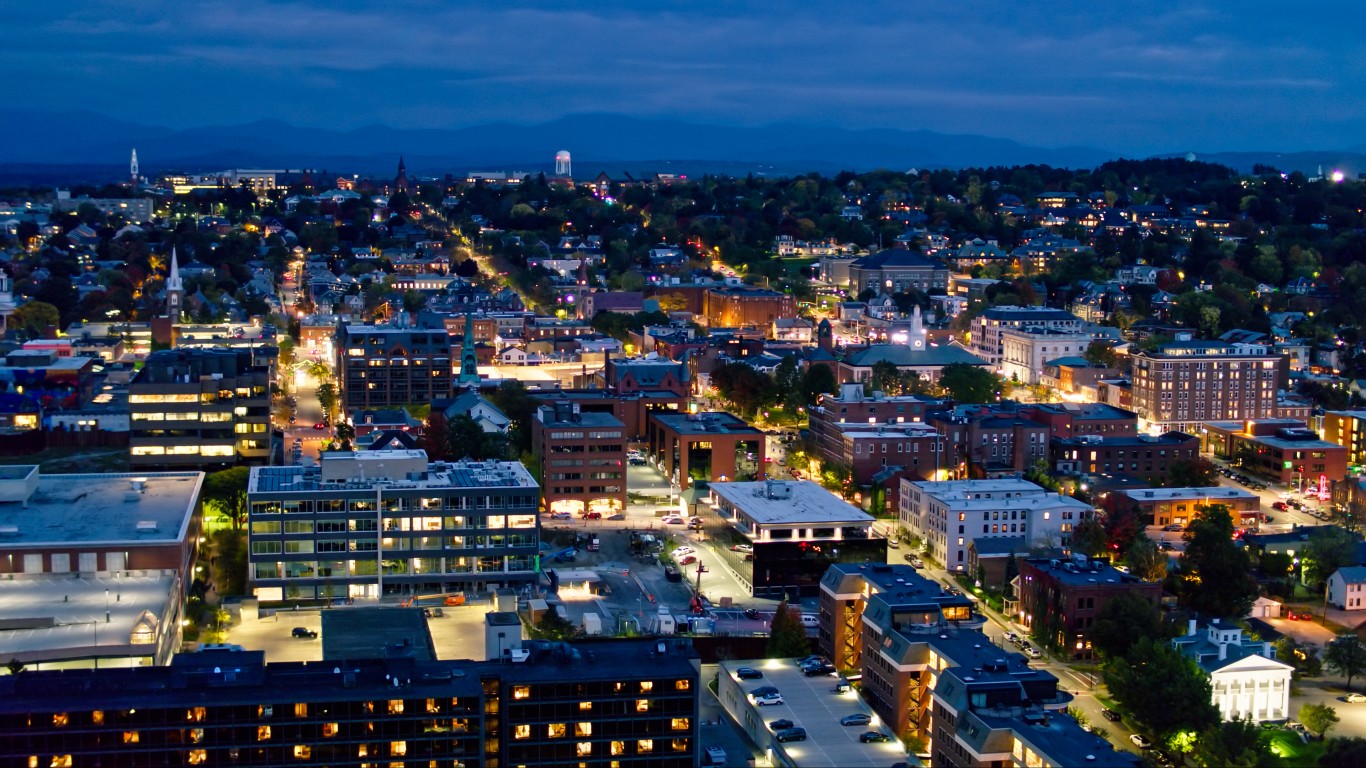
Vermont: Burlington-South Burlington
> Middle-income range: $65,505 – $98,761 (state: $50,618 – $77,150)
> Median household income: $81,852 (state: $72,431)
> Share of income earned by middle class: 15.4% (state: 15.3%)
> Share of income earned by wealthiest 5% of households: 20.1% (state: 21.0%)
> Adults with a bachelor’s degree or higher: 51.0% (state: 44.4%)
> Metro areas considered in state: 1
Because Burlington is the only metro area with available data in Vermont, it ranks as having the poorest middle class by default.

Virginia: Blacksburg-Christiansburg
> Middle-income range: $40,505 – $67,927 (state: $52,300 – $80,974)
> Median household income: $54,737 (state: $80,963)
> Share of income earned by middle class: 15.1% (state: 14.7%)
> Share of income earned by wealthiest 5% of households: 22.4% (state: 21.7%)
> Adults with a bachelor’s degree or higher: 36.2% (state: 41.8%)
> Metro areas considered in state: 9
[in-text-ad]

Source: BehindTheLens / E+ via Getty Images
Washington: Yakima
> Middle-income range: $47,274 – $71,885 (state: $39,906 – $65,189)
> Median household income: $61,012 (state: $84,247)
> Share of income earned by middle class: 16.6% (state: 14.6%)
> Share of income earned by wealthiest 5% of households: 16.6% (state: 22.4%)
> Adults with a bachelor’s degree or higher: 18.4% (state: 39.0%)
> Metro areas considered in state: 11

Source: hkim39 / iStock via Getty Images
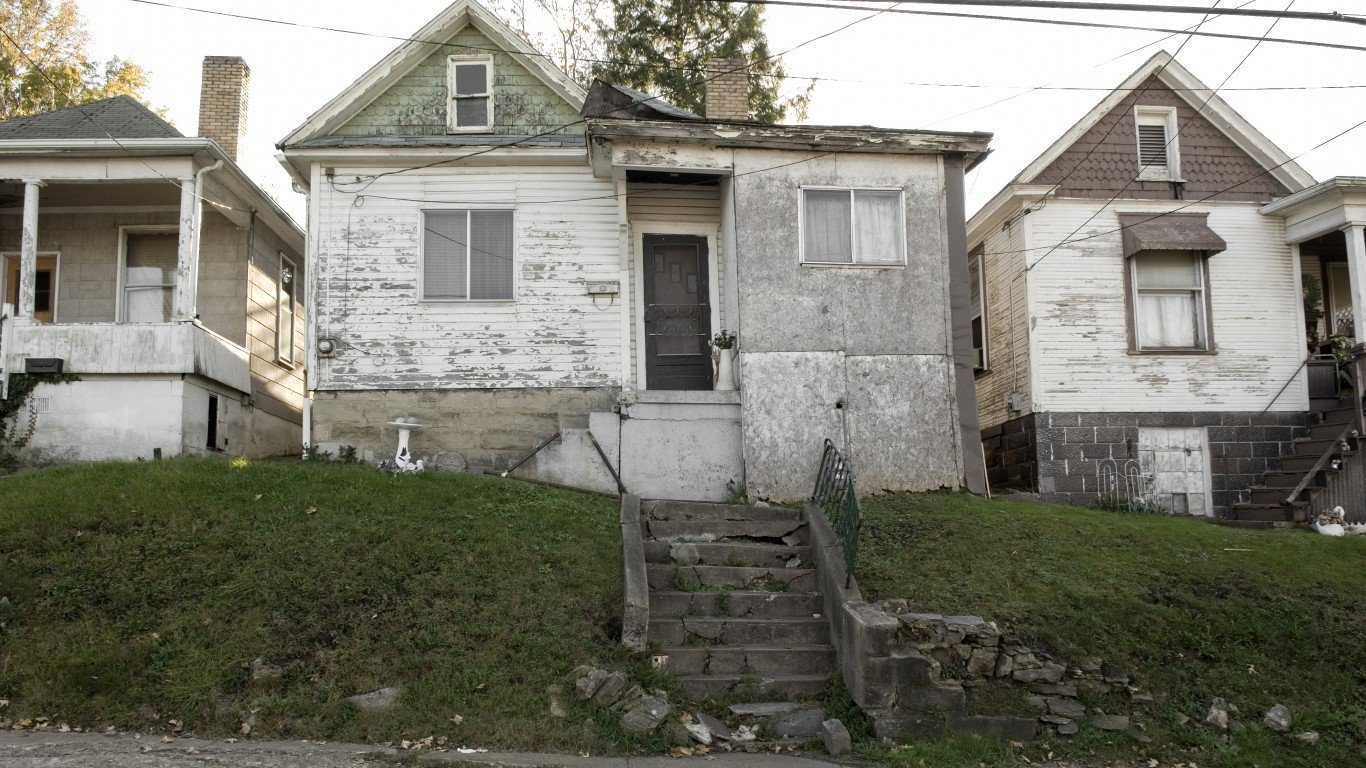
West Virginia: Beckley
> Middle-income range: $32,271 – $54,189 (state: $53,713 – $85,848)
> Median household income: $38,737 (state: $51,248)
> Share of income earned by middle class: 14.1% (state: 14.3%)
> Share of income earned by wealthiest 5% of households: 22.3% (state: 23.4%)
> Adults with a bachelor’s degree or higher: 20.4% (state: 24.1%)
> Metro areas considered in state: 7

Source: William Reagan / iStock via Getty Images
Wisconsin: Eau Claire
> Middle-income range: $51,278 – $75,548 (state: $37,564 – $62,640)
> Median household income: $61,684 (state: $67,125)
> Share of income earned by middle class: 15.5% (state: 15.3%)
> Share of income earned by wealthiest 5% of households: 20.4% (state: 21.2%)
> Adults with a bachelor’s degree or higher: 29.4% (state: 32.5%)
> Metro areas considered in state: 12
[in-text-ad-2]
Source: DenisTangneyJr / E+ via Getty Images
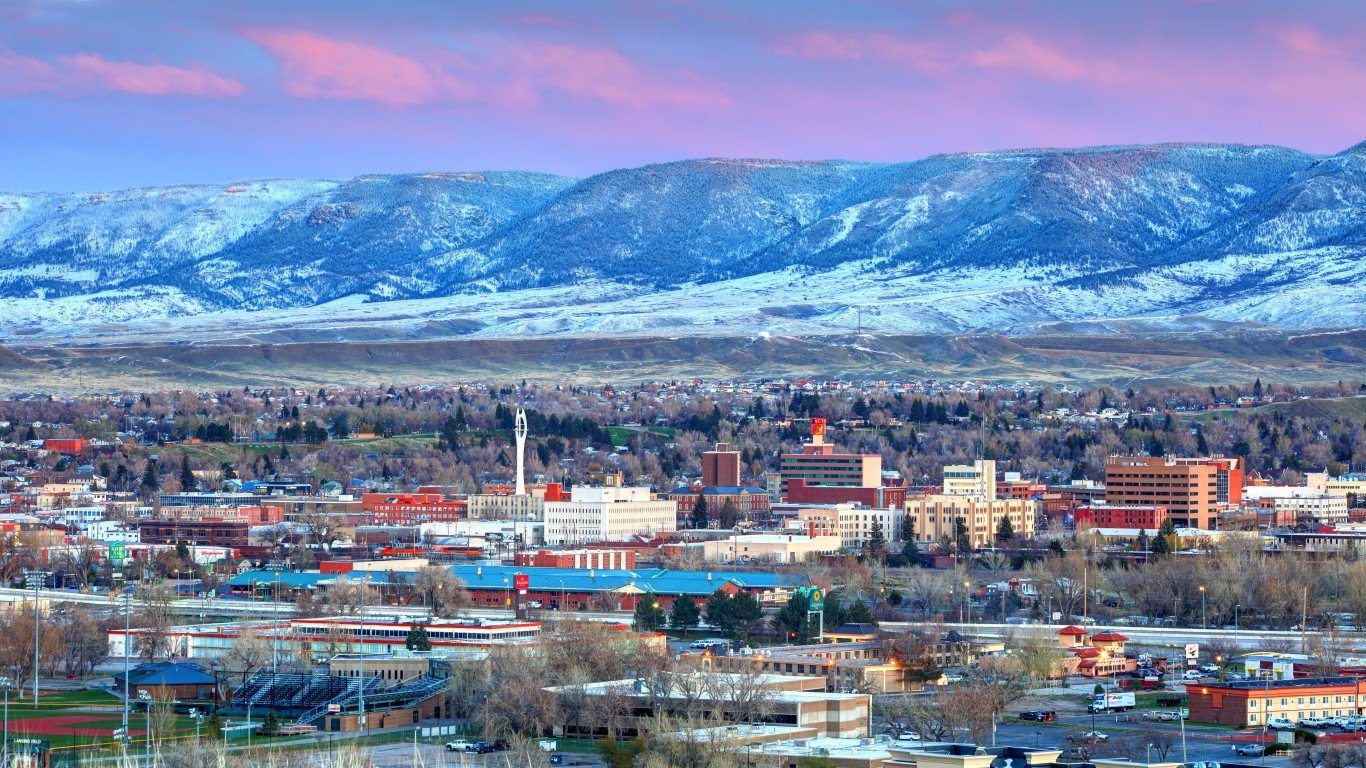
Wyoming: Casper
> Middle-income range: $51,001 – $75,905 (state: $52,295 – $82,996)
> Median household income: $63,605 (state: $65,204)
> Share of income earned by middle class: 15.4% (state: 15.1%)
> Share of income earned by wealthiest 5% of households: 23.8% (state: 22.9%)
> Adults with a bachelor’s degree or higher: 27.7% (state: 29.2%)
> Metro areas considered in state: 2
Methodology
To identify the city in every state with the weakest middle class, 24/7 Wall St. reviewed metro area level data from the U.S. Census Bureau’s 2021 American Community Survey. For each of the 384 U.S. metro areas with available data, we reviewed the income range of the middle 20% earners at the household level. In each state, the metro area with the lowest ceiling for the middle quintile of earners ranks as having the poorest middle class.
It is important to note that Delaware, New Hampshire, Rhode Island, and Vermont are each home to only one metro area. As a result, the city listed for each of these states ranks as having the poorest middle class by default only.
Population figures, as well as supplementary data on the share of income earned by the middle 20% of households by earnings, the share of income earned by the highest earning 5% of households, median household income, and adults with a bachelor’s degree or higher are also from the 2021 ACS.
Sponsored: Want to Retire Early? Start Here
Want retirement to come a few years earlier than you’d planned? Orare you ready to retire now, but want an extra set of eyes on your finances?
Now you can speak with up to 3 financial experts in your area for FREE. By simply clicking here you can begin to match with financial professionals who can help you build your plan to retire early. And the best part? The first conversation with them is free.
Click here to match with up to 3 financial pros who would be excited to help you make financial decisions.
Thank you for reading! Have some feedback for us?
Contact the 24/7 Wall St. editorial team.
Editors' Picks