Expanding military expenditure in support of U.S. foreign policy objectives goes back to, at least, President Teddy Roosevelt’s Big Stick policy. While U.S. military expenditure has declined in some years, it has generally steadily increased to the current record levels, surpassing not just previous years levels but also expenditure levels of all other countries. (Here is how the world’s top military spenders compare to the U.S.)
To identify what the U.S. spent on the military the year you were born, 24/7 Wall St. reviewed data on U.S. military spending from the Stockholm International Peace Research Institute Military Expenditure Database, listing the years 1970-2022. Figures are in current U.S. dollars. We also calculated the percentage change in military spending from the previous year.
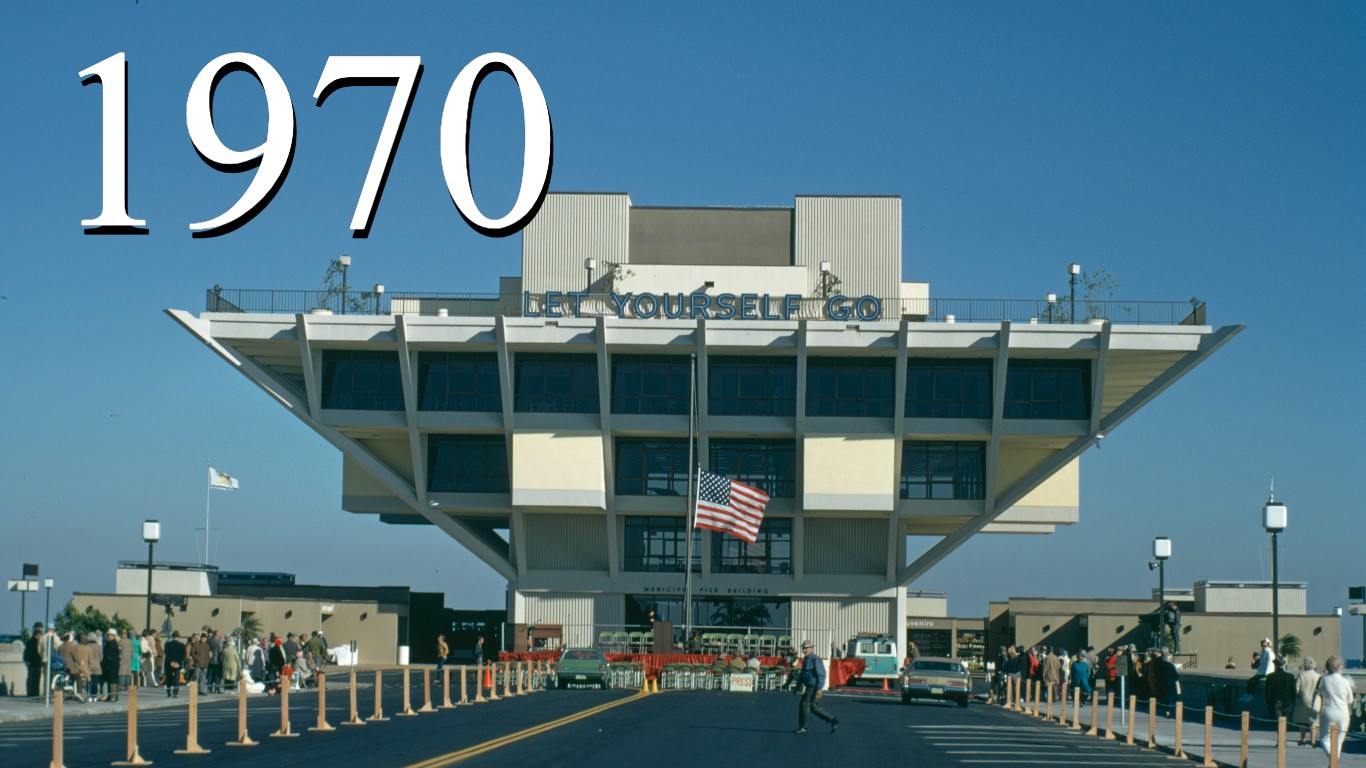
In 1970, during the height of the Vietnam War, the U.S. military budget had risen to more than $80 billion, a more than 50% increase from 1965, when the U.S. first sent troops into the Southeast Asian nation.
After the Vietnam War, expenditures continued to steadily increase, and by the early 1980s, military spending accelerated significantly. This surge came under President Ronald Reagan, practically tripling military expenditures of the Vietnam era.
In the years following the Cold War, during an era of relative peace, defense spending declined. The turning point was the terrorist attack of Sept. 11, 2001, after which the U.S. embarked on the War on Terror, again increasing defense expenditures significantly.
In the post 9/11 era, the Department of Defense budget peaked in 2011 around $750 billion due to large-scale operations in Iraq and Afghanistan. In the latter years of the Obama Administration, spending contracted moderately, reflecting gradual disengagement from the active battlefronts.
However, defense spending has continuously grown since 2016 under the Trump administration, reaching fresh highs in 2020 and continuing even higher under the current Biden Administration, mostly in response to Russia’s invasion of Ukraine and the aid provided to Ukraine. (Also see which countries are sending the most aid to Ukraine.)
Click here to see what the US spent on the military every year since 1970.
Source: Harvey Meston / Getty Images
1970: $83.41 billion
> Increase from previous year: -1.86% – #43 largest Increase on list
[in-text-ad]
Source: Space Frontiers / Getty Images
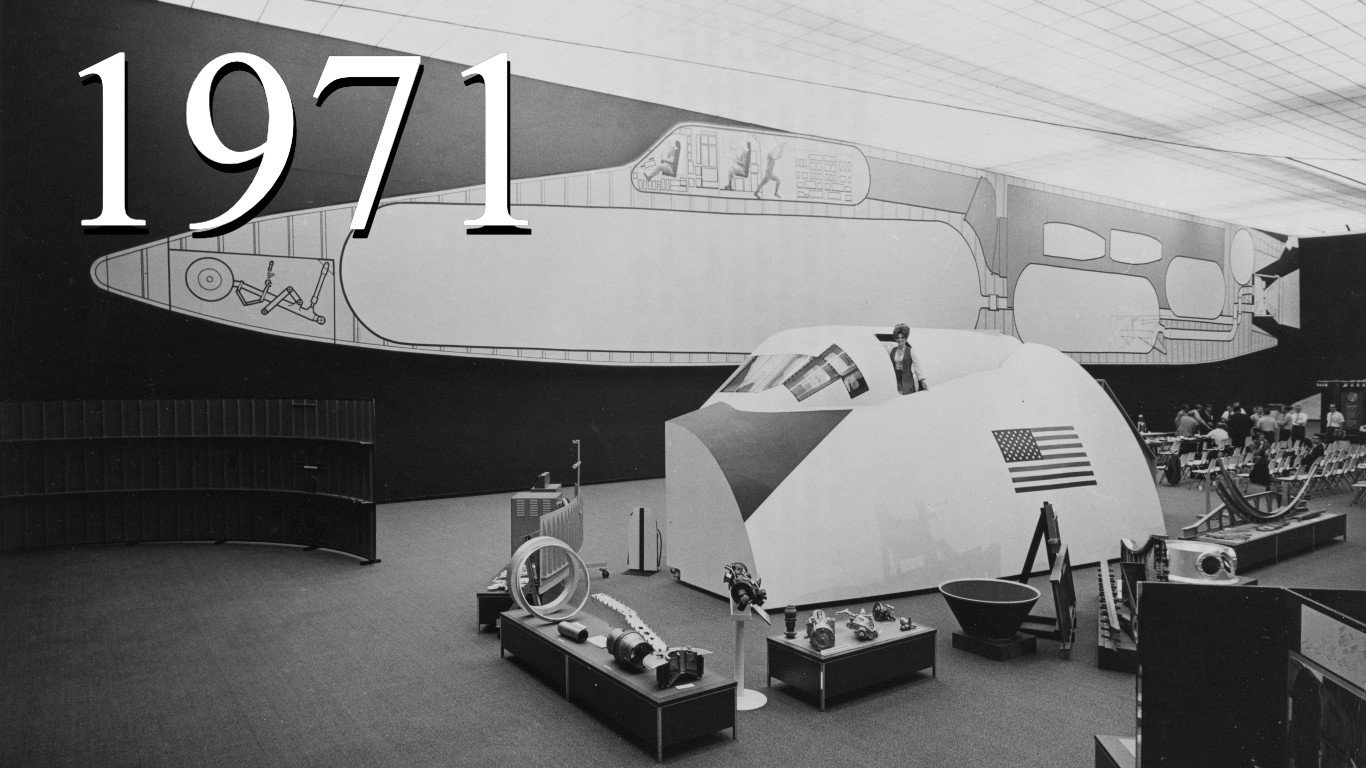
1971: $78.24 billion
> Increase from previous year: -6.20% – #51 largest Increase on list
 24/7 Wall St.
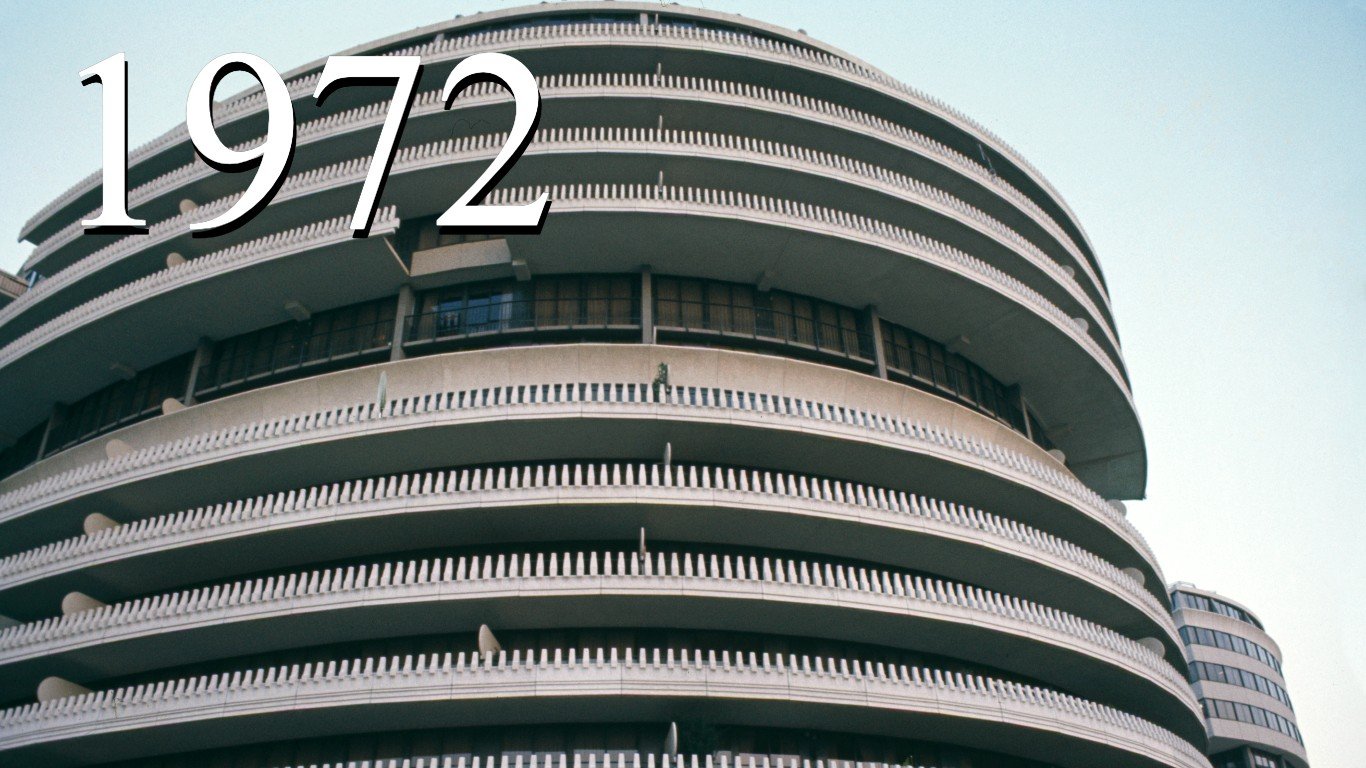
Source: Archive Photos / Getty Images
1972: $80.71 billion
> Increase from previous year: 3.16% – #29 largest Increase on list
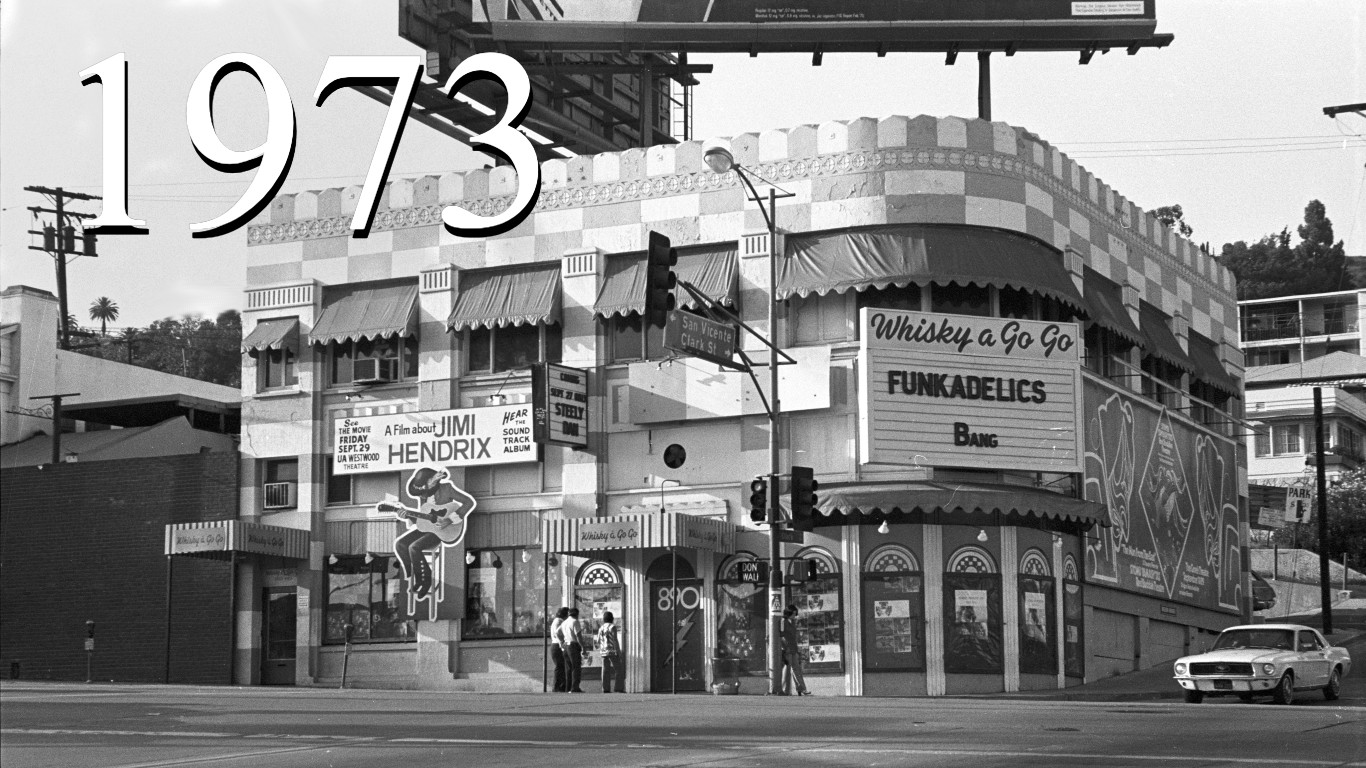
Source: Michael Ochs Archives / Getty Images
1973: $81.47 billion
> Increase from previous year: 0.94% – #40 largest Increase on list
[in-text-ad-2]
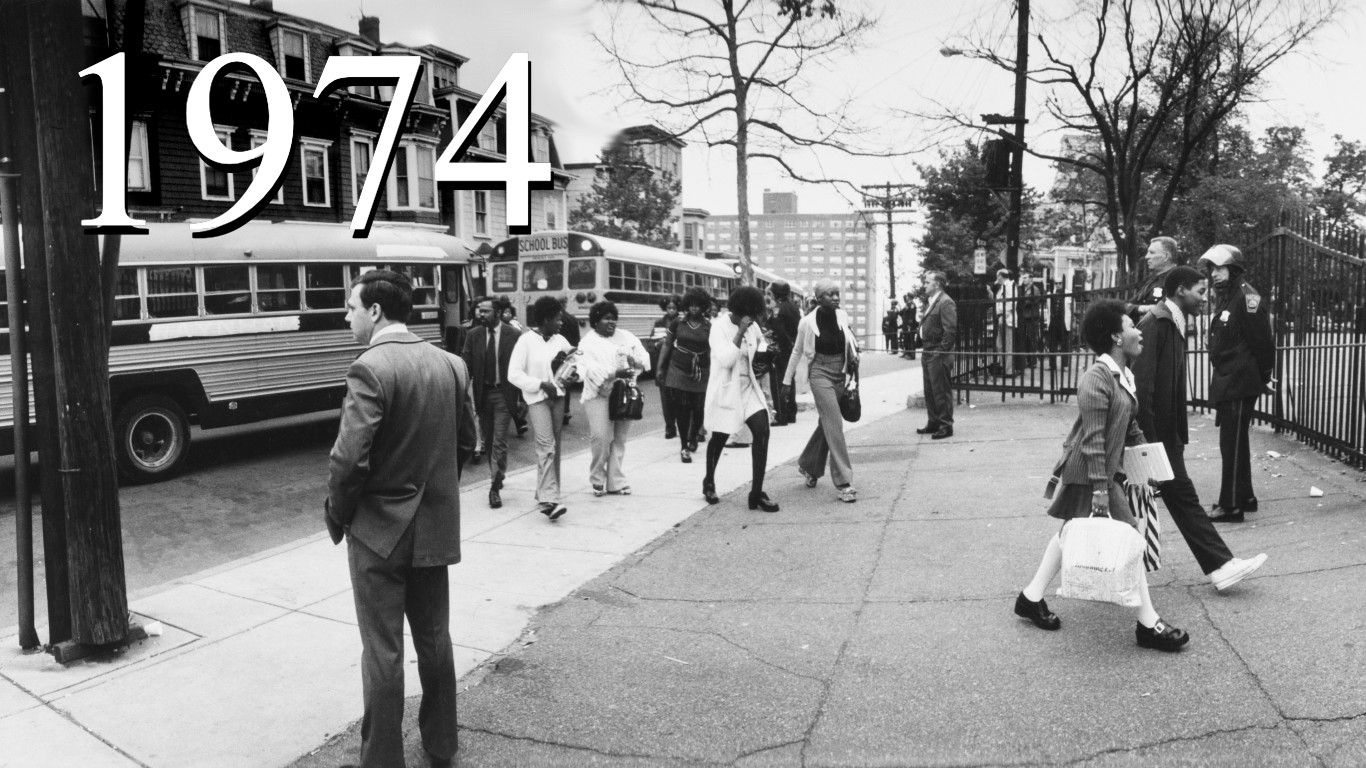
Source: Pictorial Parade / Getty Images
1974: $89.28 billion
> Increase from previous year: 9.59% – #12 largest Increase on list
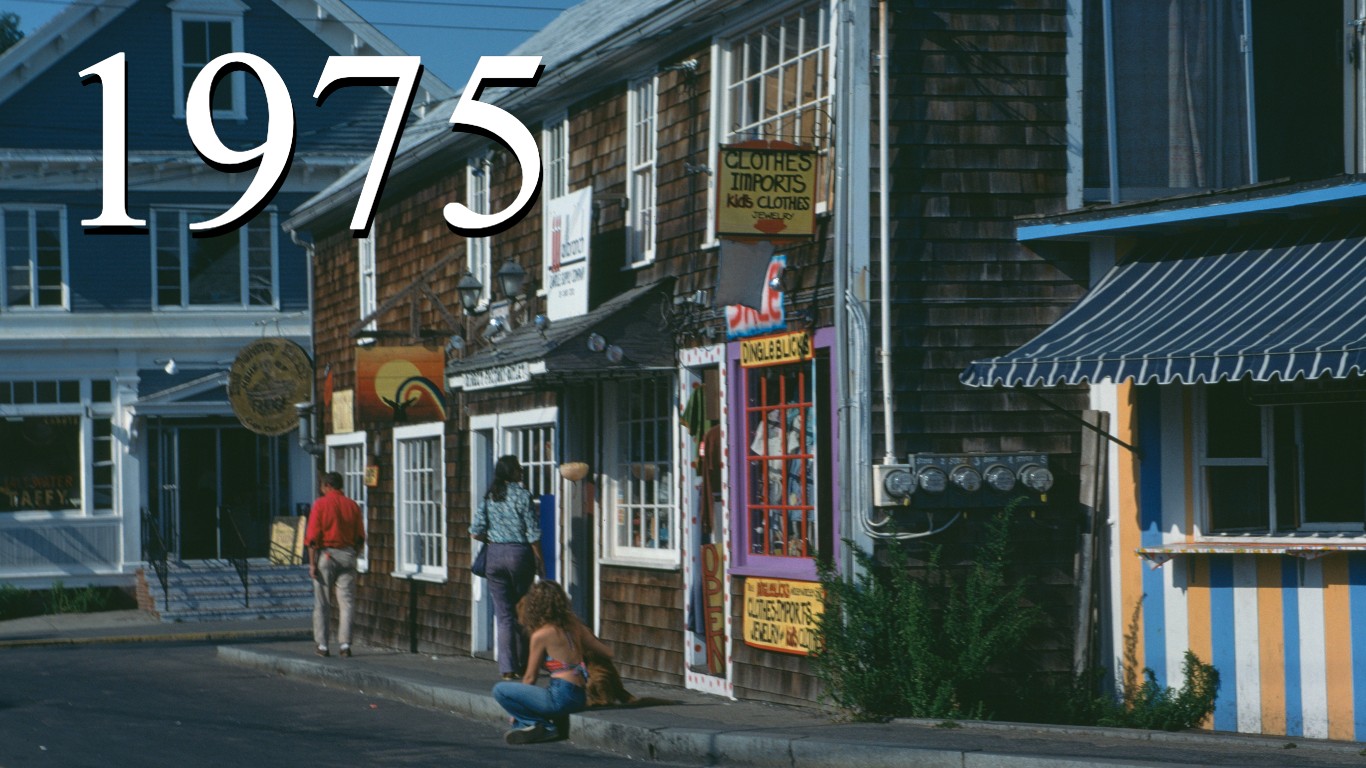
Source: Archive Photos / Getty Images
1975: $92.08 billion
> Increase from previous year: 3.14% – #30 largest Increase on list
[in-text-ad]

Source: Keystone / Getty Images
1976: $94.72 billion
> Increase from previous year: 2.87% – #32 largest Increase on list
 24/7 Wall St.
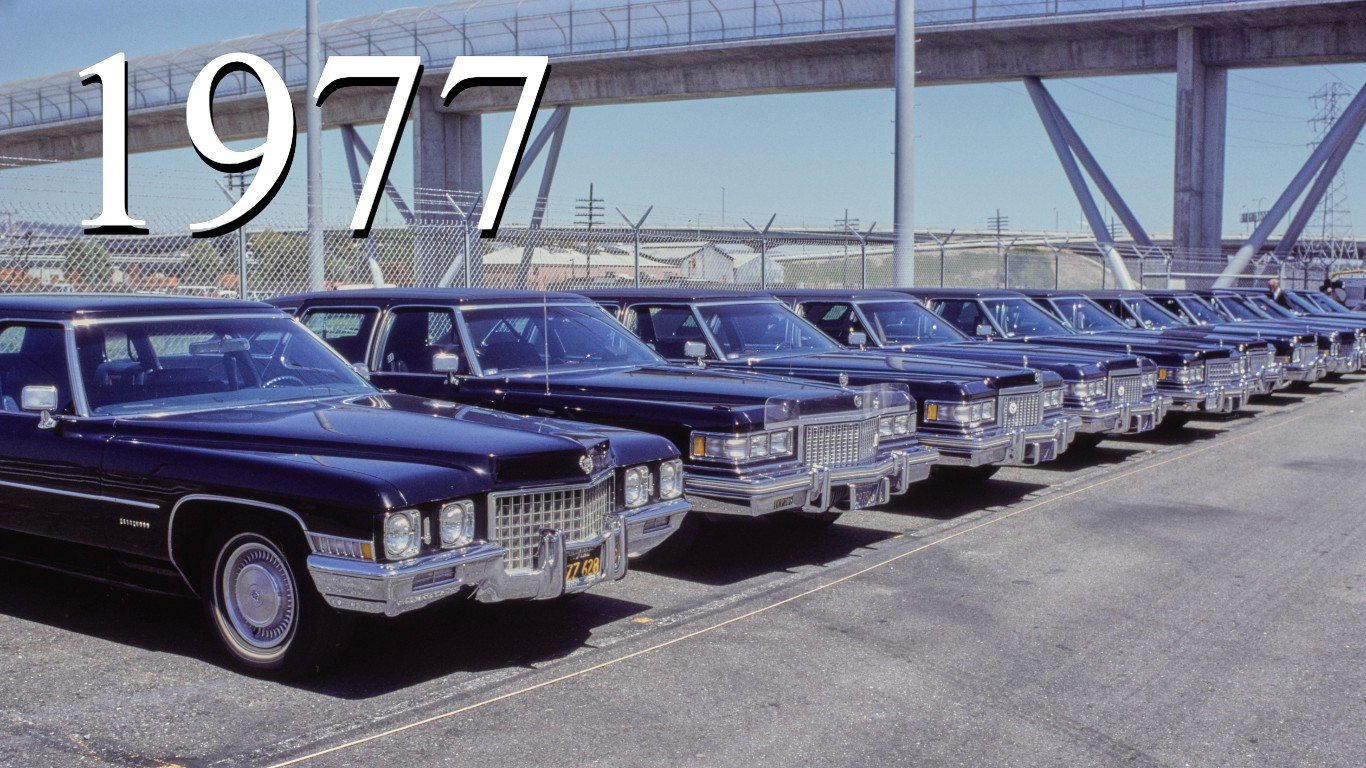
Source: Michael Ochs Archives / Getty Images
1977: $104.67 billion
> Increase from previous year: 10.50% – #10 largest Increase on list
Source: Space Frontiers / Getty Images
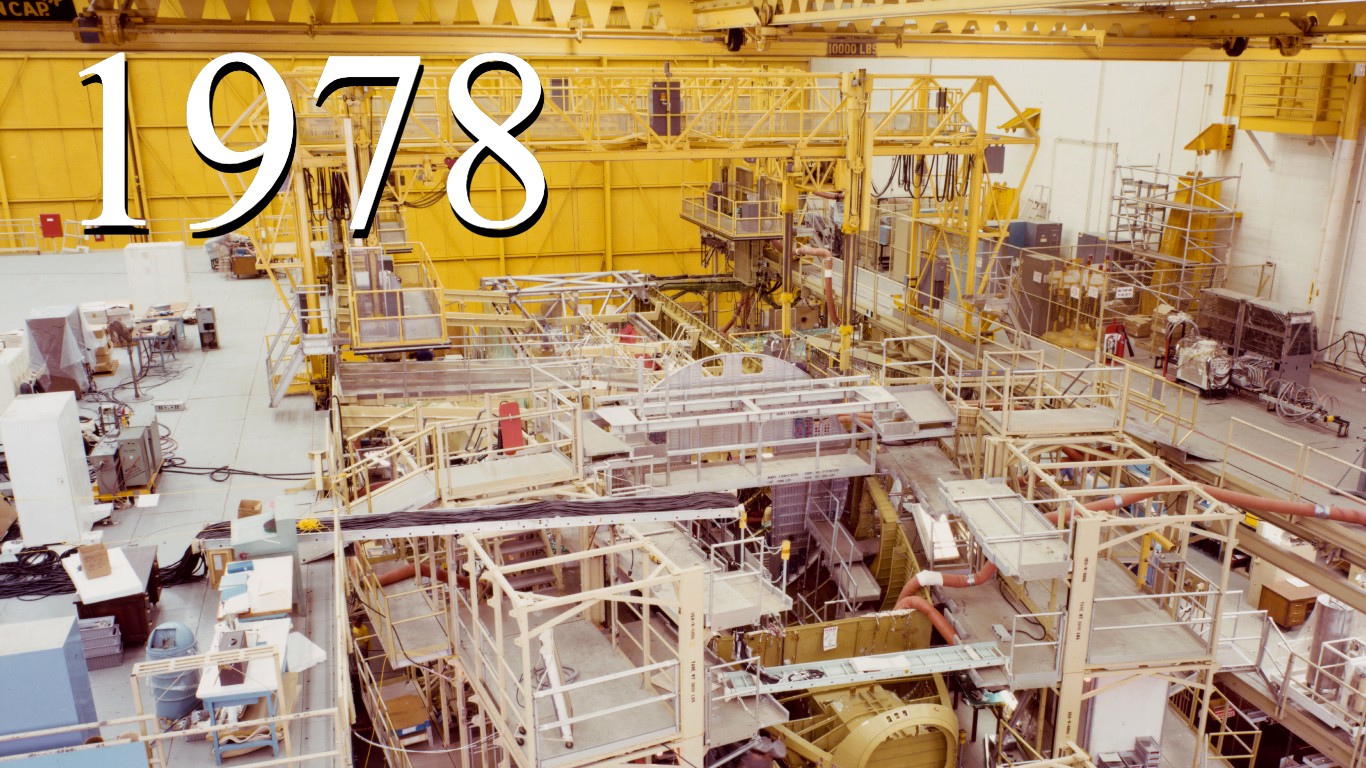
1978: $113.38 billion
> Increase from previous year: 8.32% – #16 largest Increase on list
[in-text-ad-2]

Source: Tony Duffy / Getty Images
1979: $126.88 billion
> Increase from previous year: 11.91% – #6 largest Increase on list
Source: FPG / Getty Images
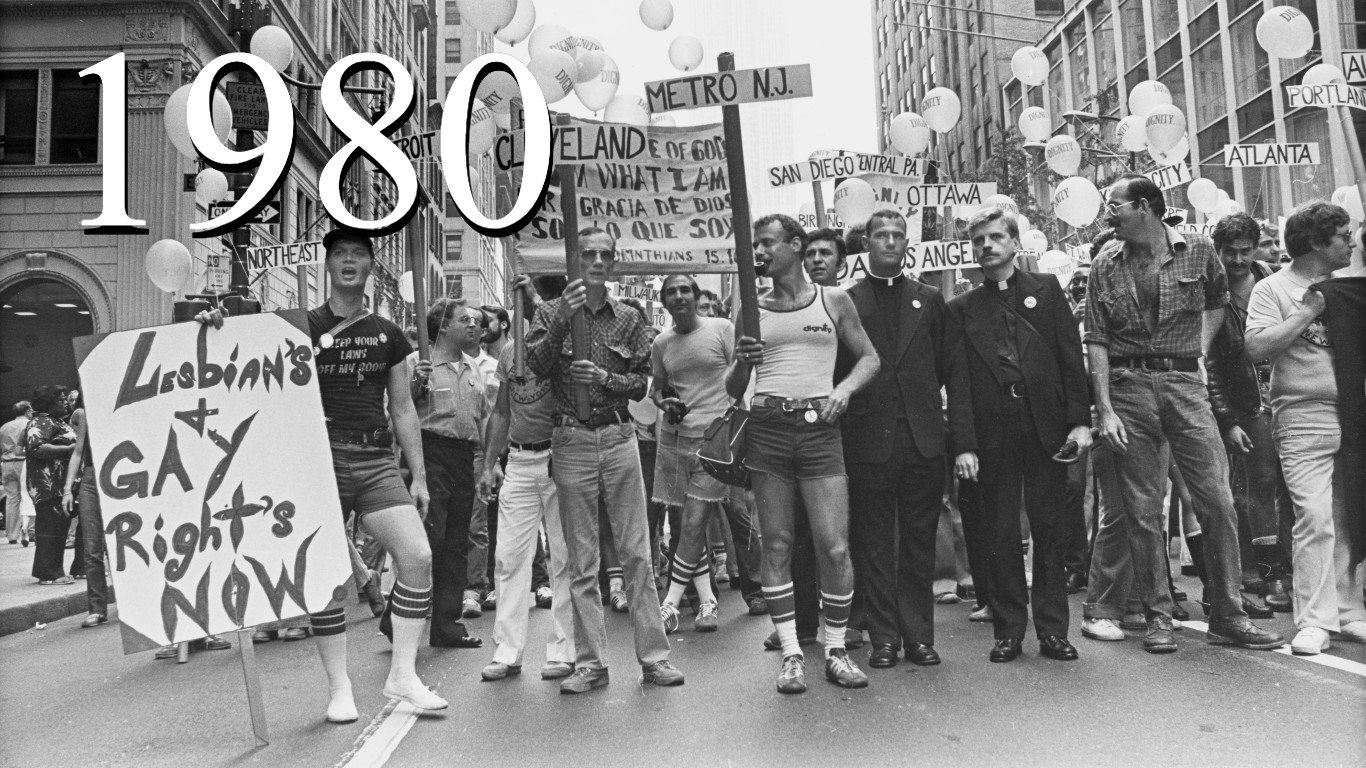
1980: $143.69 billion
> Increase from previous year: 13.25% – #5 largest Increase on list
[in-text-ad]
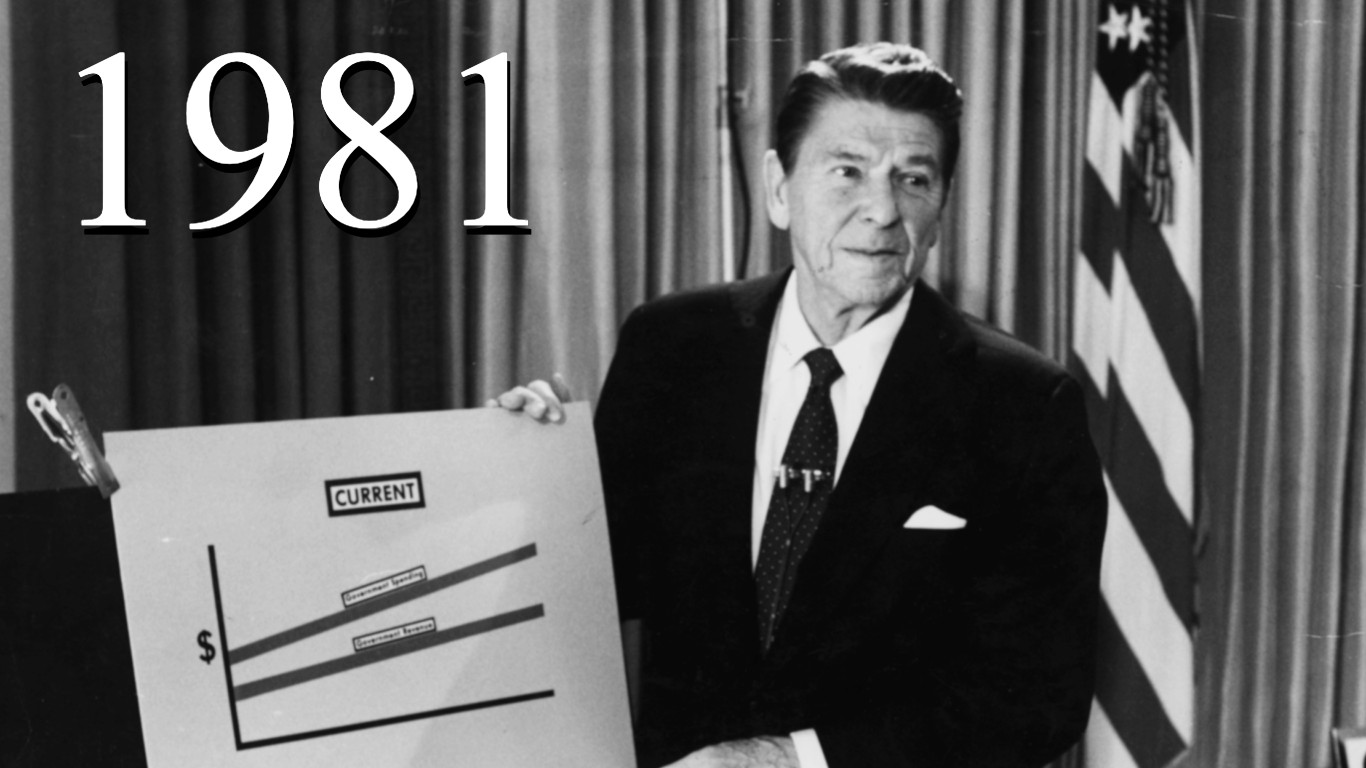
Source: Gene Forte / Getty Images
1981: $176.56 billion
> Increase from previous year: 22.88% – #2 largest Increase on list
 24/7 Wall St.
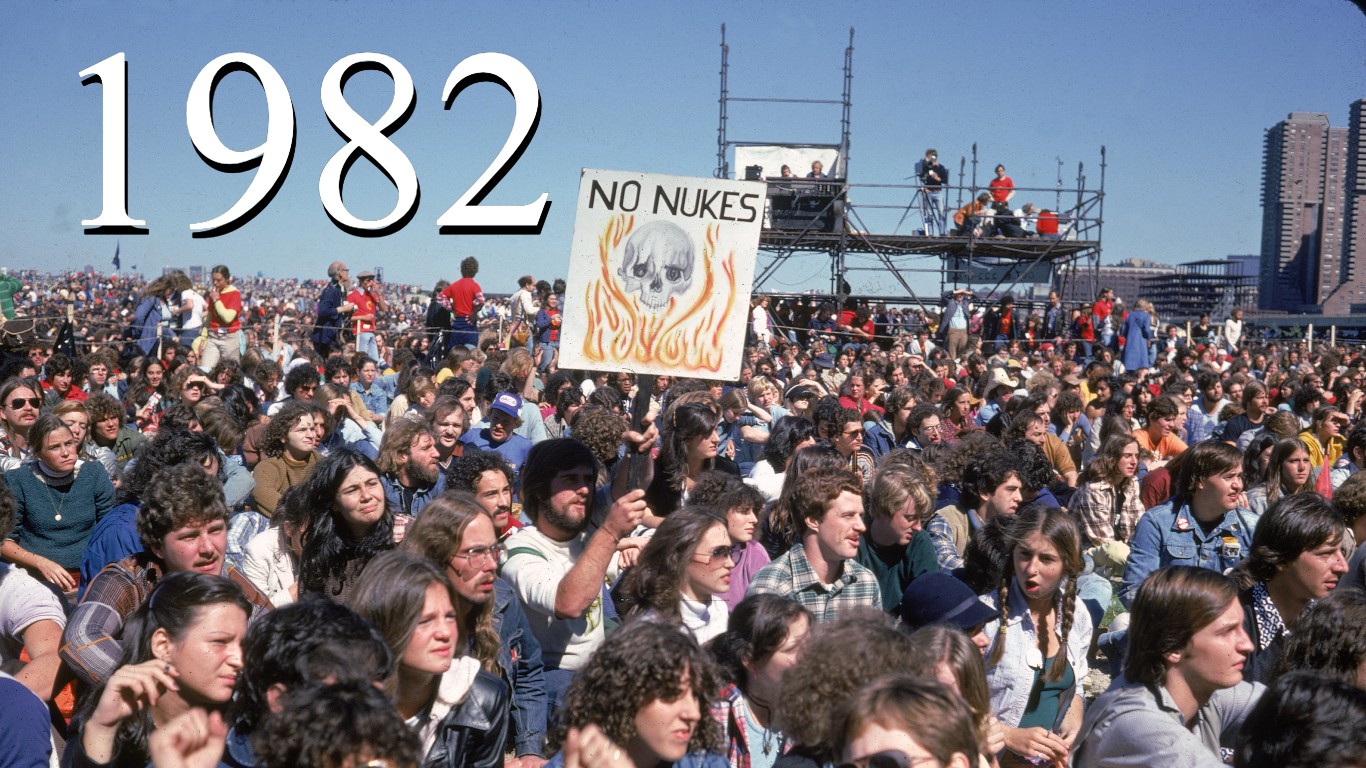
Source: Hulton Archive / Getty Images
1982: $221.67 billion
> Increase from previous year: 25.55% – #1 largest Increase on list
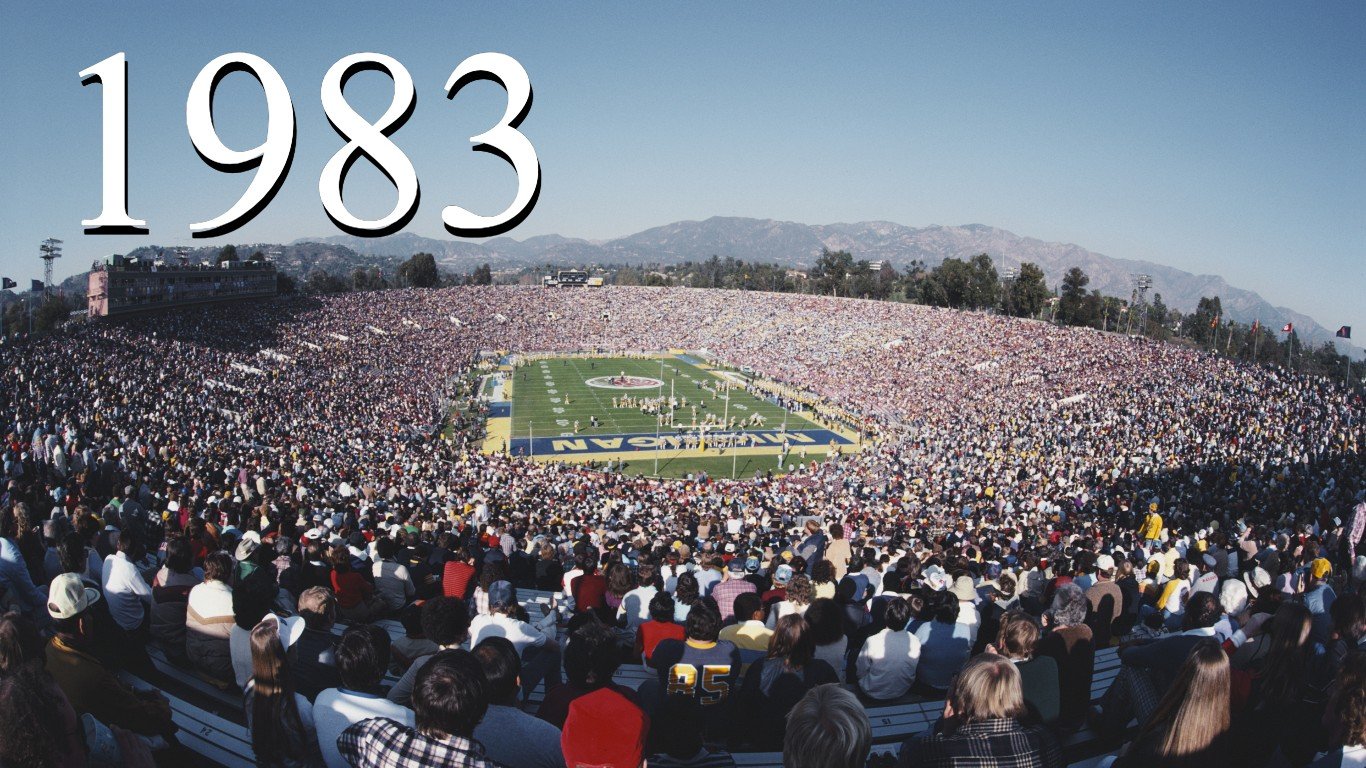
Source: Tony Duffy / Getty Images
1983: $223.43 billion
> Increase from previous year: 0.79% – #41 largest Increase on list
[in-text-ad-2]
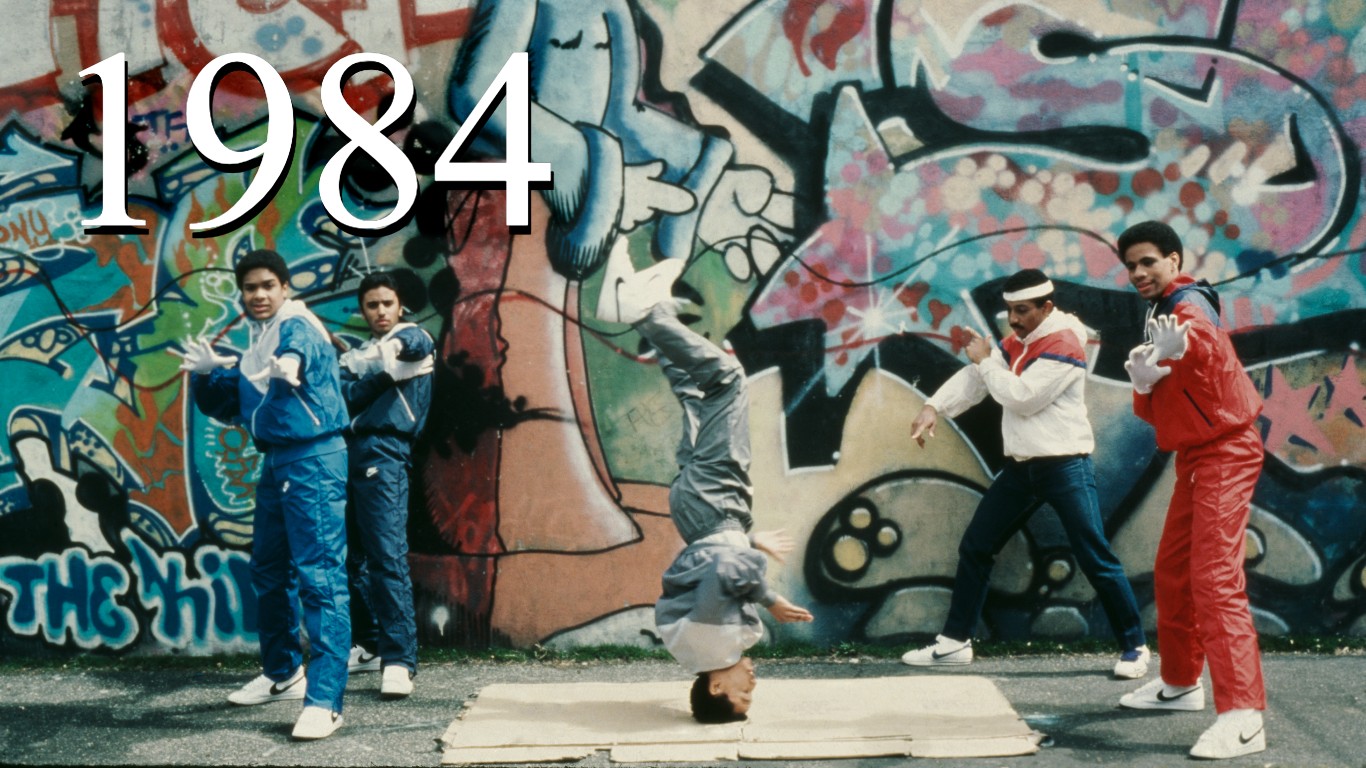
Source: Michael Ochs Archives / Getty Images
1984: $245.15 billion
> Increase from previous year: 9.72% – #11 largest Increase on list
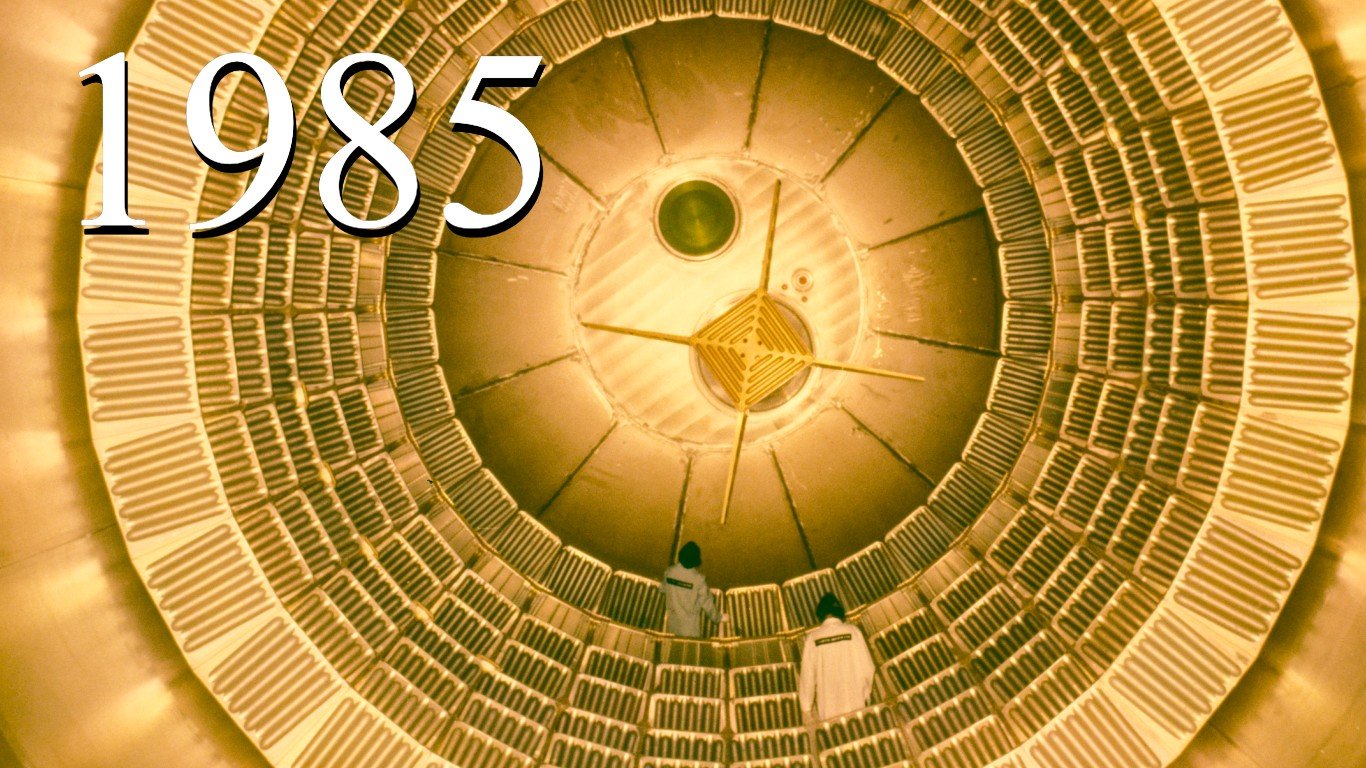
Source: Space Frontiers / Getty Images
1985: $272.16 billion
> Increase from previous year: 11.02% – #9 largest Increase on list
[in-text-ad]
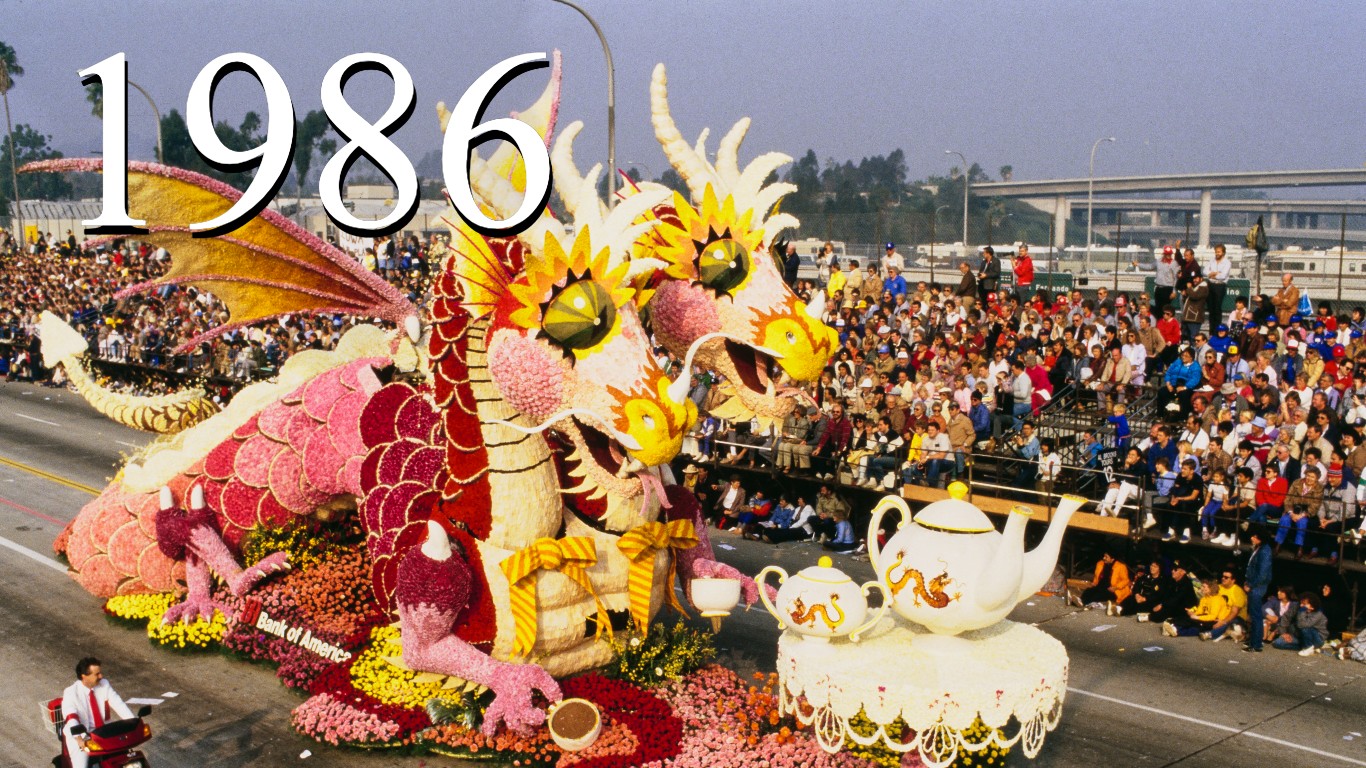
Source: Getty Images / Staff
1986: $295.55 billion
> Increase from previous year: 8.59% – #14 largest Increase on list
 24/7 Wall St.
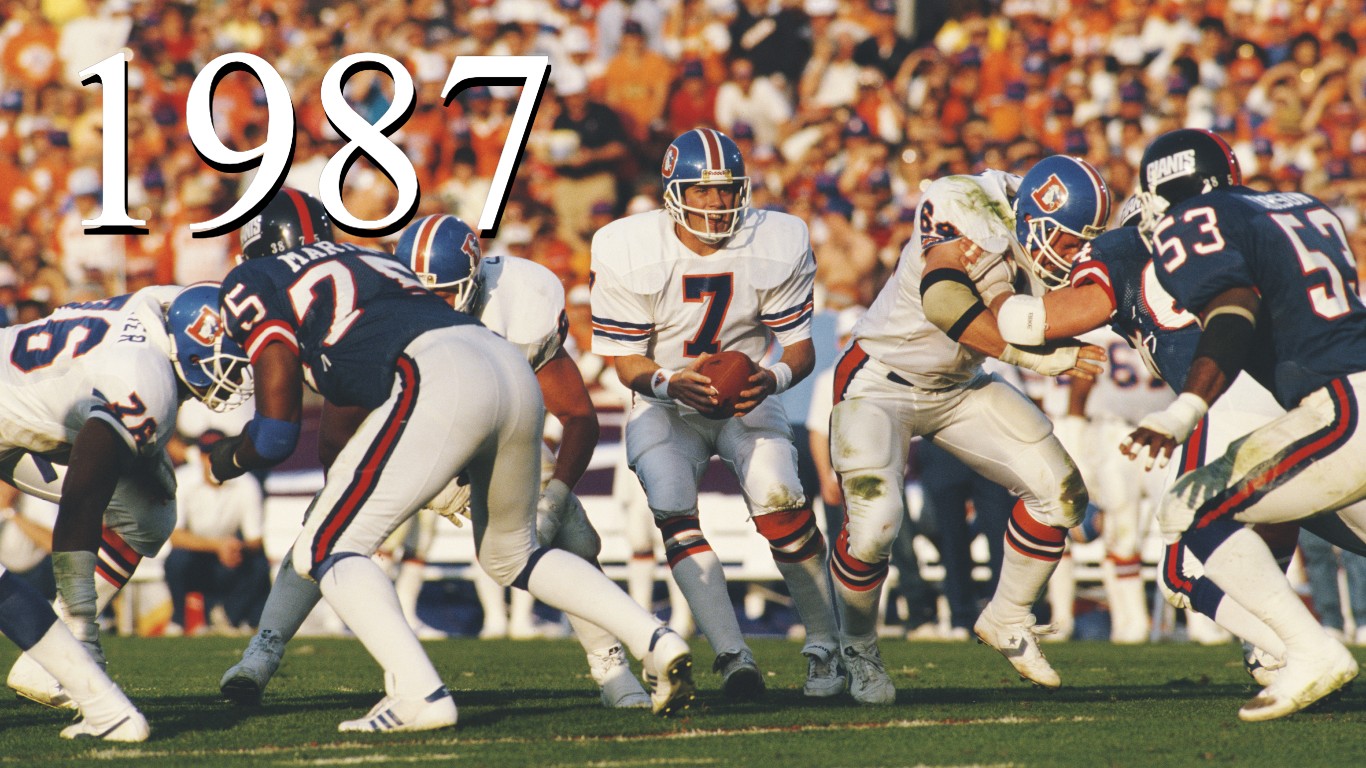
Source: Rick Stewart / Getty Images
1987: $304.09 billion
> Increase from previous year: 2.89% – #31 largest Increase on list
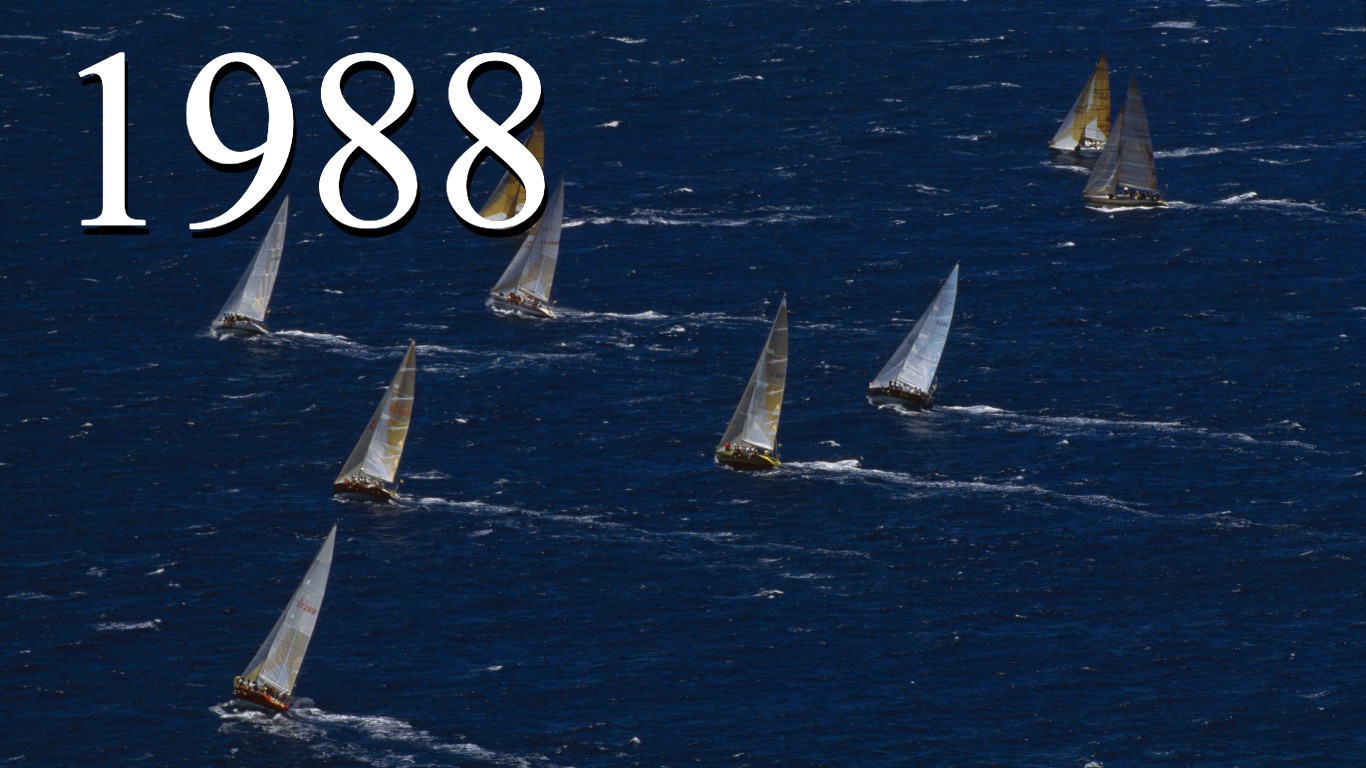
Source: Getty Images / Staff
1988: $309.66 billion
> Increase from previous year: 1.83% – #35 largest Increase on list
[in-text-ad-2]
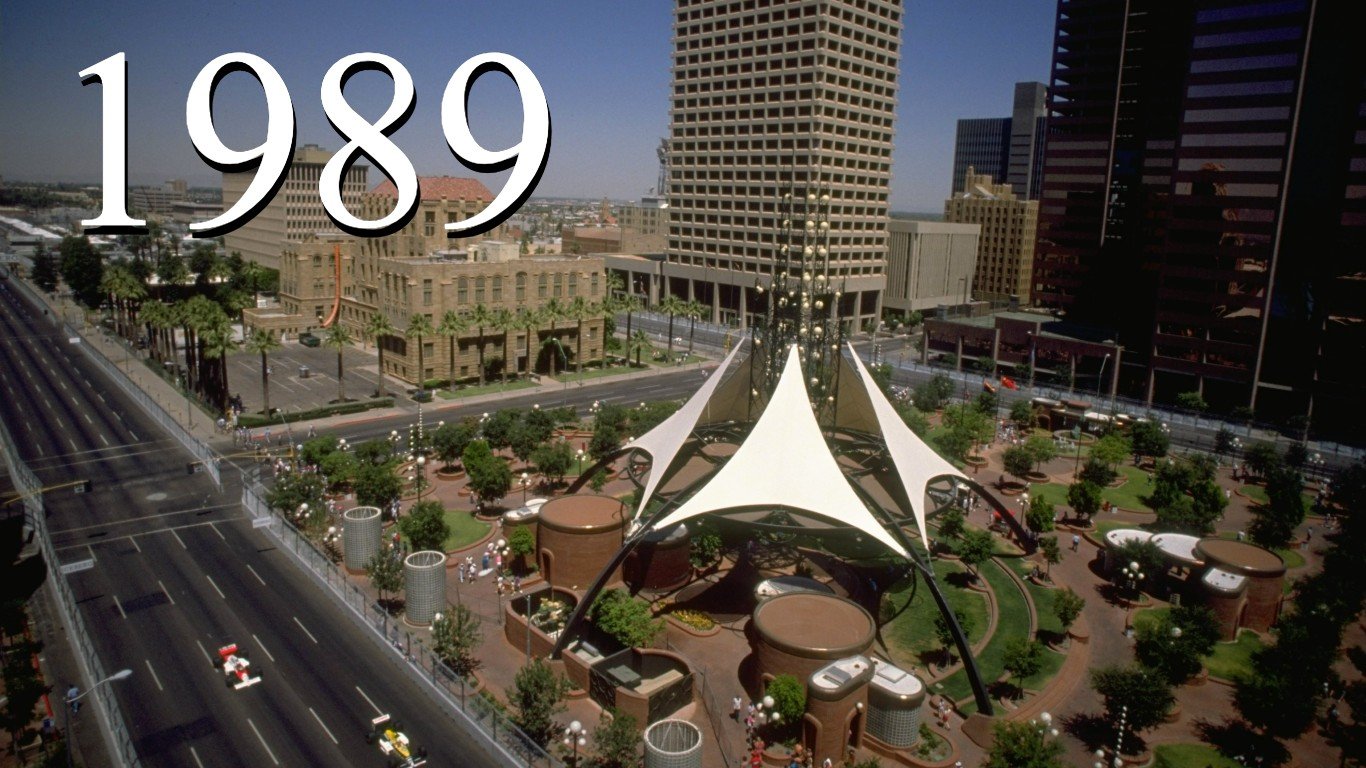
Source: Pascal Rondeau / Getty Images
1989: $321.87 billion
> Increase from previous year: 3.94% – #26 largest Increase on list
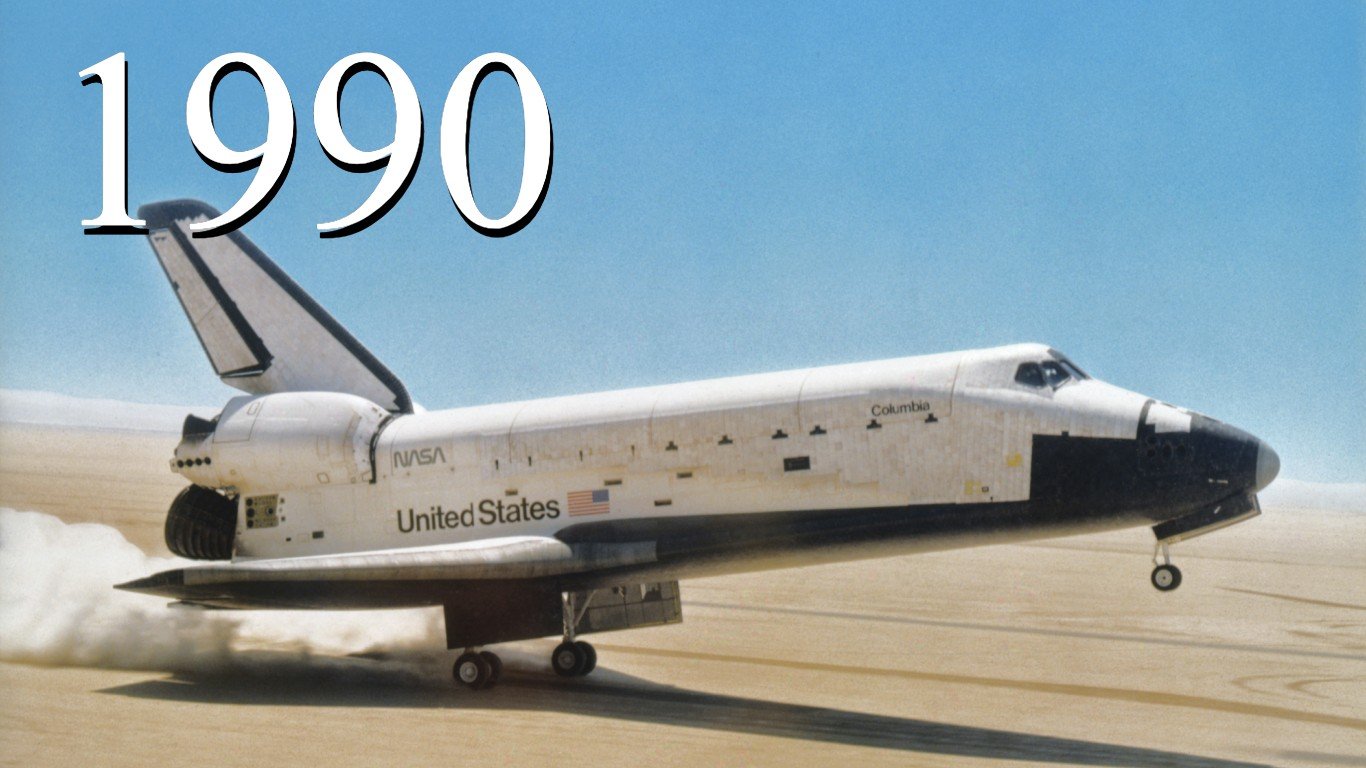
Source: Space Frontiers / Getty Images
1990: $325.13 billion
> Increase from previous year: 1.01% – #38 largest Increase on list
[in-text-ad]
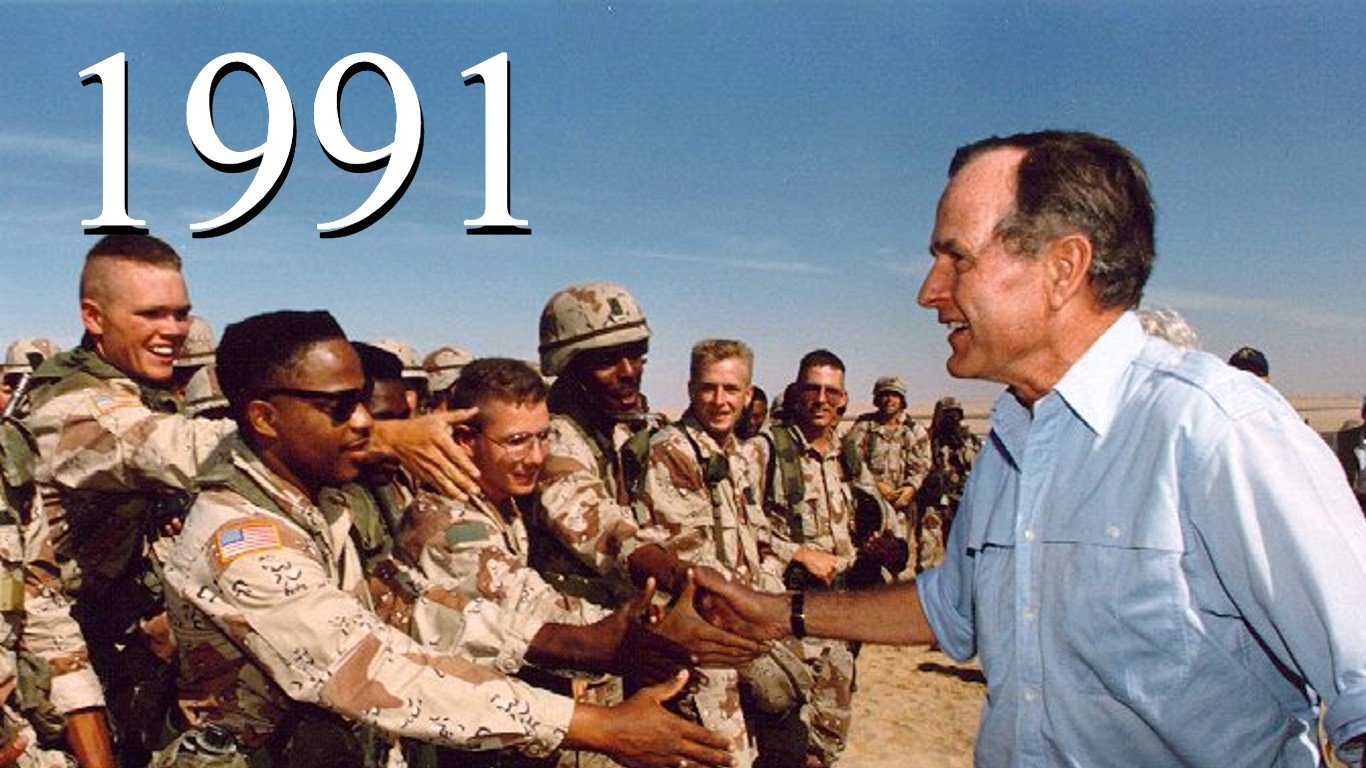
Source: Public Domain / Wikimedia Commons
1991: $299.37 billion
> Increase from previous year: -7.92% – #53 largest increase on list
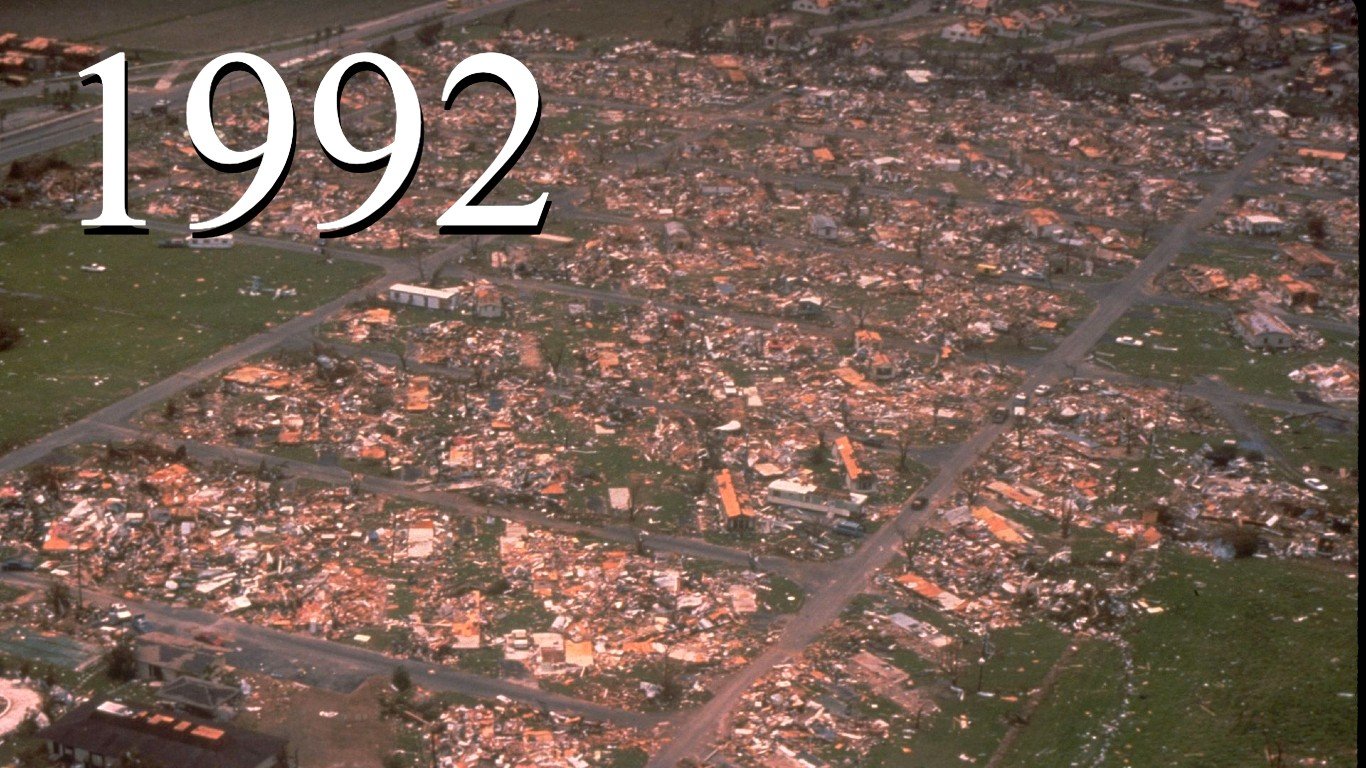
Source: Public Domain / Wikimedia Commons
1992: $325.03 billion
> Increase from previous year: 8.57% – #15 largest Increase on list
Source: Public Domain / Wikimedia Commons
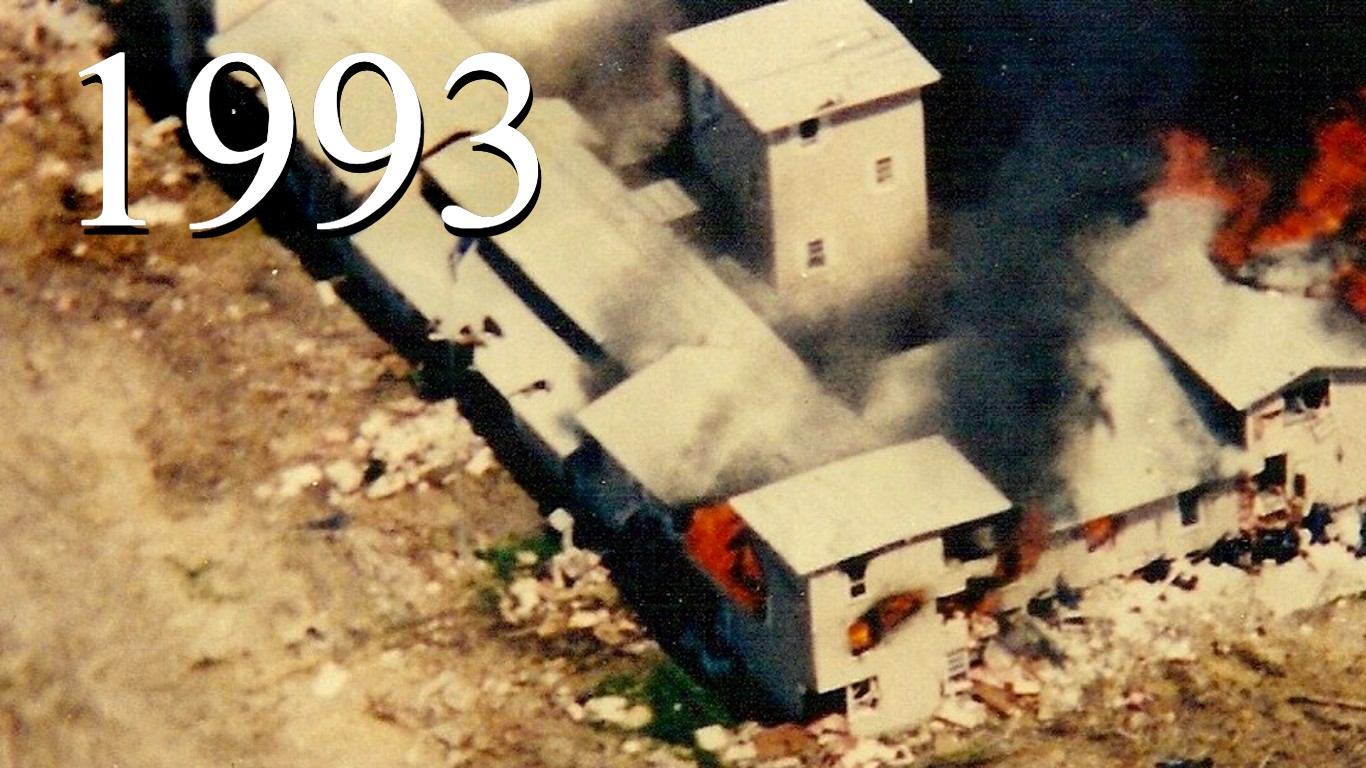
1993: $316.72 billion
> Increase from previous year: -2.56% – #45 largest Increase on list
[in-text-ad-2]

Source: Phil Cole / Getty Images
1994: $308.08 billion
> Increase from previous year: -2.73% – #47 largest Increase on list
Source: Public Domain / Wikimedia Commons
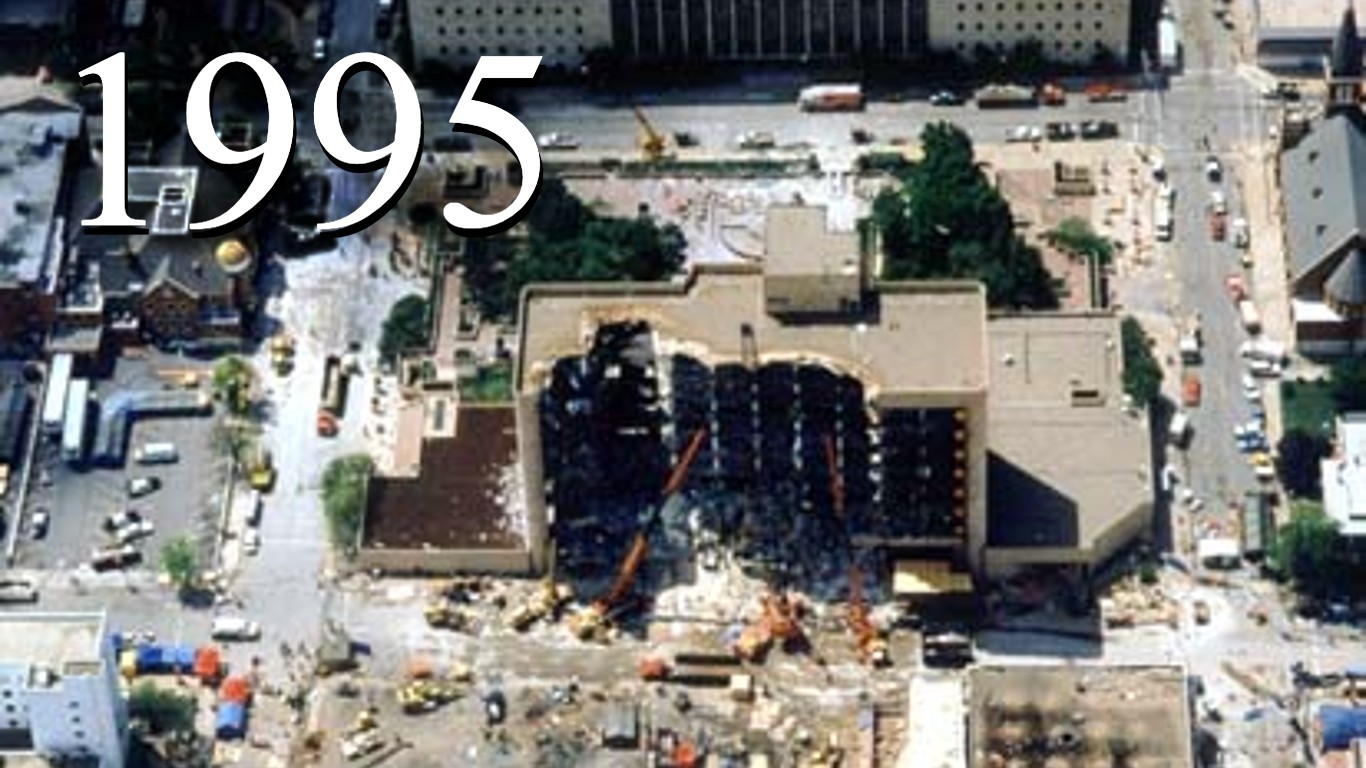
1995: $295.85 billion
> Increase from previous year: -3.97% – #49 largest Increase on list
[in-text-ad]
Source: Jeff J Mitchell / Getty Images
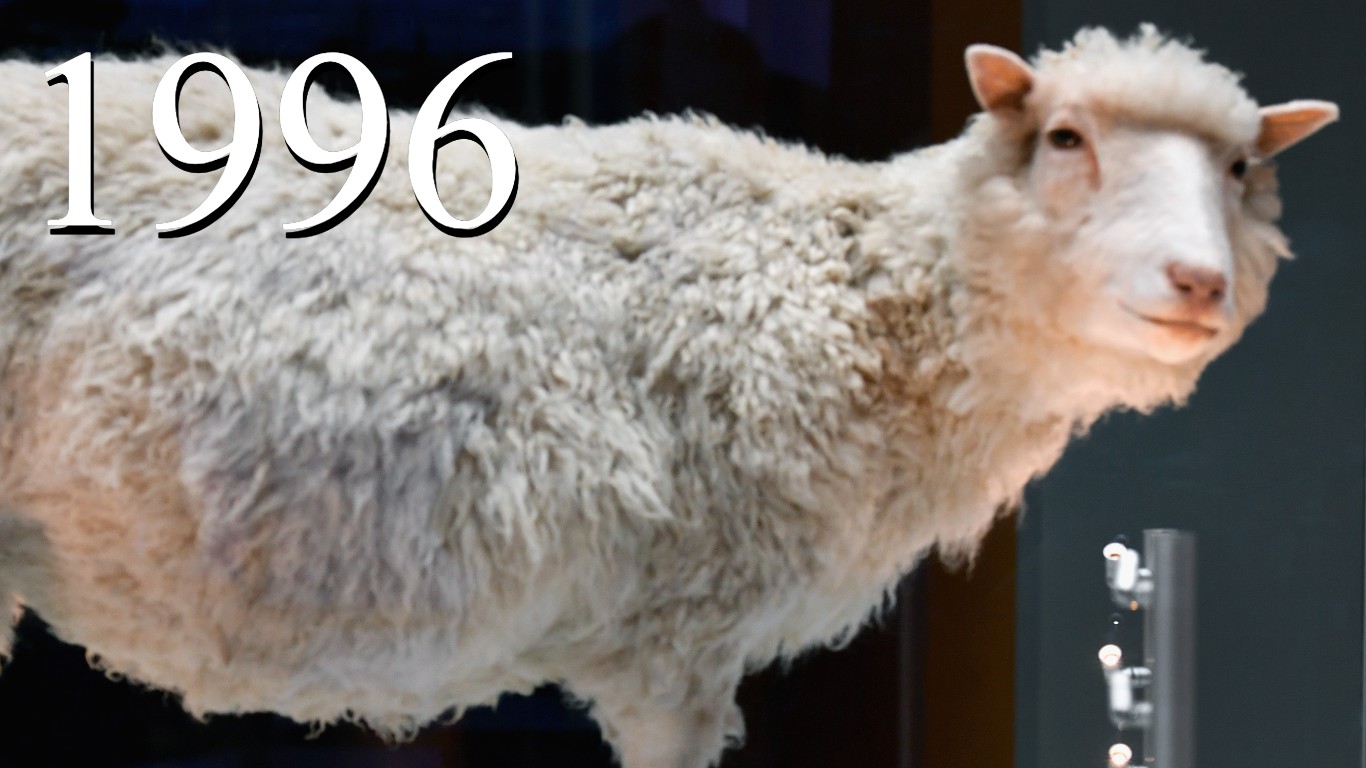
1996: $287.96 billion
> Increase from previous year: -2.67% – #46 largest Increase on list

Source: Doug Pensinger / Getty Images
1997: $293.17 billion
> Increase from previous year: 1.81% – #36 largest Increase on list
Source: Space Frontiers / Getty Images
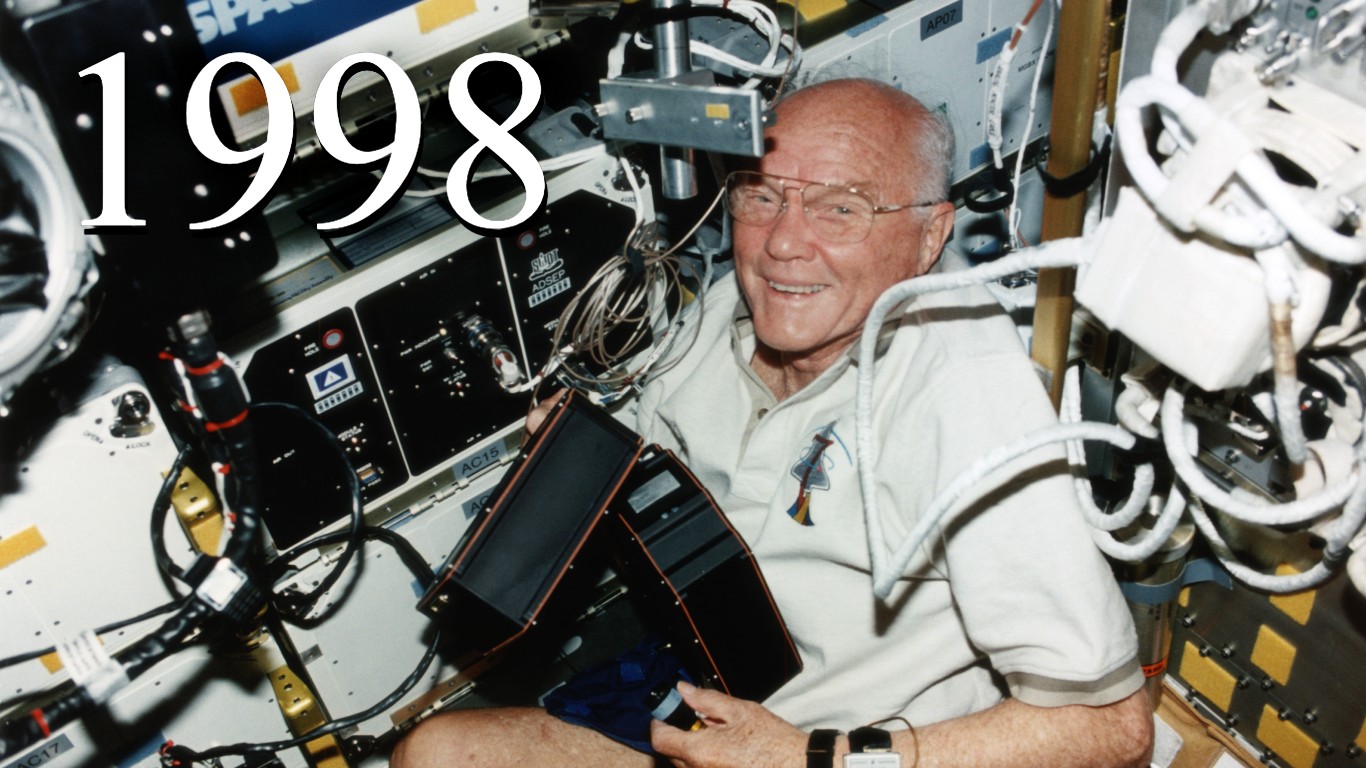
1998: $291.00 billion
> Increase from previous year: -0.74% – #42 largest Increase on list
[in-text-ad-2]
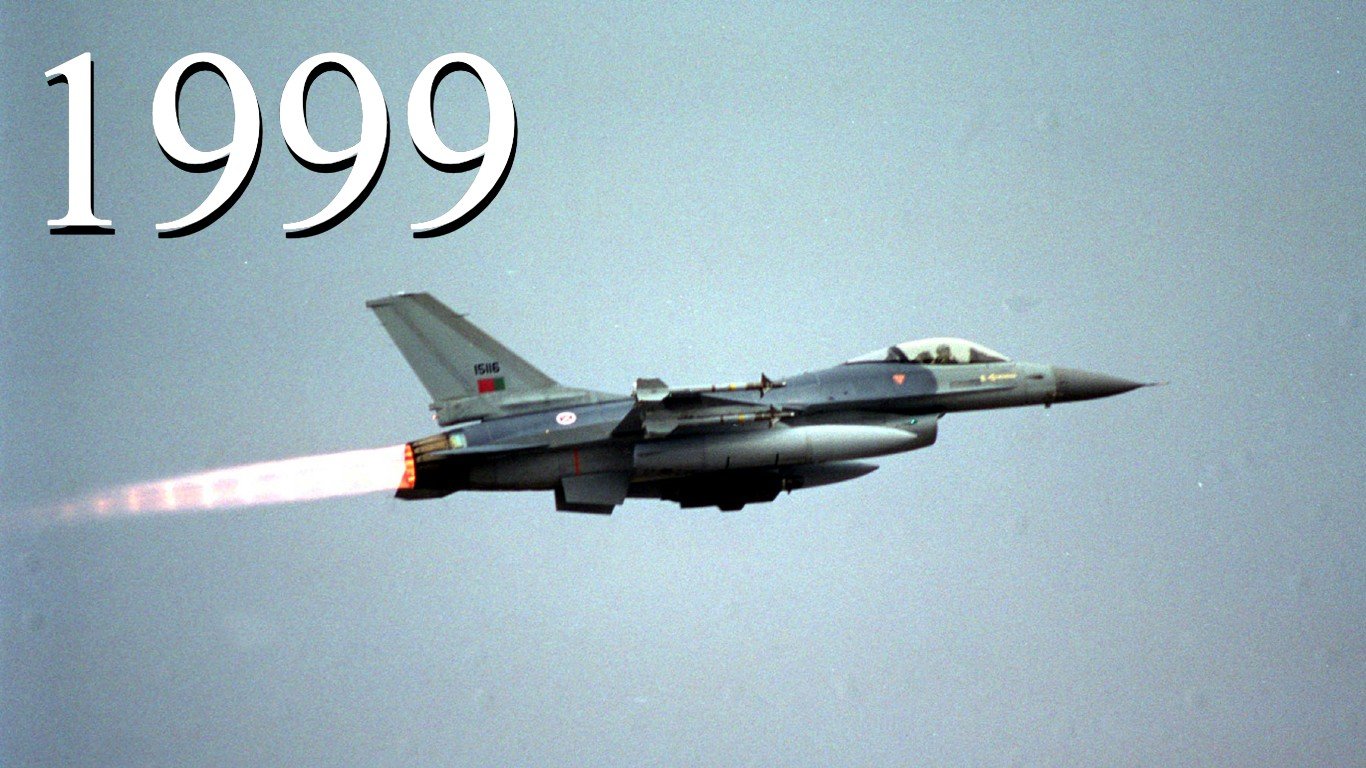
Source: USAF / Getty Images
1999: $298.09 billion
> Increase from previous year: 2.44% – #33 largest Increase on list
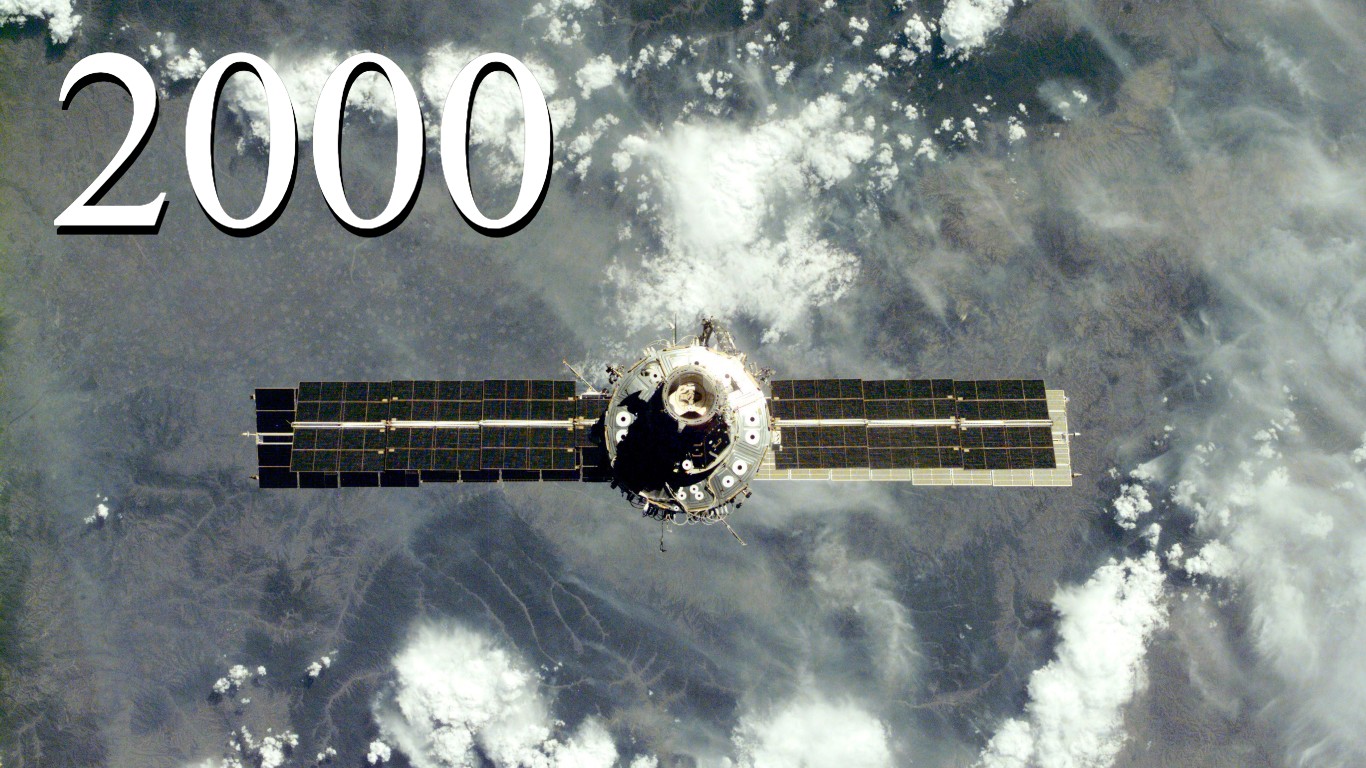
Source: NASA / Getty Images
2000: $320.09 billion
> Increase from previous year: 7.38% – #20 largest Increase on list
[in-text-ad]
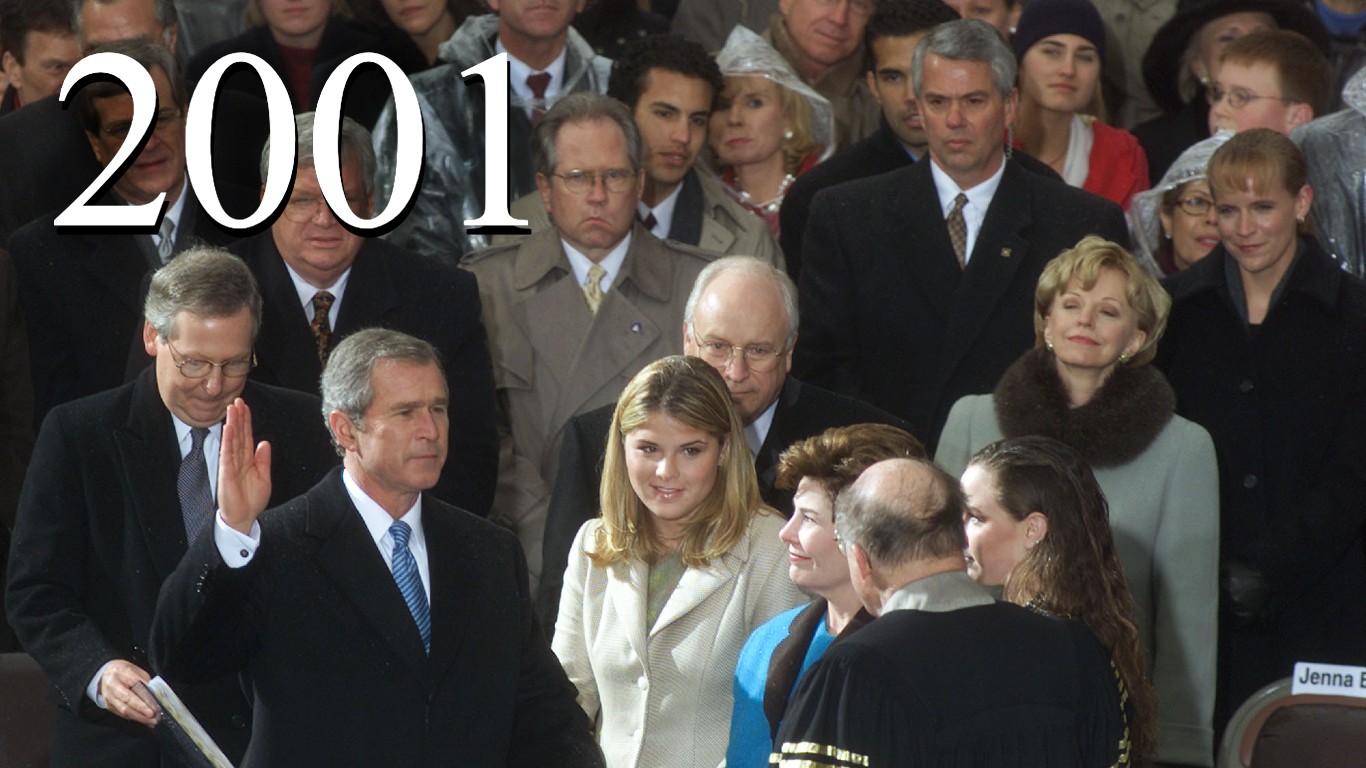
Source: Mark Wilson / Getty Images
2001: $331.81 billion
> Increase from previous year: 3.66% – #27 largest Increase on list
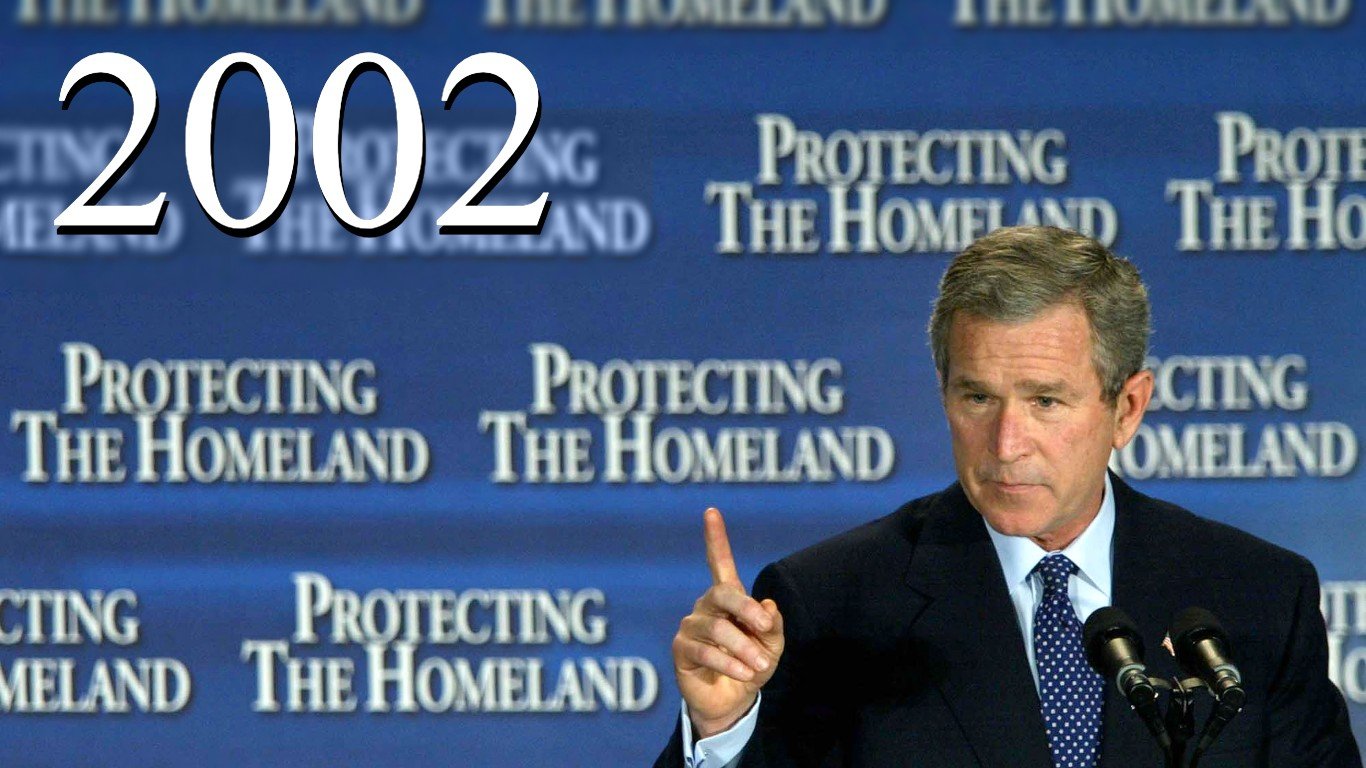
Source: Mark Wilson / Getty Images
2002: $378.46 billion
> Increase from previous year: 14.06% – #4 largest Increase on list
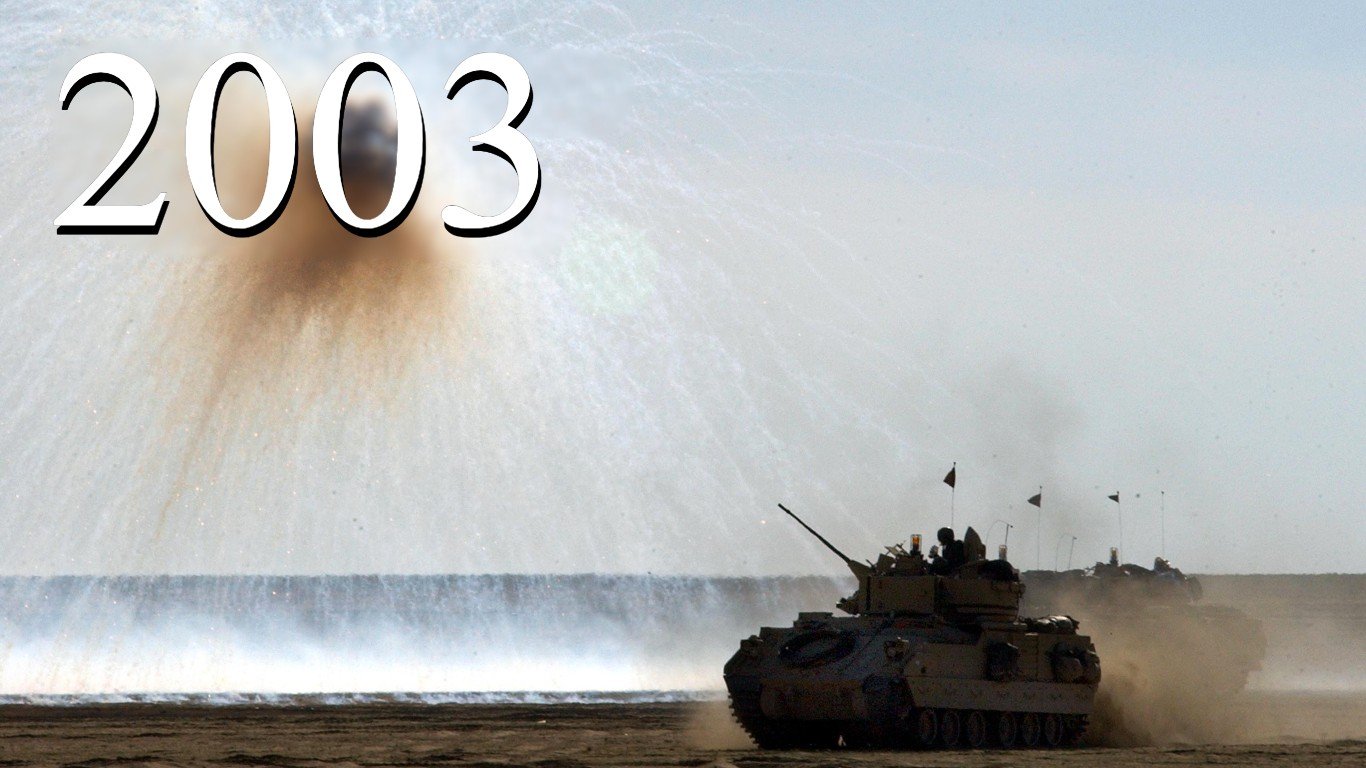
Source: Scott Barbour / Getty Images
2003: $440.53 billion
> Increase from previous year: 16.40% – #3 largest Increase on list
[in-text-ad-2]

Source: Chris Jackson / Getty Images
2004: $493.00 billion
> Increase from previous year: 11.91% – #7 largest Increase on list

2005: $533.20 billion
> Increase from previous year: 8.15% – #17 largest Increase on list
[in-text-ad]
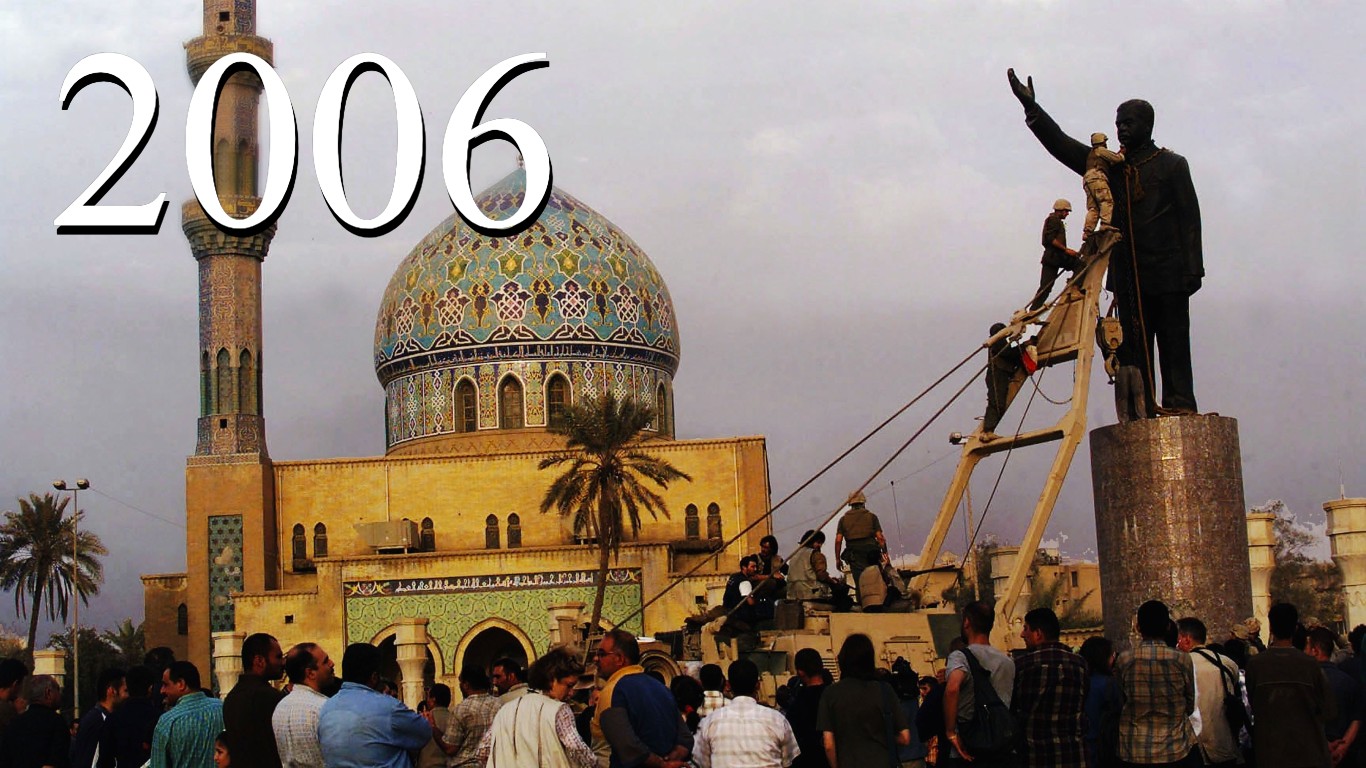
Source: Wathiq Khuzaie / Getty Images
2006: $558.34 billion
> Increase from previous year: 4.71% – #24 largest Increase on list
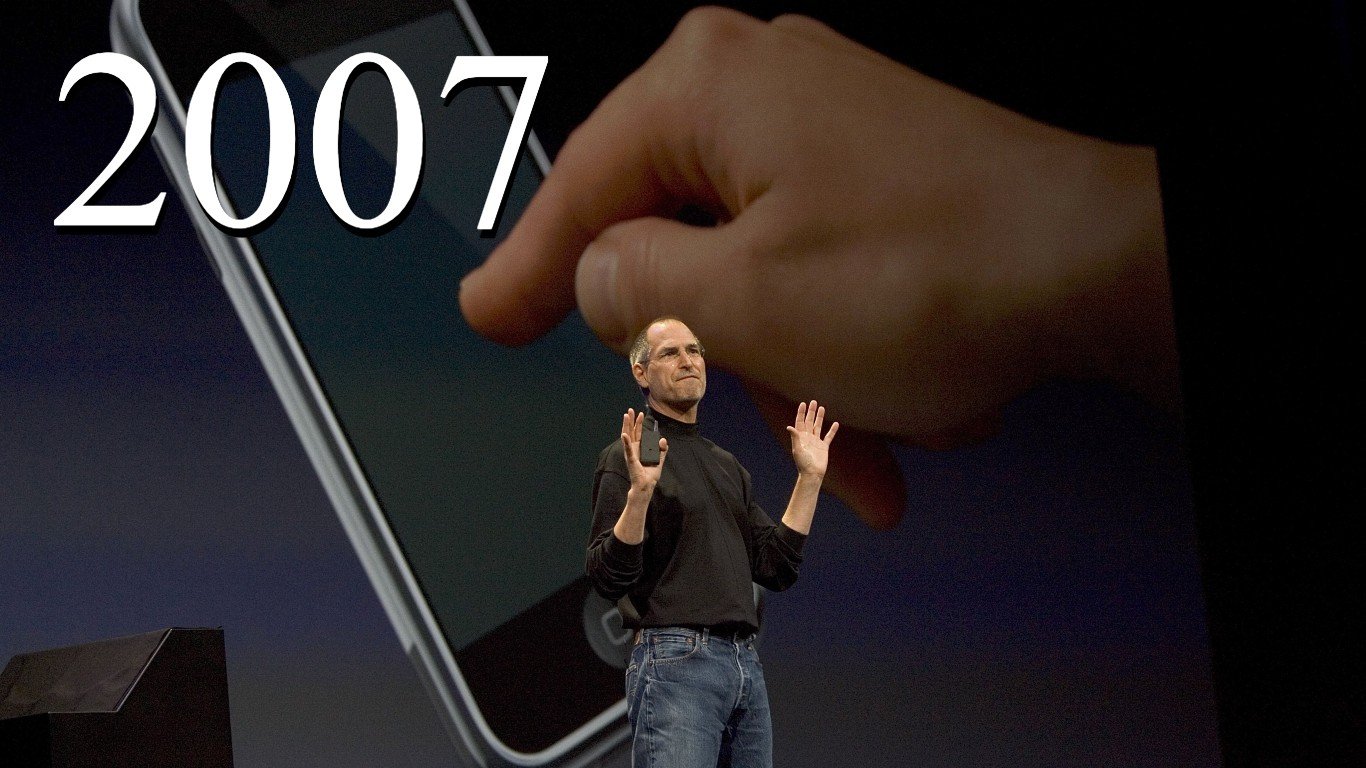
Source: David Paul Morris / Getty Images
2007: $589.59 billion
> Increase from previous year: 5.60% – #22 largest Increase on list
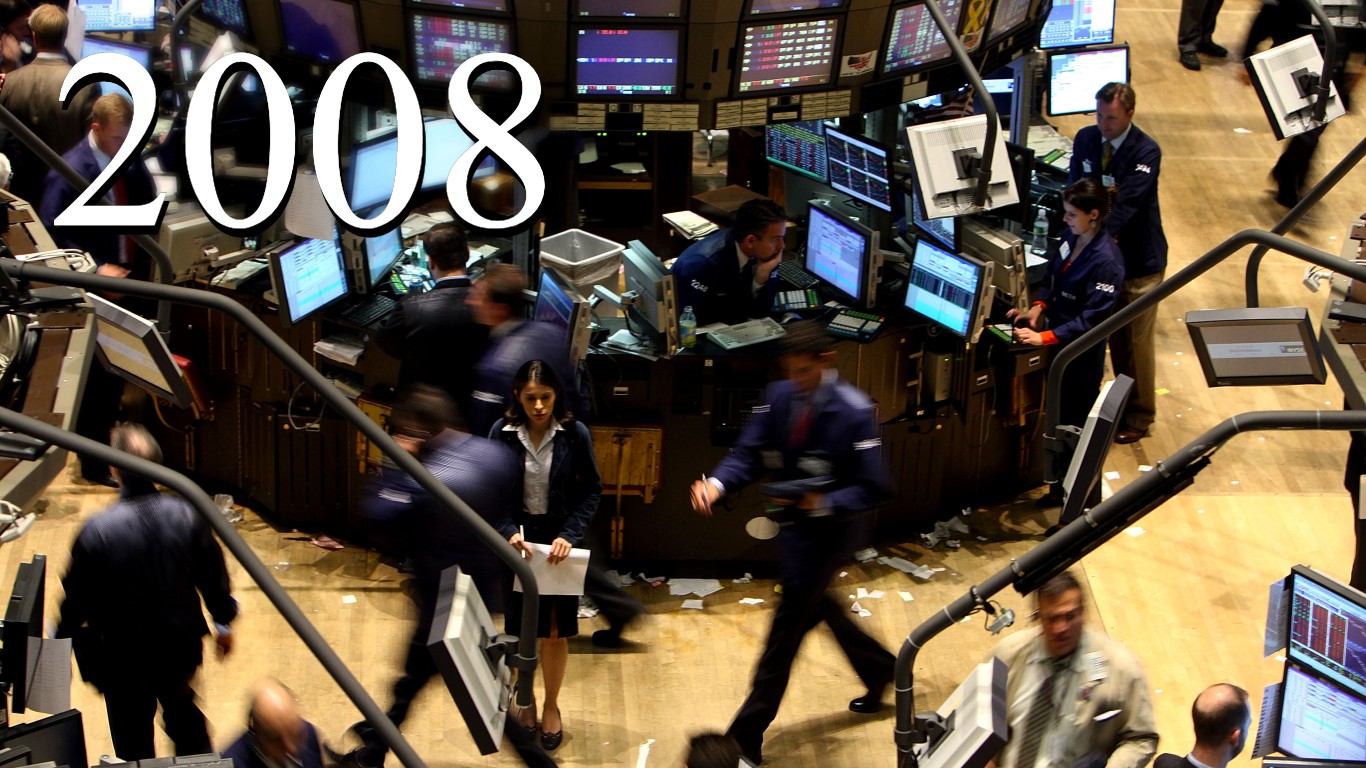
Source: Spencer Platt / Getty Images
2008: $656.76 billion
> Increase from previous year: 11.39% – #8 largest Increase on list
[in-text-ad-2]
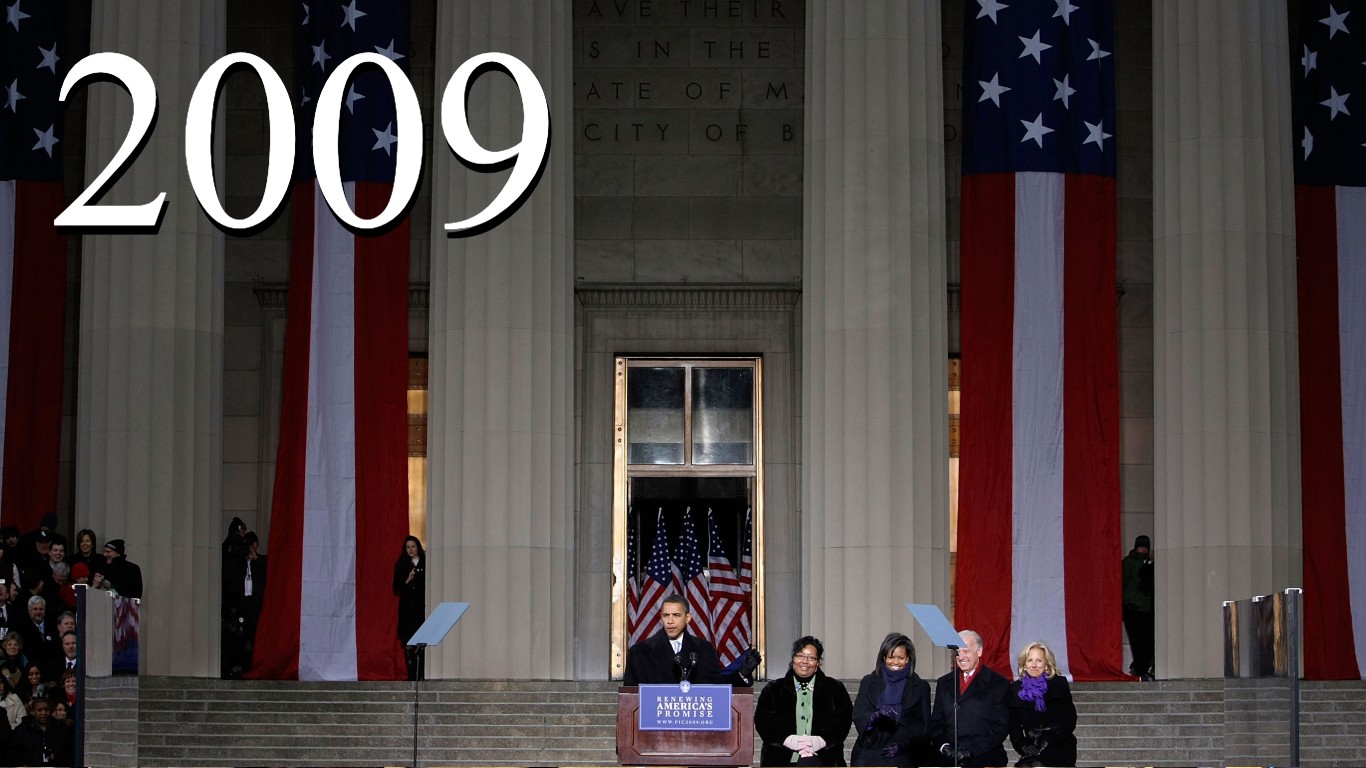
Source: Alex Wong / Getty Images
2009: $705.92 billion
> Increase from previous year: 7.49% – #19 largest Increase on list
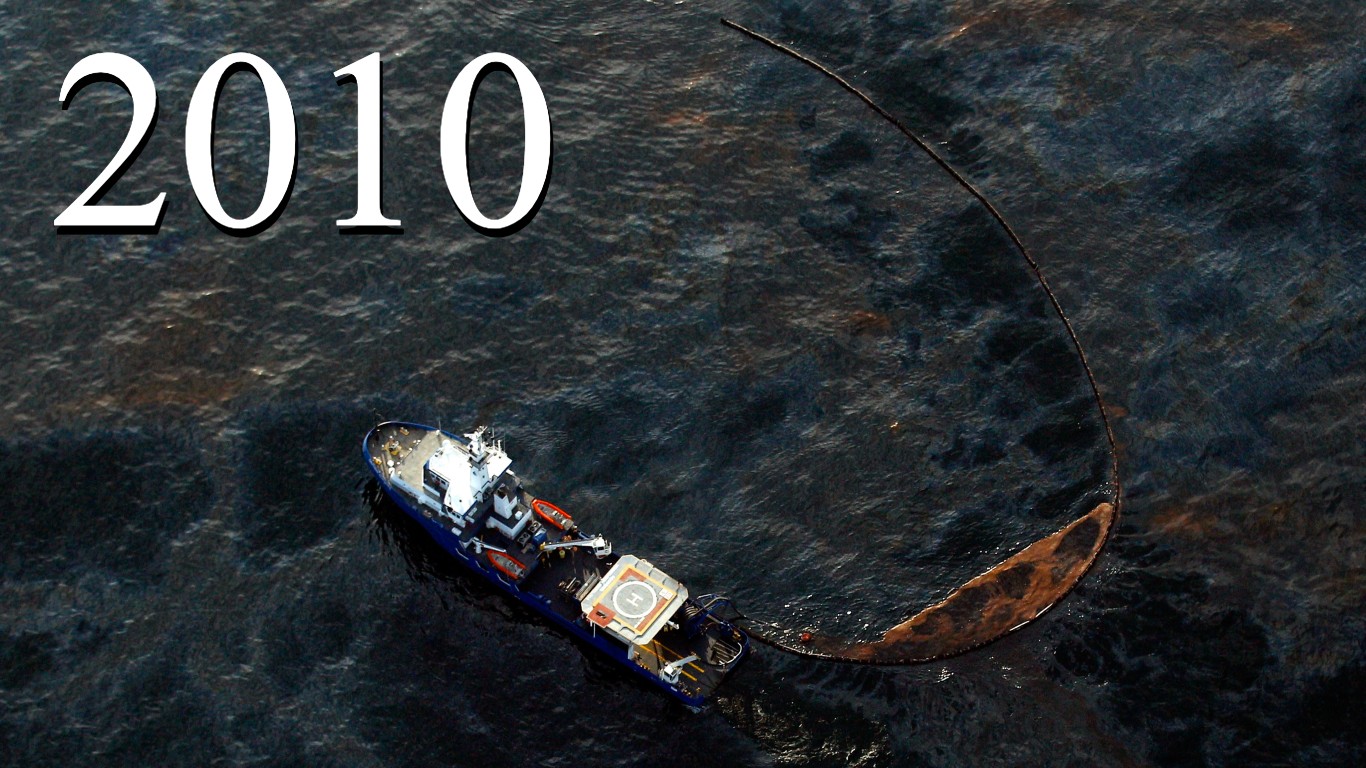
Source: Chris Graythen / Getty Images
2010: $738.01 billion
> Increase from previous year: 4.55% – #25 largest Increase on list
[in-text-ad]

Source: Majid Saeedi / Getty Images
2011: $752.29 billion
> Increase from previous year: 1.93% – #34 largest Increase on list
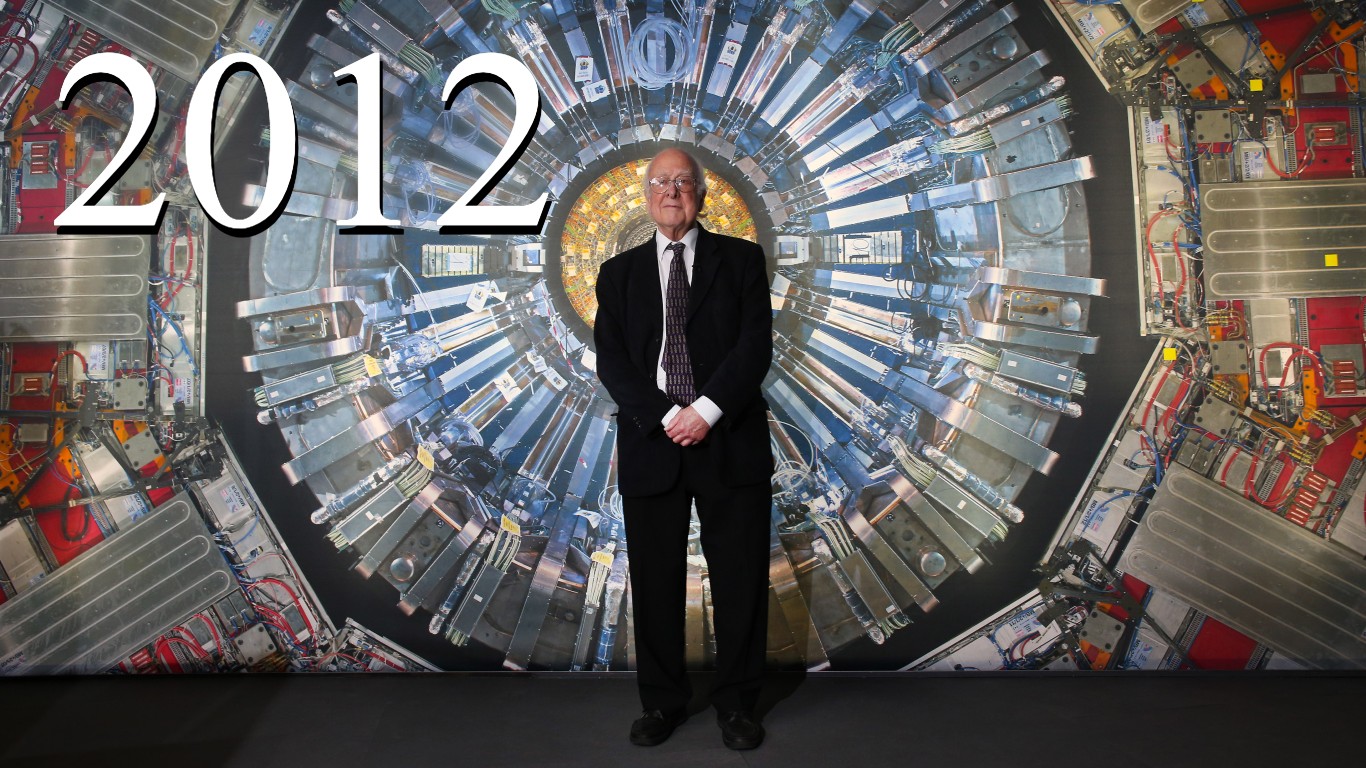
Source: Peter Macdiarmid / Getty Images
2012: $725.21 billion
> Increase from previous year: -3.60% – #48 largest Increase on list
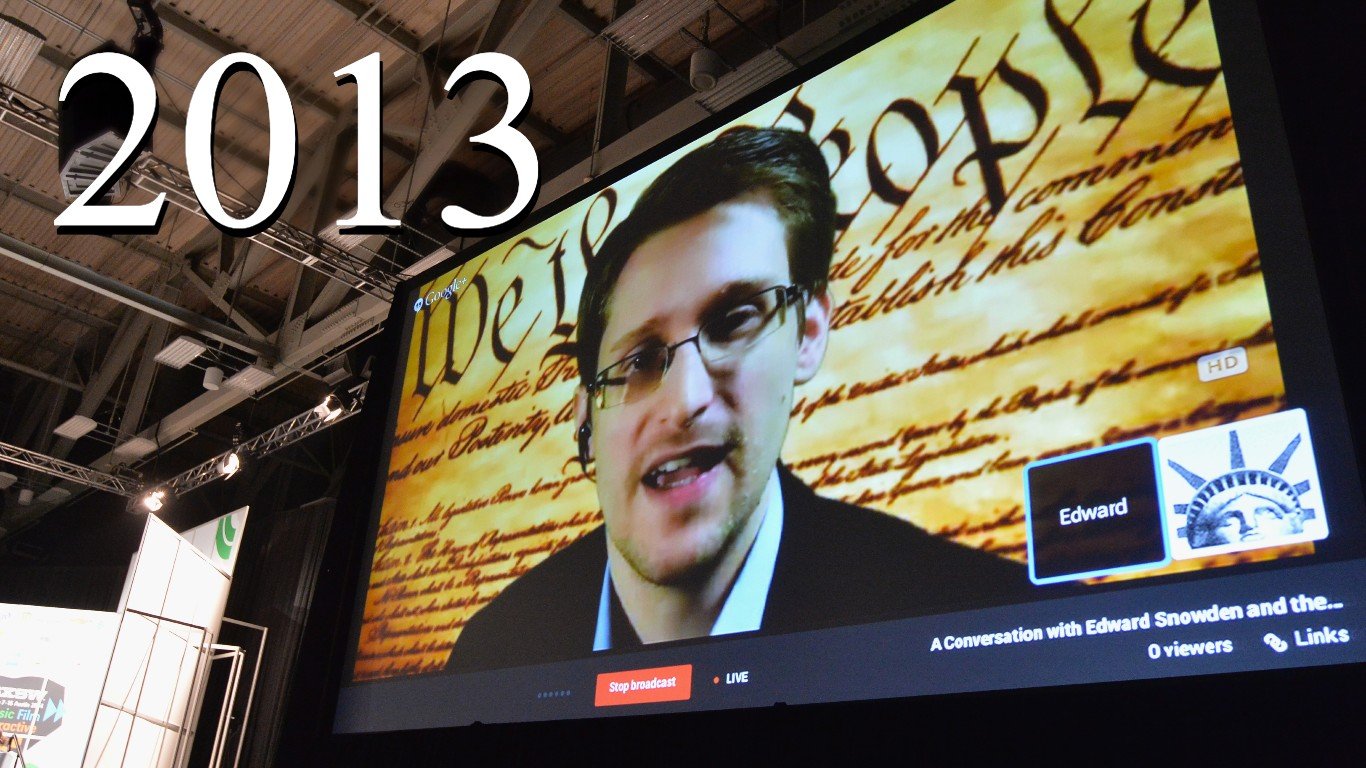
Source: Michael Buckner / Getty Images
2013: $679.23 billion
> Increase from previous year: -6.34% – #52 largest increase on list
[in-text-ad-2]
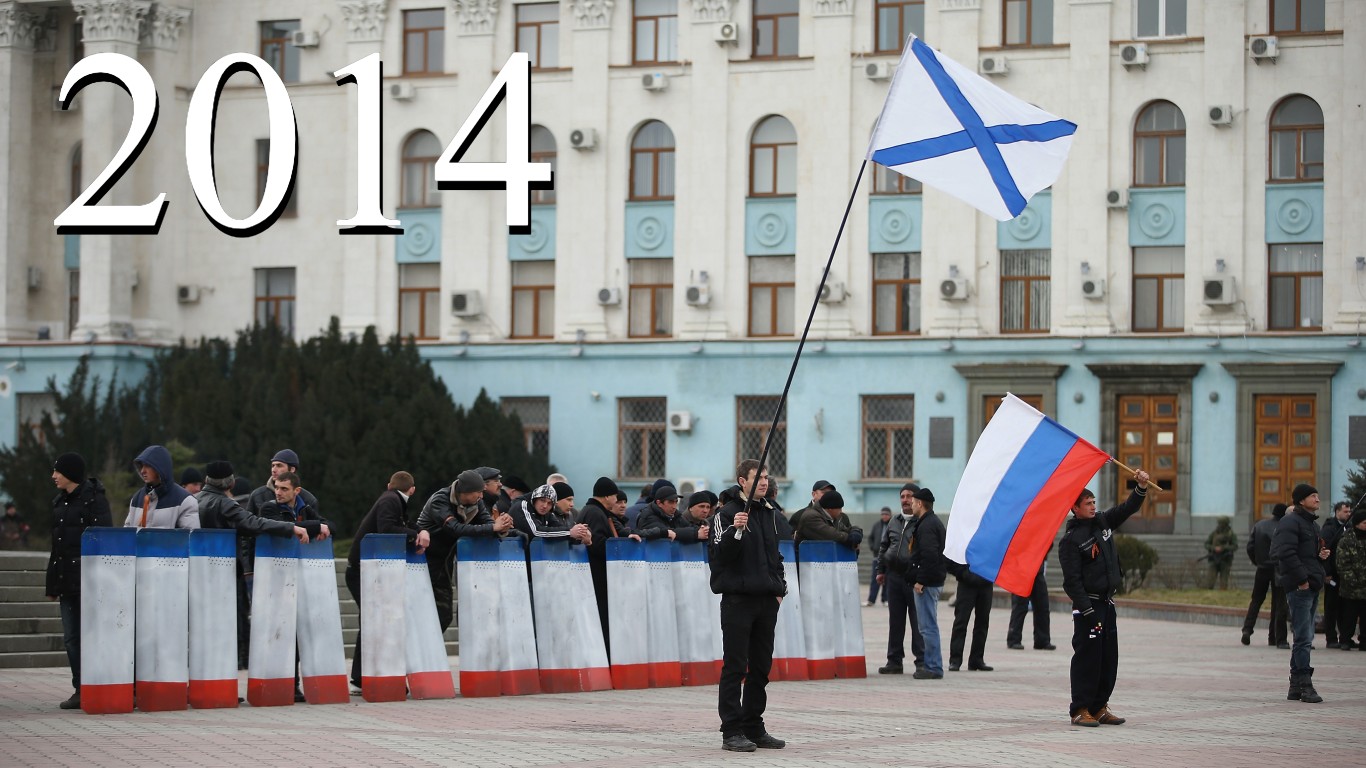
Source: Sean Gallup / Getty Images
2014: $647.79 billion
> Increase from previous year: -4.63% – #50 largest Increase on list
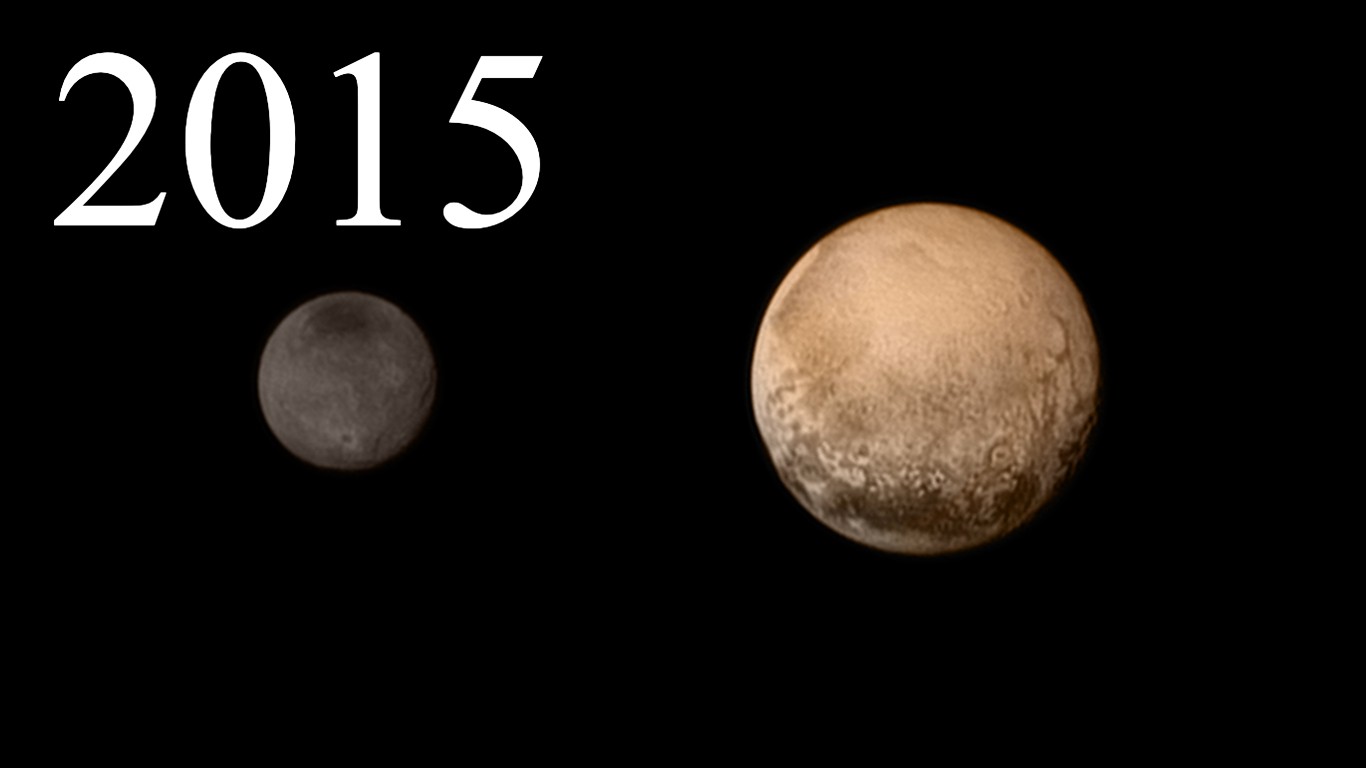
Source: NASA / Getty Images
2015: $633.83 billion
> Increase from previous year: -2.16% – #44 largest Increase on list
[in-text-ad]
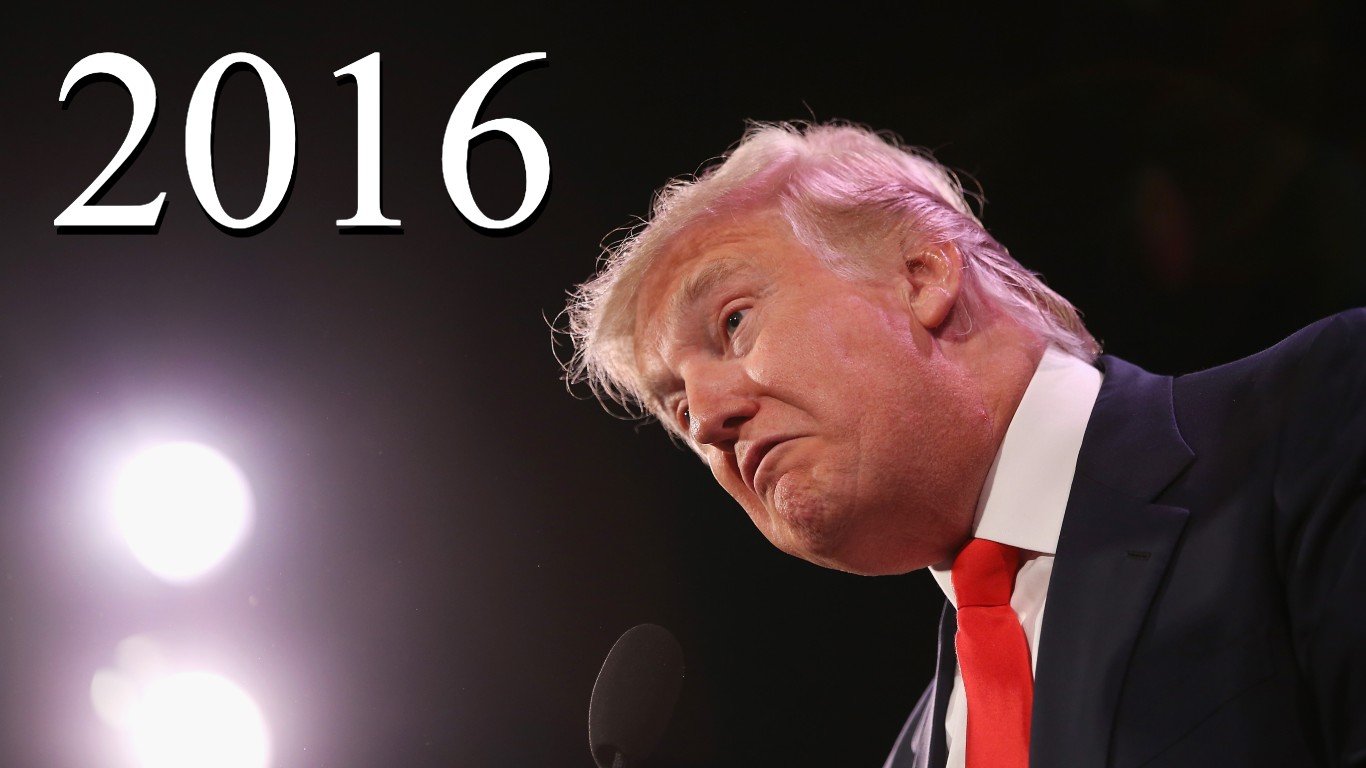
Source: Scott Olson / Getty Images
2016: $639.86 billion
> Increase from previous year: 0.95% – #39 largest Increase on list
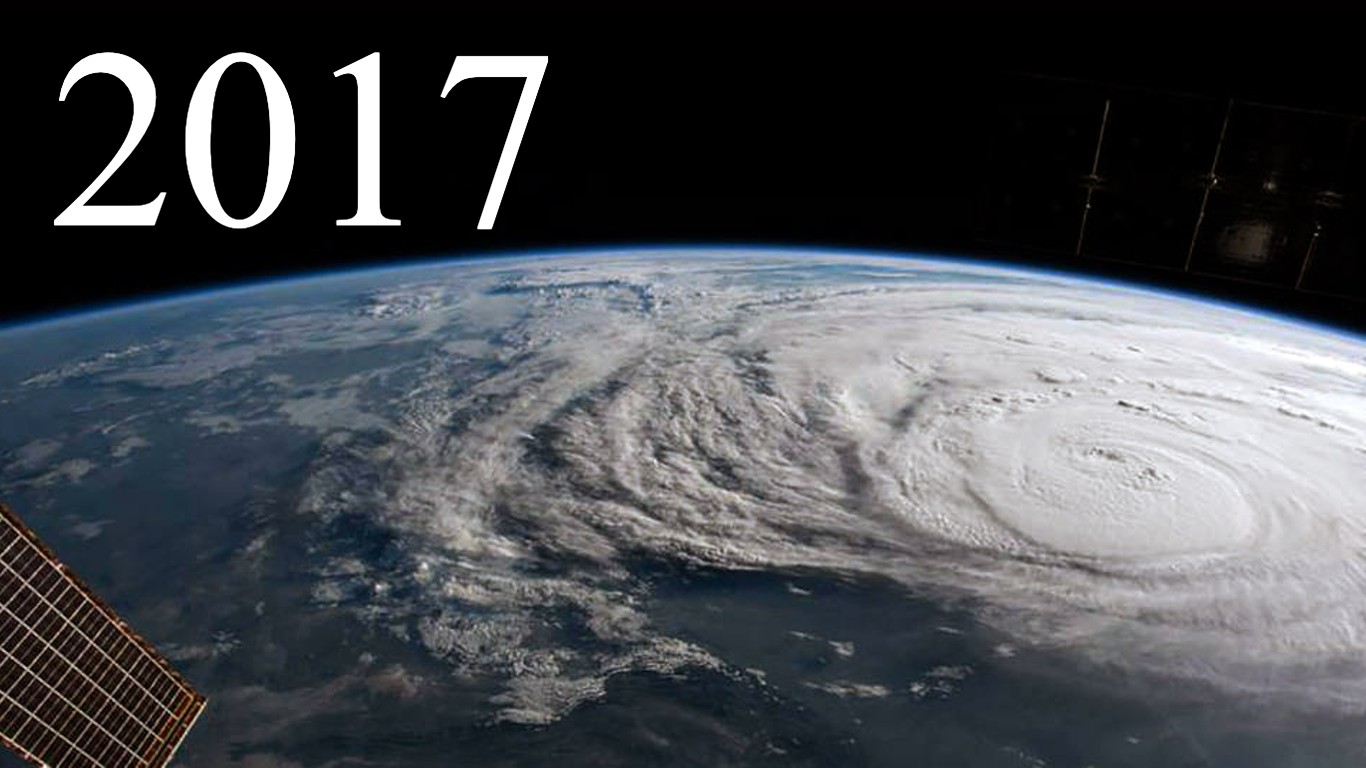
Source: NASA / Getty Images
2017: $646.75 billion
> Increase from previous year: 1.08% – #37 largest Increase on list

Source: Justin Sullivan / Getty Images
2018: $682.49 billion
> Increase from previous year: 5.53% – #23 largest Increase on list
[in-text-ad-2]
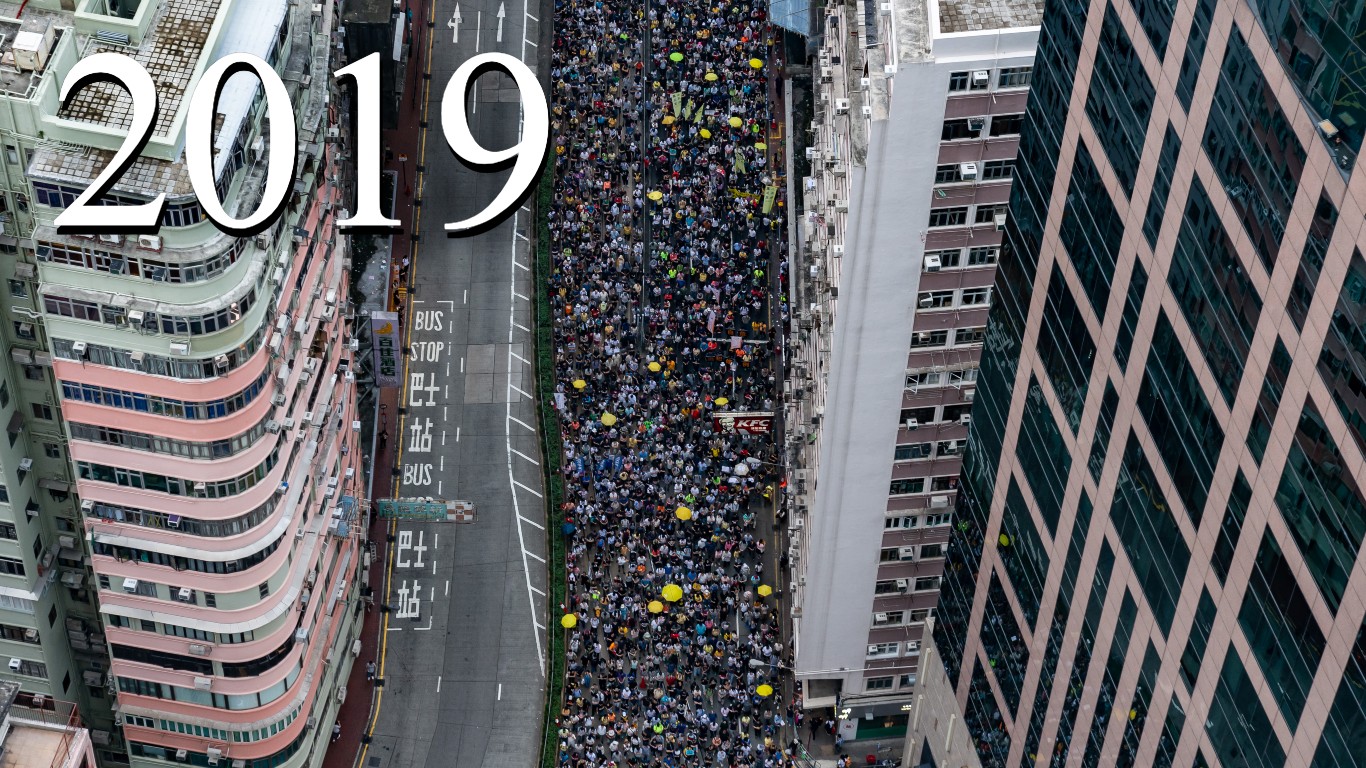
Source: Anthony Kwan / Getty Images
2019: $734.34 billion
> Increase from previous year: 7.60% – #18 largest Increase on list

Source: flyparade / Getty Images
2020: $778.40 billion
> Increase from previous year: 6.00% – #21 largest Increase on list
[in-text-ad]
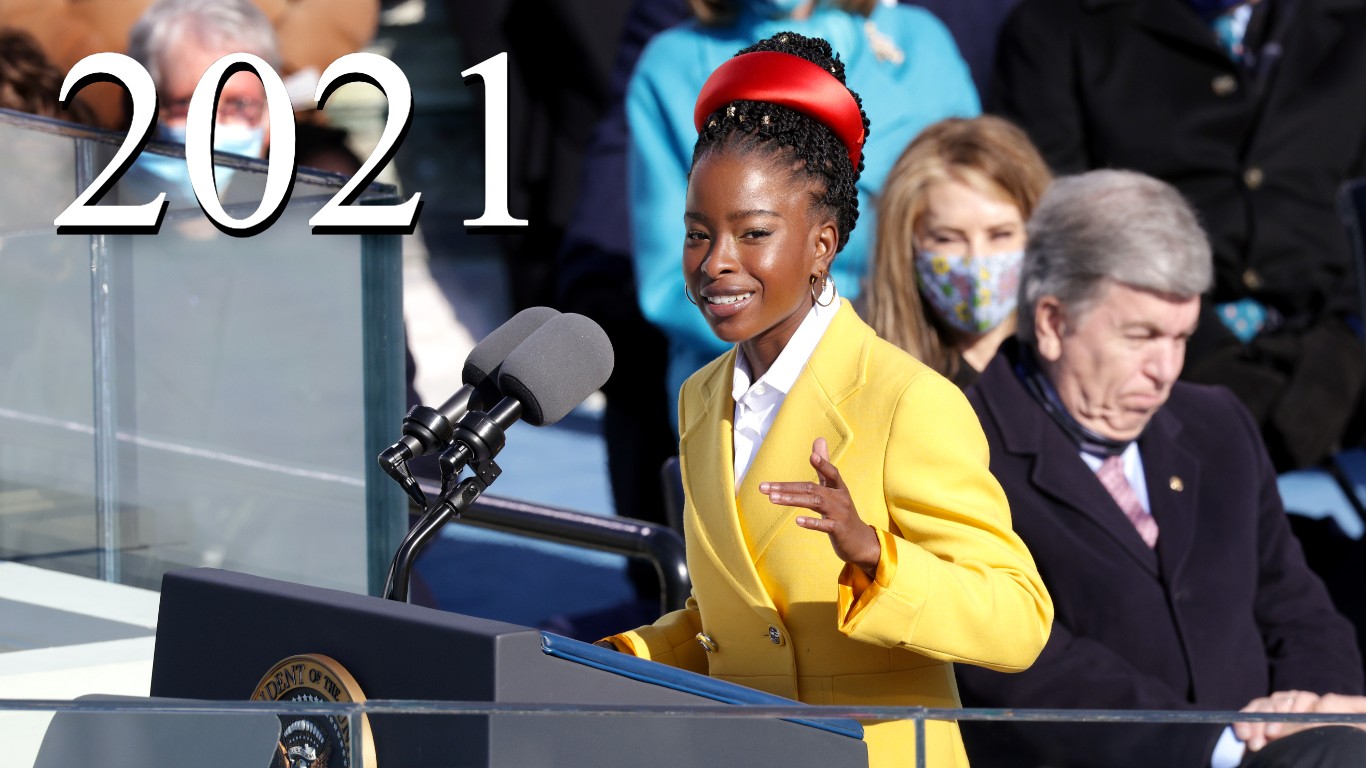
Source: Alex Wong / Getty Images
2021: $806.23 billion
> Increase from previous year: 3.60% – #28 largest Increase on list

Source: romrodinka / Getty Images
2022: $876.94 billion
> Increase from previous year: 8.77% – #13 largest Increase on list
Essential Tips for Investing: Sponsored
A financial advisor can help you understand the advantages and disadvantages of investment properties. Finding a qualified financial advisor doesn’t have to be hard. SmartAsset’s free tool matches you with up to three financial advisors who serve your area, and you can interview your advisor matches at no cost to decide which one is right for you. If you’re ready to find an advisor who can help you achieve your financial goals, get started now.
Investing in real estate can diversify your portfolio. But expanding your horizons may add additional costs. If you’re an investor looking to minimize expenses, consider checking out online brokerages. They often offer low investment fees, helping you maximize your profit.
Thank you for reading! Have some feedback for us?
Contact the 24/7 Wall St. editorial team.
Editors' Picks