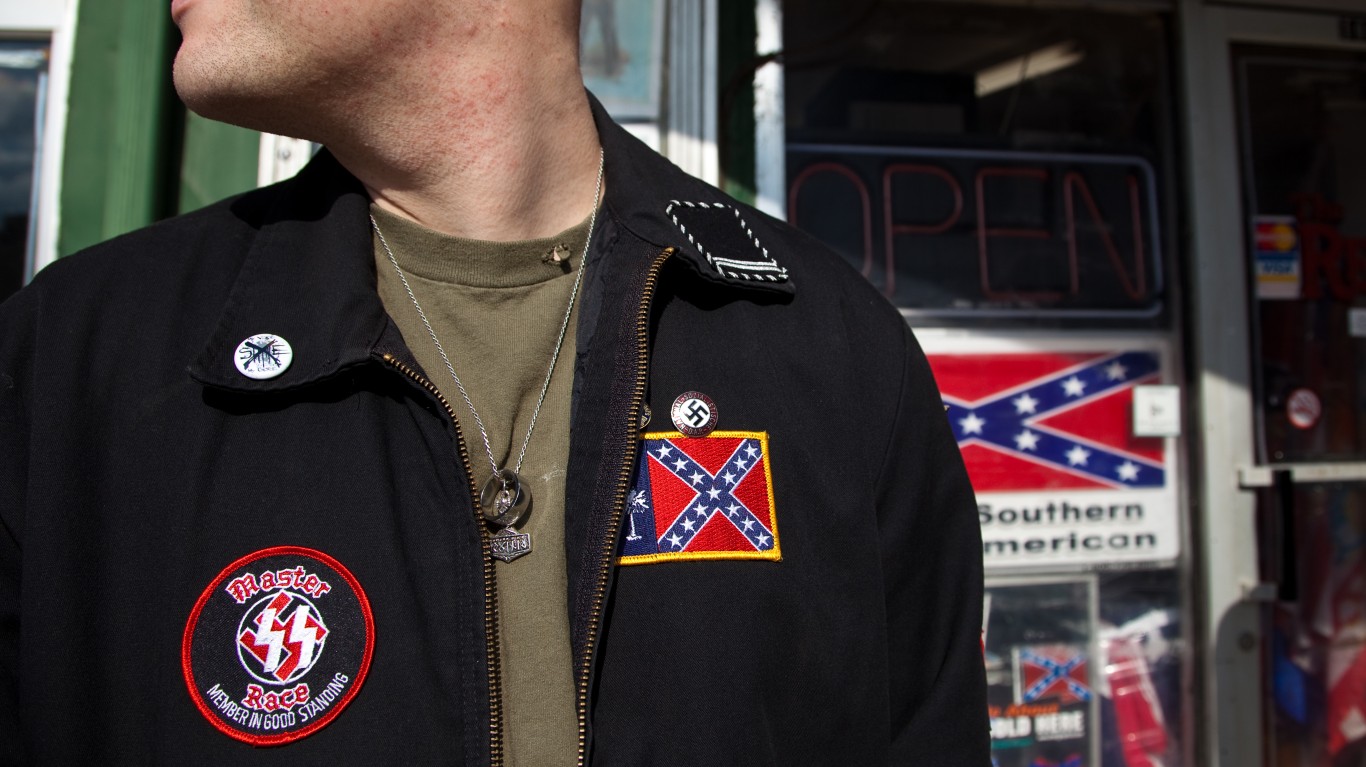
Domestic terrorism and violent extremism is a growing threat in the United States. The FBI had 9,049 open domestic terrorism cases in fiscal 2021, up 357% from the number of open domestic terrorism cases in fiscal 2013. Many of the most violent incidents of domestic terrorism in the U.S. today are carried out by individuals who have been radicalized by racist, homophobic, ethnocentric, or anti-government ideologies – ideologies widely propagated by extremist hate groups.
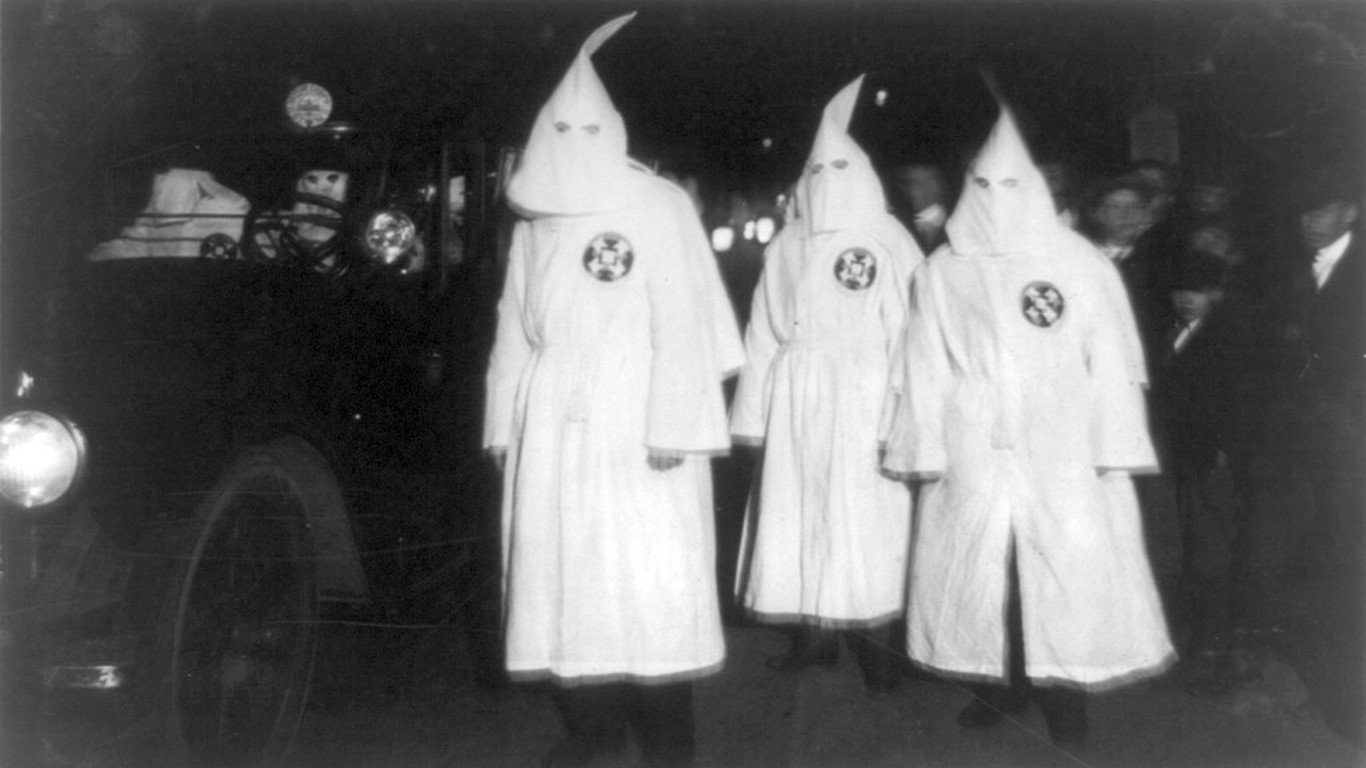
According to the Southern Poverty Law Center, a nonprofit legal advocacy group, there were 1,224 active hate and anti-government groups in the U.S. in 2022. These groups include those with distinct chapters in cities across the country, such as the Proud Boys, the Oath Keepers, the Ku Klux Klan, and ACT for America. While specific views vary between these and other groups, they are generally all galvanized by curtailing government power or hatred toward individuals of certain races, religions, ethnicities, or sexual orientations.
These groups are active in each of the 50 states, but in some parts of the country, they are far more common than in others.
Using data from the SPLC report The Year in Hate & Extremism 2022, 24/7 Wall St. identified the states with the most hate groups. States are ranked by the total number of extremist anti-government and hate groups for every million residents. Population figures used for our calculation are from the U.S. Census Bureau’s 2021 American Community Survey.
Nationwide, there are 3.7 hate groups for every 1 million Americans. Depending on the state, the number of hate groups ranges from 1.5 to 15.5 per million people. In the last year alone, the number of known hate groups climbed in all but six states. The largest increases were reported in Wyoming, New Mexico, Iowa, and Utah, states that saw an increase of at least 350% in the number of hate groups each. (These are the states where the Proud Boys grew the most since January 6.)
The places with the highest concentration of active hate groups tend to be sparsely populated states in the West and Midwest. Still, three of the 10 states with highest concentration of hate and anti-government extremist groups are in the Northeast. Delaware, meanwhile, is the only Southern state to rank among the top 10 states by hate group concentration. (These are the states with the most January 6 rioters being charged.)
Click here to see states with the most hate groups.

50. Louisiana
> Hate groups in 2022: 1.5 per million people (7 total)
> Hate groups in 2021: #10 most, with 3.2 per million people (15 total)
> Population: 4,624,047
> Most common ideologies: Anti Government Movement (3), Neo-Confederate (1)
> State demographic makeup: 56.9% white; 31.0% Black; 4.3% foreign born
[in-text-ad]

49. Massachusetts
> Hate groups in 2022: 1.6 per million people (11 total)
> Hate groups in 2021: #34 most, with 2.0 per million people (14 total)
> Population: 6,984,723
> Most common ideologies: Anti Government Movement (6), Anti-LGBTQ (2), White Nationalist (1)
> State demographic makeup: 67.5% white; 6.3% Black; 17.6% foreign born
[recirclink id=1196328]

48. Kansas
> Hate groups in 2022: 2 per million people (6 total)
> Hate groups in 2021: #46 most, with 1.4 per million people (4 total)
> Population: 2,934,582
> Most common ideologies: Anti Government Movement (3), White Nationalist (1)
> State demographic makeup: 73.4% white; 5.1% Black; 6.9% foreign born

47. Kentucky
> Hate groups in 2022: 2 per million people (9 total)
> Hate groups in 2021: #35 most, with 2.0 per million people (9 total)
> Population: 4,509,394
> Most common ideologies: Anti Government Movement (3), General Hate (2), Neo-Völkisch (1)
> State demographic makeup: 82.7% white; 7.1% Black; 4.0% foreign born
[in-text-ad-2]
46. Georgia
> Hate groups in 2022: 2.2 per million people (24 total)
> Hate groups in 2021: #31 most, with 2.2 per million people (24 total)
> Population: 10,799,566
> Most common ideologies: Anti Government Movement (13), White Nationalist (3), Anti-LGBTQ (2)
> State demographic makeup: 50.2% white; 30.4% Black; 10.0% foreign born

45. Texas
> Hate groups in 2022: 2.4 per million people (72 total)
> Hate groups in 2021: #41 most, with 1.8 per million people (52 total)
> Population: 29,527,941
> Most common ideologies: Anti Government Movement (39), General Hate (10), Anti-LGBTQ (5)
> State demographic makeup: 39.4% white; 11.6% Black; 17.2% foreign born
[in-text-ad]
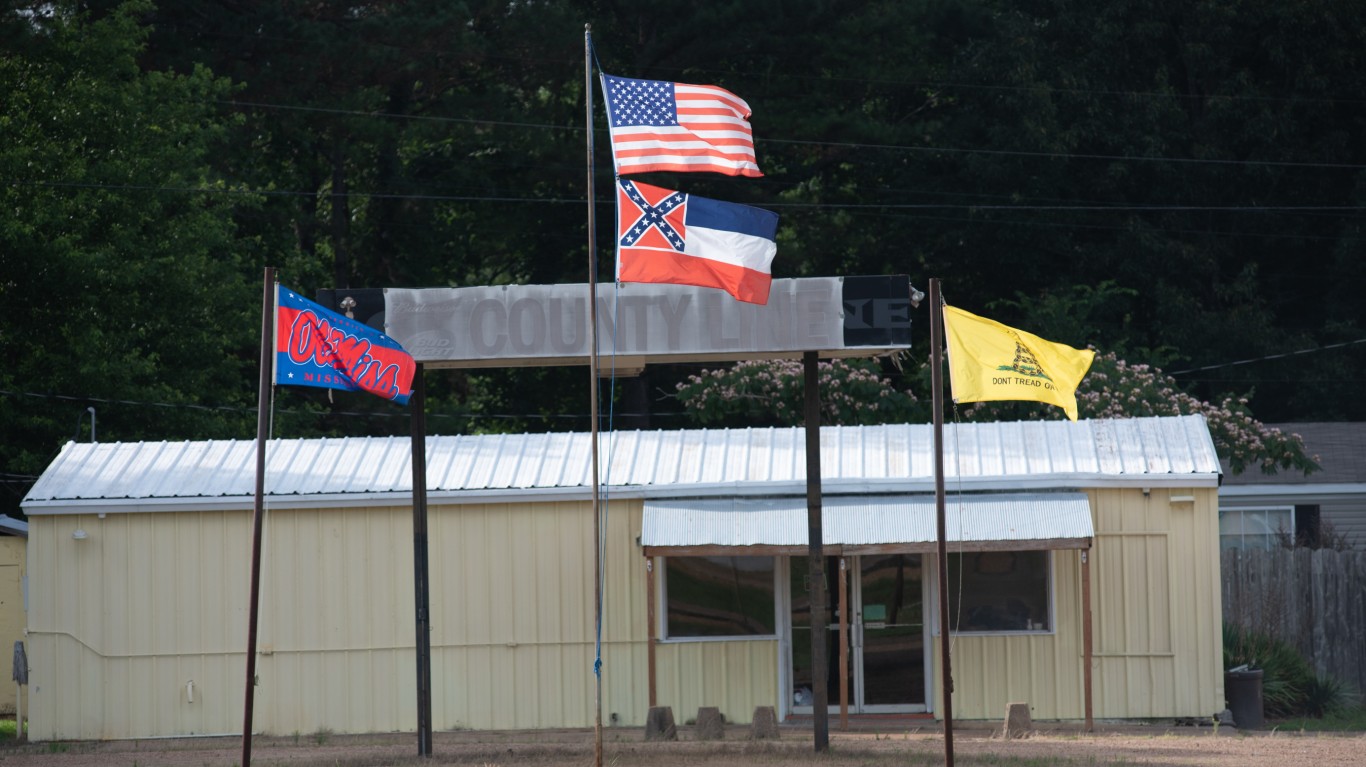
44. Mississippi
> Hate groups in 2022: 2.4 per million people (7 total)
> Hate groups in 2021: #21 most, with 2.7 per million people (8 total)
> Population: 2,949,965
> Most common ideologies: Anti Government Movement (4), White Nationalist (1)
> State demographic makeup: 55.4% white; 36.0% Black; 2.1% foreign born
[recirclink id=1151827]

43. New Jersey
> Hate groups in 2022: 2.4 per million people (22 total)
> Hate groups in 2021: #47 most, with 1.3 per million people (12 total)
> Population: 9,267,130
> Most common ideologies: Anti Government Movement (16), White Nationalist (2), Anti-Immigrant (1)
> State demographic makeup: 52.1% white; 12.3% Black; 23.0% foreign born

42. New Mexico
> Hate groups in 2022: 2.4 per million people (5 total)
> Hate groups in 2021: #50 most, with 0.5 per million people (1 total)
> Population: 2,115,877
> Most common ideologies: Anti Government Movement (4), White Nationalist (1)
> State demographic makeup: 34.9% white; 1.7% Black; 9.1% foreign born
[in-text-ad-2]

41. California
> Hate groups in 2022: 2.6 per million people (103 total)
> Hate groups in 2021: #43 most, with 1.7 per million people (65 total)
> Population: 39,237,836
> Most common ideologies: Anti Government Movement (57), General Hate (15), Anti-Muslim (8)
> State demographic makeup: 34.3% white; 5.3% Black; 26.6% foreign born

40. Alabama
> Hate groups in 2022: 2.6 per million people (13 total)
> Hate groups in 2021: #24 most, with 2.6 per million people (13 total)
> Population: 5,039,877
> Most common ideologies: Anti Government Movement (8), Neo-Confederate (2)
> State demographic makeup: 64.2% white; 25.8% Black; 3.5% foreign born
[in-text-ad]

39. New York
> Hate groups in 2022: 2.7 per million people (53 total)
> Hate groups in 2021: #40 most, with 1.8 per million people (35 total)
> Population: 19,835,913
> Most common ideologies: Anti Government Movement (25), General Hate (12), White Nationalist (4)
> State demographic makeup: 53.5% white; 13.4% Black; 22.3% foreign born
[recirclink id=1264671]

38. Illinois
> Hate groups in 2022: 2.8 per million people (35 total)
> Hate groups in 2021: #37 most, with 1.8 per million people (23 total)
> Population: 12,671,469
> Most common ideologies: Anti Government Movement (17), Anti-LGBTQ (4)
> State demographic makeup: 58.9% white; 13.4% Black; 14.2% foreign born

37. Michigan
> Hate groups in 2022: 2.9 per million people (29 total)
> Hate groups in 2021: #38 most, with 1.8 per million people (18 total)
> Population: 10,050,811
> Most common ideologies: Anti Government Movement (19), White Nationalist (3)
> State demographic makeup: 72.9% white; 13.2% Black; 6.8% foreign born
[in-text-ad-2]

36. Connecticut
> Hate groups in 2022: 3.1 per million people (11 total)
> Hate groups in 2021: #36 most, with 1.9 per million people (7 total)
> Population: 3,605,597
> Most common ideologies: Anti Government Movement (7), White Nationalist (1)
> State demographic makeup: 62.7% white; 9.9% Black; 15.2% foreign born

35. Oklahoma
> Hate groups in 2022: 3.3 per million people (13 total)
> Hate groups in 2021: #30 most, with 2.3 per million people (9 total)
> Population: 3,986,639
> Most common ideologies: Anti Government Movement (9), Neo-Völkisch (1)
> State demographic makeup: 62.8% white; 6.7% Black; 5.8% foreign born
[in-text-ad]

34. Minnesota
> Hate groups in 2022: 3.3 per million people (19 total)
> Hate groups in 2021: #44 most, with 1.6 per million people (9 total)
> Population: 5,707,390
> Most common ideologies: Anti Government Movement (11), Neo-Völkisch (2)
> State demographic makeup: 76.9% white; 6.7% Black; 8.5% foreign born
[recirclink id=1055224]

33. Wisconsin
> Hate groups in 2022: 3.6 per million people (21 total)
> Hate groups in 2021: #33 most, with 2.0 per million people (12 total)
> Population: 5,895,908
> Most common ideologies: Anti Government Movement (13), Neo-Völkisch (2)
> State demographic makeup: 79.0% white; 6.1% Black; 5.1% foreign born

32. Missouri
> Hate groups in 2022: 3.6 per million people (22 total)
> Hate groups in 2021: #19 most, with 2.8 per million people (17 total)
> Population: 6,168,187
> Most common ideologies: Anti Government Movement (12), General Hate (4), White Nationalist (2)
> State demographic makeup: 76.6% white; 10.7% Black; 4.1% foreign born
[in-text-ad-2]

31. Washington
> Hate groups in 2022: 3.7 per million people (29 total)
> Hate groups in 2021: #25 most, with 2.5 per million people (19 total)
> Population: 7,738,692
> Most common ideologies: Anti Government Movement (13), Anti-LGBTQ (3)
> State demographic makeup: 64.3% white; 3.9% Black; 14.8% foreign born

30. Nevada
> Hate groups in 2022: 3.8 per million people (12 total)
> Hate groups in 2021: #17 most, with 2.9 per million people (9 total)
> Population: 3,143,991
> Most common ideologies: Anti Government Movement (6), General Hate (2), Neo-Völkisch (1)
> State demographic makeup: 45.2% white; 8.7% Black; 18.4% foreign born
[in-text-ad]

29. Iowa
> Hate groups in 2022: 3.8 per million people (12 total)
> Hate groups in 2021: #48 most, with 0.6 per million people (2 total)
> Population: 3,193,079
> Most common ideologies: Anti Government Movement (10), White Nationalist (1)
> State demographic makeup: 83.0% white; 3.5% Black; 5.4% foreign born
[recirclink id=1198140]

28. Florida
> Hate groups in 2022: 4.1 per million people (89 total)
> Hate groups in 2021: #26 most, with 2.4 per million people (53 total)
> Population: 21,781,128
> Most common ideologies: Anti Government Movement (54), General Hate (11), Anti-LGBTQ (6)
> State demographic makeup: 51.1% white; 14.6% Black; 21.2% foreign born

27. North Carolina
> Hate groups in 2022: 4.1 per million people (43 total)
> Hate groups in 2021: #22 most, with 2.7 per million people (28 total)
> Population: 10,551,162
> Most common ideologies: Anti Government Movement (27), General Hate (5), Neo-Confederate (3)
> State demographic makeup: 60.9% white; 19.9% Black; 8.2% foreign born
[in-text-ad-2]

26. Maryland
> Hate groups in 2022: 4.1 per million people (25 total)
> Hate groups in 2021: #39 most, with 1.8 per million people (11 total)
> Population: 6,165,129
> Most common ideologies: Anti Government Movement (15), General Hate (4), Neo-Confederate (1)
> State demographic makeup: 47.8% white; 29.0% Black; 15.9% foreign born

25. Indiana
> Hate groups in 2022: 4.3 per million people (29 total)
> Hate groups in 2021: #32 most, with 2.1 per million people (14 total)
> Population: 6,805,985
> Most common ideologies: Anti Government Movement (16), White Nationalist (3), Neo-Völkisch (2)
> State demographic makeup: 76.6% white; 8.7% Black; 5.6% foreign born
[in-text-ad]

24. Vermont
> Hate groups in 2022: 4.6 per million people (3 total)
> Hate groups in 2021: #12 most, with 3.1 per million people (2 total)
> Population: 645,570
> Most common ideologies: Anti Government Movement (2), White Nationalist (1), Neo-Völkisch(0)
> State demographic makeup: 90.6% white; 1.0% Black; 4.2% foreign born
[recirclink id=1196328]

23. Ohio
> Hate groups in 2022: 4.7 per million people (55 total)
> Hate groups in 2021: #42 most, with 1.7 per million people (20 total)
> Population: 11,780,017
> Most common ideologies: Anti Government Movement (35), Anti-LGBTQ (4)
> State demographic makeup: 76.6% white; 11.8% Black; 5.0% foreign born

22. Tennessee
> Hate groups in 2022: 4.7 per million people (33 total)
> Hate groups in 2021: #4 most, with 4.0 per million people (28 total)
> Population: 6,975,218
> Most common ideologies: Anti Government Movement (12), White Nationalist (4), Neo-Nazi (3)
> State demographic makeup: 72.1% white; 15.4% Black; 5.3% foreign born
[in-text-ad-2]

21. Virginia
> Hate groups in 2022: 5 per million people (43 total)
> Hate groups in 2021: #28 most, with 2.3 per million people (20 total)
> Population: 8,642,274
> Most common ideologies: Anti Government Movement (28), White Nationalist (5), General Hate (3)
> State demographic makeup: 59.2% white; 18.0% Black; 12.4% foreign born

20. West Virginia
> Hate groups in 2022: 5 per million people (9 total)
> Hate groups in 2021: #8 most, with 3.4 per million people (6 total)
> Population: 1,782,959
> Most common ideologies: Anti Government Movement (3), Anti Government Movement (3), Neo-Völkisch (1)
> State demographic makeup: 90.4% white; 2.8% Black; 1.6% foreign born
[in-text-ad]

19. Colorado
> Hate groups in 2022: 5.3 per million people (31 total)
> Hate groups in 2021: #13 most, with 3.1 per million people (18 total)
> Population: 5,812,069
> Most common ideologies: Anti Government Movement (17), Anti-LGBTQ (4)
> State demographic makeup: 65.2% white; 3.7% Black; 9.8% foreign born
[recirclink id=1151827]
 .
.
18. Arkansas
> Hate groups in 2022: 5.3 per million people (16 total)
> Hate groups in 2021: #15 most, with 3.0 per million people (9 total)
> Population: 3,025,891
> Most common ideologies: Anti Government Movement (9), White Nationalist (3), Neo-Völkisch (1)
> State demographic makeup: 68.2% white; 14.7% Black; 4.7% foreign born

17. Arizona
> Hate groups in 2022: 5.4 per million people (39 total)
> Hate groups in 2021: #14 most, with 3.0 per million people (22 total)
> Population: 7,276,316
> Most common ideologies: Anti Government Movement (21), Anti-LGBTQ (5), White Nationalist (4)
> State demographic makeup: 52.0% white; 4.3% Black; 12.6% foreign born
[in-text-ad-2]
16. Utah
> Hate groups in 2022: 5.4 per million people (18 total)
> Hate groups in 2021: #49 most, with 0.6 per million people (2 total)
> Population: 3,337,975
> Most common ideologies: Anti Government Movement (16), White Nationalist (1)
> State demographic makeup: 76.0% white; 1.0% Black; 8.3% foreign born

15. Alaska
> Hate groups in 2022: 5.5 per million people (4 total)
> Hate groups in 2021: #45 most, with 1.4 per million people (1 total)
> Population: 732,673
> Most common ideologies: Anti Government Movement (3), Neo-Völkisch (1)
> State demographic makeup: 57.9% white; 2.9% Black; 8.1% foreign born
[in-text-ad]

14. Hawaii
> Hate groups in 2022: 5.5 per million people (8 total)
> Hate groups in 2021: #18 most, with 2.8 per million people (4 total)
> Population: 1,441,553
> Most common ideologies: Anti Government Movement (6), Neo-Nazi (1), > State demographic makeup: 20.8% white; 1.8% Black; 18.8% foreign born
[recirclink id=1264671]

13. Pennsylvania
> Hate groups in 2022: 5.6 per million people (72 total)
> Hate groups in 2021: #29 most, with 2.3 per million people (30 total)
> Population: 12,964,056
> Most common ideologies: Anti Government Movement (51), White Nationalist (7), Neo-Nazi (3)
> State demographic makeup: 73.6% white; 10.2% Black; 7.2% foreign born

12. Oregon
> Hate groups in 2022: 5.7 per million people (24 total)
> Hate groups in 2021: #27 most, with 2.4 per million people (10 total)
> Population: 4,246,155
> Most common ideologies: Anti Government Movement (14), General Hate (4), White Nationalist (3)
> State demographic makeup: 72.0% white; 1.8% Black; 9.7% foreign born
[in-text-ad-2]

Charleston, South Carolina, USA in the French Quarter.
11. South Carolina
> Hate groups in 2022: 5.8 per million people (30 total)
> Hate groups in 2021: #9 most, with 3.3 per million people (17 total)
> Population: 5,190,705
> Most common ideologies: Anti Government Movement (18), White Nationalist (5), Neo-Völkisch (2)
> State demographic makeup: 62.6% white; 24.9% Black; 5.2% foreign born

10. Nebraska
> Hate groups in 2022: 6.1 per million people (12 total)
> Hate groups in 2021: #1 most, with 4.6 per million people (9 total)
> Population: 1,963,692
> Most common ideologies: Anti Government Movement (4), Neo-Nazi (3), White Nationalist (1)
> State demographic makeup: 76.4% white; 4.6% Black; 7.4% foreign born
[in-text-ad]

9. Rhode Island
> Hate groups in 2022: 6.4 per million people (7 total)
> Hate groups in 2021: #20 most, with 2.7 per million people (3 total)
> Population: 1,095,610
> Most common ideologies: Anti Government Movement (4), White Nationalist (1)
> State demographic makeup: 68.9% white; 4.5% Black; 14.5% foreign born
[recirclink id=1055224]

8. Maine
> Hate groups in 2022: 6.6 per million people (9 total)
> Hate groups in 2021: #16 most, with 2.9 per million people (4 total)
> Population: 1,372,247
> Most common ideologies: Anti Government Movement (4), White Nationalist (2), Neo-Völkisch (1)
> State demographic makeup: 90.0% white; 1.5% Black; 4.1% foreign born

7. Delaware
> Hate groups in 2022: 7 per million people (7 total)
> Hate groups in 2021: #5 most, with 4.0 per million people (4 total)
> Population: 1,003,384
> Most common ideologies: Anti Government Movement (5), White Nationalist (1)
> State demographic makeup: 59.3% white; 20.5% Black; 10.1% foreign born
[in-text-ad-2]
6. South Dakota
> Hate groups in 2022: 8.9 per million people (8 total)
> Hate groups in 2021: #2 most, with 4.5 per million people (4 total)
> Population: 895,376
> Most common ideologies: Anti Government Movement (4), White Nationalist (2), Neo-Nazi (1)
> State demographic makeup: 80.0% white; 1.9% Black; 3.5% foreign born

5. North Dakota
> Hate groups in 2022: 10.3 per million people (8 total)
> Hate groups in 2021: #23 most, with 2.6 per million people (2 total)
> Population: 774,948
> Most common ideologies: Anti Government Movement (3), Neo-Völkisch (2), White Nationalist (1)
> State demographic makeup: 82.3% white; 2.9% Black; 4.4% foreign born
[in-text-ad]

4. New Hampshire
> Hate groups in 2022: 10.8 per million people (15 total)
> Hate groups in 2021: #3 most, with 4.3 per million people (6 total)
> Population: 1,388,992
> Most common ideologies: Anti Government Movement (8), White Nationalist (2)
> State demographic makeup: 87.3% white; 1.3% Black; 5.9% foreign born
[recirclink id=1198140]

3. Montana
> Hate groups in 2022: 10.9 per million people (12 total)
> Hate groups in 2021: #6 most, with 3.6 per million people (4 total)
> Population: 1,104,271
> Most common ideologies: Anti Government Movement (6), White Nationalist (2)
> State demographic makeup: 83.8% white; 0.5% Black; 2.2% foreign born

2. Idaho
> Hate groups in 2022: 11 per million people (21 total)
> Hate groups in 2021: #11 most, with 3.2 per million people (6 total)
> Population: 1,900,923
> Most common ideologies: Anti Government Movement (12), General Hate (2), Neo-Völkisch (1)
> State demographic makeup: 78.7% white; 0.7% Black; 6.1% foreign born
[in-text-ad-2]

1. Wyoming
> Hate groups in 2022: 15.5 per million people (9 total)
> Hate groups in 2021: #7 most, with 3.5 per million people (2 total)
> Population: 578,803
> Most common ideologies: Anti Government Movement (6), White Nationalist (1)
> State demographic makeup: 81.5% white; 1.0% Black; 3.4% foreign born
Contact [email protected] for any questions or corrections.