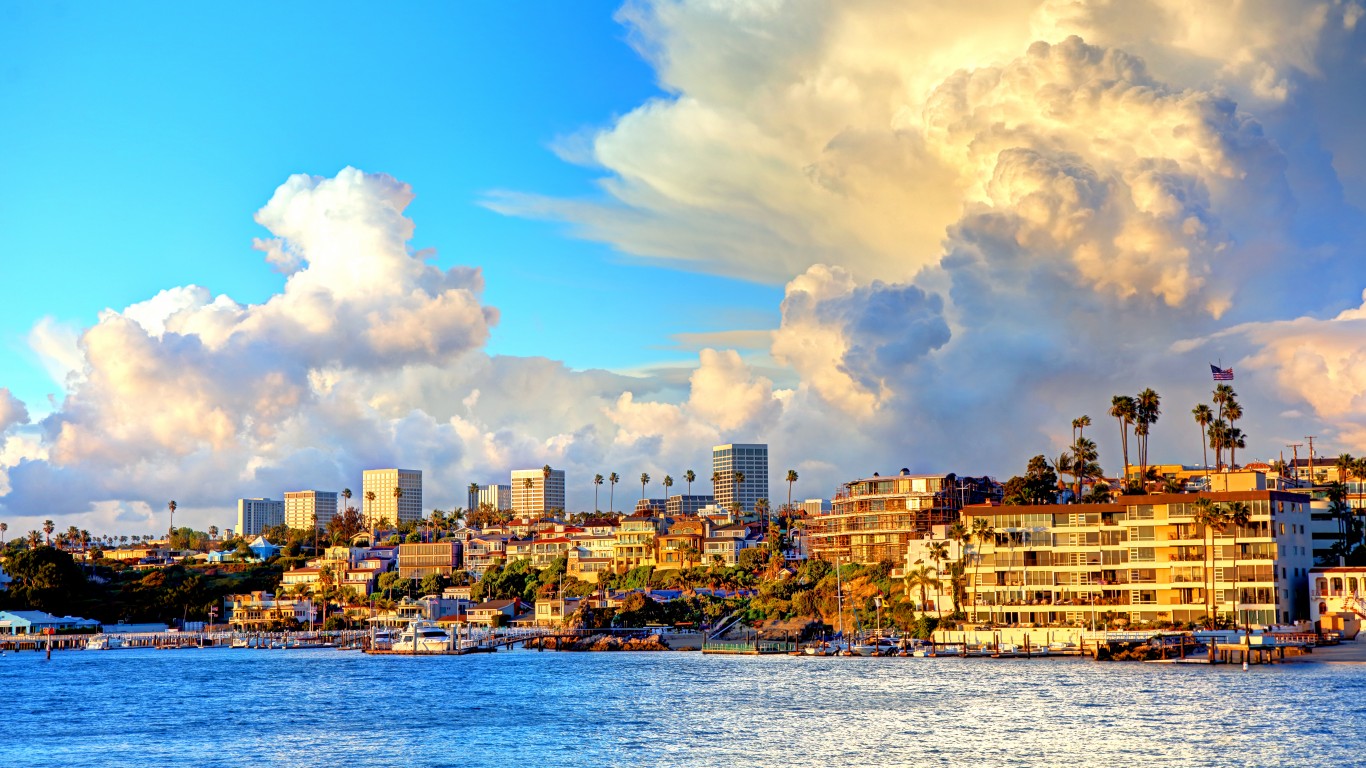
Blessed with fair year-round weather and its proximity to the economic powerhouse of Hollywood, Santa Barbara has for decades attracted the rich and famous. George Lucas, Oprah Winfrey, and Ellen DeGeneres are among the A-listers who live in this wealthy California enclave situated between the scenic Santa Ynez Mountains and the Pacific Ocean.
This American Riviera is not the only metropolitan area nationwide where a large share of the population are quite wealthy. To identify the 34 cities where most people make more than $90,000 a year, 24/7 Wall St. reviewed median household annual income data in the 384 metropolitan statistical areas — an area that can include adjacent cities and communities — tracked by the U.S. Census Bureau’s from the 2022 American Community Survey. The national annual median household income is $74,755. (Conversely, here are America’s 26 poorest large cities.)
While median household income in the Santa Maria-Santa Barbara metropolitan statistical area that stretches from the coast inland toward Bakersfield is $90,894, the area also has the highest poverty rate among the 34 cities on the list. The metro area’s poverty rate of 14.4% is considerably higher than the national poverty rate of 12.6%, according to the ACS, illustrating that America’s affluent communities often are in proximity to poor ones.
Eleven of the metropolitan areas with the highest median household income are located in California. This makes sense considering California is the most populous state in the country and has a gross domestic product of more than $3.7 trillion, representing 14% of the U.S. economy. Of course, California is not without its share of financially struggling communities.
Among the metro areas with the highest median household incomes, six include state capitals, led by Boston, where the median household income is $104,299. Households in and near San Jose, California, lead the country in this metric, with a median household income that is almost double the national median. (Also see: cities that attracted the most new residents last year.)
Three of the affluent metropolitan areas on the list have poverty rates above the national average. Two are in California and the third in the New York City metro area, where the median household income is $91,562 and the poverty rate is 12.8%.
Here are the 34 cities with households earning more than $90,000 per year.
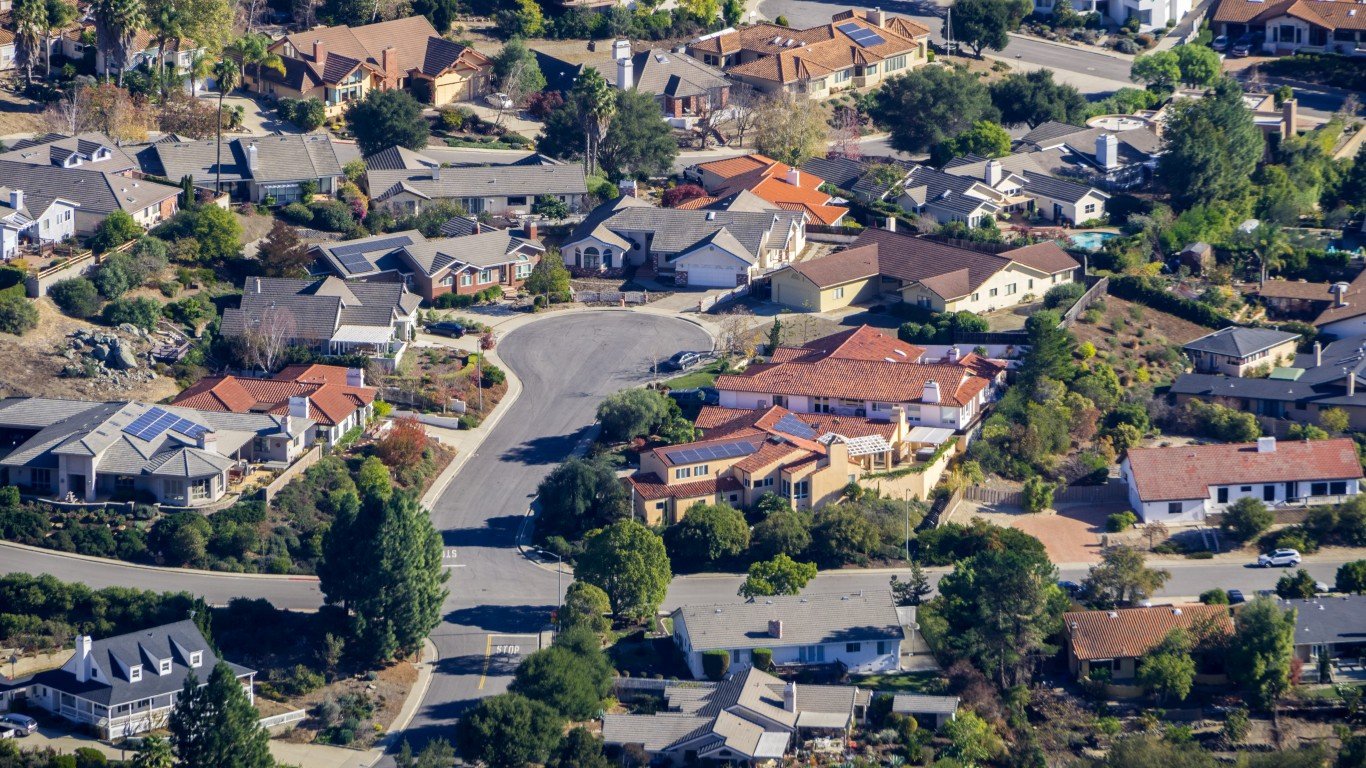
34. San Luis Obispo-Paso Robles, CA
> Median household annual income: $90,216
> Households with incomes $200,000 or more: 16,937 (15.2%% of households – #28 highest out of 382 MSAs)
> People in households with incomes under poverty line: 32,721 (12.2%% – #232 highest out of 382 MSAs)
> Population: 282,013 – #28 largest MSA
[in-text-ad]

33. Baltimore-Columbia-Towson, MD
> Median household annual income: $90,505
> Households with incomes $200,000 or more: 186,349 (16.5%% of households – #22 highest out of 382 MSAs)
> People in households with incomes under poverty line: 282,038 (10.1%% – #313 highest out of 382 MSAs)
> Population: 2,835,672 – #9 largest MSA
[recirclink id=1316240]
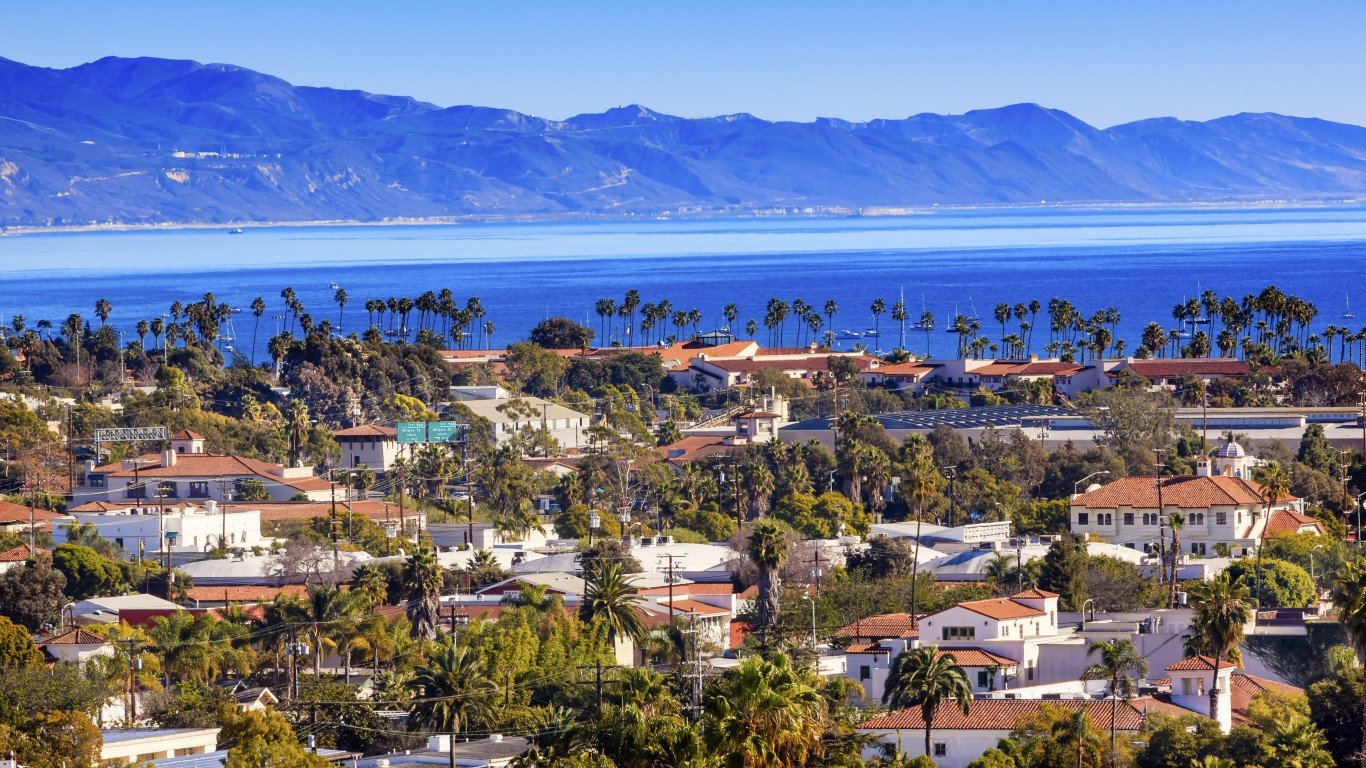
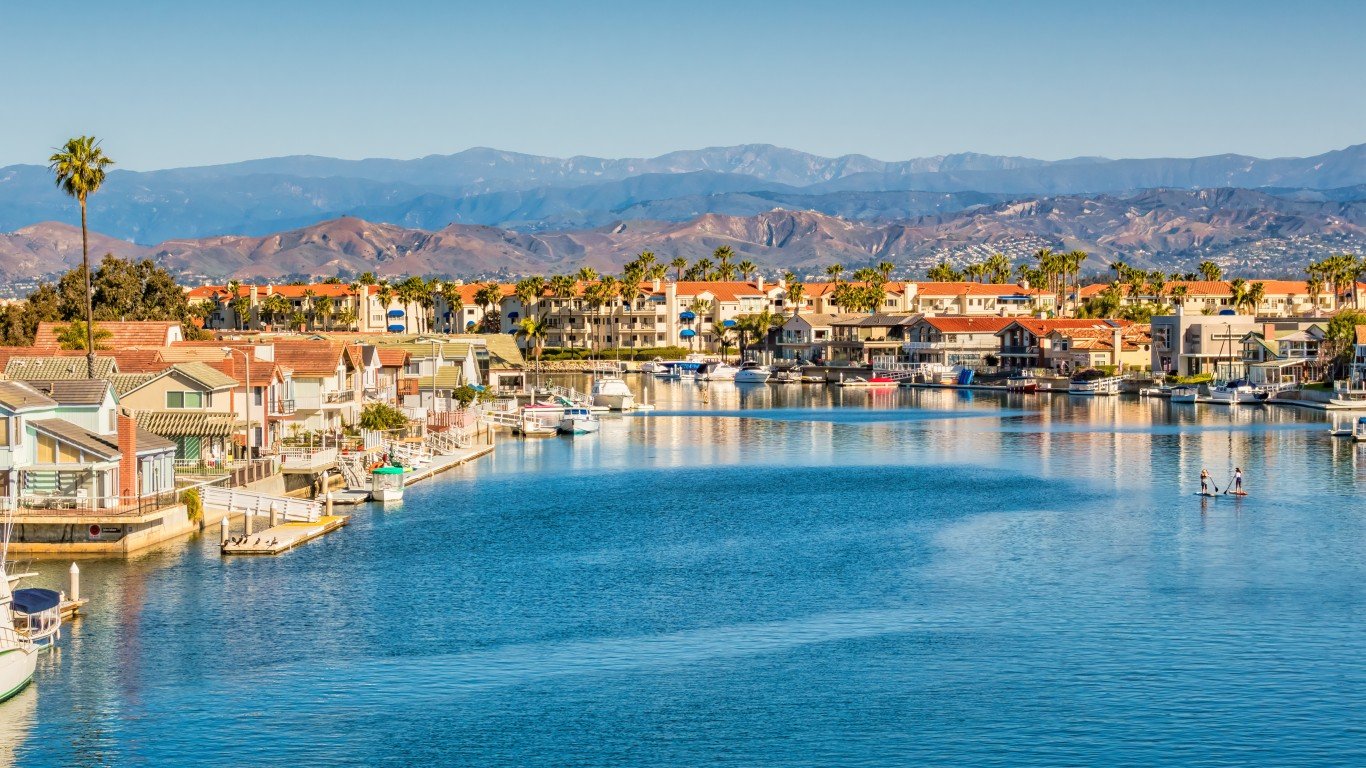
32. Santa Maria-Santa Barbara, CA
> Median household annual income: $90,894
> Households with incomes $200,000 or more: 27,770 (18.4%% of households – #14 highest out of 382 MSAs)
> People in households with incomes under poverty line: 60,837 (14.4%% – #144 highest out of 382 MSAs)
> Population: 443,837 – #21 largest MSA

31. Minneapolis-St. Paul-Bloomington, MN-WI
> Median household annual income: $91,341
> Households with incomes $200,000 or more: 214,549 (14.5%% of households – #34 highest out of 382 MSAs)
> People in households with incomes under poverty line: 318,350 (8.8%% – #356 highest out of 382 MSAs)
> Population: 3,693,729 – #6 largest MSA
[in-text-ad-2]

30. Barnstable Town, MA
> Median household annual income: $91,438
> Households with incomes $200,000 or more: 17,610 (16.4%% of households – #23 highest out of 382 MSAs)
> People in households with incomes under poverty line: 15,801 (6.9%% – #381 highest out of 382 MSAs)
> Population: 232,457 – #31 largest MSA

29. New York-Newark-Jersey City, NY-NJ-PA
> Median household annual income: $91,562
> Households with incomes $200,000 or more: 1,454,593 (19.5%% of households – #11 highest out of 382 MSAs)
> People in households with incomes under poverty line: 2,467,826 (12.8%% – #201 highest out of 382 MSAs)
> Population: 19,617,869 – #1 largest MSA
[in-text-ad]
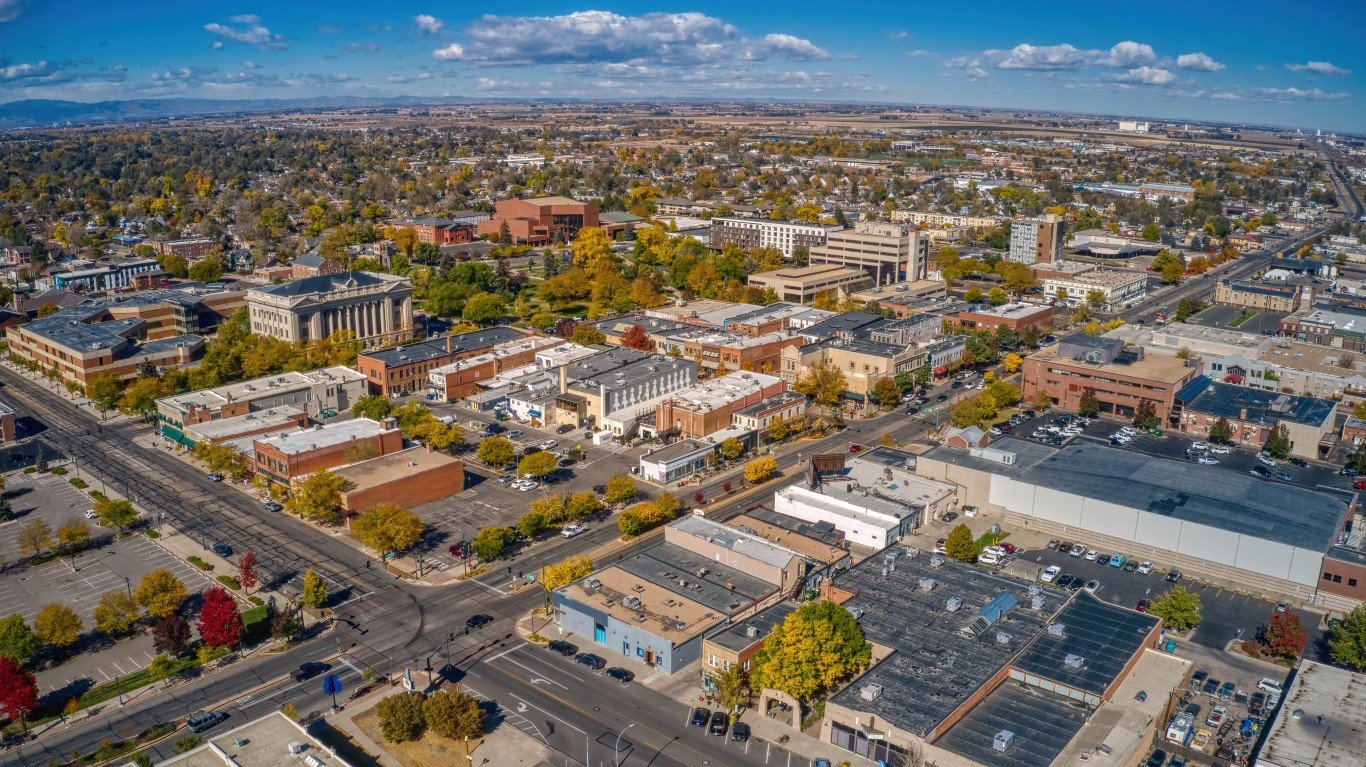
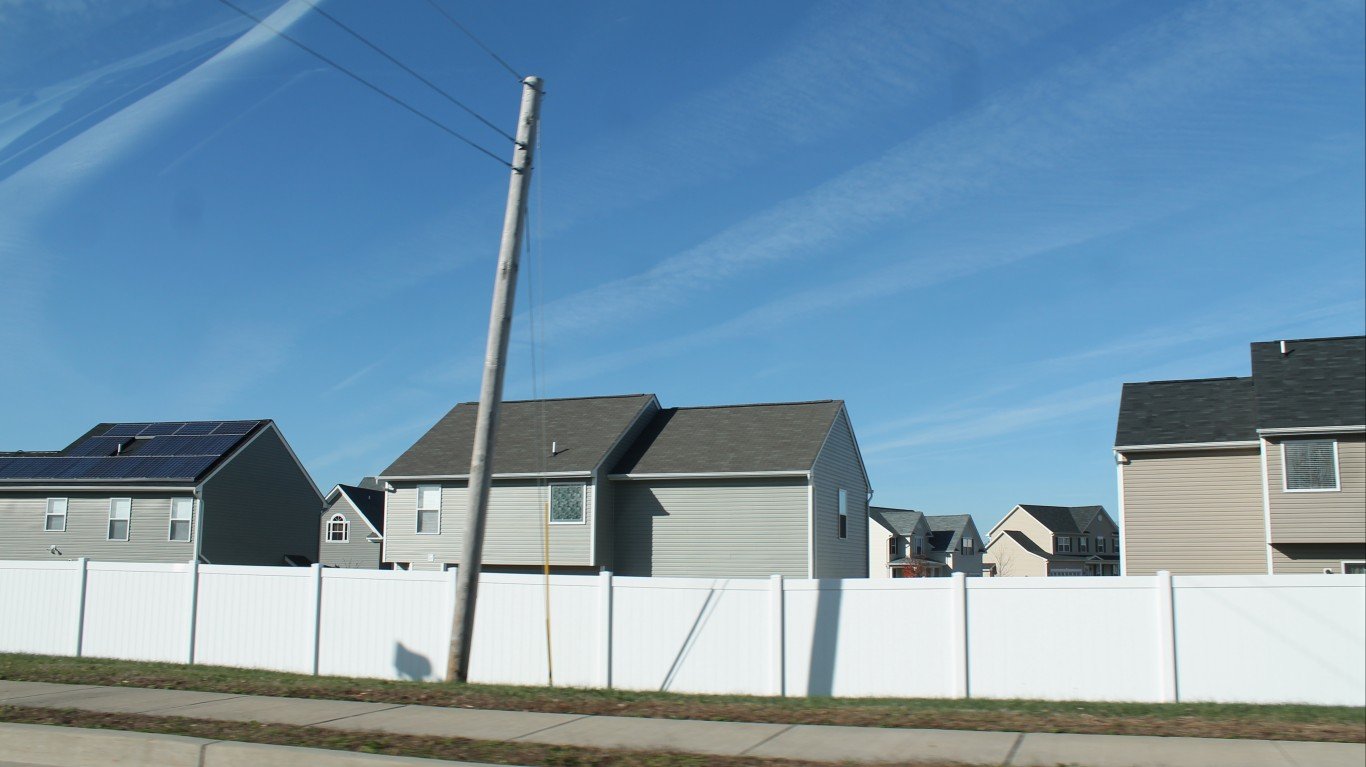
28. Greeley, CO
> Median household annual income: $91,565
> Households with incomes $200,000 or more: 15,820 (12.8%% of households – #52 highest out of 382 MSAs)
> People in households with incomes under poverty line: 30,807 (8.9%% – #349 highest out of 382 MSAs)
> Population: 350,176 – #26 largest MSA
[recirclink id=1304208]
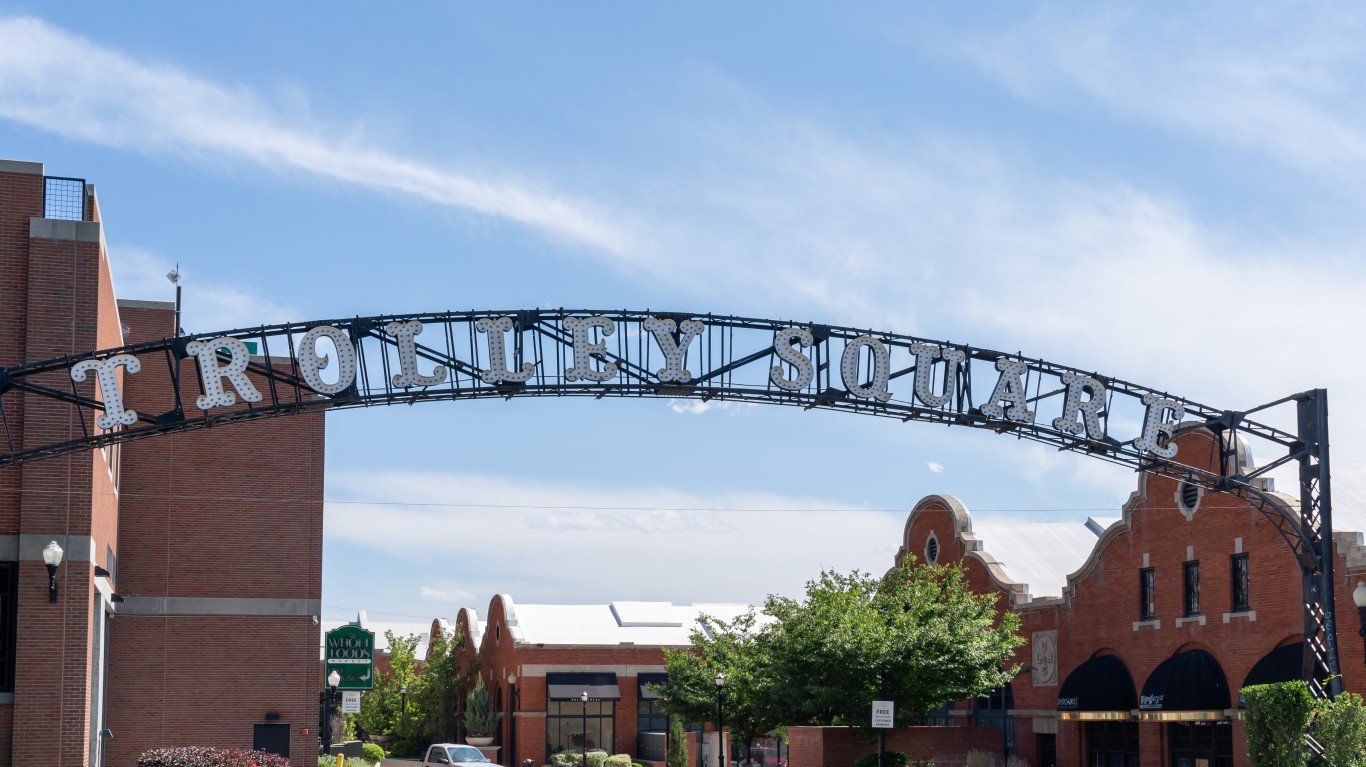
27. Salt Lake City, UT
> Median household annual income: $91,891
> Households with incomes $200,000 or more: 58,867 (13.1%% of households – #47 highest out of 382 MSAs)
> People in households with incomes under poverty line: 92,125 (7.4%% – #376 highest out of 382 MSAs)
> Population: 1,266,191 – #13 largest MSA
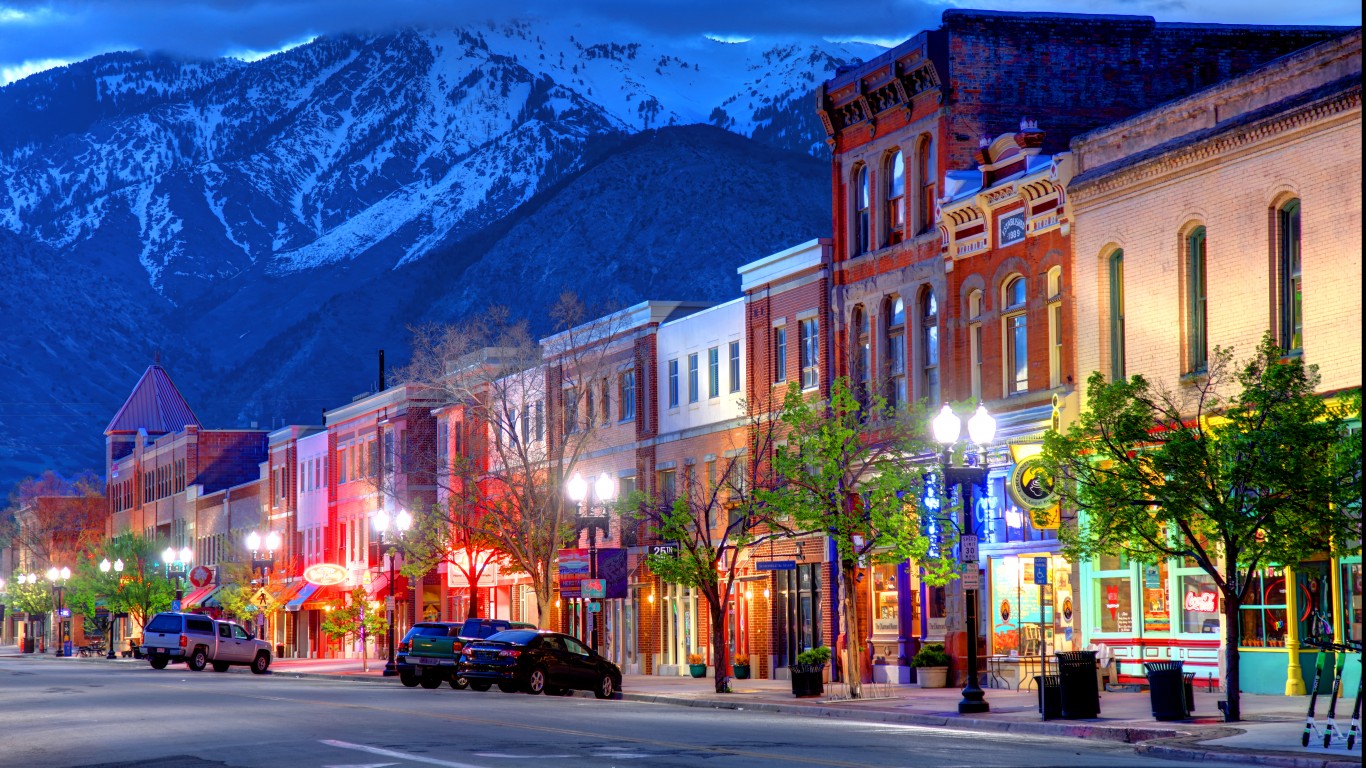
26. Ogden-Clearfield, UT
> Median household annual income: $92,600
> Households with incomes $200,000 or more: 27,381 (11.6%% of households – #66 highest out of 382 MSAs)
> People in households with incomes under poverty line: 50,439 (7.1%% – #380 highest out of 382 MSAs)
> Population: 714,919 – #17 largest MSA
[in-text-ad-2]

25. Raleigh-Cary, NC
> Median household annual income: $92,739
> Households with incomes $200,000 or more: 87,109 (15.6%% of households – #27 highest out of 382 MSAs)
> People in households with incomes under poverty line: 114,884 (7.9%% – #372 highest out of 382 MSAs)
> Population: 1,484,338 – #12 largest MSA
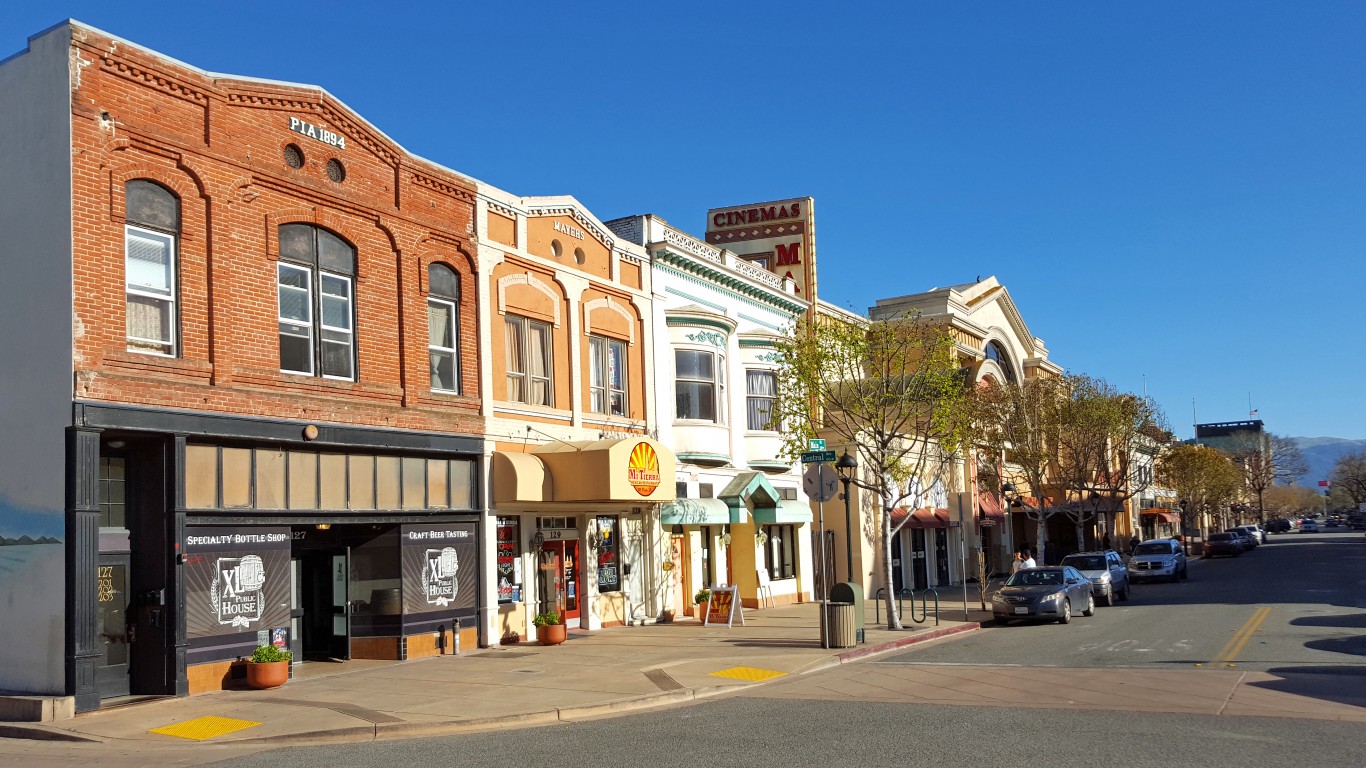
24. Salinas, CA
> Median household annual income: $92,840
> Households with incomes $200,000 or more: 17,036 (12.9%% of households – #49 highest out of 382 MSAs)
> People in households with incomes under poverty line: 49,826 (12.0%% – #237 highest out of 382 MSAs)
> Population: 432,858 – #22 largest MSA
[in-text-ad]
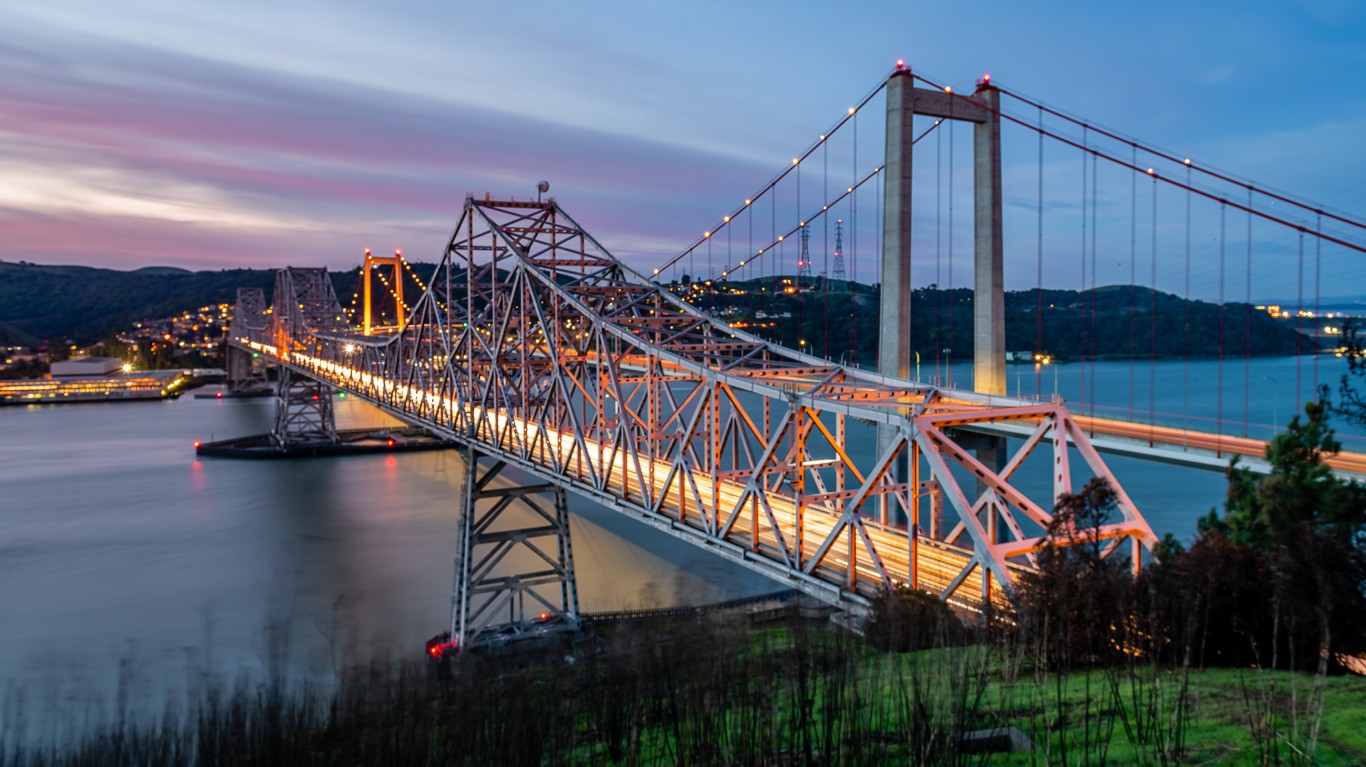
23. Vallejo, CA
> Median household annual income: $92,959
> Households with incomes $200,000 or more: 23,486 (14.7%% of households – #32 highest out of 382 MSAs)
> People in households with incomes under poverty line: 44,216 (10.1%% – #316 highest out of 382 MSAs)
> Population: 448,747 – #20 largest MSA
[recirclink id=1315580]

22. Austin-Round Rock-Georgetown, TX
> Median household annual income: $94,604
> Households with incomes $200,000 or more: 175,533 (17.6%% of households – #18 highest out of 382 MSAs)
> People in households with incomes under poverty line: 223,947 (9.4%% – #335 highest out of 382 MSAs)
> Population: 2,421,115 – #10 largest MSA

21. Kahului-Wailuku-Lahaina, HI
> Median household annual income: $94,760
> Households with incomes $200,000 or more: 9,508 (16.6%% of households – #21 highest out of 382 MSAs)
> People in households with incomes under poverty line: 13,326 (8.2%% – #366 highest out of 382 MSAs)
> Population: 164,365 – #32 largest MSA
[in-text-ad-2]

20. Bremerton-Silverdale-Port Orchard, WA
> Median household annual income: $94,775
> Households with incomes $200,000 or more: 14,916 (13.7%% of households – #39 highest out of 382 MSAs)
> People in households with incomes under poverty line: 26,790 (9.9%% – #322 highest out of 382 MSAs)
> Population: 277,673 – #29 largest MSA

19. Trenton-Princeton, NJ
> Median household annual income: $95,668
> Households with incomes $200,000 or more: 28,258 (19.5%% of households – #10 highest out of 382 MSAs)
> People in households with incomes under poverty line: 39,485 (10.9%% – #288 highest out of 382 MSAs)
> Population: 380,688 – #25 largest MSA
[in-text-ad]

18. Provo-Orem, UT
> Median household annual income: $95,687
> Households with incomes $200,000 or more: 25,533 (12.2%% of households – #58 highest out of 382 MSAs)
> People in households with incomes under poverty line: 54,377 (7.8%% – #373 highest out of 382 MSAs)
> Population: 714,454 – #18 largest MSA
[recirclink id=1304180]
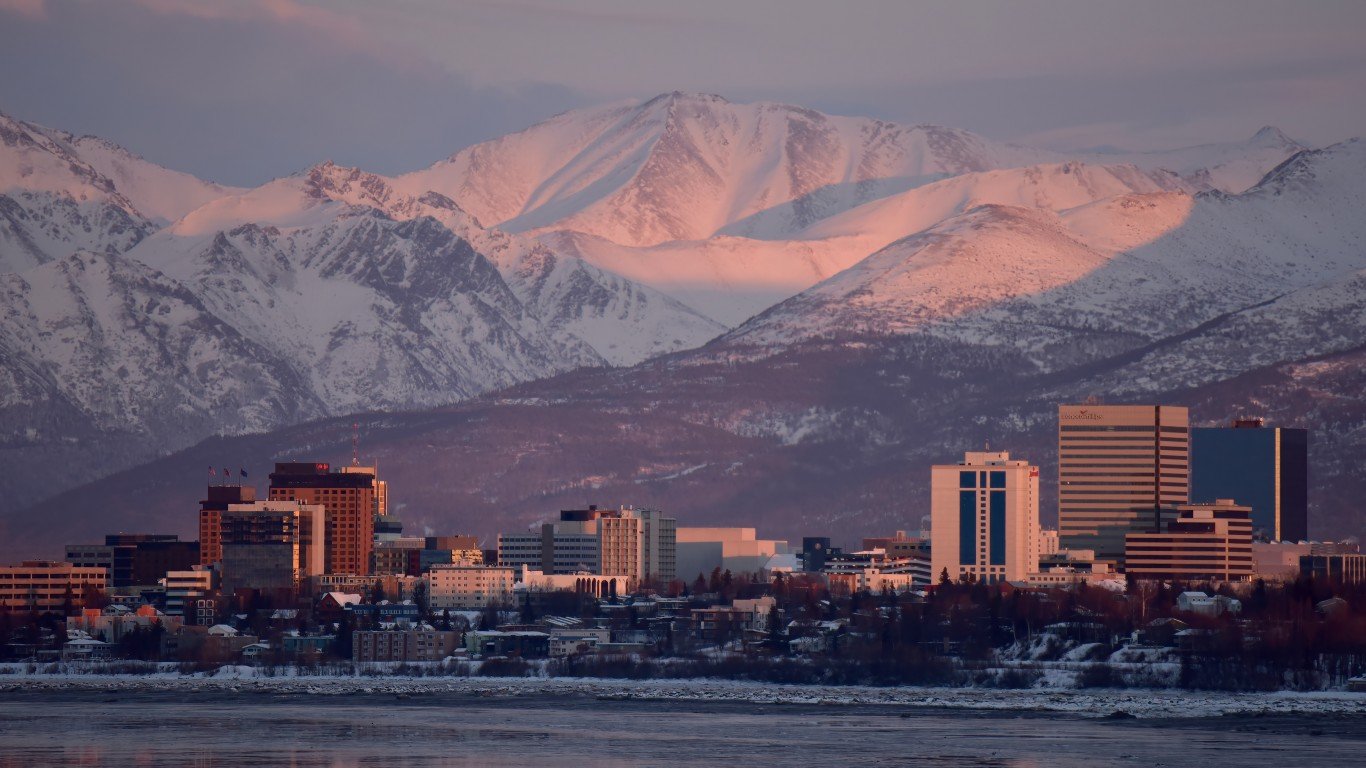
17. Anchorage, AK
> Median household annual income: $95,791
> Households with incomes $200,000 or more: 20,020 (13.4%% of households – #46 highest out of 382 MSAs)
> People in households with incomes under poverty line: 42,723 (10.9%% – #283 highest out of 382 MSAs)
> Population: 400,470 – #24 largest MSA
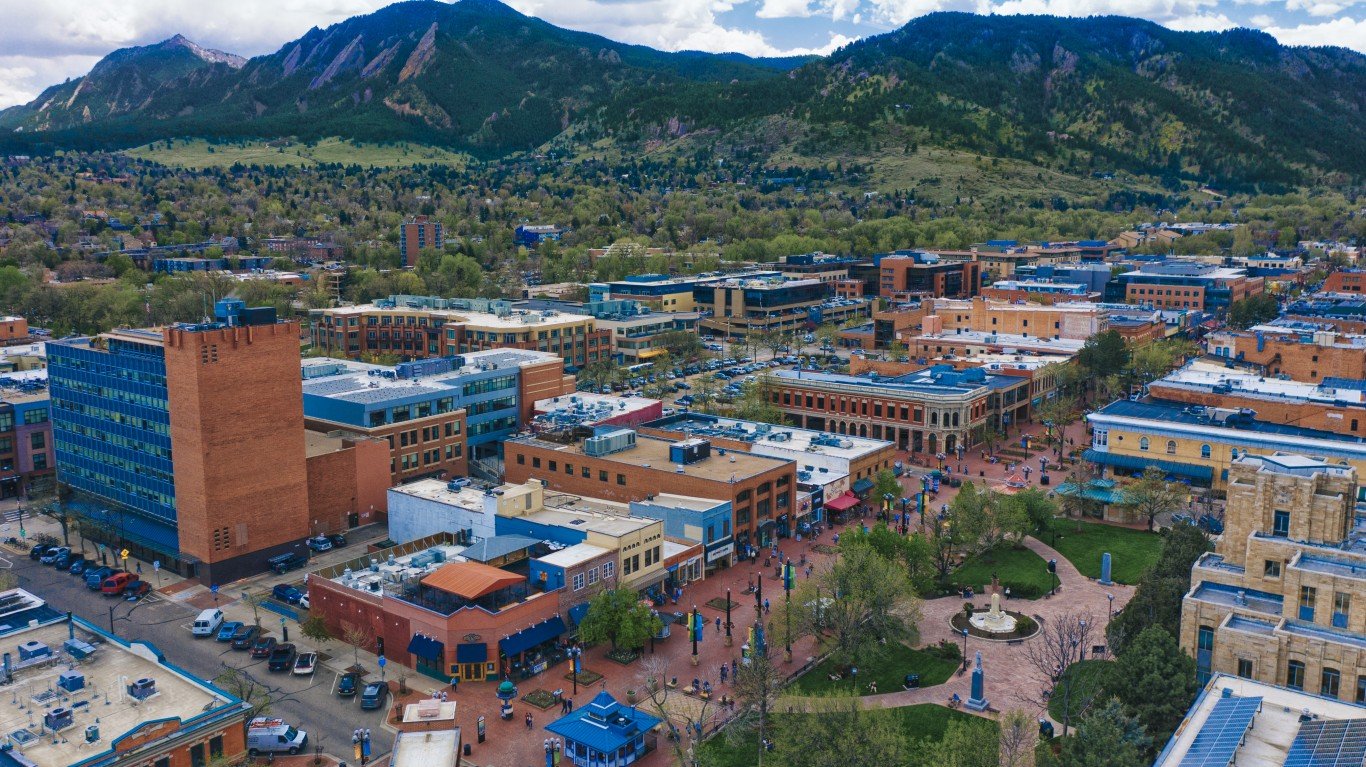
16. Boulder, CO
> Median household annual income: $96,079
> Households with incomes $200,000 or more: 28,450 (20.6%% of households – #9 highest out of 382 MSAs)
> People in households with incomes under poverty line: 38,849 (12.3%% – #226 highest out of 382 MSAs)
> Population: 327,468 – #27 largest MSA
[in-text-ad-2]
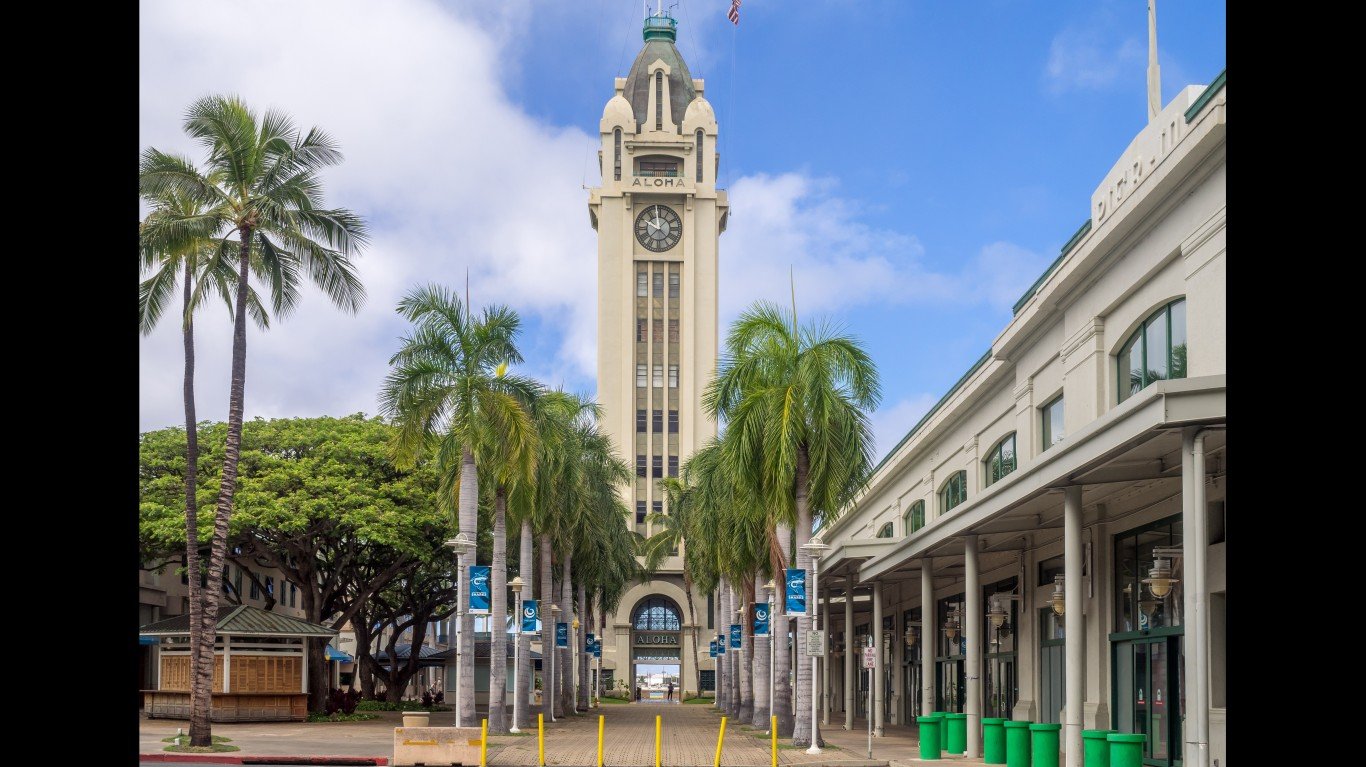
15. Urban Honolulu, HI
> Median household annual income: $96,580
> Households with incomes $200,000 or more: 55,494 (16.4%% of households – #24 highest out of 382 MSAs)
> People in households with incomes under poverty line: 93,402 (9.7%% – #329 highest out of 382 MSAs)
> Population: 995,638 – #14 largest MSA
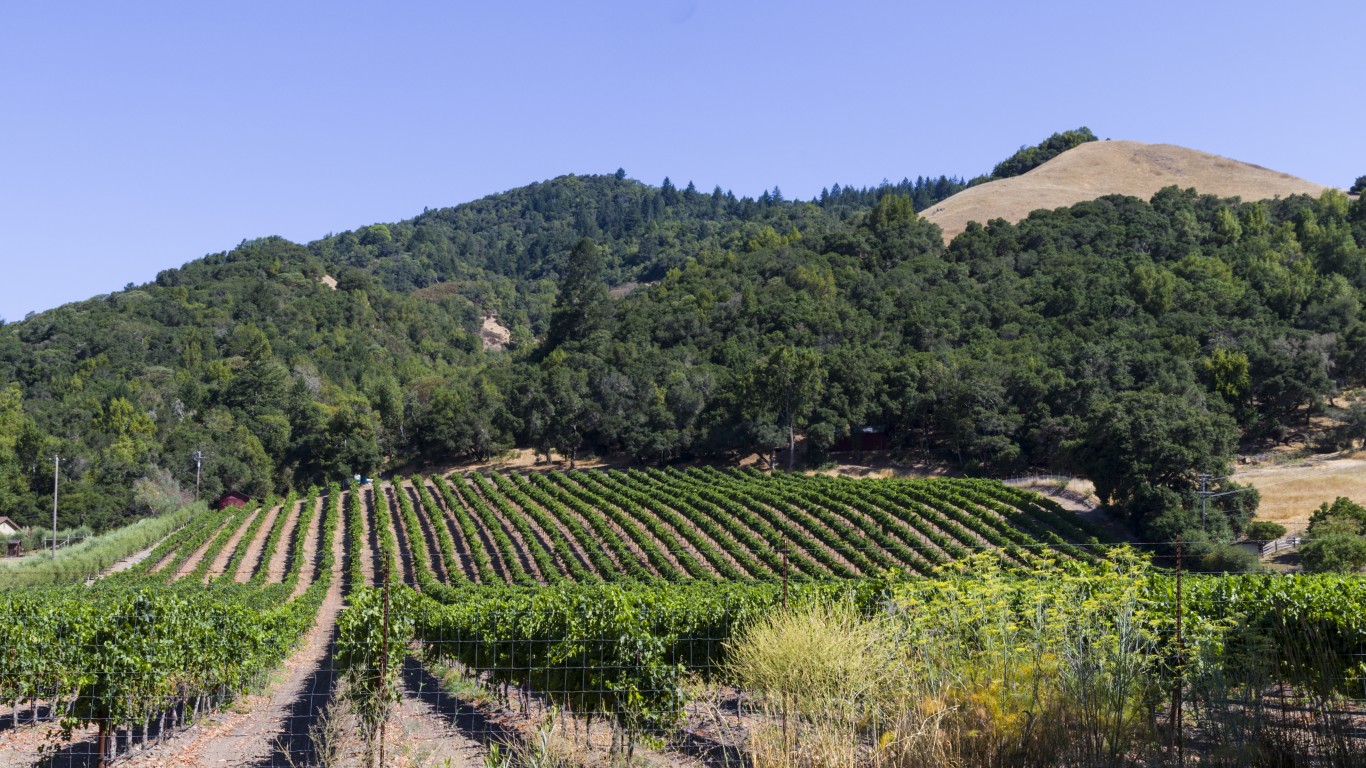
14. Santa Rosa-Petaluma, CA
> Median household annual income: $96,830
> Households with incomes $200,000 or more: 35,114 (18.0%% of households – #16 highest out of 382 MSAs)
> People in households with incomes under poverty line: 42,045 (8.8%% – #353 highest out of 382 MSAs)
> Population: 482,650 – #19 largest MSA
[in-text-ad]

13. Manchester-Nashua, NH
> Median household annual income: $96,921
> Households with incomes $200,000 or more: 28,332 (16.9%% of households – #20 highest out of 382 MSAs)
> People in households with incomes under poverty line: 25,980 (6.2%% – #383 highest out of 382 MSAs)
> Population: 426,594 – #23 largest MSA
[recirclink id=1315580]
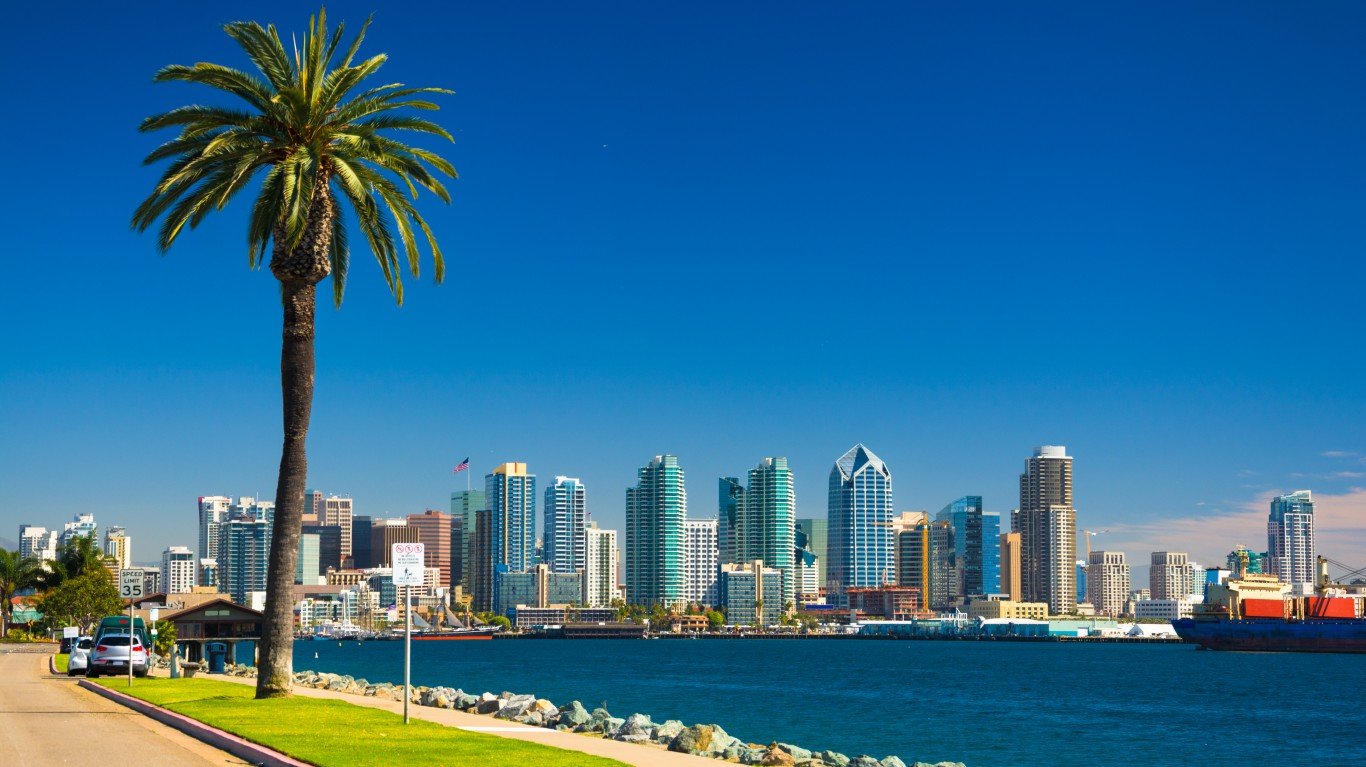
12. San Diego-Chula Vista-Carlsbad, CA
> Median household annual income: $98,928
> Households with incomes $200,000 or more: 212,260 (18.1%% of households – #15 highest out of 382 MSAs)
> People in households with incomes under poverty line: 336,145 (10.6%% – #300 highest out of 382 MSAs)
> Population: 3,276,208 – #7 largest MSA
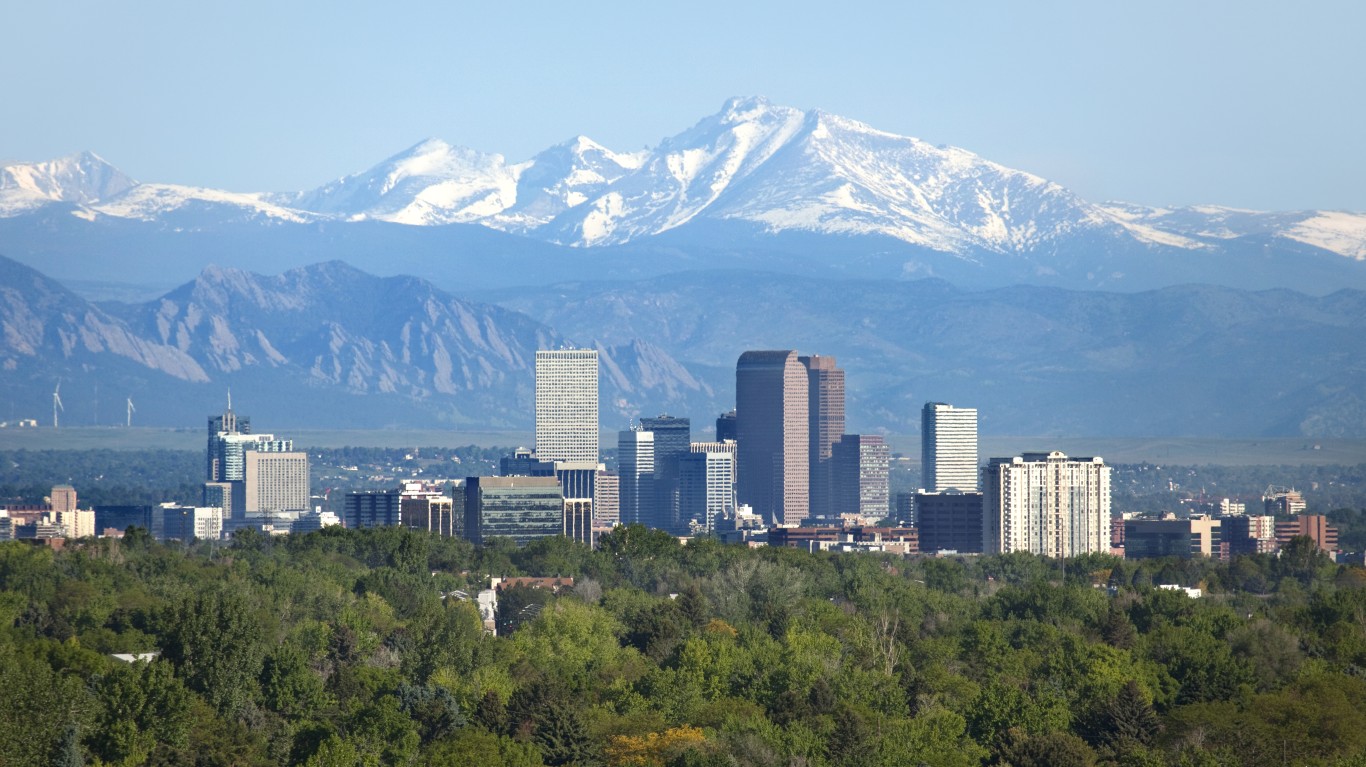
11. Denver-Aurora-Lakewood, CO
> Median household annual income: $98,975
> Households with incomes $200,000 or more: 218,512 (17.9%% of households – #17 highest out of 382 MSAs)
> People in households with incomes under poverty line: 246,333 (8.3%% – #364 highest out of 382 MSAs)
> Population: 2,985,871 – #8 largest MSA
[in-text-ad-2]

10. Napa, CA
> Median household annual income: $100,318
> Households with incomes $200,000 or more: 9,463 (18.5%% of households – #13 highest out of 382 MSAs)
> People in households with incomes under poverty line: 11,603 (8.8%% – #354 highest out of 382 MSAs)
> Population: 134,300 – #33 largest MSA
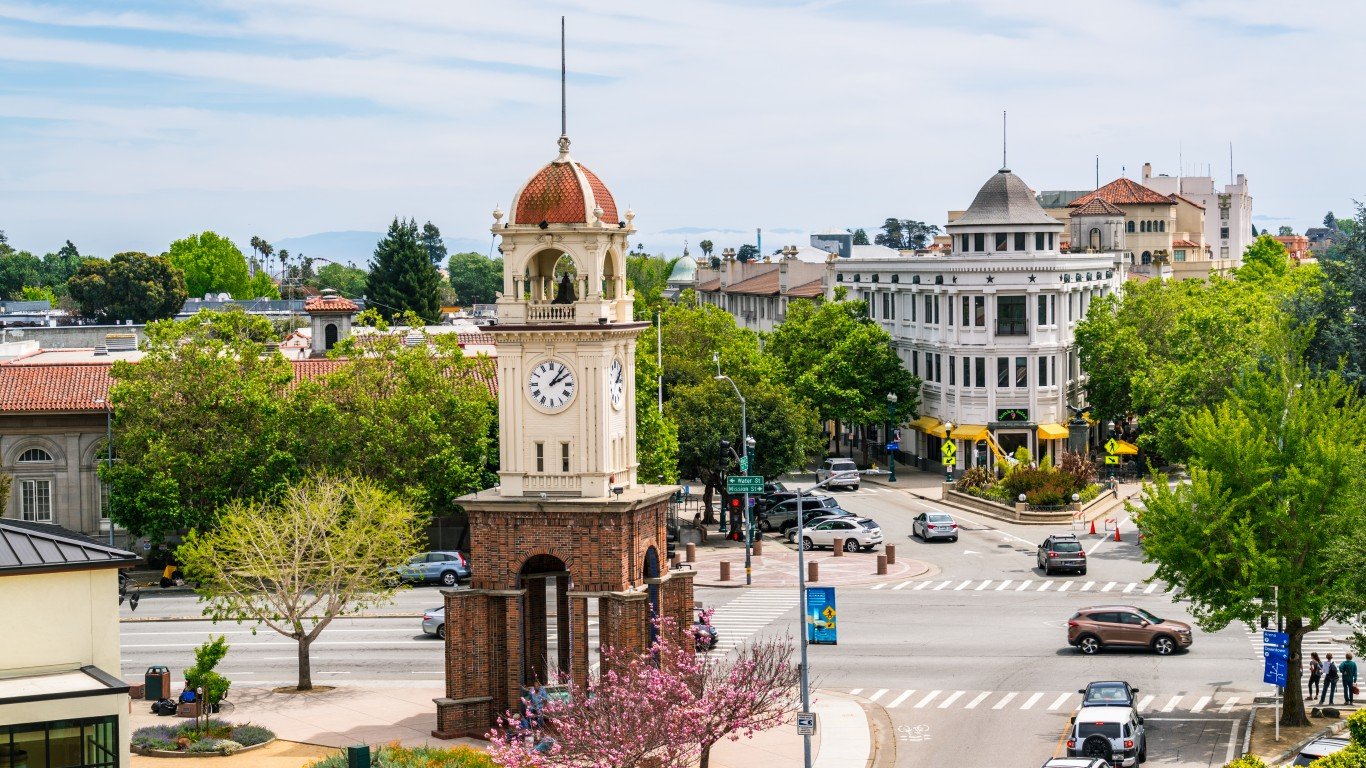
9. Santa Cruz-Watsonville, CA
> Median household annual income: $102,146
> Households with incomes $200,000 or more: 20,990 (21.9%% of households – #8 highest out of 382 MSAs)
> People in households with incomes under poverty line: 32,759 (12.9%% – #194 highest out of 382 MSAs)
> Population: 264,370 – #30 largest MSA
[in-text-ad]
8. Oxnard-Thousand Oaks-Ventura, CA
> Median household annual income: $102,569
> Households with incomes $200,000 or more: 53,954 (19.4%% of households – #12 highest out of 382 MSAs)
> People in households with incomes under poverty line: 76,843 (9.4%% – #337 highest out of 382 MSAs)
> Population: 832,605 – #16 largest MSA
[recirclink id=1316240]
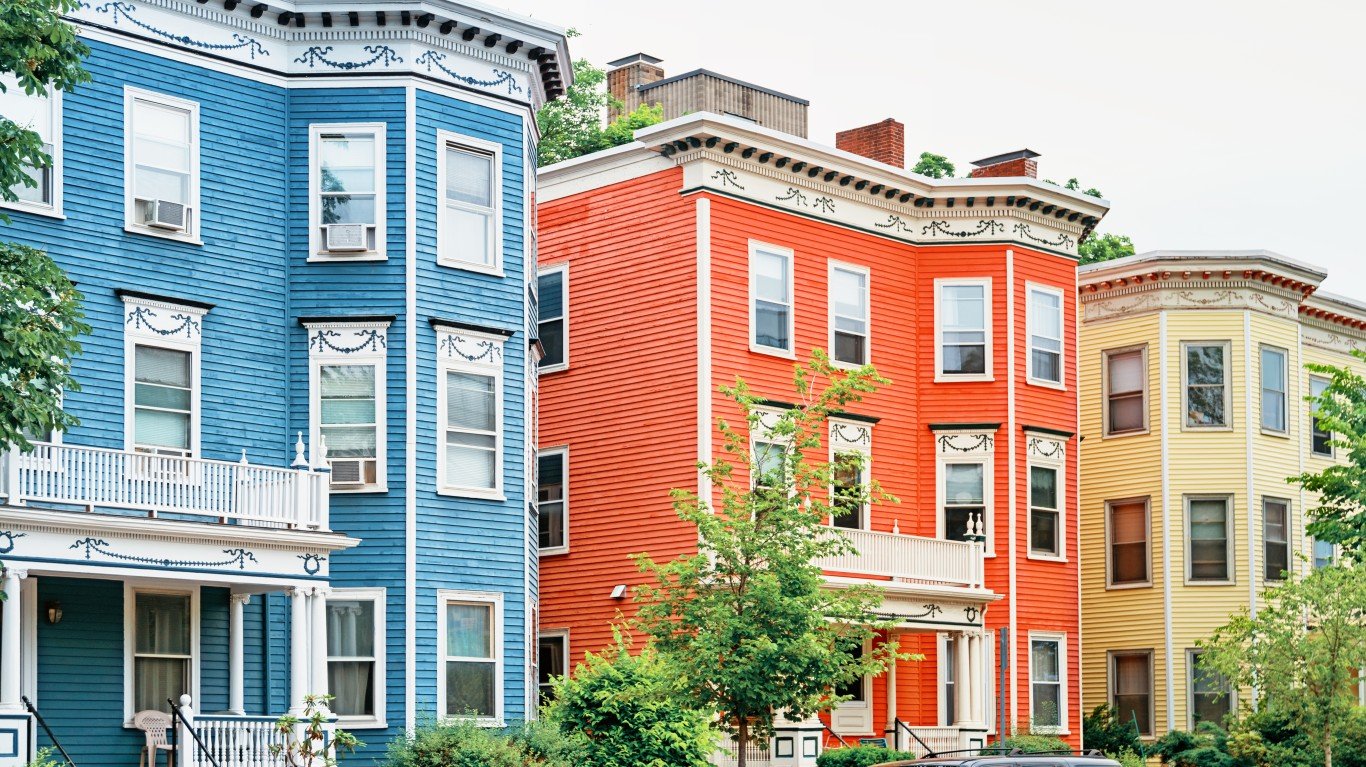
7. Boston-Cambridge-Newton, MA-NH
> Median household annual income: $104,299
> Households with incomes $200,000 or more: 437,971 (22.5%% of households – #5 highest out of 382 MSAs)
> People in households with incomes under poverty line: 436,311 (9.2%% – #343 highest out of 382 MSAs)
> Population: 4,900,550 – #3 largest MSA

6. Bridgeport-Stamford-Norwalk, CT
> Median household annual income: $105,968
> Households with incomes $200,000 or more: 89,458 (25.0%% of households – #3 highest out of 382 MSAs)
> People in households with incomes under poverty line: 89,059 (9.4%% – #334 highest out of 382 MSAs)
> Population: 963,211 – #15 largest MSA
[in-text-ad-2]

5. Seattle-Tacoma-Bellevue, WA
> Median household annual income: $106,909
> Households with incomes $200,000 or more: 360,032 (22.3%% of households – #7 highest out of 382 MSAs)
> People in households with incomes under poverty line: 341,325 (8.6%% – #360 highest out of 382 MSAs)
> Population: 4,034,248 – #5 largest MSA
4. California-Lexington Park, MD
> Median household annual income: $113,717
> Households with incomes $200,000 or more: 9,939 (22.4%% of households – #6 highest out of 382 MSAs)
> People in households with incomes under poverty line: 9,144 (8.1%% – #367 highest out of 382 MSAs)
> Population: 114,877 – #34 largest MSA
[in-text-ad]

3. Washington-Arlington-Alexandria, DC-VA-MD-WV
> Median household annual income: $117,432
> Households with incomes $200,000 or more: 604,638 (25.0%% of households – #4 highest out of 382 MSAs)
> People in households with incomes under poverty line: 494,897 (7.9%% – #371 highest out of 382 MSAs)
> Population: 6,373,829 – #2 largest MSA
[recirclink id=1304208]

2. San Francisco-Oakland-Berkeley, CA
> Median household annual income: $128,151
> Households with incomes $200,000 or more: 552,095 (31.7%% of households – #2 highest out of 382 MSAs)
> People in households with incomes under poverty line: 415,758 (9.2%% – #340 highest out of 382 MSAs)
> Population: 4,579,599 – #4 largest MSA
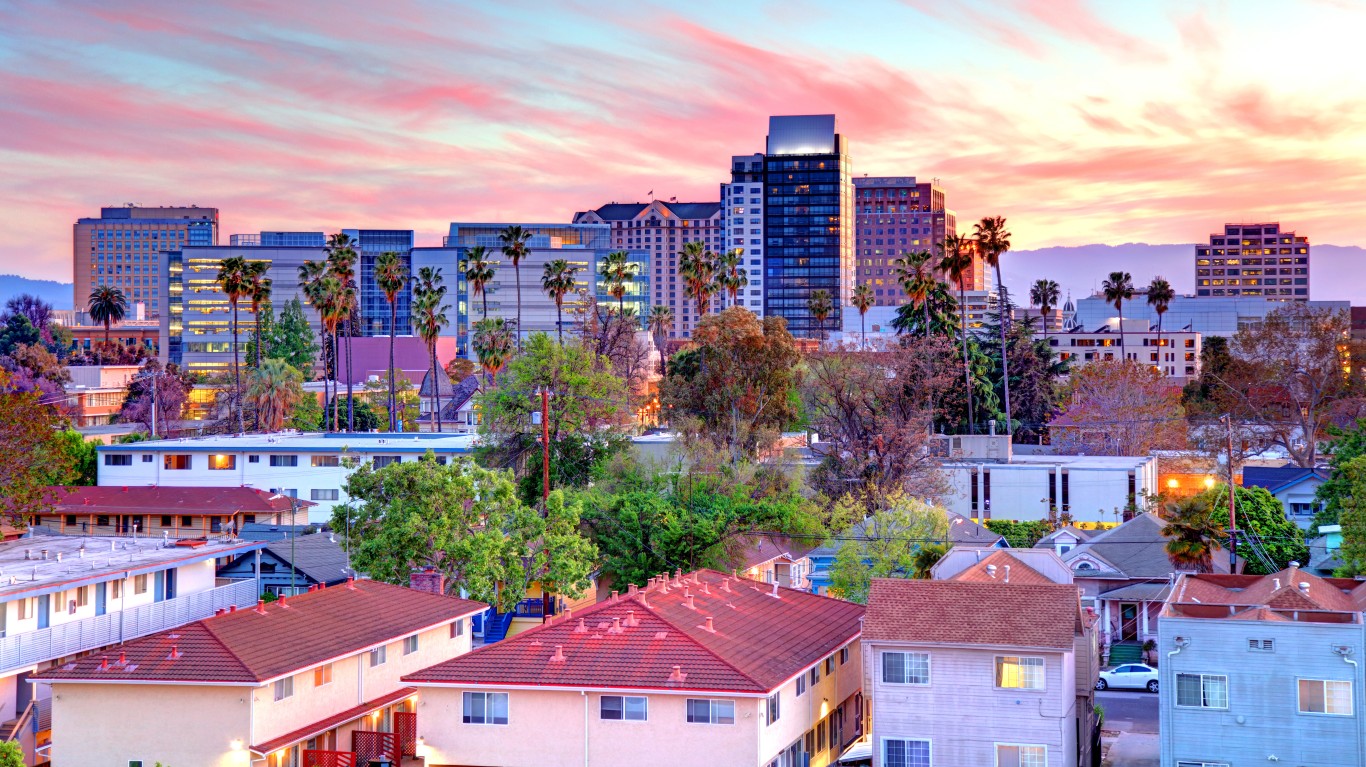
1. San Jose-Sunnyvale-Santa Clara, CA
> Median household annual income: $148,900
> Households with incomes $200,000 or more: 254,410 (37.6%% of households – #1 highest out of 382 MSAs)
> People in households with incomes under poverty line: 138,972 (7.3%% – #377 highest out of 382 MSAs)
> Population: 1,938,524 – #11 largest MSA
Contact [email protected] for any questions or corrections.