Incomes are rising rapidly in the United States. According to estimates from the U.S. Census Bureau, the national median household income was nearly $75,000 in 2022, up from about $69,700 in 2021. The 7.2% increase was the largest recorded year-over-year since at least the mid-1990s.
While the typical American household is earning more than ever before, incomes have not been rising fast enough to offset inflation. Throughout 2022, the average rate of inflation hit a 40-year high of 8%, four times the Federal Reserve’s 2% target rate. Accounting for the rising cost of living, real incomes in the U.S. fell by nearly 5% between 2019 and 2022.
While no one has been spared from surging prices, Americans on the low end of the income spectrum have bore the brunt. During inflationary periods, higher-income Americans can cut back on spending and reduce the impact of rising costs. Meanwhile, lower earning Americans, who spend a larger share of their income on necessities such as food, housing, and gas, cannot.
Ohio has a median household income of $66,990. But in many parts of the state, the typical household earns far less than the statewide median.
Using five-year estimates from the U.S. Census Bureau’s 2022 American Community Survey, 24/7 Wall St. identified the 35 poorest counties in Ohio. Counties in the state are ranked on median household income. Population, poverty, and unemployment data are also five-year estimates from the 2022 ACS.
Among the counties on this list, median household incomes are anywhere from about $6,900 to $27,800 below the statewide median. In many of these counties, levels of financial hardship are underscored by widespread poverty. In all but three counties on this list, the share of residents living below the poverty line exceeds the 13.3% statewide poverty rate.
These are the poorest counties in Ohio.
35. Cuyahoga County

Source: DenisTangneyJr / E+ via Getty Images
- Median household income: $60,074
- Poverty rate: 16.5%
- 5-yr. avg. unemployment rate: 7.2%
- Population: 1,256,620
34. Carroll County

Source: Public Domain / Wikimedia Commons
- Median household income: $59,872
- Poverty rate: 12.2%
- 5-yr. avg. unemployment rate: 3.9%
- Population: 26,761
33. Washington County

Source: Oralleff / iStock via Getty Images
- Median household income: $59,053
- Poverty rate: 14.1%
- 5-yr. avg. unemployment rate: 5.2%
- Population: 59,639
32. Hocking County

Source: LarryKnupp / iStock via Getty Images
- Median household income: $59,007
- Poverty rate: 16.6%
- 5-yr. avg. unemployment rate: 4.7%
- Population: 28,104
31. Allen County

Source: jetcityimage / iStock Editorial via Getty Images
- Median household income: $58,976
- Poverty rate: 12.3%
- 5-yr. avg. unemployment rate: 6.1%
- Population: 102,087
30. Clark County

- Median household income: $58,954
- Poverty rate: 15.6%
- 5-yr. avg. unemployment rate: 6.8%
- Population: 135,877
29. Ross County

Source: ehrlif / Getty Images
- Median household income: $58,048
- Poverty rate: 16.1%
- 5-yr. avg. unemployment rate: 5.7%
- Population: 76,957
28. Lucas County

Source: pabradyphoto / iStock Editorial via Getty Images
- Median household income: $57,265
- Poverty rate: 17.8%
- 5-yr. avg. unemployment rate: 6.8%
- Population: 430,014
27. Belmont County

Source: Jacqueline Nix / iStock Editorial via Getty Images
- Median household income: $56,943
- Poverty rate: 14.0%
- 5-yr. avg. unemployment rate: 6.0%
- Population: 66,554
26. Muskingum County

Source: benkrut / iStock via Getty Images
- Median household income: $56,810
- Poverty rate: 15.6%
- 5-yr. avg. unemployment rate: 4.6%
- Population: 86,393
25. Fayette County

- Median household income: $56,773
- Poverty rate: 15.8%
- 5-yr. avg. unemployment rate: 4.3%
- Population: 28,901
24. Richland County

- Median household income: $56,557
- Poverty rate: 13.9%
- 5-yr. avg. unemployment rate: 4.8%
- Population: 125,008
23. Jackson County

Source: J.C. Marciniak / iStock via Getty Images
- Median household income: $56,549
- Poverty rate: 17.4%
- 5-yr. avg. unemployment rate: 5.9%
- Population: 32,563
22. Hardin County
Source: Public Domain / Wikimedia Commons
- Median household income: $55,876
- Poverty rate: 18.2%
- 5-yr. avg. unemployment rate: 4.7%
- Population: 30,622
21. Gallia County
Source: dok1 / Flickr
- Median household income: $55,533
- Poverty rate: 17.2%
- 5-yr. avg. unemployment rate: 4.1%
- Population: 29,276
20. Columbiana County

- Median household income: $55,473
- Poverty rate: 13.2%
- 5-yr. avg. unemployment rate: 4.9%
- Population: 101,723
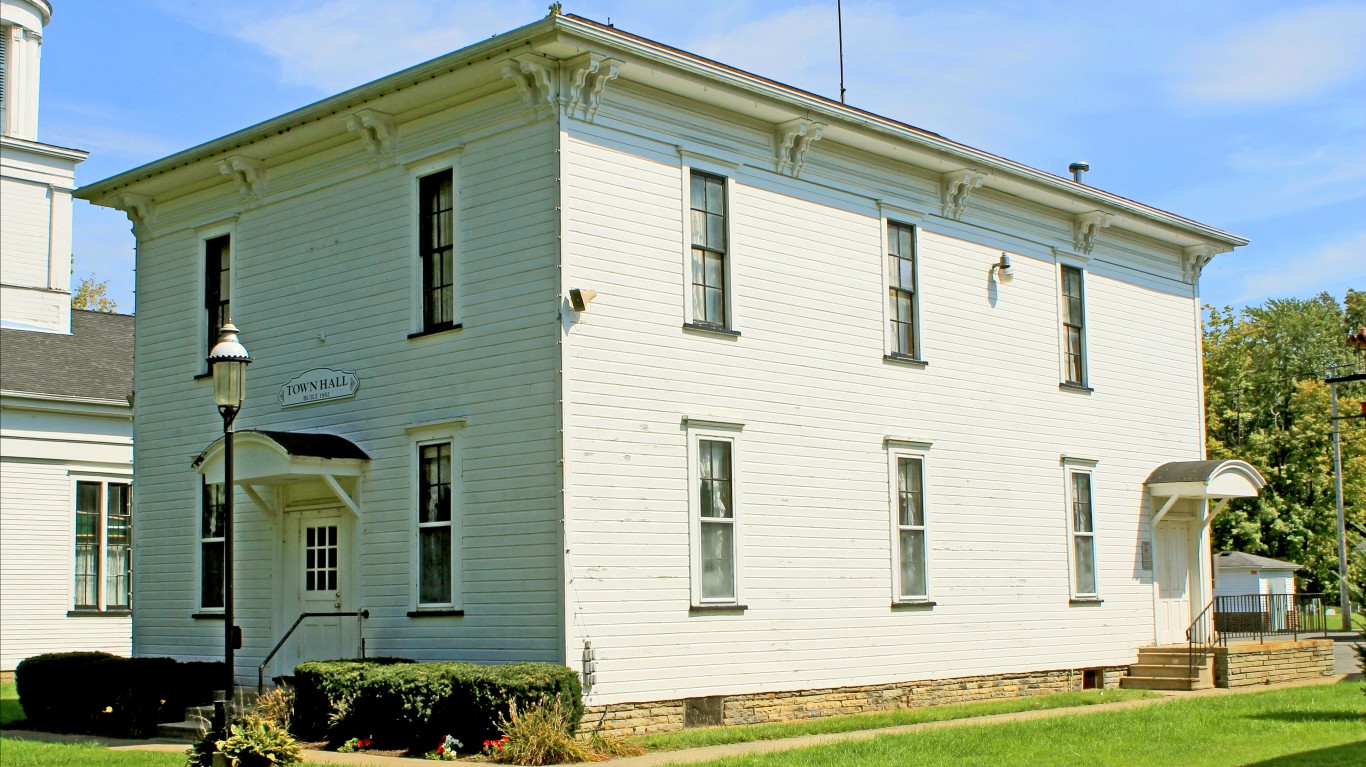
19. Monroe County

Source: Kenneth Keifer / iStock via Getty Images
- Median household income: $55,381
- Poverty rate: 13.9%
- 5-yr. avg. unemployment rate: 5.5%
- Population: 13,401
18. Marion County
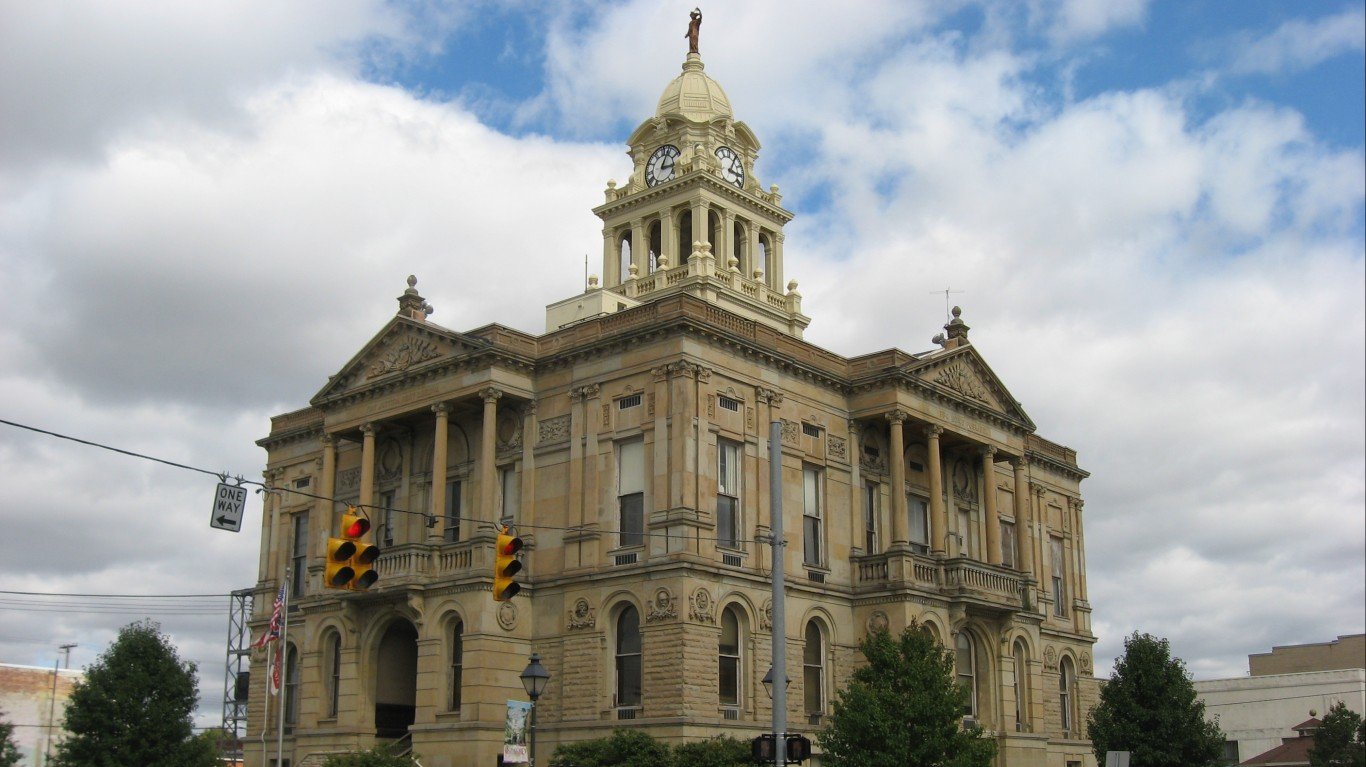
Source: Public Domain / Wikimedia Commons
- Median household income: $55,106
- Poverty rate: 16.1%
- 5-yr. avg. unemployment rate: 5.7%
- Population: 65,366
17. Mahoning County

Source: DenisTangneyJr / iStock via Getty Images
- Median household income: $54,279
- Poverty rate: 17.6%
- 5-yr. avg. unemployment rate: 7.2%
- Population: 227,979
16. Harrison County

- Median household income: $54,056
- Poverty rate: 15.4%
- 5-yr. avg. unemployment rate: 4.5%
- Population: 14,528
15. Guernsey County

- Median household income: $53,901
- Poverty rate: 17.0%
- 5-yr. avg. unemployment rate: 4.6%
- Population: 38,409
14. Ashtabula County

- Median household income: $53,663
- Poverty rate: 18.0%
- 5-yr. avg. unemployment rate: 7.6%
- Population: 97,666
13. Trumbull County
Source: jwpearce / Flickr
- Median household income: $53,537
- Poverty rate: 17.1%
- 5-yr. avg. unemployment rate: 4.8%
- Population: 201,749
12. Jefferson County

- Median household income: $53,124
- Poverty rate: 18.2%
- 5-yr. avg. unemployment rate: 5.5%
- Population: 65,280
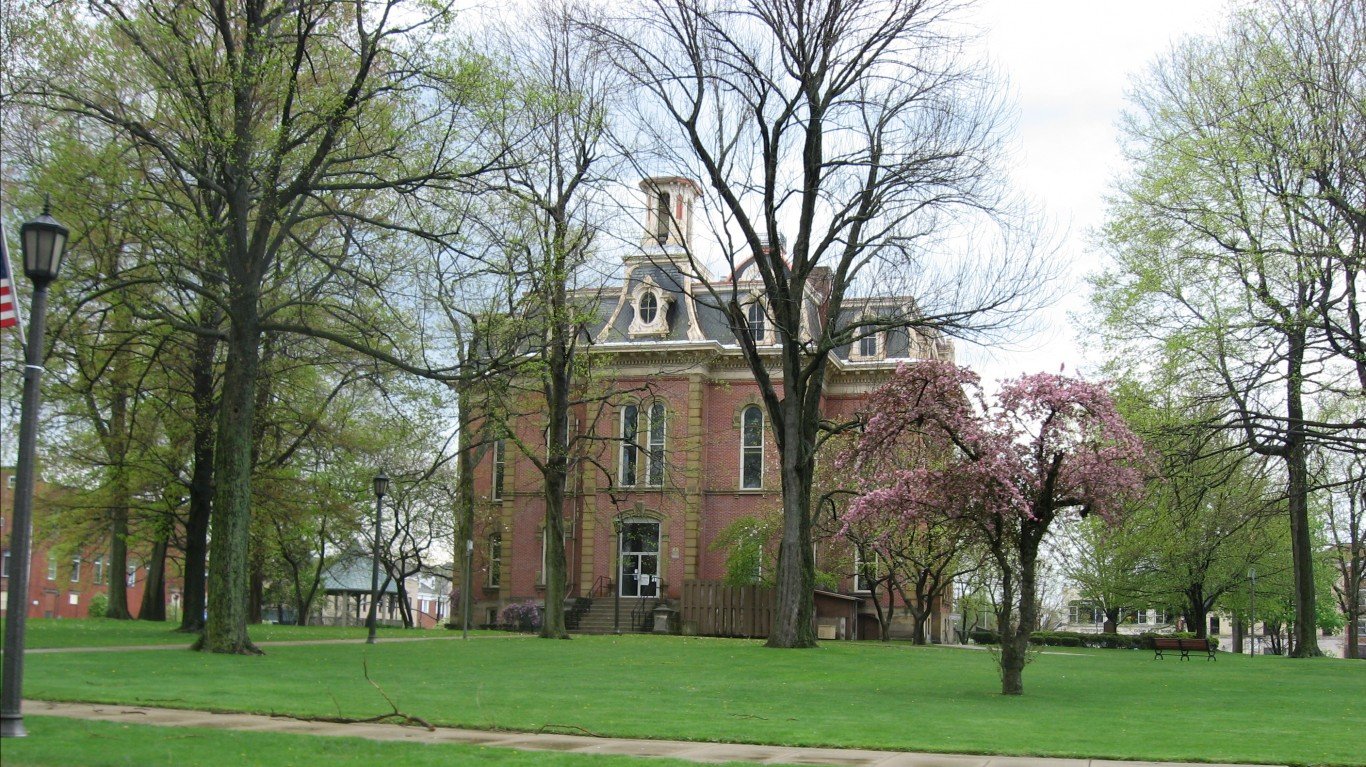
11. Crawford County

Source: Public Domain / Wikimedia Commons
- Median household income: $52,486
- Poverty rate: 14.1%
- 5-yr. avg. unemployment rate: 5.5%
- Population: 41,861
10. Coshocton County
Source: Public Domain / Wikimedia Commons
- Median household income: $52,048
- Poverty rate: 18.9%
- 5-yr. avg. unemployment rate: 6.1%
- Population: 36,629
9. Lawrence County

- Median household income: $51,846
- Poverty rate: 17.9%
- 5-yr. avg. unemployment rate: 3.8%
- Population: 57,994
8. Noble County

Source: Tim Kiser / Wikimedia Commons
- Median household income: $51,547
- Poverty rate: 16.6%
- 5-yr. avg. unemployment rate: 4.5%
- Population: 14,216
7. Morgan County
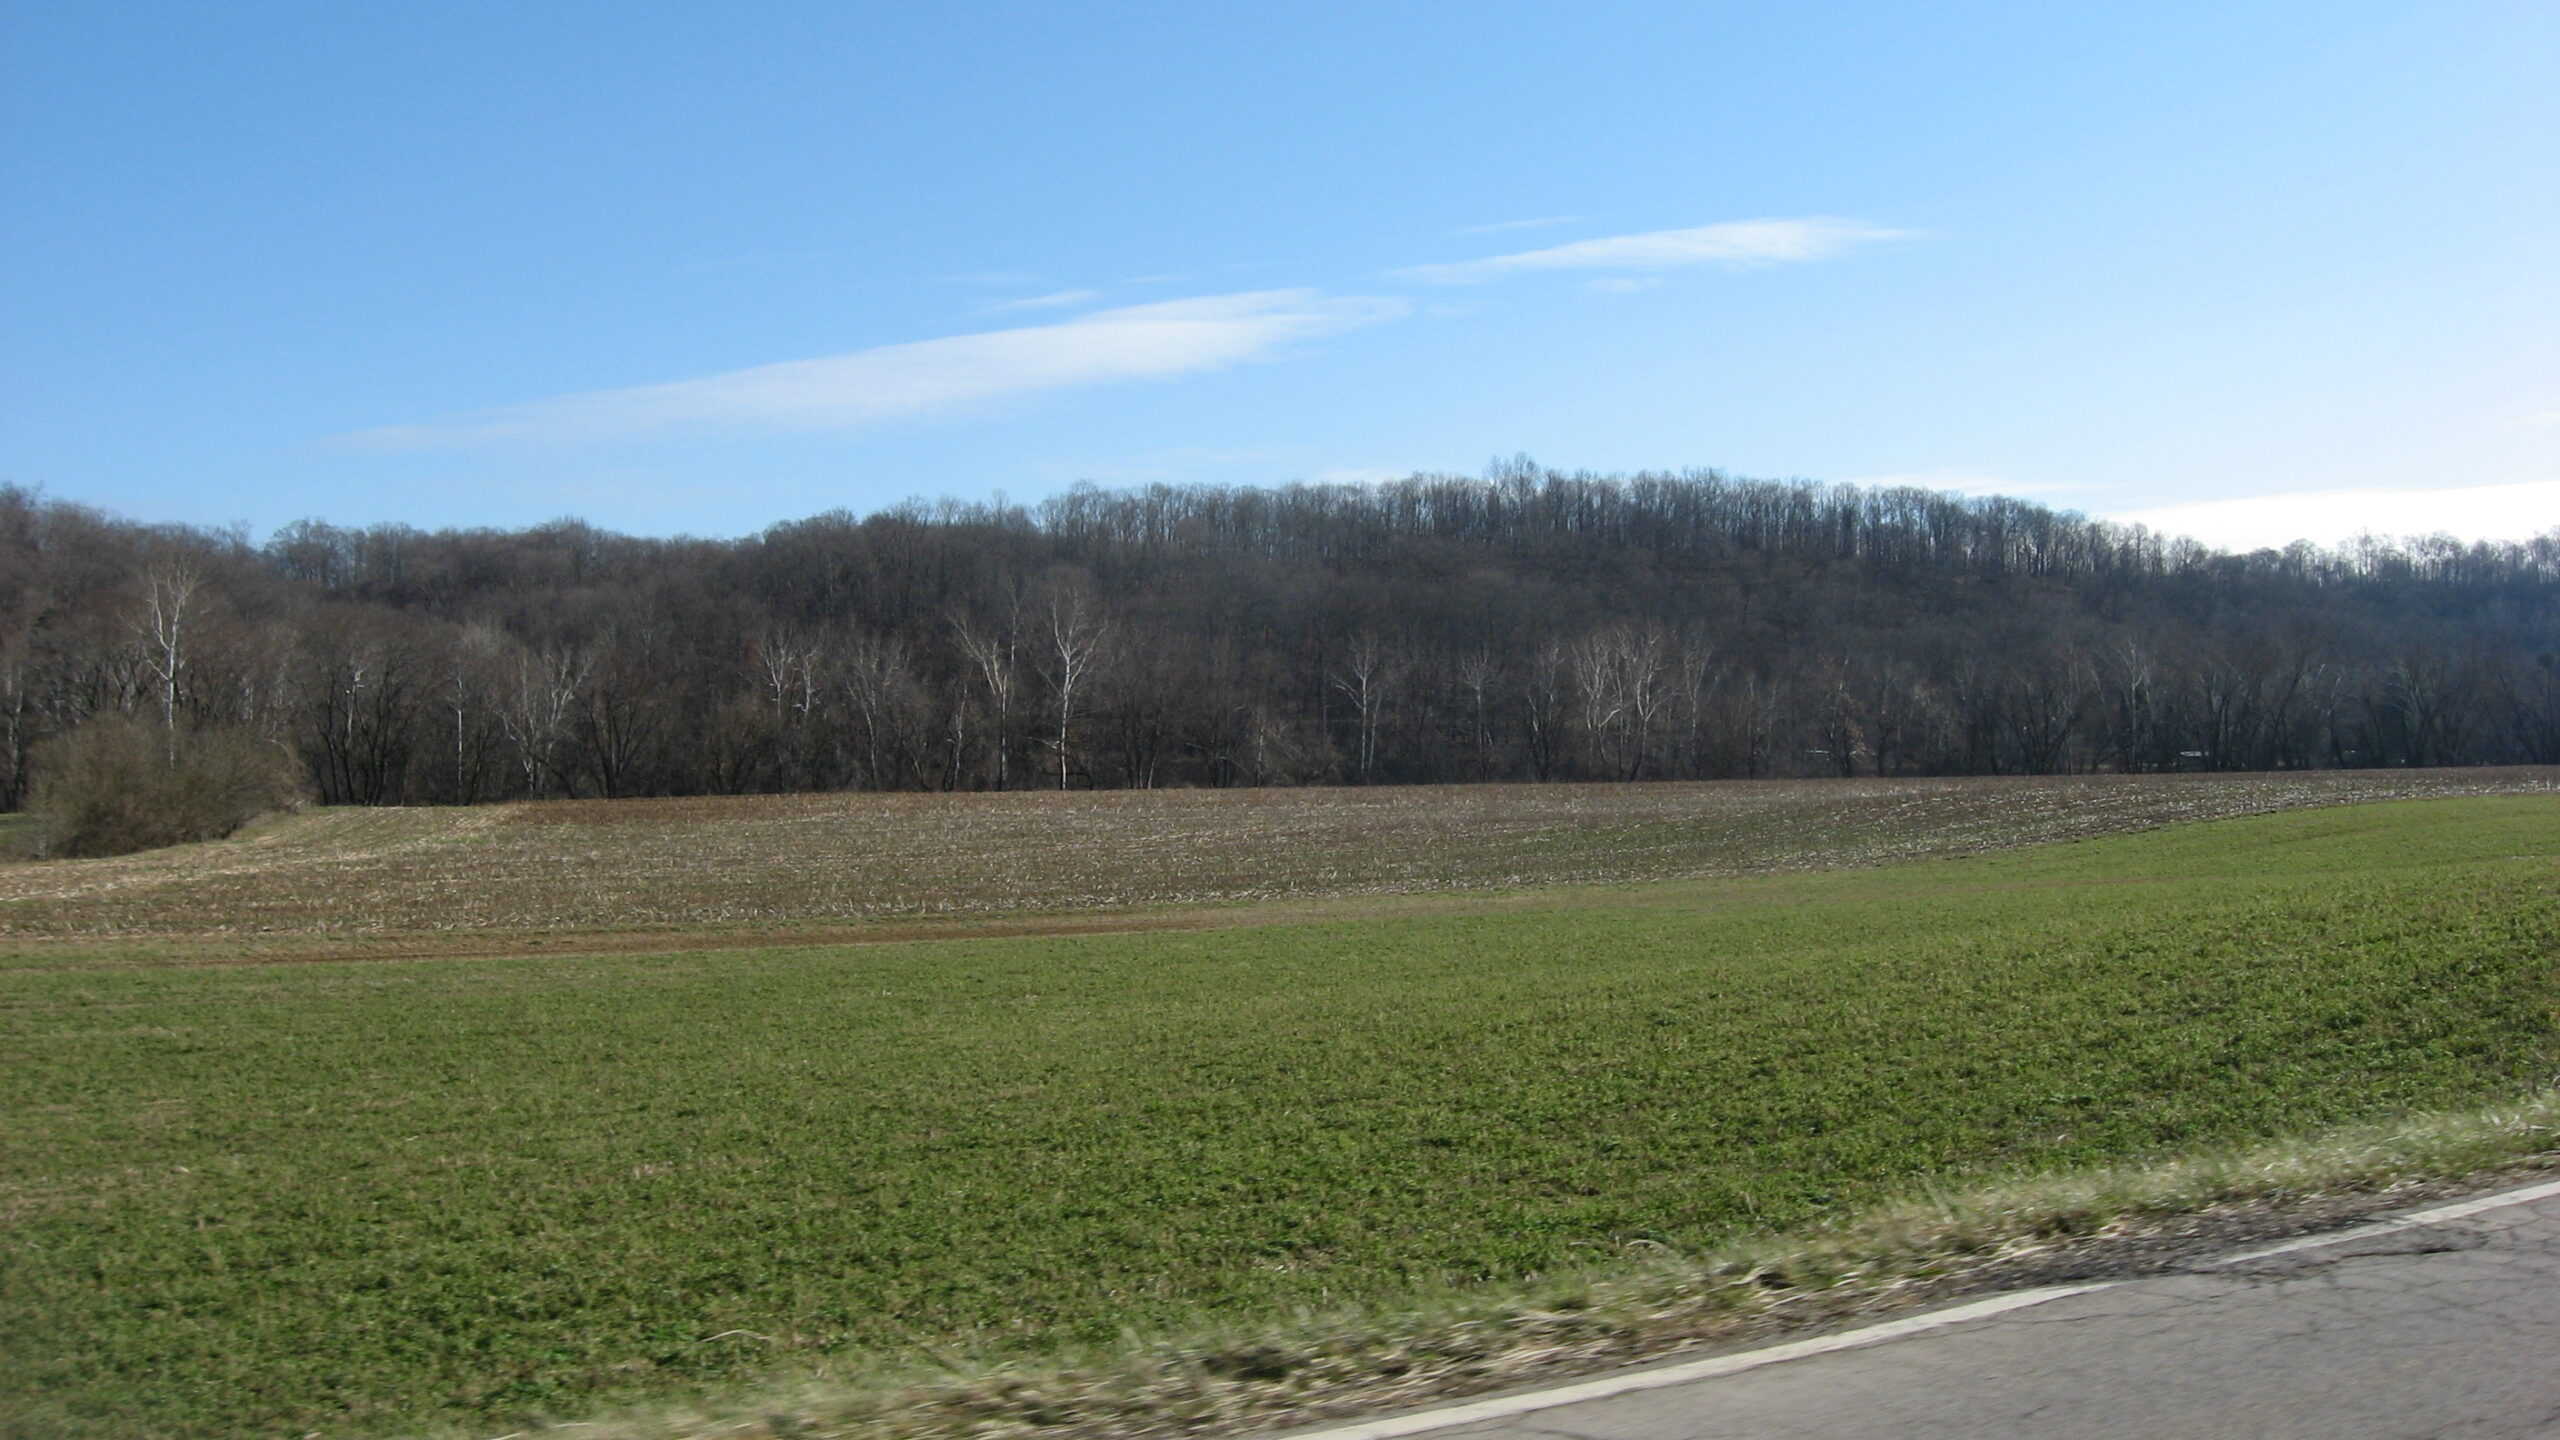
Source: Public Domain / Wikimedia Commons
- Median household income: $51,056
- Poverty rate: 16.6%
- 5-yr. avg. unemployment rate: 4.9%
- Population: 13,851
6. Vinton County
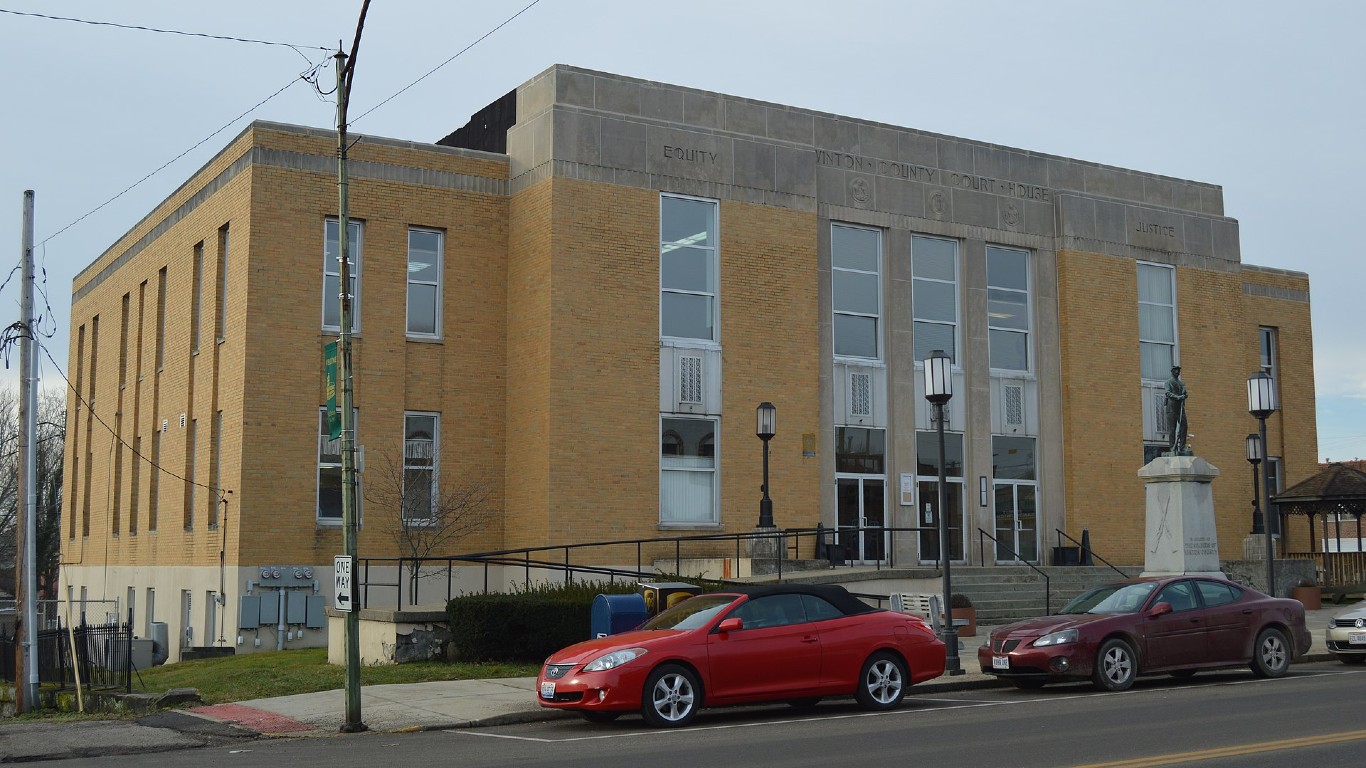
Source: By Nyttend - Own work, Public Domain, https://commons.wikimedia.org/w/index.php?curid=46850282
- Median household income: $50,967
- Poverty rate: 19.1%
- 5-yr. avg. unemployment rate: 3.6%
- Population: 12,790
5. Pike County

- Median household income: $50,832
- Poverty rate: 19.8%
- 5-yr. avg. unemployment rate: 5.2%
- Population: 27,151
4. Athens County
Source: Wendy Van / iStock Editorial via Getty Images
- Median household income: $48,750
- Poverty rate: 24.4%
- 5-yr. avg. unemployment rate: 5.7%
- Population: 61,276
3. Scioto County

Source: dok1 / Flickr
- Median household income: $46,360
- Poverty rate: 23.8%
- 5-yr. avg. unemployment rate: 7.5%
- Population: 73,716
2. Meigs County

Source: dok1 / Flickr
- Median household income: $46,255
- Poverty rate: 19.6%
- 5-yr. avg. unemployment rate: 6.4%
- Population: 22,242
1. Adams County

Source: Corey B. Stevens / iStock via Getty Images
- Median household income: $46,234
- Poverty rate: 19.6%
- 5-yr. avg. unemployment rate: 5.8%
- Population: 27,509
| Rank | County | Median household income ($) | Poverty rate (%) | 5-yr. avg. unemployment rate (%) |
|---|---|---|---|---|
| 1 | Adams, Ohio | 46,234 | 19.6 | 5.8 |
| 2 | Meigs, Ohio | 46,255 | 19.6 | 6.4 |
| 3 | Scioto, Ohio | 46,360 | 23.8 | 7.5 |
| 4 | Athens, Ohio | 48,750 | 24.4 | 5.7 |
| 5 | Pike, Ohio | 50,832 | 19.8 | 5.2 |
| 6 | Vinton, Ohio | 50,967 | 19.1 | 3.6 |
| 7 | Morgan, Ohio | 51,056 | 16.6 | 4.9 |
| 8 | Noble, Ohio | 51,547 | 16.6 | 4.5 |
| 9 | Lawrence, Ohio | 51,846 | 17.9 | 3.8 |
| 10 | Coshocton, Ohio | 52,048 | 18.9 | 6.1 |
| 11 | Crawford, Ohio | 52,486 | 14.1 | 5.5 |
| 12 | Jefferson, Ohio | 53,124 | 18.2 | 5.5 |
| 13 | Trumbull, Ohio | 53,537 | 17.1 | 4.8 |
| 14 | Ashtabula, Ohio | 53,663 | 18.0 | 7.6 |
| 15 | Guernsey, Ohio | 53,901 | 17.0 | 4.6 |
| 16 | Harrison, Ohio | 54,056 | 15.4 | 4.5 |
| 17 | Mahoning, Ohio | 54,279 | 17.6 | 7.2 |
| 18 | Marion, Ohio | 55,106 | 16.1 | 5.7 |
| 19 | Monroe, Ohio | 55,381 | 13.9 | 5.5 |
| 20 | Columbiana, Ohio | 55,473 | 13.2 | 4.9 |
| 21 | Gallia, Ohio | 55,533 | 17.2 | 4.1 |
| 22 | Hardin, Ohio | 55,876 | 18.2 | 4.7 |
| 23 | Jackson, Ohio | 56,549 | 17.4 | 5.9 |
| 24 | Richland, Ohio | 56,557 | 13.9 | 4.8 |
| 25 | Fayette, Ohio | 56,773 | 15.8 | 4.3 |
| 26 | Muskingum, Ohio | 56,810 | 15.6 | 4.6 |
| 27 | Belmont, Ohio | 56,943 | 14.0 | 6.0 |
| 28 | Lucas, Ohio | 57,265 | 17.8 | 6.8 |
| 29 | Ross, Ohio | 58,048 | 16.1 | 5.7 |
| 30 | Clark, Ohio | 58,954 | 15.6 | 6.8 |
| 31 | Allen, Ohio | 58,976 | 12.3 | 6.1 |
| 32 | Hocking, Ohio | 59,007 | 16.6 | 4.7 |
| 33 | Washington, Ohio | 59,053 | 14.1 | 5.2 |
| 34 | Carroll, Ohio | 59,872 | 12.2 | 3.9 |
| 35 | Cuyahoga, Ohio | 60,074 | 16.5 | 7.2 |
Essential Tips for Investing: Sponsored
A financial advisor can help you understand the advantages and disadvantages of investment properties. Finding a qualified financial advisor doesn’t have to be hard. SmartAsset’s free tool matches you with up to three financial advisors who serve your area, and you can interview your advisor matches at no cost to decide which one is right for you. If you’re ready to find an advisor who can help you achieve your financial goals, get started now.
Investing in real estate can diversify your portfolio. But expanding your horizons may add additional costs. If you’re an investor looking to minimize expenses, consider checking out online brokerages. They often offer low investment fees, helping you maximize your profit.
Thank you for reading! Have some feedback for us?
Contact the 24/7 Wall St. editorial team.
Editors' Picks