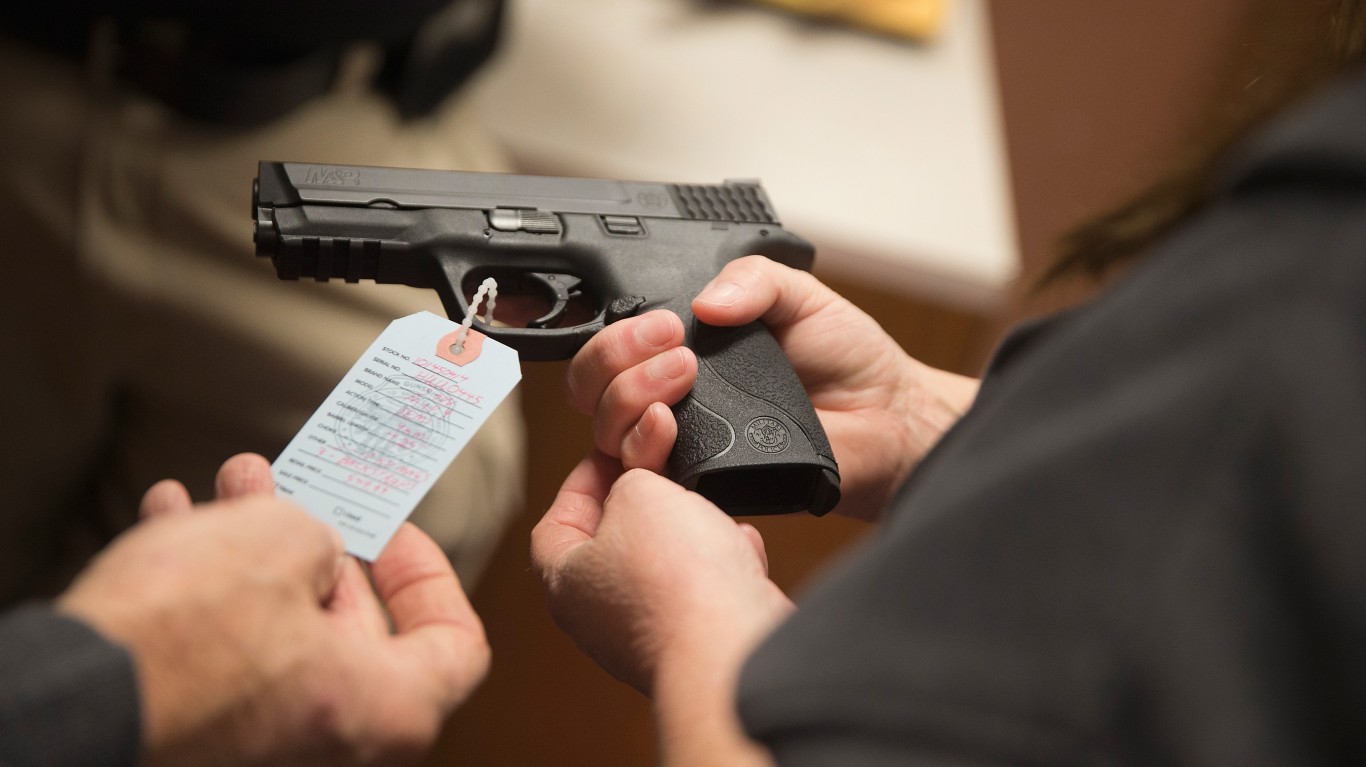
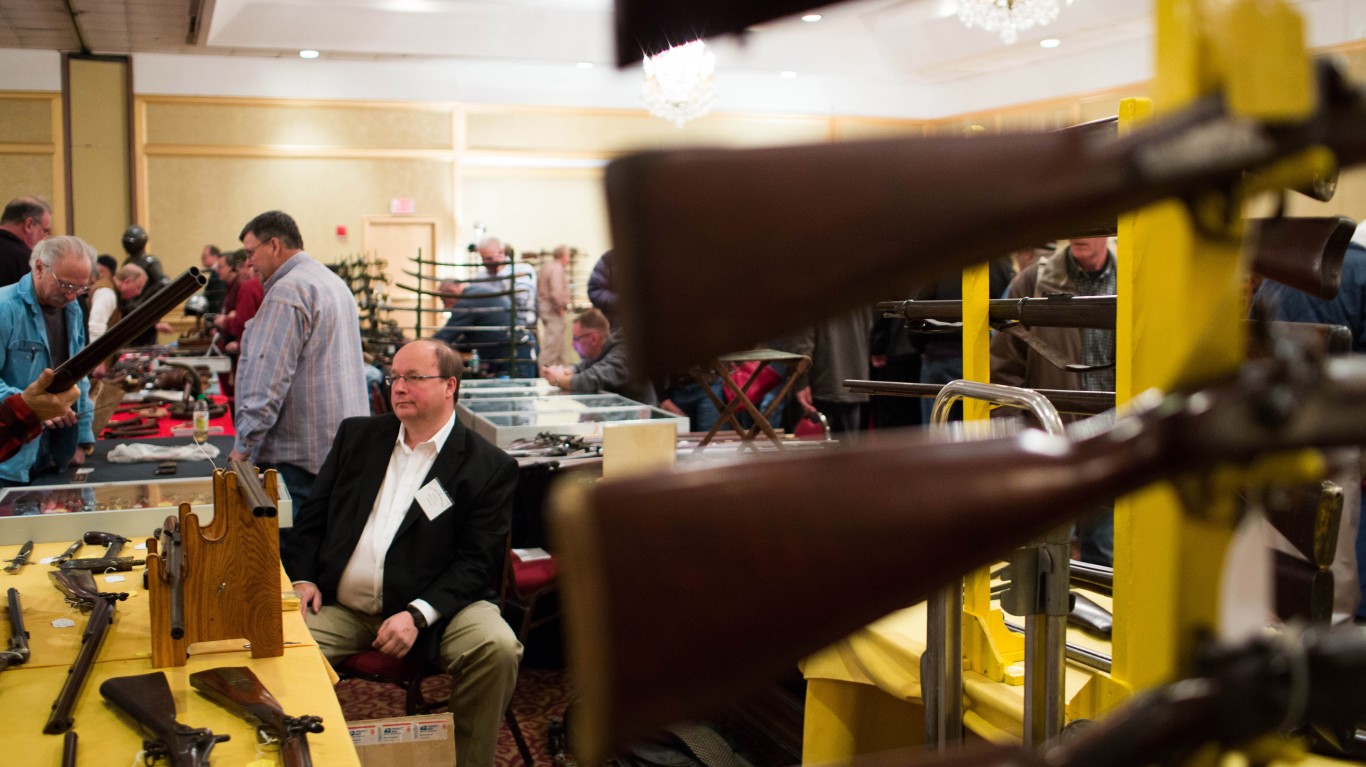
It has been almost 90 years since President Franklin Roosevelt signed the National Firearms Act into law. The National Firearms Act specifies that certain types of firearms need to be registered with the Secretary of the Treasury and that their owners are subject to a $200 tax. The types of weapons covered by the law fall into one of six categories: machine guns, silencers or suppressors, short-barreled rifles, short-barreled shotguns, destructive devices such as bombs or grenades, and “any other weapon,” which is a catch-all classification that includes certain firearms that can be concealed in items such as pens or walking canes. (This is where criminals in each state are most likely to obtain a gun.)
Since the law’s passage its’ terms have been amended. A provision was added in 1986 that effectively banned civilian ownership of new fully automatic weapons by blocking the transfer of possession of machine guns not already grandfathered in. Today, Americans seeking to own weapons regulated by the NFA must first receive official approval after completing a registration application and submitting a fingerprint card and the $200 tax payment — which is not as restrictive as it was when the law originated.
There are over 7.5 million registered NFA weapons nationwide, or 2,300 for every 100,000 Americans. The number of federally-registered weapons ranges from 462 to over 24,000 for every 100,000 people, depending on the state. (These are the states where the most people have bought guns so far in 2023.)
24/7 Wall St. identified the states with the most weapons registered under the NFA by using data from the Bureau of Alcohol, Tobacco, Firearms, and Explosives. States are ranked by the number of registered weapons adjusted for population. The states with the fewest registered weapons tend to be along the coast, particularly in the Northeast. These states typically have relatively strict gun control laws that go far beyond the terms of the NFA.
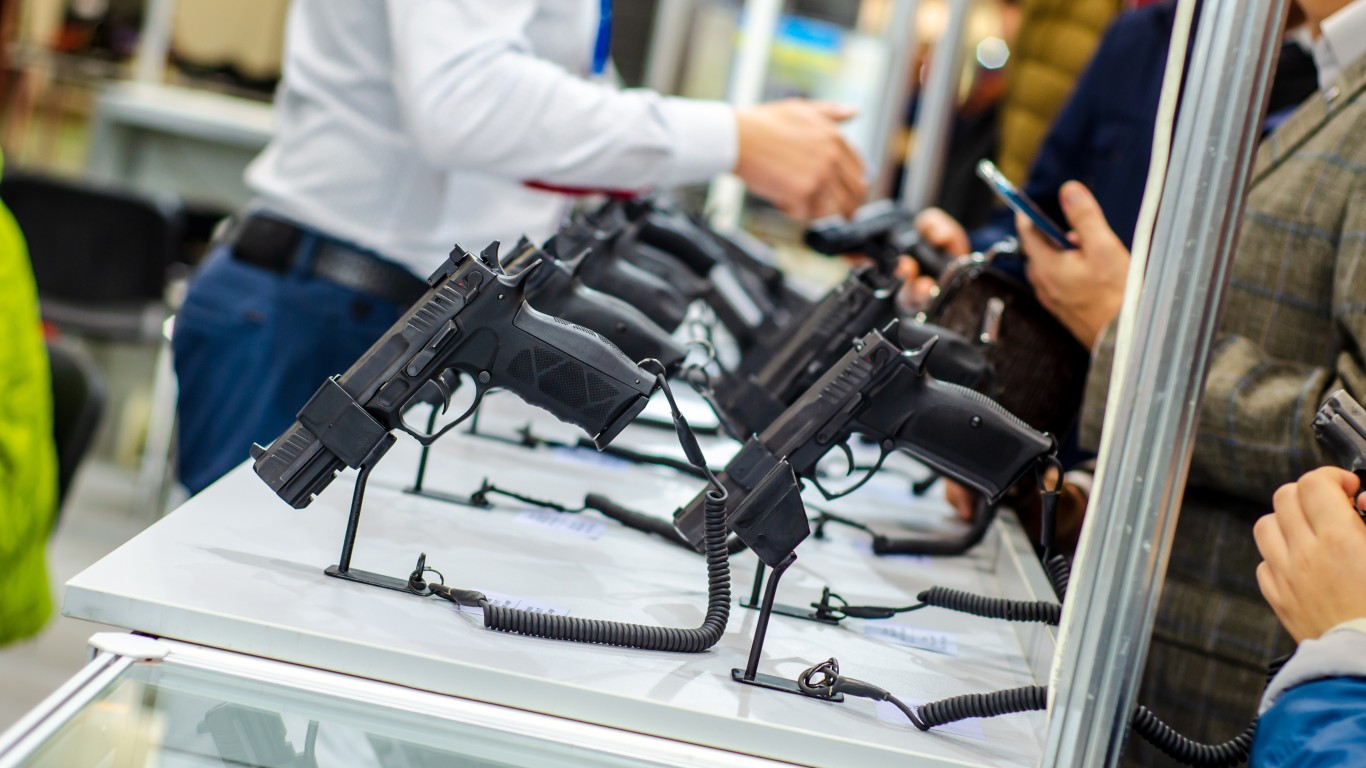
Why This Matters
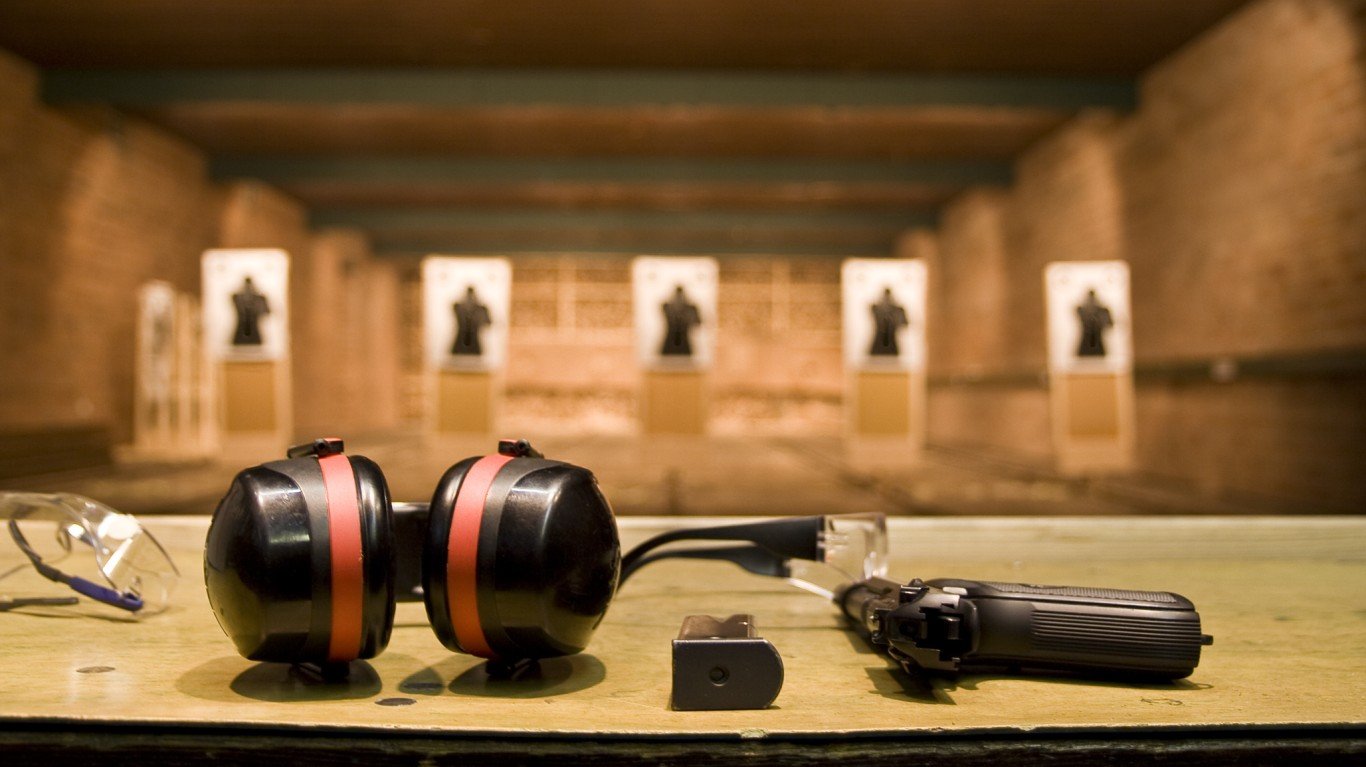
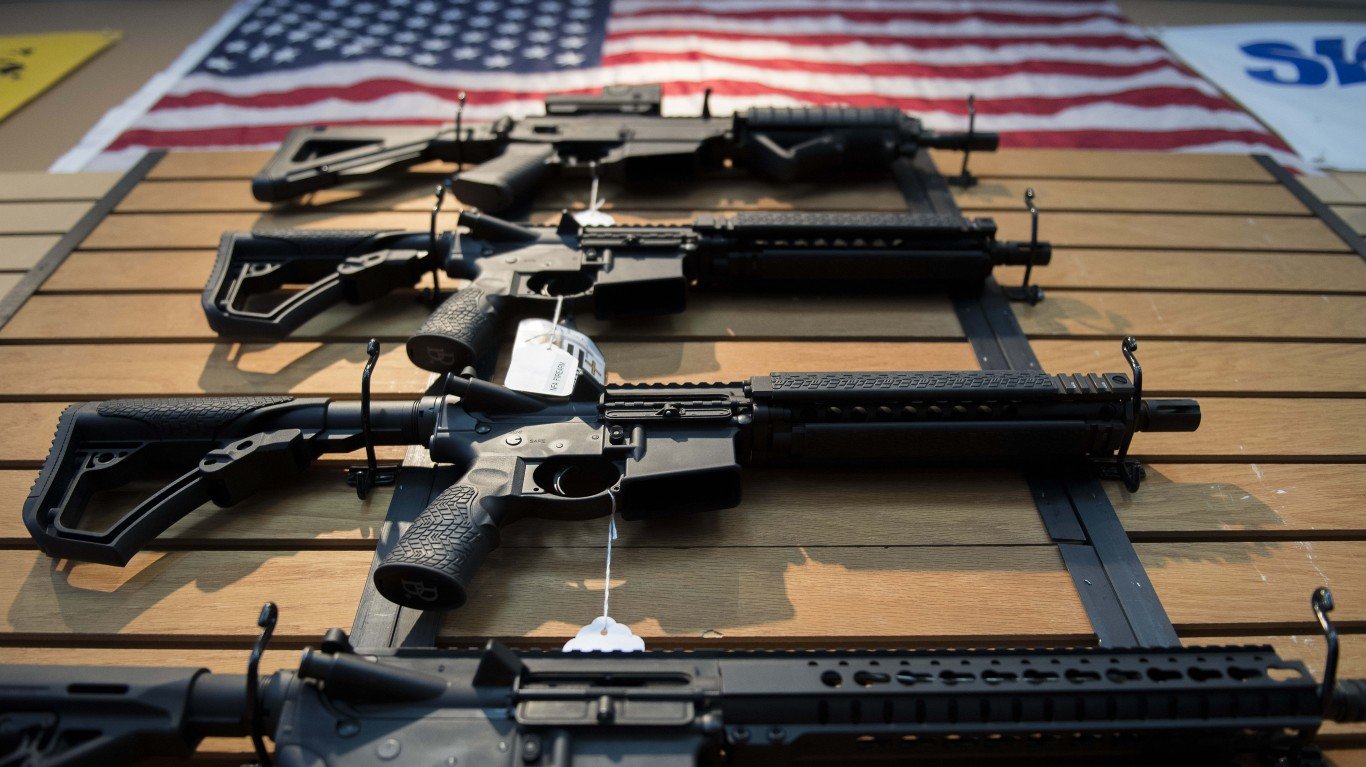
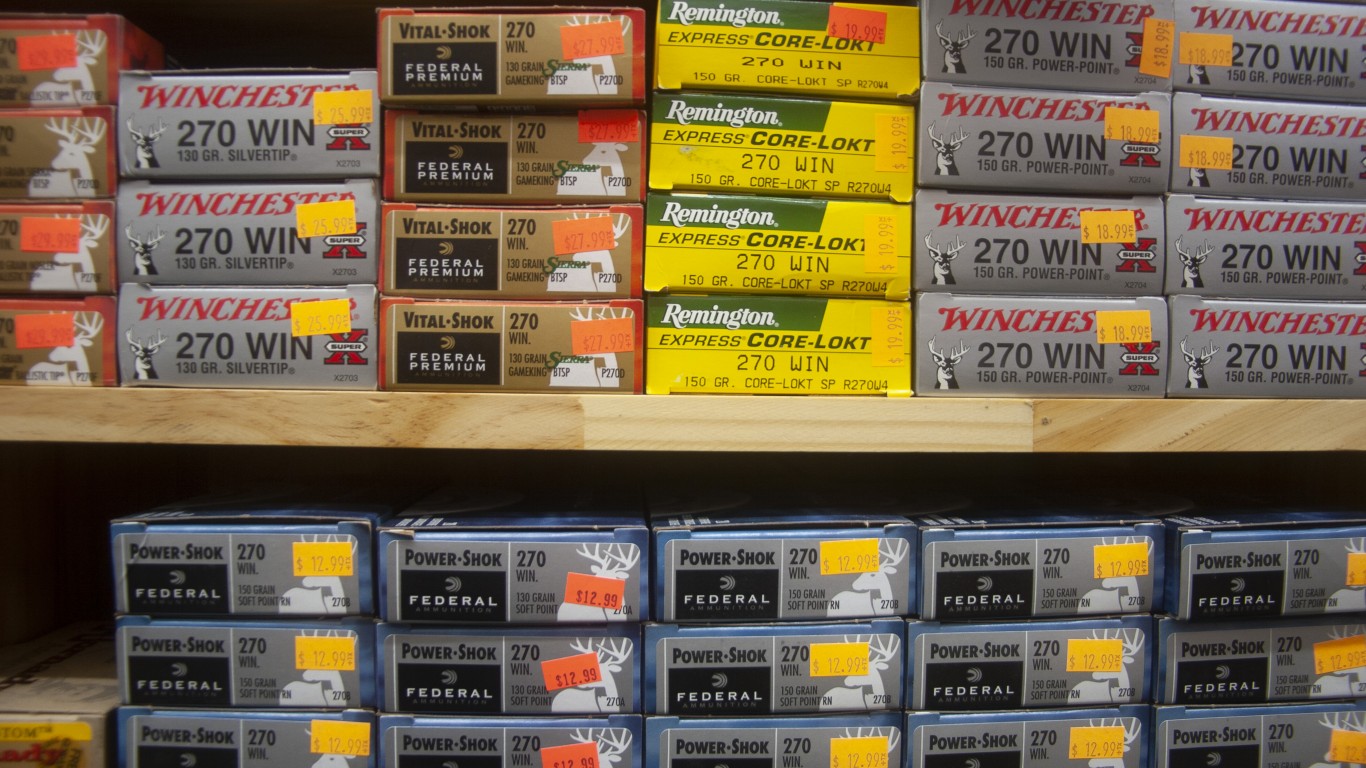
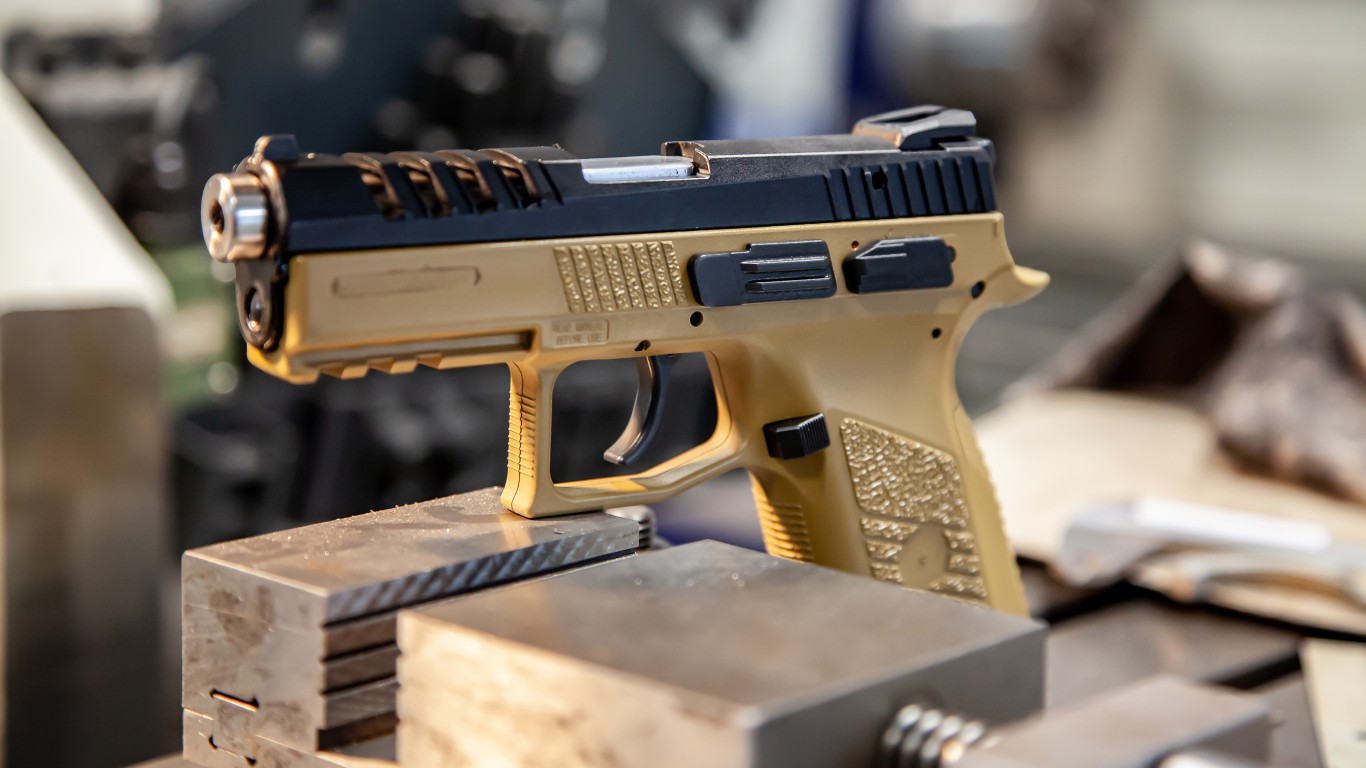
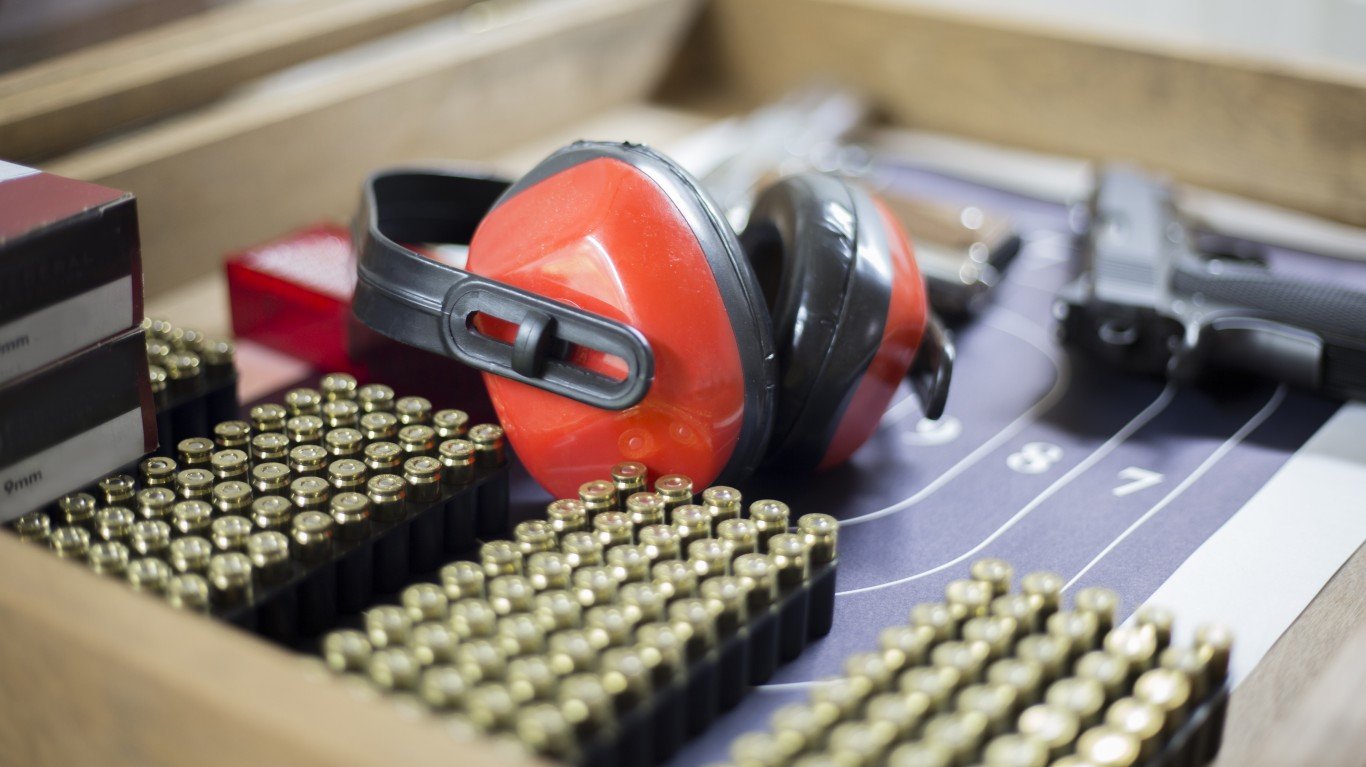
Source: BostjanT / E+ via Getty Images
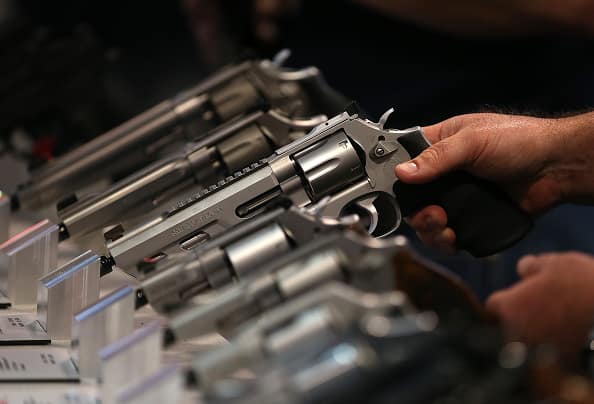
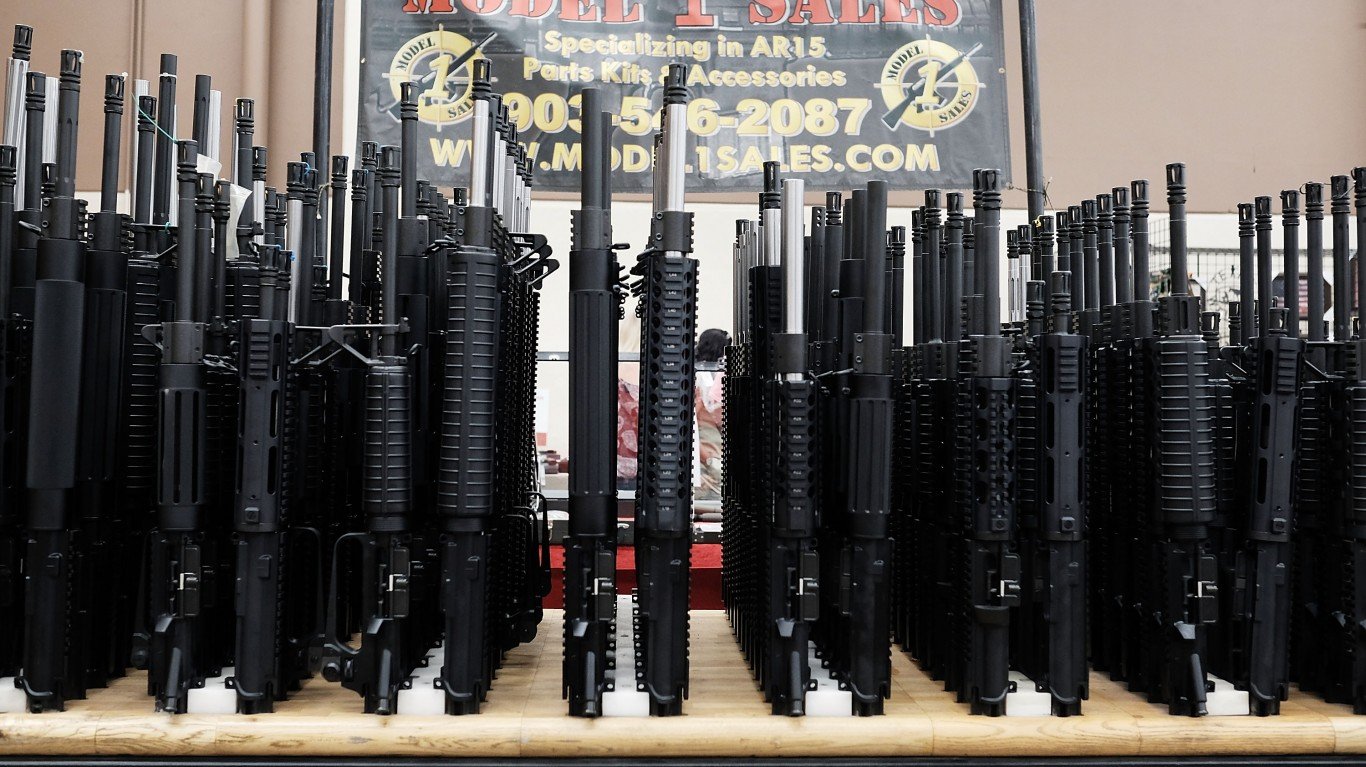
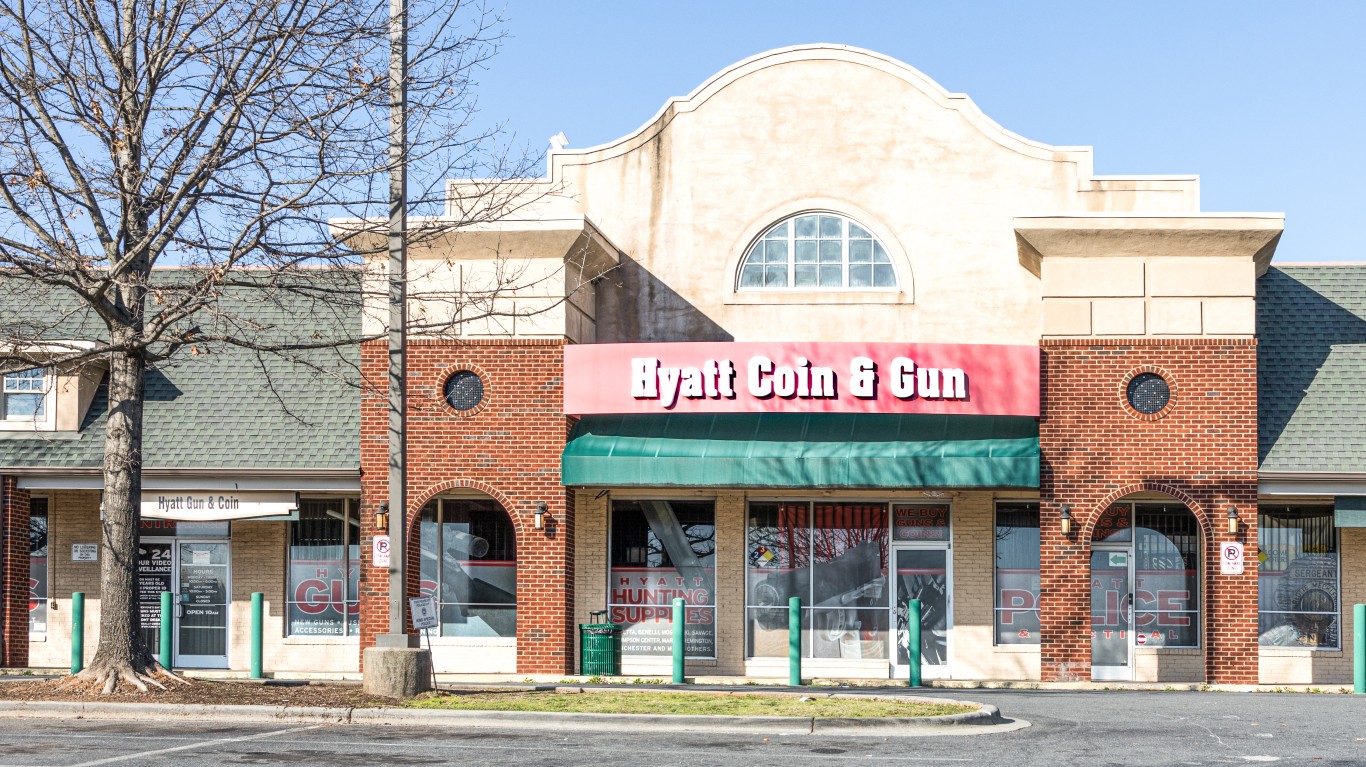
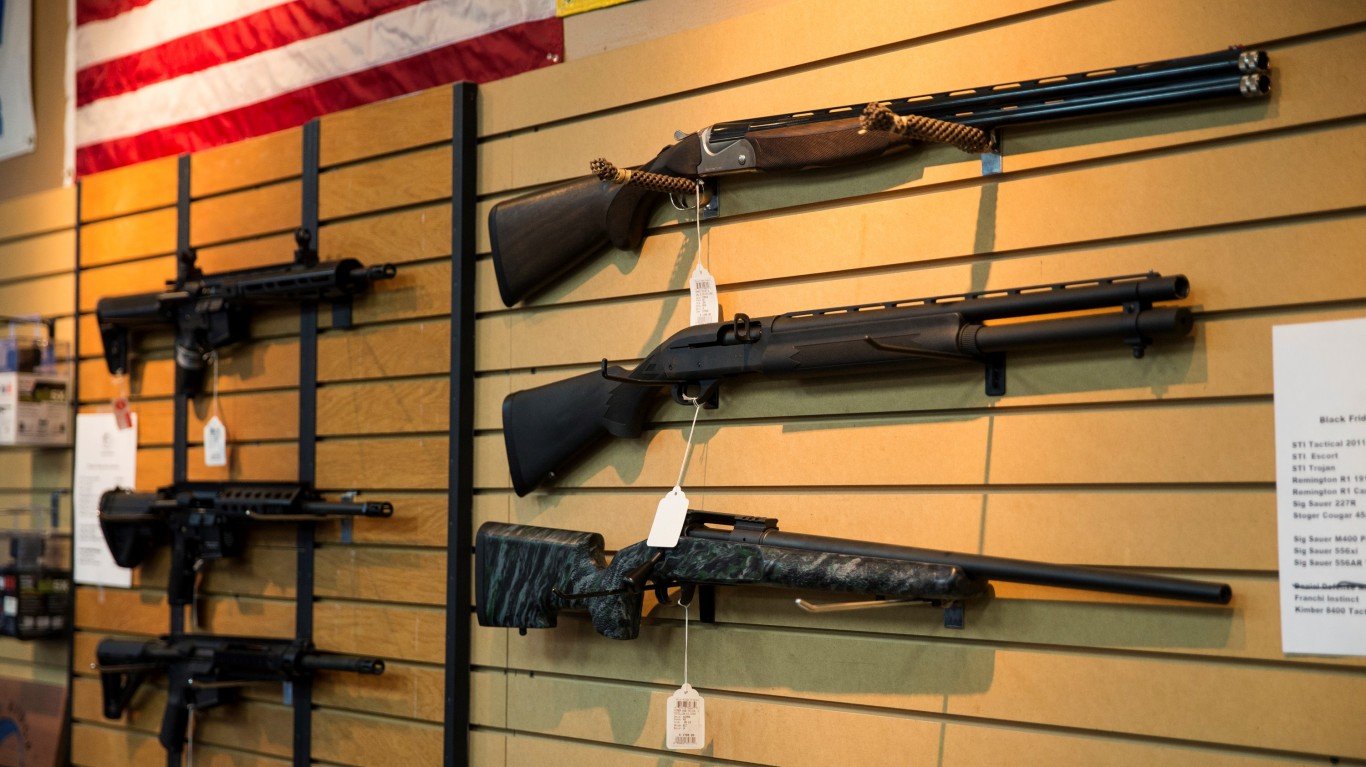
The firearm industry in the United States is continuing to grow. According to a report by the Firearm Industry Trade Association, the industry generated as much as $90.06 billion in total economic activity in 2023. Notable companies that manufacture, distribute, and sell firearms include Smith & Wesson, Ruger, Sig Sauer, and Springfield Armory. These companies stimulate the economy by creating an array of jobs as well as generating tax revenues at the state and federal level.
Here are the most common gun types owned in your state:
Read below for our detailed methodology.
50. Rhode Island
Source: John Moore / Getty Images News via Getty Images
- Total registered weapons: 462 per 100,000 people (4,887 total)
- Machine guns: 60 per 100,000 people – 3rd fewest (630 total)
- Silencers: 9 per 100,000 people – the fewest (96 total)
- Short-barreled rifles: 32 per 100,000 people – 2nd fewest (338 total)
- Short-barreled shotguns: 11 per 100,000 people – 2nd fewest (114 total)
49. New York

Source: Eloi_Omella / iStock via Getty Images
- Total registered weapons: 472 per 100,000 people (92,191 total)
- Machine guns: 69 per 100,000 people – 5th fewest (13,554 total)
- Silencers: 38 per 100,000 people – 4th fewest (7,406 total)
- Short-barreled rifles: 39 per 100,000 people – 4th fewest (7,622 total)
- Short-barreled shotguns: 39 per 100,000 people – 20th fewest (7,613 total)
48. Delaware
Source: ASphotowed / Getty Images
- Total registered weapons: 630 per 100,000 people (6,092 total)
- Machine guns: 55 per 100,000 people – 2nd fewest (537 total)
- Silencers: 42 per 100,000 people – 5th fewest (411 total)
- Short-barreled rifles: 58 per 100,000 people – 7th fewest (565 total)
- Short-barreled shotguns: 67 per 100,000 people – 10th most (651 total)
47. Hawaii

Source: okimo / iStock via Getty Images
- Total registered weapons: 653 per 100,000 people (9,280 total)
- Machine guns: 31 per 100,000 people – the fewest (441 total)
- Silencers: 28 per 100,000 people – 3rd fewest (403 total)
- Short-barreled rifles: 7 per 100,000 people – the fewest (93 total)
- Short-barreled shotguns: 5 per 100,000 people – the fewest (75 total)
46. Massachusetts
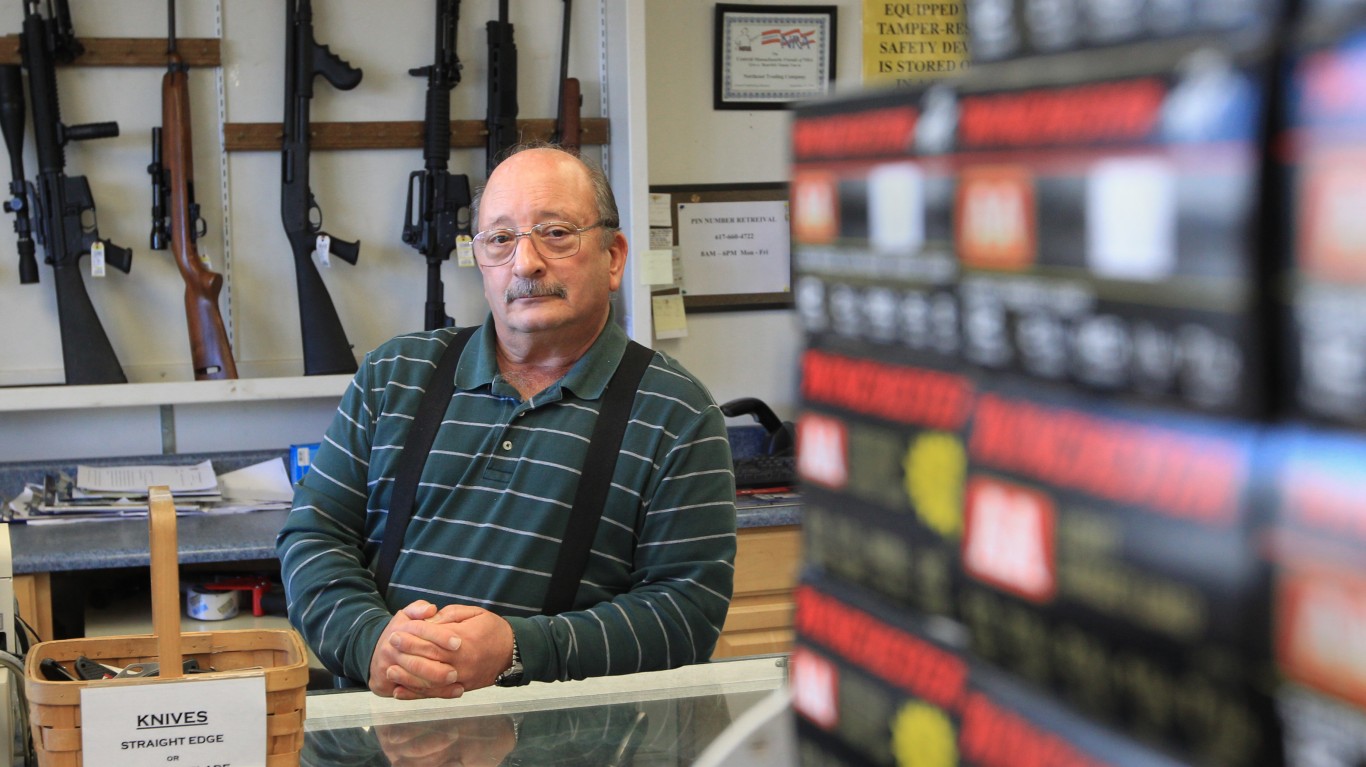
Source: Boston Globe / Boston Globe via Getty Images
- Total registered weapons: 657 per 100,000 people (45,138 total)
- Machine guns: 103 per 100,000 people – 7th fewest (7,070 total)
- Silencers: 151 per 100,000 people – 8th fewest (10,409 total)
- Short-barreled rifles: 88 per 100,000 people – 8th fewest (6,079 total)
- Short-barreled shotguns: 15 per 100,000 people – 5th fewest (1,040 total)
45. California

Source: DutcherAerials / E+ via Getty Images
- Total registered weapons: 1,033 per 100,000 people (406,360 total)
- Machine guns: 74 per 100,000 people – 6th fewest (29,112 total)
- Silencers: 44 per 100,000 people – 7th fewest (17,271 total)
- Short-barreled rifles: 39 per 100,000 people – 5th fewest (15,520 total)
- Short-barreled shotguns: 38 per 100,000 people – 17th fewest (14,757 total)
44. Michigan
Source: Spencer Platt / Getty Images News via Getty Images
- Total registered weapons: 1,101 per 100,000 people (109,835 total)
- Machine guns: 175 per 100,000 people – 19th fewest (17,464 total)
- Silencers: 495 per 100,000 people – 9th fewest (49,324 total)
- Short-barreled rifles: 91 per 100,000 people – 9th fewest (9,120 total)
- Short-barreled shotguns: 17 per 100,000 people – 6th fewest (1,715 total)
43. Illinois
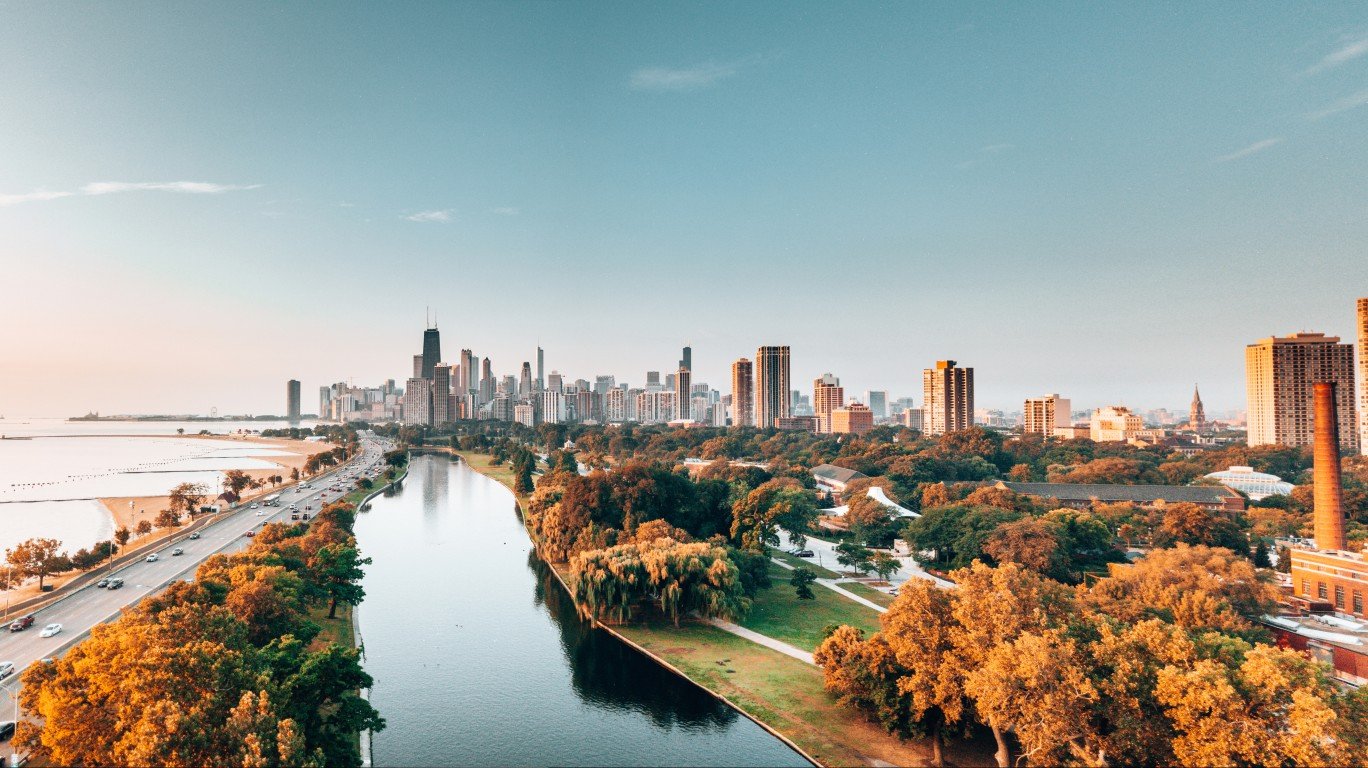
Source: franckreporter / E+ via Getty Images
- Total registered weapons: 1,138 per 100,000 people (144,749 total)
- Machine guns: 240 per 100,000 people – 20th most (30,576 total)
- Silencers: 26 per 100,000 people – 2nd fewest (3,297 total)
- Short-barreled rifles: 36 per 100,000 people – 3rd fewest (4,622 total)
- Short-barreled shotguns: 14 per 100,000 people – 3rd fewest (1,739 total)
42. New Jersey
Source: Anadolu Agency / Anadolu Agency via Getty Images
- Total registered weapons: 1,151 per 100,000 people (102,228 total)
- Machine guns: 500 per 100,000 people – 5th most (44,422 total)
- Silencers: 44 per 100,000 people – 6th fewest (3,889 total)
- Short-barreled rifles: 42 per 100,000 people – 6th fewest (3,775 total)
- Short-barreled shotguns: 28 per 100,000 people – 9th fewest (2,528 total)
41. Vermont
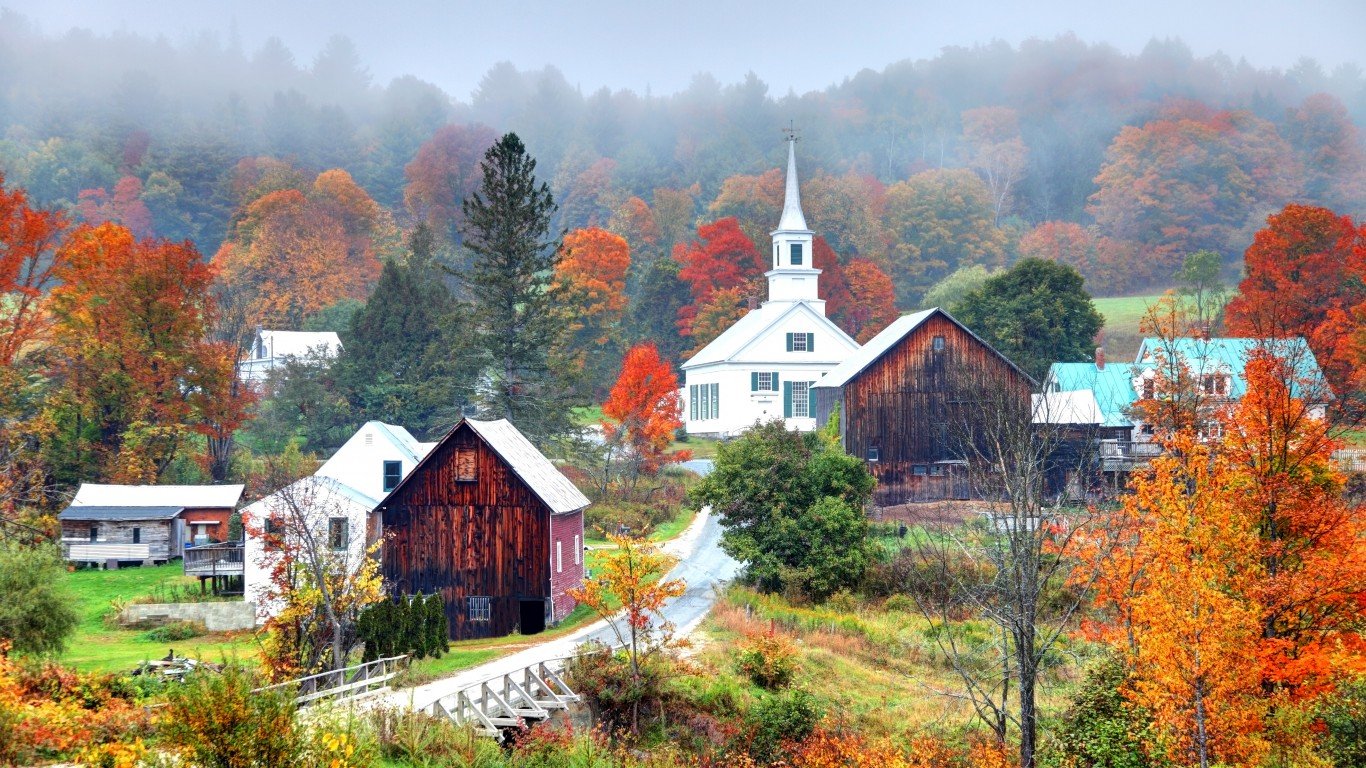
Source: DenisTangneyJr / E+ via Getty Images
- Total registered weapons: 1,514 per 100,000 people (9,451 total)
- Machine guns: 235 per 100,000 people – 22nd most (1,465 total)
- Silencers: 565 per 100,000 people – 12th fewest (3,528 total)
- Short-barreled rifles: 145 per 100,000 people – 16th fewest (904 total)
- Short-barreled shotguns: 34 per 100,000 people – 12th fewest (210 total)
40. Maine
Source: VistaVision / iStock Editorial via Getty Images
- Total registered weapons: 1,596 per 100,000 people (21,396 total)
- Machine guns: 381 per 100,000 people – 11th most (5,109 total)
- Silencers: 618 per 100,000 people – 14th fewest (8,285 total)
- Short-barreled rifles: 228 per 100,000 people – 14th most (3,057 total)
- Short-barreled shotguns: 41 per 100,000 people – 23rd fewest (556 total)
39. Wisconsin
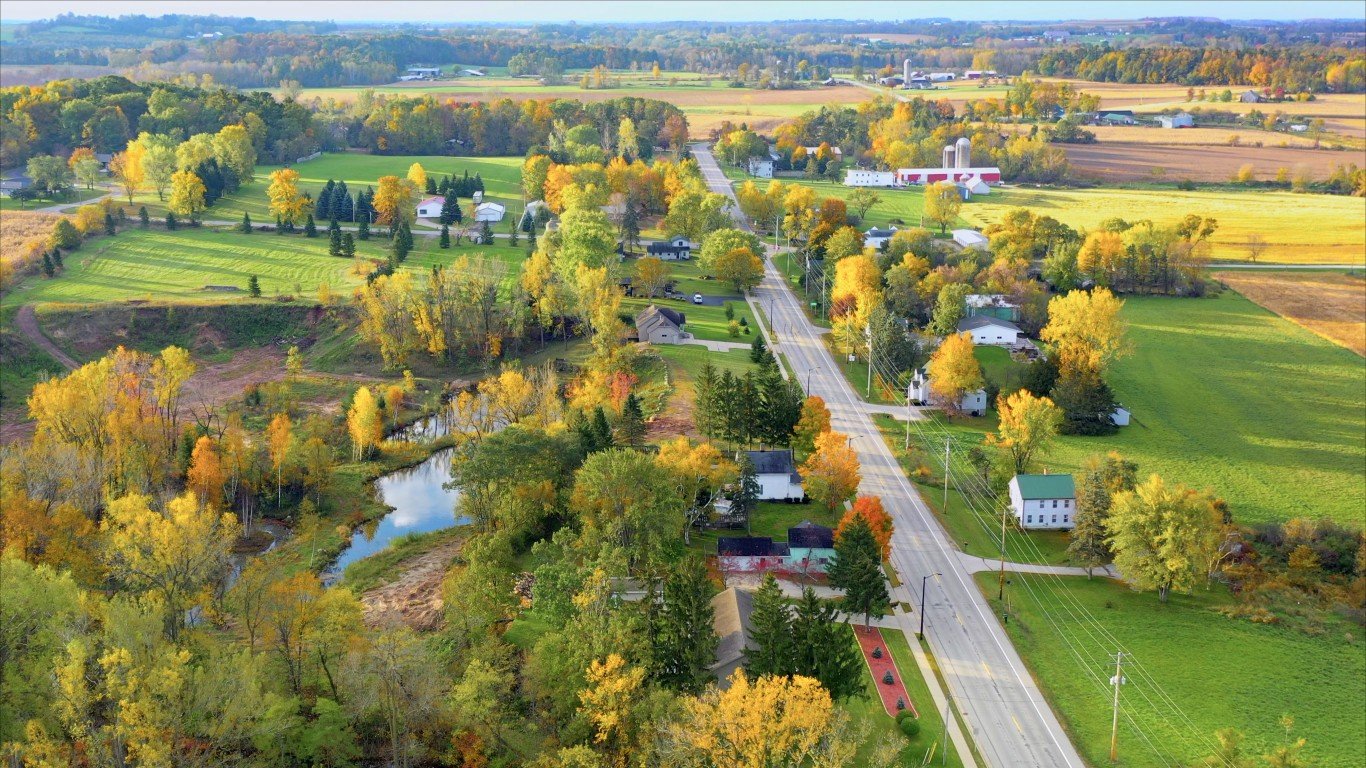
Source: JamesBrey / E+ via Getty Images
- Total registered weapons: 1,643 per 100,000 people (95,430 total)
- Machine guns: 144 per 100,000 people – 11th fewest (8,391 total)
- Silencers: 699 per 100,000 people – 16th fewest (40,596 total)
- Short-barreled rifles: 139 per 100,000 people – 15th fewest (8,070 total)
- Short-barreled shotguns: 25 per 100,000 people – 8th fewest (1,467 total)
38. Iowa
Source: artas / iStock via Getty Images
- Total registered weapons: 1,720 per 100,000 people (54,178 total)
- Machine guns: 229 per 100,000 people – 23rd most (7,228 total)
- Silencers: 715 per 100,000 people – 17th fewest (22,529 total)
- Short-barreled rifles: 93 per 100,000 people – 10th fewest (2,937 total)
- Short-barreled shotguns: 38 per 100,000 people – 19th fewest (1,212 total)
37. Ohio

Source: Sean Pavone / iStock via Getty Images
- Total registered weapons: 1,787 per 100,000 people (208,661 total)
- Machine guns: 197 per 100,000 people – 22nd fewest (22,979 total)
- Silencers: 589 per 100,000 people – 13th fewest (68,736 total)
- Short-barreled rifles: 130 per 100,000 people – 13th fewest (15,158 total)
- Short-barreled shotguns: 56 per 100,000 people – 14th most (6,567 total)
36. Missouri
Source: Scott Olson / Getty Images News via Getty Images
- Total registered weapons: 1,851 per 100,000 people (113,351 total)
- Machine guns: 182 per 100,000 people – 20th fewest (11,167 total)
- Silencers: 812 per 100,000 people – 20th fewest (49,754 total)
- Short-barreled rifles: 167 per 100,000 people – 21st fewest (10,230 total)
- Short-barreled shotguns: 49 per 100,000 people – 20th most (2,995 total)
35. Connecticut

Source: SeanPavonePhoto / iStock via Getty Images
- Total registered weapons: 2,097 per 100,000 people (74,874 total)
- Machine guns: 987 per 100,000 people – 2nd most (35,235 total)
- Silencers: 522 per 100,000 people – 10th fewest (18,648 total)
- Short-barreled rifles: 118 per 100,000 people – 11th fewest (4,212 total)
- Short-barreled shotguns: 32 per 100,000 people – 11th fewest (1,135 total)
34. North Carolina
Source: J. Michael Jones / iStock Editorial via Getty Images
- Total registered weapons: 2,139 per 100,000 people (222,166 total)
- Machine guns: 153 per 100,000 people – 12th fewest (15,875 total)
- Silencers: 739 per 100,000 people – 18th fewest (76,759 total)
- Short-barreled rifles: 168 per 100,000 people – 22nd fewest (17,478 total)
- Short-barreled shotguns: 34 per 100,000 people – 13th fewest (3,563 total)
33. Washington

Source: chinaface / E+ via Getty Images
- Total registered weapons: 2,203 per 100,000 people (165,534 total)
- Machine guns: 62 per 100,000 people – 4th fewest (4,673 total)
- Silencers: 1,042 per 100,000 people – 23rd most (78,279 total)
- Short-barreled rifles: 225 per 100,000 people – 16th most (16,919 total)
- Short-barreled shotguns: 14 per 100,000 people – 4th fewest (1,049 total)
32. Tennessee
Source: krblokhin / iStock Editorial via Getty Images
- Total registered weapons: 2,238 per 100,000 people (151,536 total)
- Machine guns: 217 per 100,000 people – 25th fewest (14,683 total)
- Silencers: 894 per 100,000 people – 23rd fewest (60,573 total)
- Short-barreled rifles: 197 per 100,000 people – 22nd most (13,350 total)
- Short-barreled shotguns: 97 per 100,000 people – 6th most (6,573 total)
31. Nebraska

Source: Davel5957 / iStock via Getty Images
- Total registered weapons: 2,249 per 100,000 people (43,261 total)
- Machine guns: 125 per 100,000 people – 8th fewest (2,403 total)
- Silencers: 1,345 per 100,000 people – 12th most (25,879 total)
- Short-barreled rifles: 180 per 100,000 people – 24th most (3,472 total)
- Short-barreled shotguns: 47 per 100,000 people – 22nd most (911 total)
30. Maryland

Source: Anadolu Agency / Anadolu Agency via Getty Images
- Total registered weapons: 2,257 per 100,000 people (136,257 total)
- Machine guns: 494 per 100,000 people – 6th most (29,854 total)
- Silencers: 535 per 100,000 people – 11th fewest (32,275 total)
- Short-barreled rifles: 126 per 100,000 people – 12th fewest (7,633 total)
- Short-barreled shotguns: 65 per 100,000 people – 12th most (3,898 total)
29. Minnesota
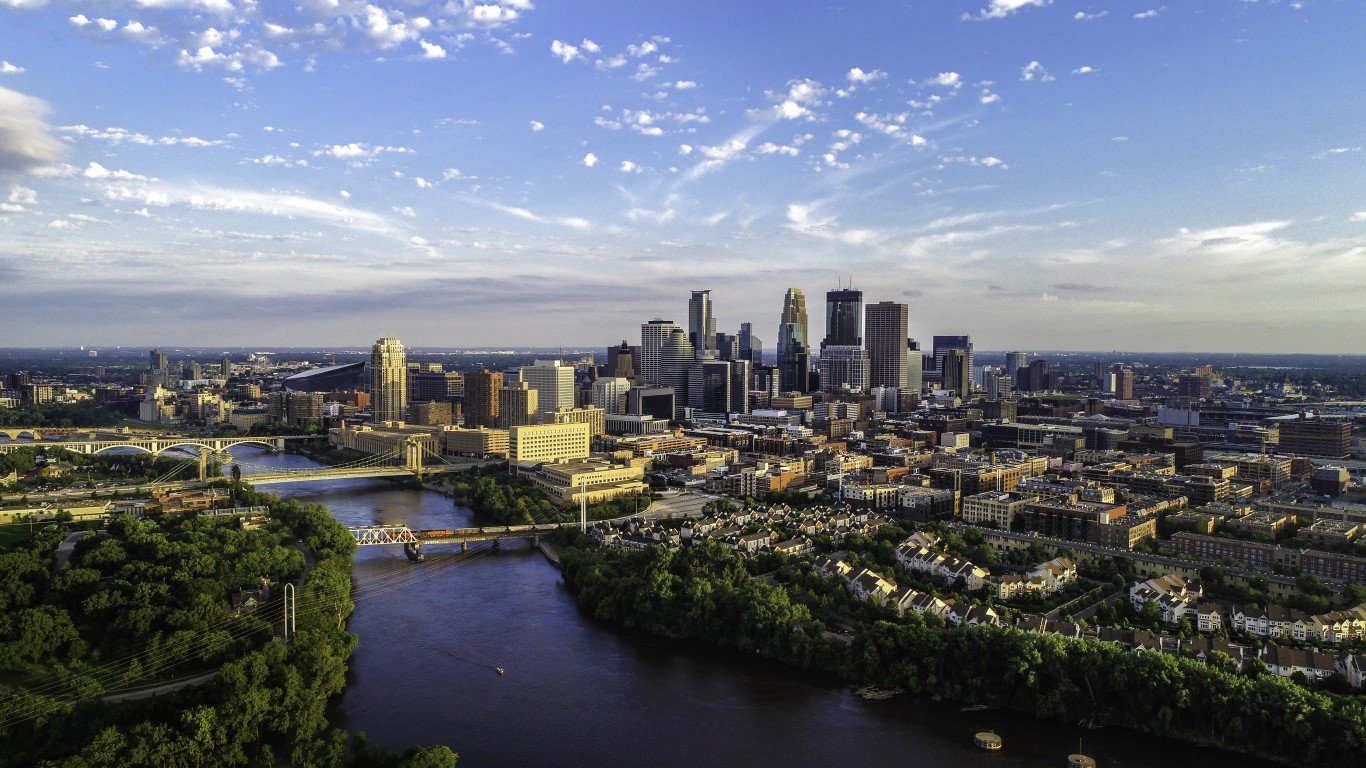
Source: Gian Lorenzo Ferretti Photography / E+ via Getty Images
- Total registered weapons: 2,318 per 100,000 people (129,825 total)
- Machine guns: 157 per 100,000 people – 14th fewest (8,779 total)
- Silencers: 860 per 100,000 people – 22nd fewest (48,154 total)
- Short-barreled rifles: 137 per 100,000 people – 14th fewest (7,681 total)
- Short-barreled shotguns: 21 per 100,000 people – 7th fewest (1,154 total)
28. Oregon
Source: AFP Contributor / AFP via Getty Images
- Total registered weapons: 2,334 per 100,000 people (97,474 total)
- Machine guns: 161 per 100,000 people – 15th fewest (6,740 total)
- Silencers: 1,178 per 100,000 people – 20th most (49,197 total)
- Short-barreled rifles: 227 per 100,000 people – 15th most (9,483 total)
- Short-barreled shotguns: 41 per 100,000 people – 22nd fewest (1,717 total)
27. South Carolina

Source: Kruck20 / iStock via Getty Images
- Total registered weapons: 2,341 per 100,000 people (119,205 total)
- Machine guns: 216 per 100,000 people – 24th fewest (10,997 total)
- Silencers: 990 per 100,000 people – 24th most (50,422 total)
- Short-barreled rifles: 178 per 100,000 people – 24th fewest (9,088 total)
- Short-barreled shotguns: 78 per 100,000 people – 8th most (3,948 total)
26. Indiana
Source: Scott Olson / Getty Images News via Getty Images
- Total registered weapons: 2,353 per 100,000 people (157,546 total)
- Machine guns: 316 per 100,000 people – 13th most (21,137 total)
- Silencers: 944 per 100,000 people – 24th fewest (63,249 total)
- Short-barreled rifles: 162 per 100,000 people – 19th fewest (10,872 total)
- Short-barreled shotguns: 142 per 100,000 people – 2nd most (9,541 total)
25. Kansas

Source: Sean Pavone / iStock via Getty Images
- Total registered weapons: 2,398 per 100,000 people (69,850 total)
- Machine guns: 137 per 100,000 people – 10th fewest (3,986 total)
- Silencers: 1,092 per 100,000 people – 21st most (31,811 total)
- Short-barreled rifles: 203 per 100,000 people – 19th most (5,924 total)
- Short-barreled shotguns: 44 per 100,000 people – 24th most (1,271 total)
24. Kentucky
Source: 2008 Getty Images / Getty Images News via Getty Images
- Total registered weapons: 2,439 per 100,000 people (108,833 total)
- Machine guns: 406 per 100,000 people – 9th most (18,128 total)
- Silencers: 987 per 100,000 people – 25th most (44,040 total)
- Short-barreled rifles: 151 per 100,000 people – 17th fewest (6,717 total)
- Short-barreled shotguns: 48 per 100,000 people – 21st most (2,121 total)
23. Florida

Source: Michael Warren / iStock via Getty Images
- Total registered weapons: 2,445 per 100,000 people (518,725 total)
- Machine guns: 222 per 100,000 people – 24th most (47,117 total)
- Silencers: 826 per 100,000 people – 21st fewest (175,156 total)
- Short-barreled rifles: 240 per 100,000 people – 12th most (50,848 total)
- Short-barreled shotguns: 50 per 100,000 people – 19th most (10,587 total)
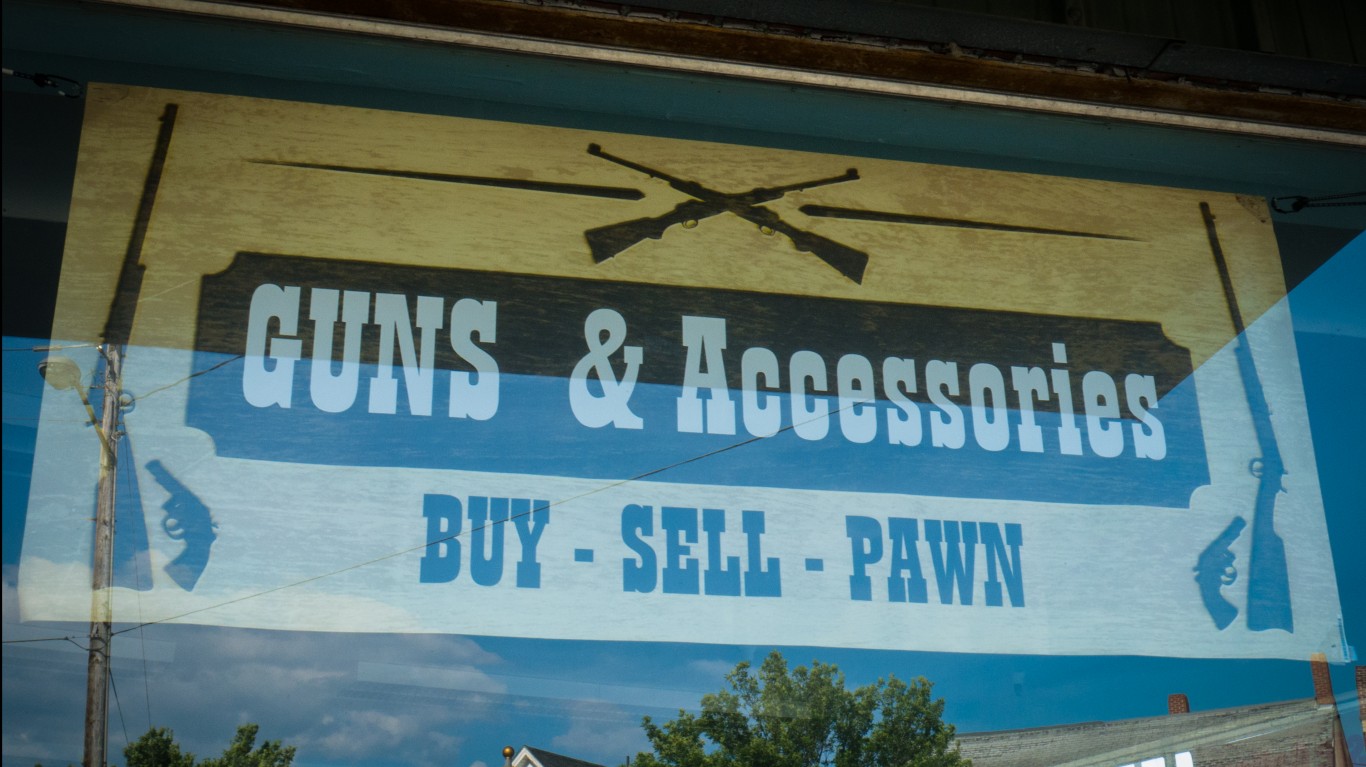
22. Oklahoma
Source: wfryer / Flickr
- Total registered weapons: 2,617 per 100,000 people (103,368 total)
- Machine guns: 248 per 100,000 people – 16th most (9,776 total)
- Silencers: 1,580 per 100,000 people – 10th most (62,404 total)
- Short-barreled rifles: 221 per 100,000 people – 17th most (8,738 total)
- Short-barreled shotguns: 51 per 100,000 people – 17th most (2,023 total)
21. Colorado
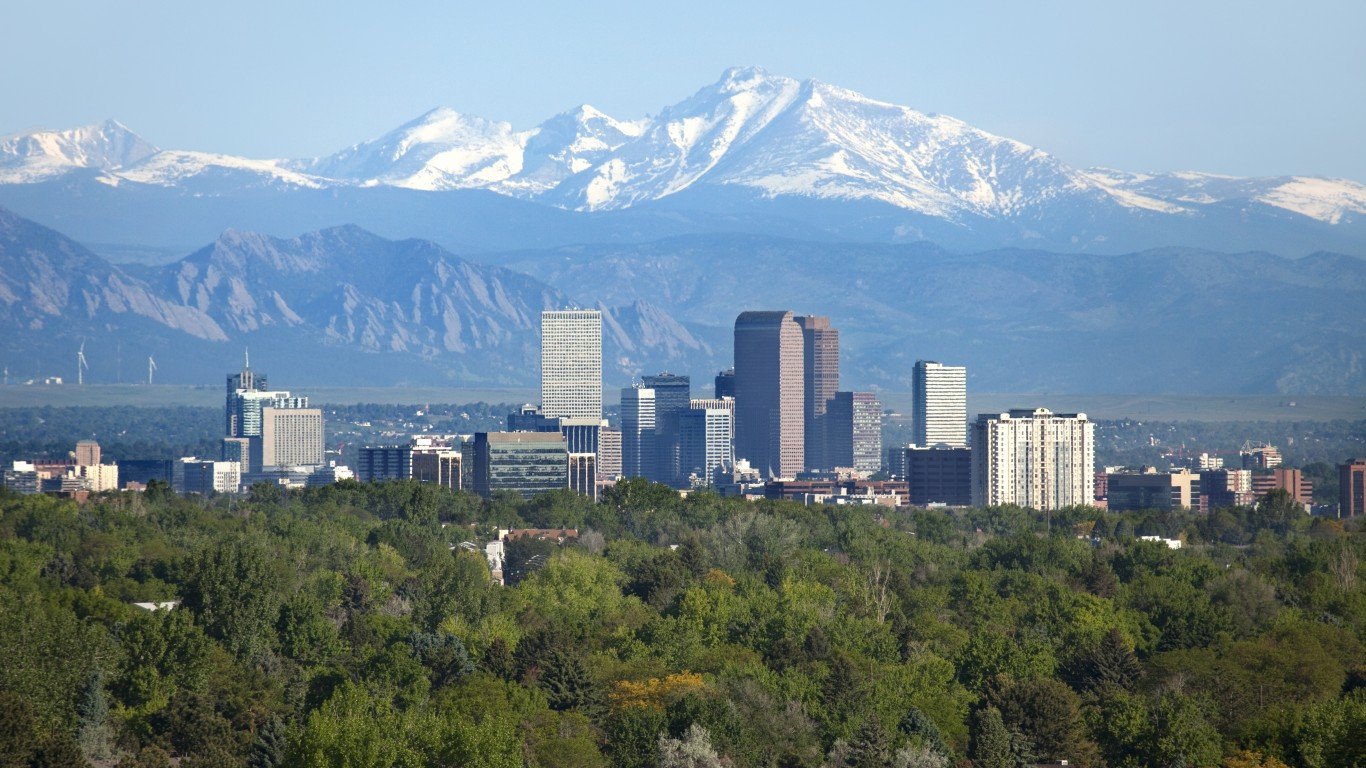
Source: milehightraveler / iStock via Getty Images
- Total registered weapons: 2,628 per 100,000 people (149,382 total)
- Machine guns: 135 per 100,000 people – 9th fewest (7,666 total)
- Silencers: 1,179 per 100,000 people – 19th most (67,008 total)
- Short-barreled rifles: 238 per 100,000 people – 13th most (13,509 total)
- Short-barreled shotguns: 37 per 100,000 people – 15th fewest (2,119 total)
20. Mississippi
Source: Mike Kemp / In Pictures via Getty Images
- Total registered weapons: 2,707 per 100,000 people (80,712 total)
- Machine guns: 165 per 100,000 people – 17th fewest (4,906 total)
- Silencers: 1,226 per 100,000 people – 17th most (36,545 total)
- Short-barreled rifles: 180 per 100,000 people – 25th fewest (5,354 total)
- Short-barreled shotguns: 38 per 100,000 people – 18th fewest (1,132 total)
19. Pennsylvania

Source: Spencer Platt / Getty Images News via Getty Images
- Total registered weapons: 2,721 per 100,000 people (348,167 total)
- Machine guns: 165 per 100,000 people – 18th fewest (21,169 total)
- Silencers: 653 per 100,000 people – 15th fewest (83,563 total)
- Short-barreled rifles: 166 per 100,000 people – 20th fewest (21,215 total)
- Short-barreled shotguns: 109 per 100,000 people – 4th most (13,884 total)
18. West Virginia
Source: jfbenning / iStock Editorial via Getty Images
- Total registered weapons: 2,820 per 100,000 people (50,963 total)
- Machine guns: 407 per 100,000 people – 8th most (7,359 total)
- Silencers: 758 per 100,000 people – 19th fewest (13,696 total)
- Short-barreled rifles: 161 per 100,000 people – 18th fewest (2,913 total)
- Short-barreled shotguns: 67 per 100,000 people – 11th most (1,215 total)
17. Georgia
Source: TPAP8228 / iStock via Getty Images
- Total registered weapons: 2,892 per 100,000 people (304,124 total)
- Machine guns: 405 per 100,000 people – 10th most (42,545 total)
- Silencers: 1,232 per 100,000 people – 16th most (129,566 total)
- Short-barreled rifles: 202 per 100,000 people – 20th most (21,232 total)
- Short-barreled shotguns: 114 per 100,000 people – 3rd most (12,026 total)
16. Louisiana
Source: Anadolu Agency / Anadolu Agency via Getty Images
- Total registered weapons: 3,260 per 100,000 people (152,061 total)
- Machine guns: 154 per 100,000 people – 13th fewest (7,206 total)
- Silencers: 1,544 per 100,000 people – 11th most (72,042 total)
- Short-barreled rifles: 197 per 100,000 people – 21st most (9,212 total)
- Short-barreled shotguns: 43 per 100,000 people – 25th most (2,025 total)
15. Montana
Source: Cheri Alguire / iStock Editorial via Getty Images
- Total registered weapons: 3,455 per 100,000 people (36,678 total)
- Machine guns: 238 per 100,000 people – 21st most (2,531 total)
- Silencers: 2,393 per 100,000 people – 6th most (25,409 total)
- Short-barreled rifles: 246 per 100,000 people – 11th most (2,612 total)
- Short-barreled shotguns: 62 per 100,000 people – 13th most (660 total)
14. Texas
Source: Rick Gershon / Getty Images News via Getty Images
- Total registered weapons: 3,515 per 100,000 people (1,006,555 total)
- Machine guns: 162 per 100,000 people – 16th fewest (46,318 total)
- Silencers: 1,848 per 100,000 people – 9th most (529,150 total)
- Short-barreled rifles: 283 per 100,000 people – 9th most (81,000 total)
- Short-barreled shotguns: 36 per 100,000 people – 14th fewest (10,362 total)
13. Arizona
Source: Ethan Miller / Getty Images News via Getty Images
- Total registered weapons: 3,606 per 100,000 people (258,691 total)
- Machine guns: 265 per 100,000 people – 15th most (19,032 total)
- Silencers: 1,190 per 100,000 people – 18th most (85,353 total)
- Short-barreled rifles: 351 per 100,000 people – 5th most (25,203 total)
- Short-barreled shotguns: 44 per 100,000 people – 23rd most (3,170 total)
12. Utah
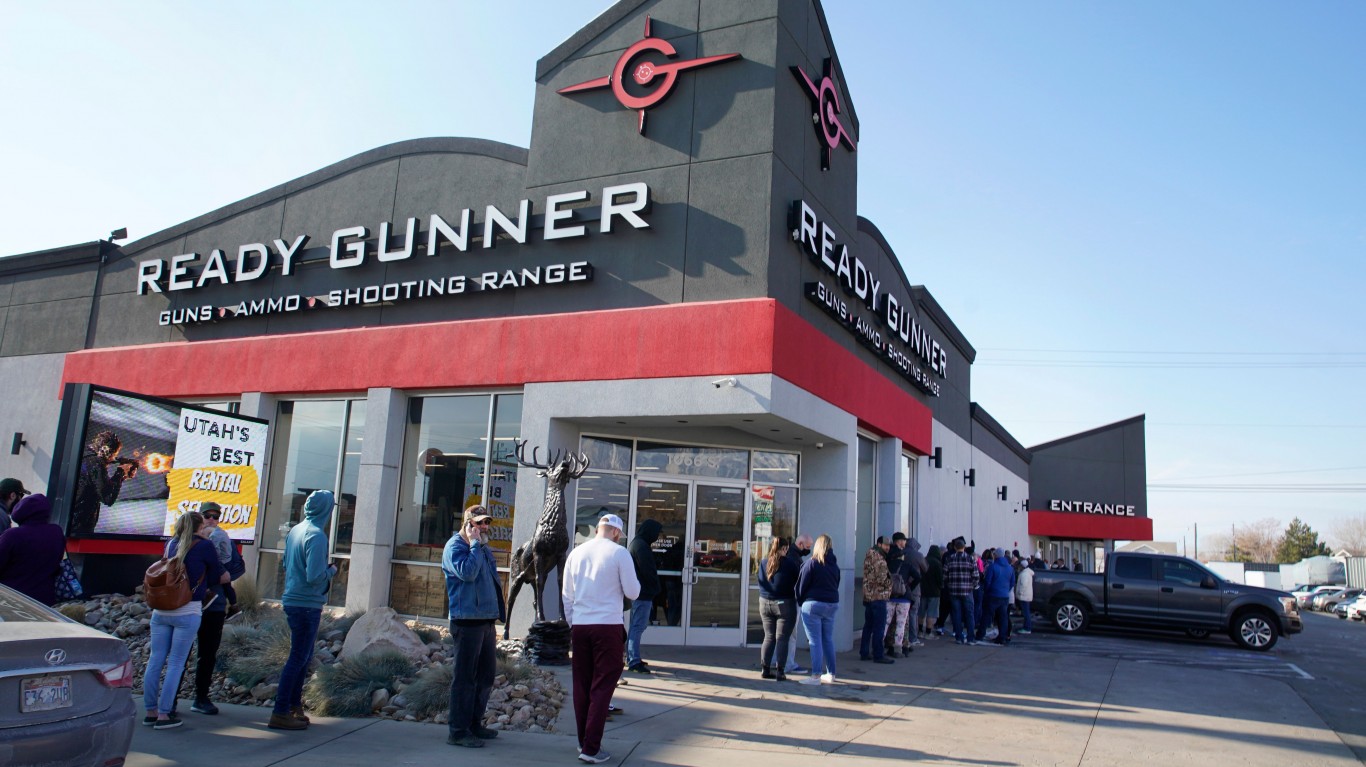
Source: GEORGE FREY / AFP via Getty Images
- Total registered weapons: 3,758 per 100,000 people (118,408 total)
- Machine guns: 246 per 100,000 people – 18th most (7,745 total)
- Silencers: 2,525 per 100,000 people – 5th most (79,557 total)
- Short-barreled rifles: 292 per 100,000 people – 8th most (9,212 total)
- Short-barreled shotguns: 53 per 100,000 people – 15th most (1,668 total)
11. Alaska
Source: 2022 Getty Images / Getty Images News via Getty Images
- Total registered weapons: 3,831 per 100,000 people (28,237 total)
- Machine guns: 245 per 100,000 people – 19th most (1,802 total)
- Silencers: 2,061 per 100,000 people – 8th most (15,192 total)
- Short-barreled rifles: 422 per 100,000 people – 2nd most (3,108 total)
- Short-barreled shotguns: 208 per 100,000 people – the most (1,534 total)
10. Nevada
Source: 2011 Getty Images / Getty Images News via Getty Images
- Total registered weapons: 3,927 per 100,000 people (119,007 total)
- Machine guns: 481 per 100,000 people – 7th most (14,577 total)
- Silencers: 1,250 per 100,000 people – 15th most (37,880 total)
- Short-barreled rifles: 418 per 100,000 people – 3rd most (12,662 total)
- Short-barreled shotguns: 83 per 100,000 people – 7th most (2,500 total)
9. Alabama
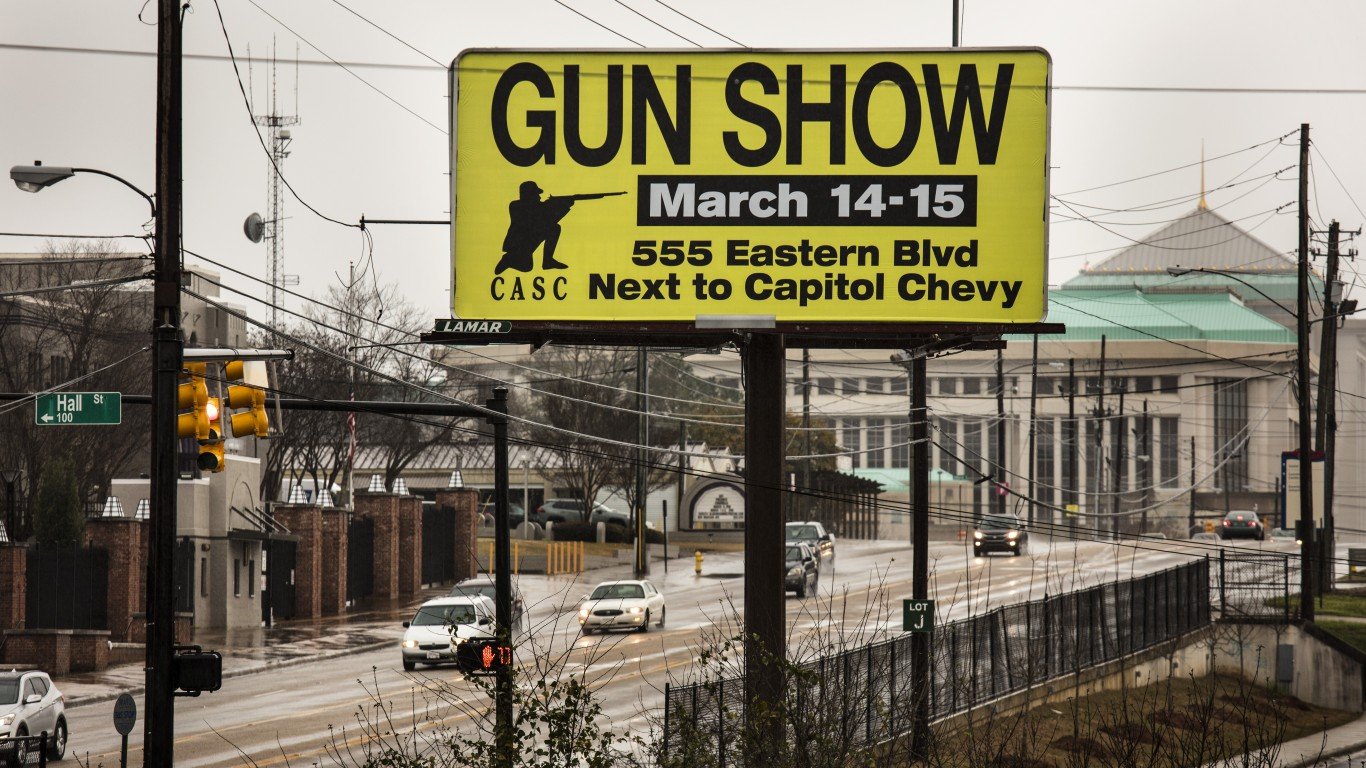
Source: Barry Lewis / In Pictures via Getty Images
- Total registered weapons: 3,983 per 100,000 people (194,920 total)
- Machine guns: 709 per 100,000 people – 3rd most (34,702 total)
- Silencers: 1,318 per 100,000 people – 13th most (64,506 total)
- Short-barreled rifles: 180 per 100,000 people – 25th most (8,830 total)
- Short-barreled shotguns: 52 per 100,000 people – 16th most (2,552 total)
8. North Dakota
Source: wingedwolf / iStock via Getty Images
- Total registered weapons: 4,074 per 100,000 people (30,975 total)
- Machine guns: 220 per 100,000 people – 25th most (1,670 total)
- Silencers: 3,030 per 100,000 people – 2nd most (23,042 total)
- Short-barreled rifles: 263 per 100,000 people – 10th most (2,003 total)
- Short-barreled shotguns: 42 per 100,000 people – 24th fewest (319 total)
7. Idaho
Source: SolidMaks / Getty Images
- Total registered weapons: 4,356 per 100,000 people (76,425 total)
- Machine guns: 302 per 100,000 people – 14th most (5,299 total)
- Silencers: 2,323 per 100,000 people – 7th most (40,755 total)
- Short-barreled rifles: 306 per 100,000 people – 7th most (5,376 total)
- Short-barreled shotguns: 37 per 100,000 people – 16th fewest (654 total)
6. Arkansas
Source: artas / iStock via Getty Images
- Total registered weapons: 4,448 per 100,000 people (133,981 total)
- Machine guns: 189 per 100,000 people – 21st fewest (5,689 total)
- Silencers: 1,264 per 100,000 people – 14th most (38,058 total)
- Short-barreled rifles: 169 per 100,000 people – 23rd fewest (5,076 total)
- Short-barreled shotguns: 43 per 100,000 people – 25th fewest (1,294 total)
5. Virginia
Source: Alex Wong / Getty Images News via Getty Images
- Total registered weapons: 4,979 per 100,000 people (423,707 total)
- Machine guns: 516 per 100,000 people – 4th most (43,877 total)
- Silencers: 1,063 per 100,000 people – 22nd most (90,454 total)
- Short-barreled rifles: 310 per 100,000 people – 6th most (26,361 total)
- Short-barreled shotguns: 105 per 100,000 people – 5th most (8,935 total)
4. New Hampshire
Source: Christopher Capozziello / Getty Images News via Getty Images
- Total registered weapons: 5,345 per 100,000 people (72,433 total)
- Machine guns: 1,536 per 100,000 people – the most (20,817 total)
- Silencers: 2,727 per 100,000 people – 4th most (36,954 total)
- Short-barreled rifles: 562 per 100,000 people – the most (7,613 total)
- Short-barreled shotguns: 50 per 100,000 people – 18th most (681 total)
3. New Mexico
Source: JannHuizenga / iStock via Getty Images
- Total registered weapons: 5,864 per 100,000 people (122,968 total)
- Machine guns: 202 per 100,000 people – 23rd fewest (4,233 total)
- Silencers: 948 per 100,000 people – 25th fewest (19,873 total)
- Short-barreled rifles: 219 per 100,000 people – 18th most (4,590 total)
- Short-barreled shotguns: 40 per 100,000 people – 21st fewest (839 total)
2. South Dakota
Source: LifestyleVisuals / iStock via Getty Images
- Total registered weapons: 7,354 per 100,000 people (64,666 total)
- Machine guns: 247 per 100,000 people – 17th most (2,176 total)
- Silencers: 6,330 per 100,000 people – the most (55,666 total)
- Short-barreled rifles: 183 per 100,000 people – 23rd most (1,612 total)
- Short-barreled shotguns: 30 per 100,000 people – 10th fewest (265 total)
1. Wyoming
Source: 2023 Getty Images / Getty Images News via Getty Images
- Total registered weapons: 24,468 per 100,000 people (142,247 total)
- Machine guns: 347 per 100,000 people – 12th most (2,019 total)
- Silencers: 2,869 per 100,000 people – 3rd most (16,681 total)
- Short-barreled rifles: 359 per 100,000 people – 4th most (2,089 total)
- Short-barreled shotguns: 74 per 100,000 people – 9th most (433 total)
Methodology
To identify the states with the most registered weapons, 24/7 Wall St. reviewed the Firearms Commerce in the United States report from the Bureau of Alcohol, Tobacco, Firearms, and Explosives. States are ranked by the number of weapons registered with the ATF in the state for every 100,000 people as of May 2021.
Weapons registered with the ATF fall into one of six categories: 1) machine guns, defined as a firearm capable of automatically firing more than one shot with a single trigger-pull; 2) silencers, defined as a device that can muffle or suppress the sound of a gunshot; 3) short-barreled rifles, defined as a rifle with a barrel shorter than 16 inches or an overall length less than 26 inches; 4) short-barreled or sawed-off shotguns, defined as a shotgun with one or more barrels less than 18 inches long or an overall length of less than 26 inches; 5) destructive devices, a broad catagory that includes explosives such as bombs or grenades; and 6) any other weapon, a catch-all classification that includes certain firearms that can be concealed in items such as pens or walking canes.
ALERT: Take This Retirement Quiz Now (Sponsored)
Take the quiz below to get matched with a financial advisor today.
Each advisor has been vetted by SmartAsset and is held to a fiduciary standard to act in your best interests.
Here’s how it works:
1. Answer SmartAsset advisor match quiz
2. Review your pre-screened matches at your leisure. Check out the advisors’ profiles.
3. Speak with advisors at no cost to you. Have an introductory call on the phone or introduction in person and choose whom to work with in the future
Take the retirement quiz right here.
Thank you for reading! Have some feedback for us?
Contact the 24/7 Wall St. editorial team.