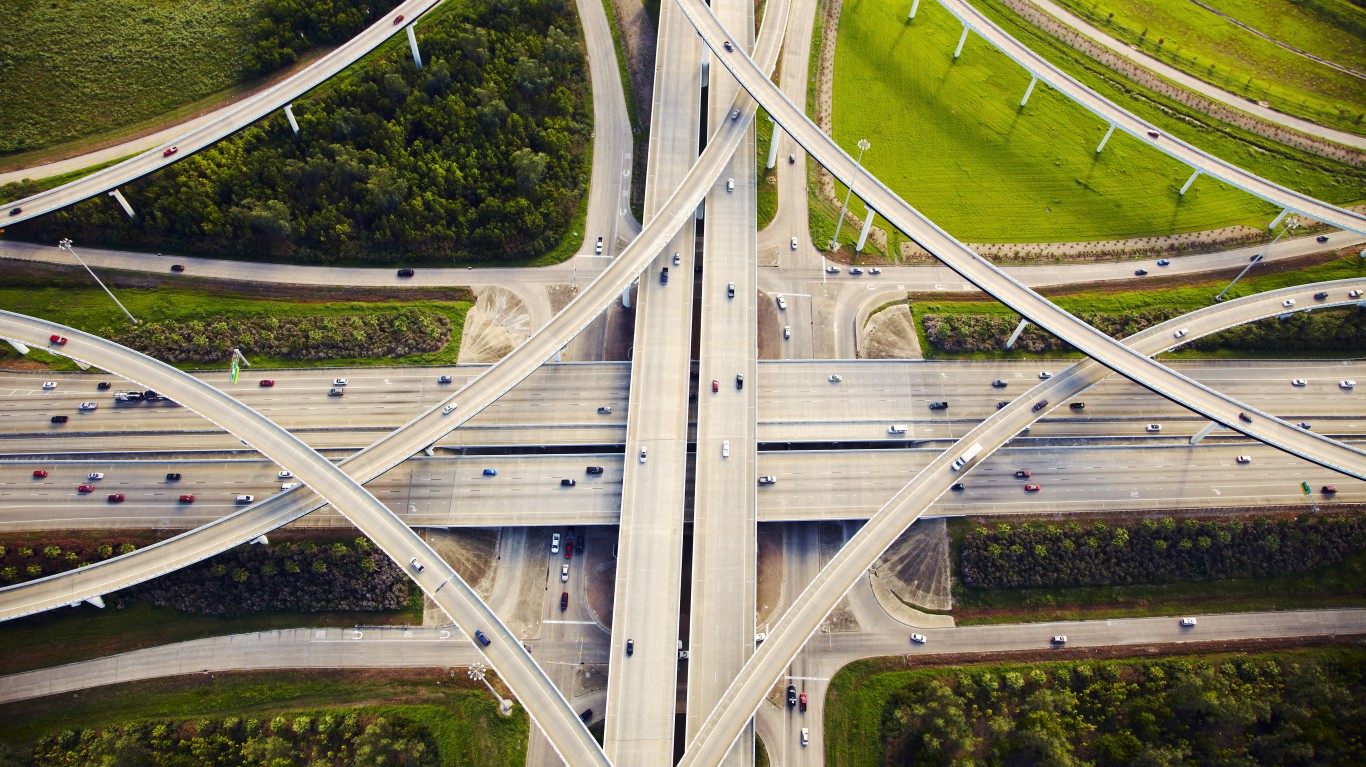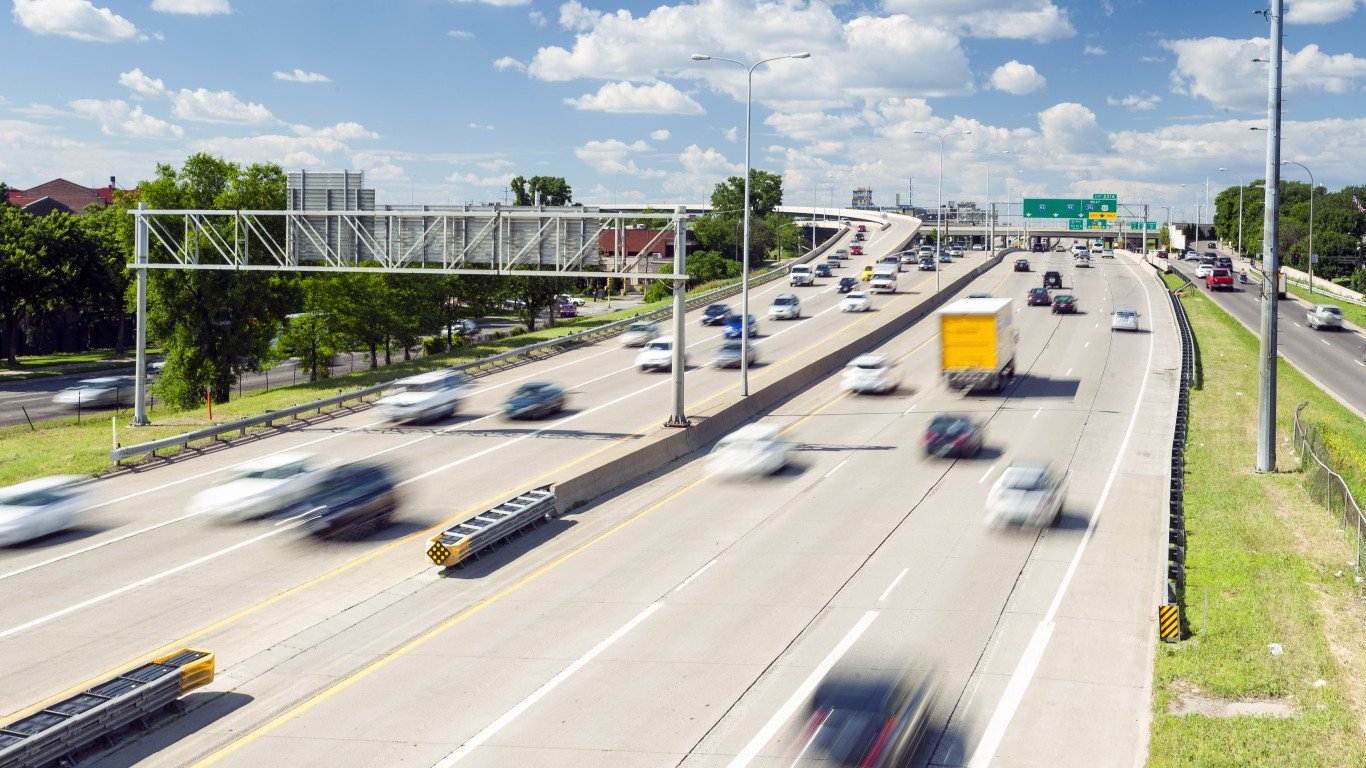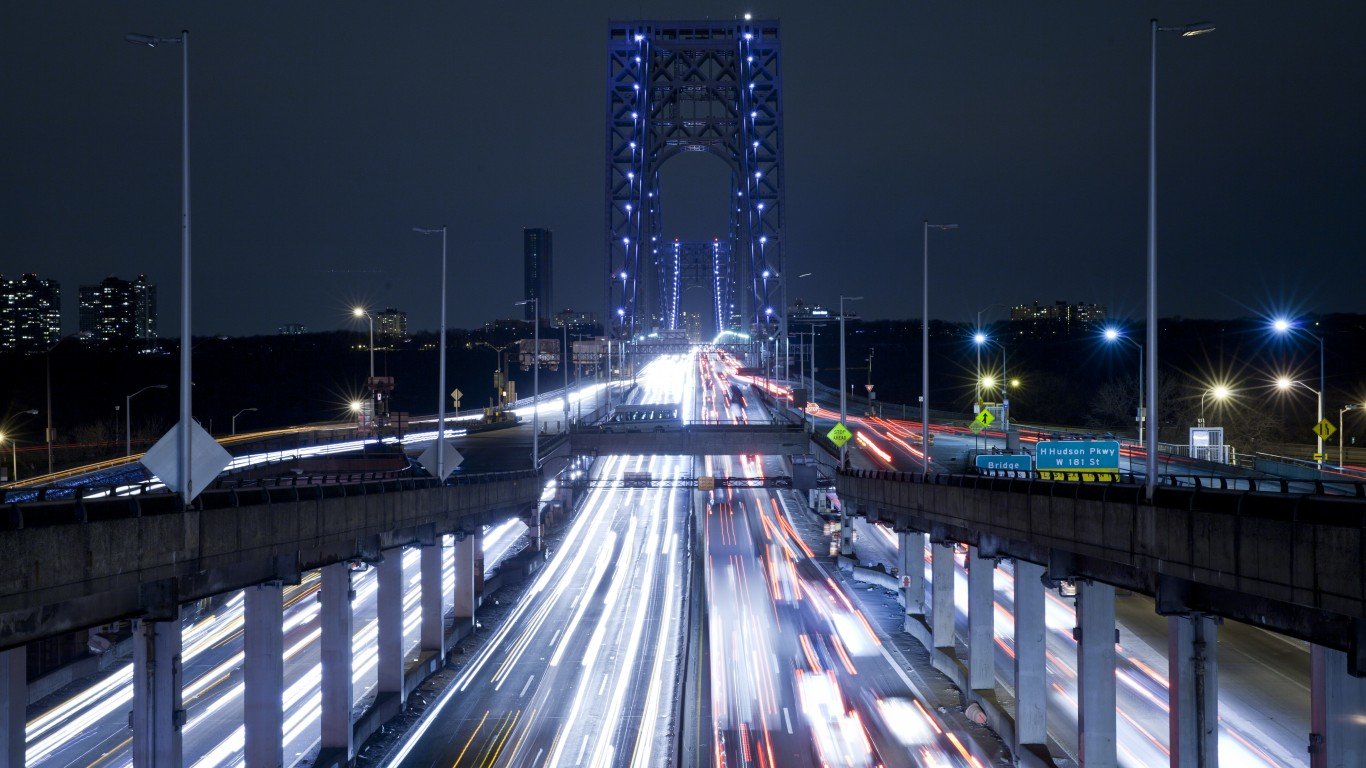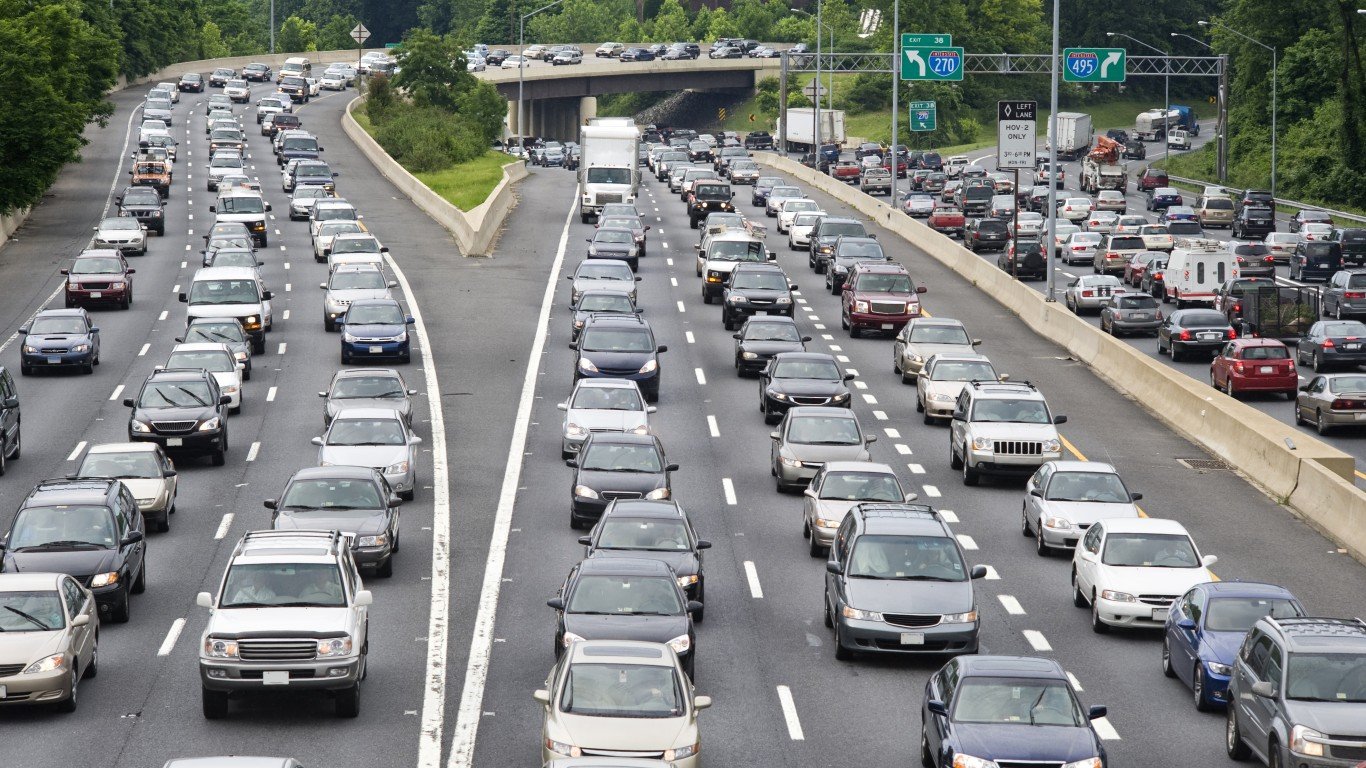
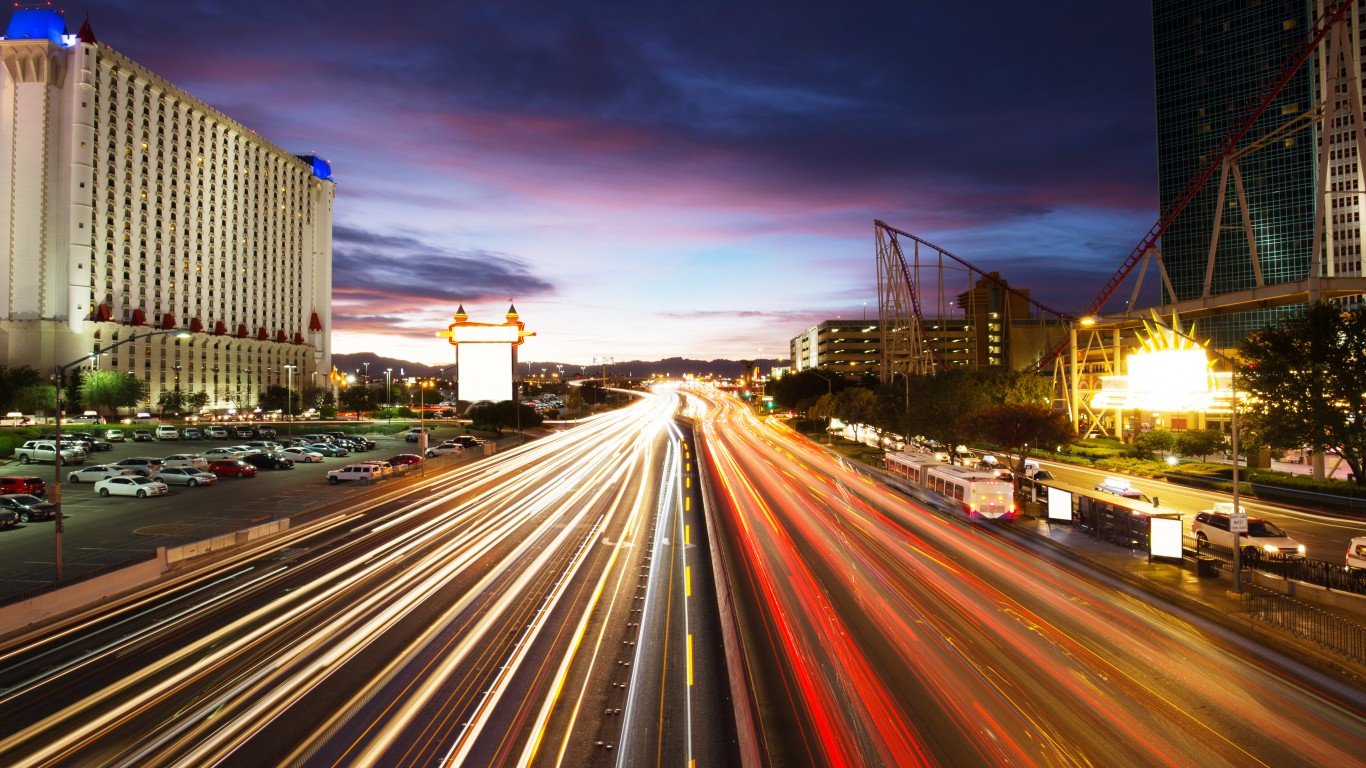
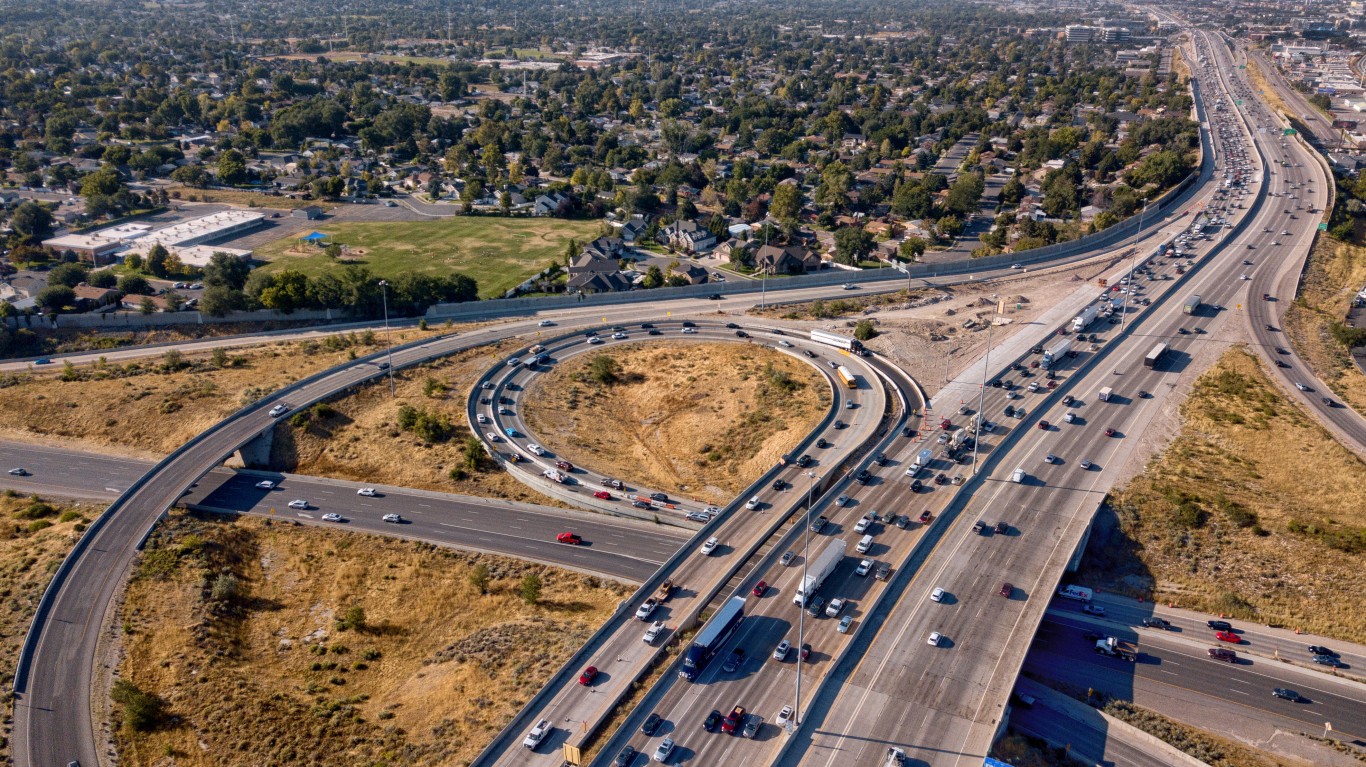
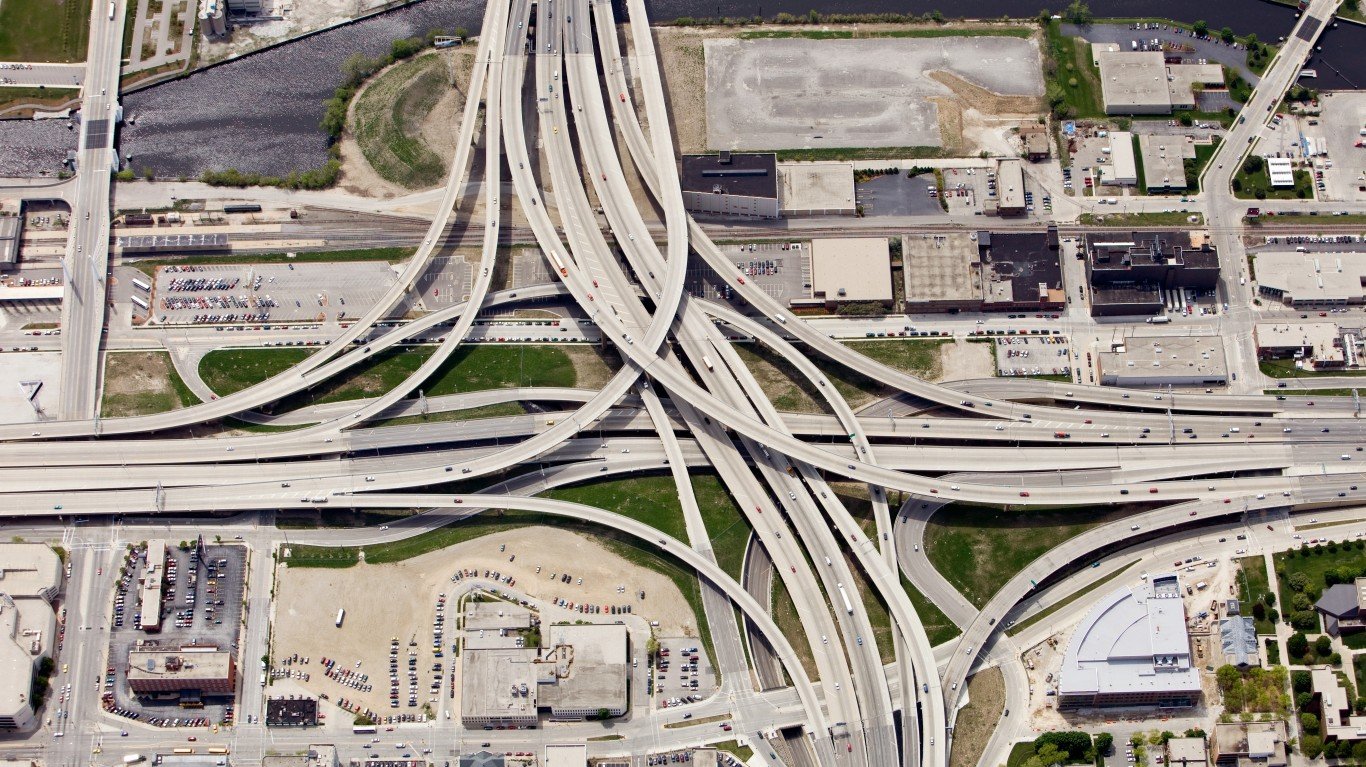
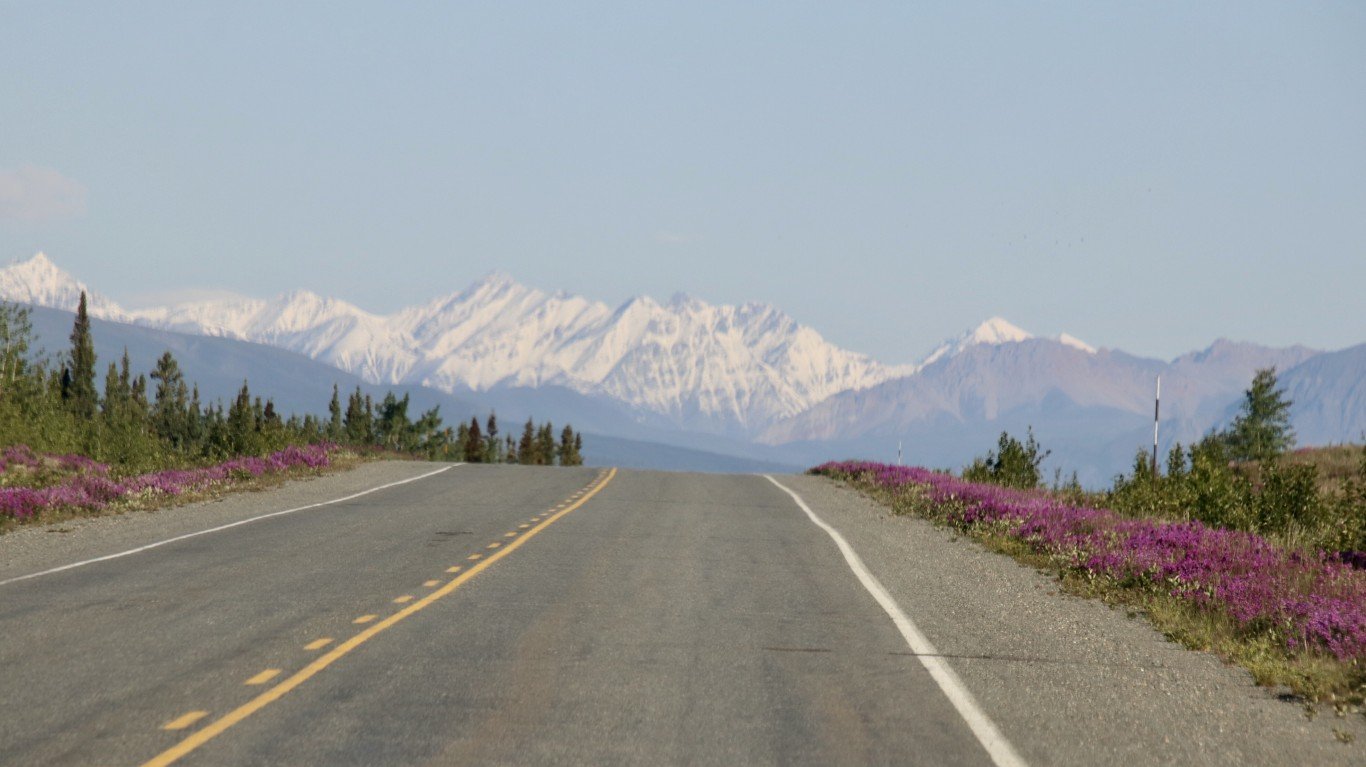
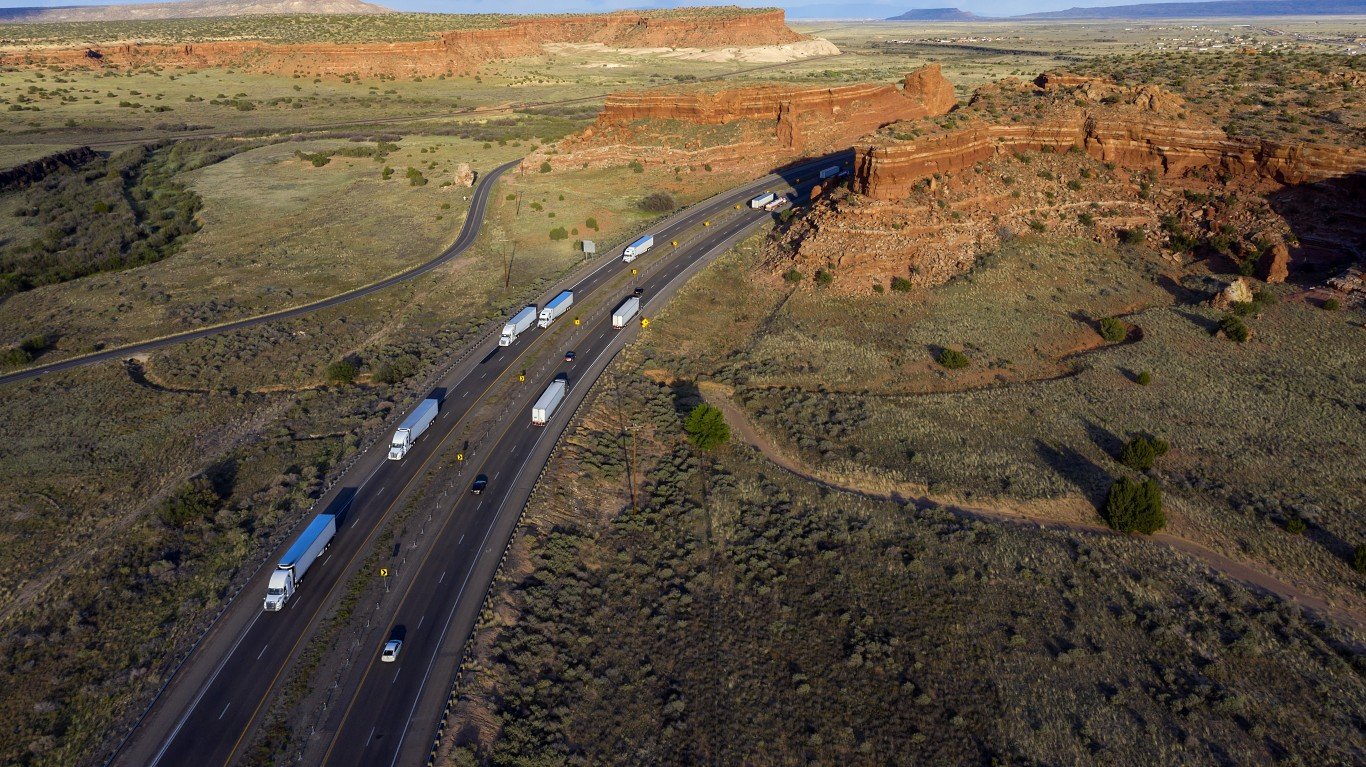
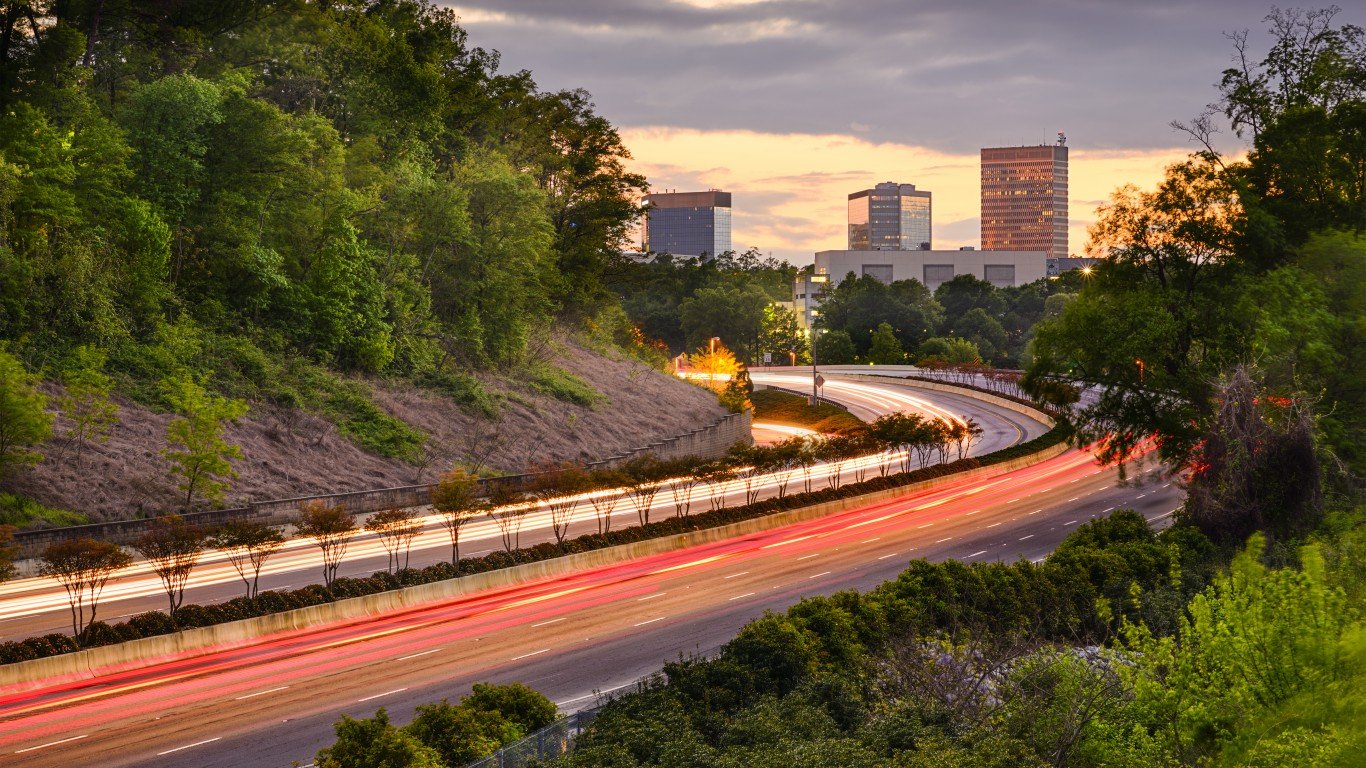
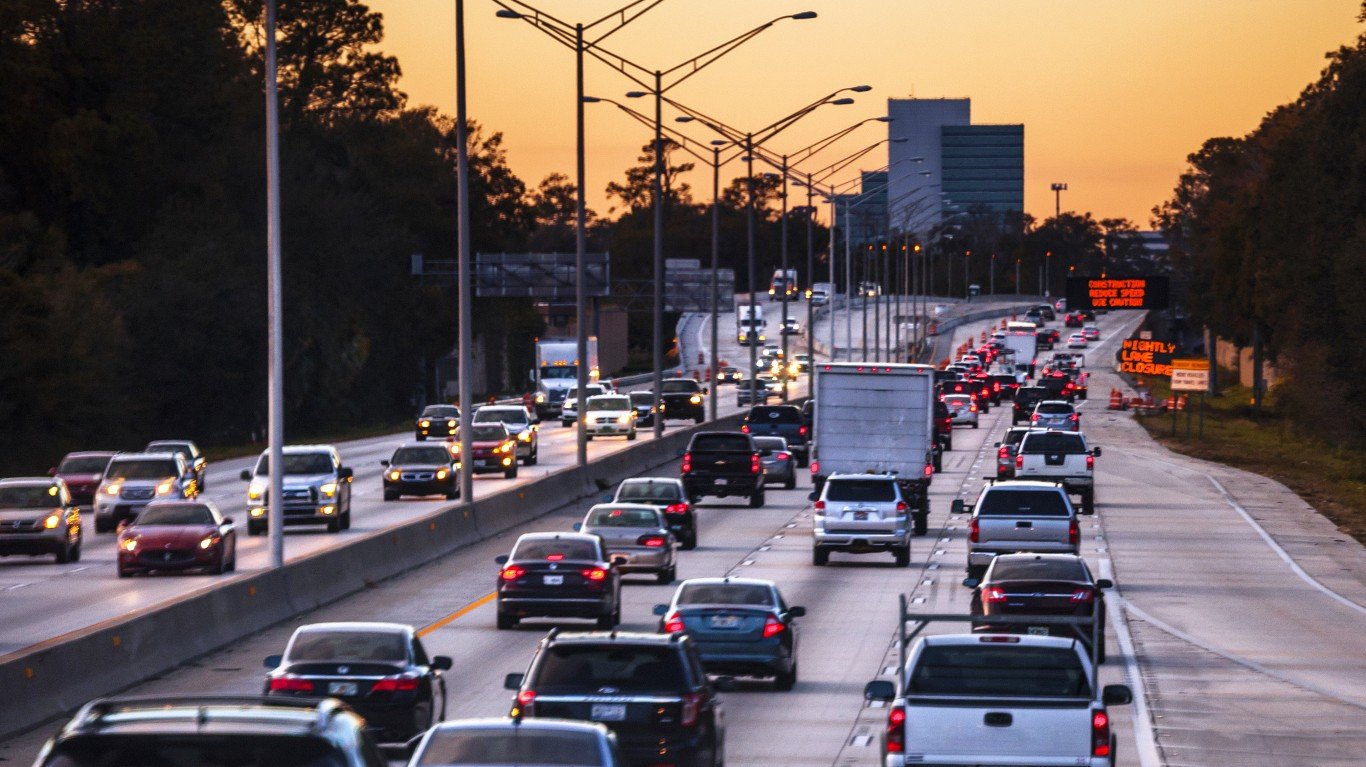
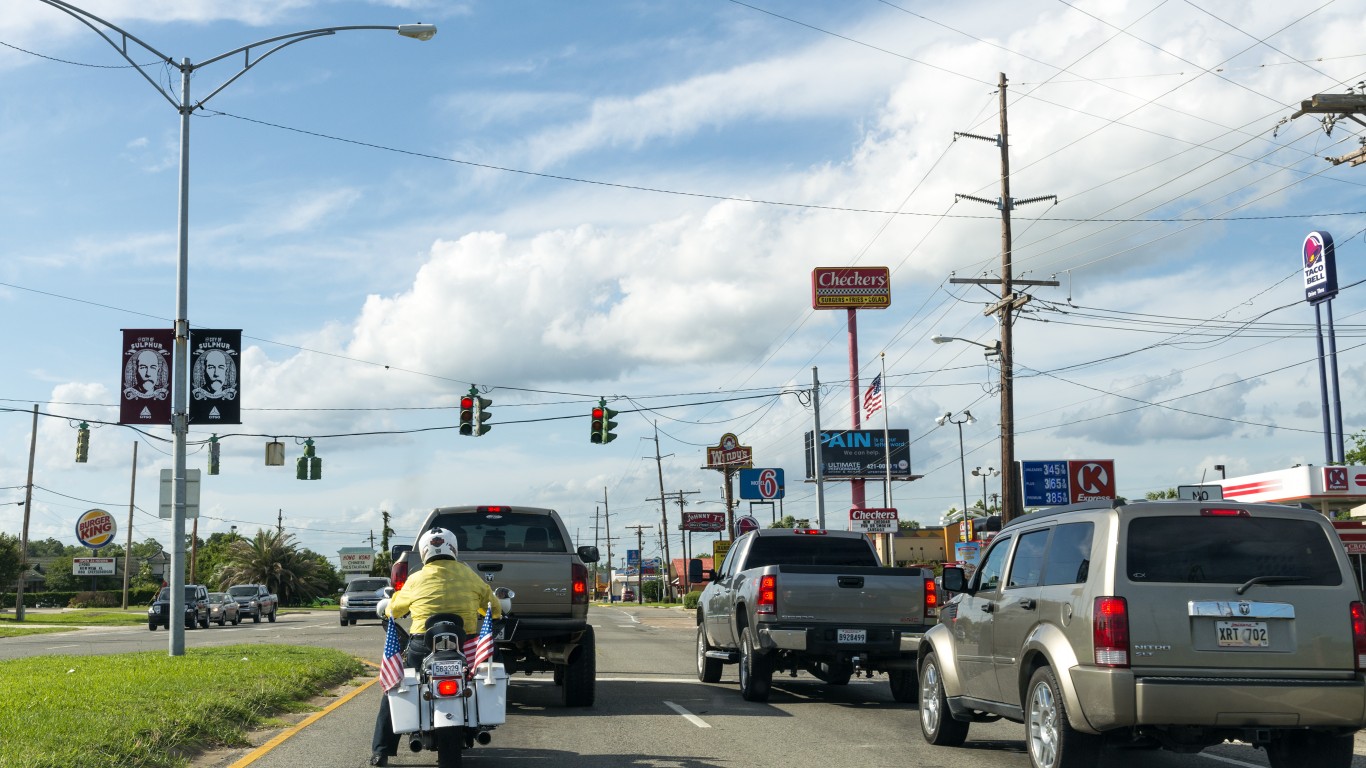
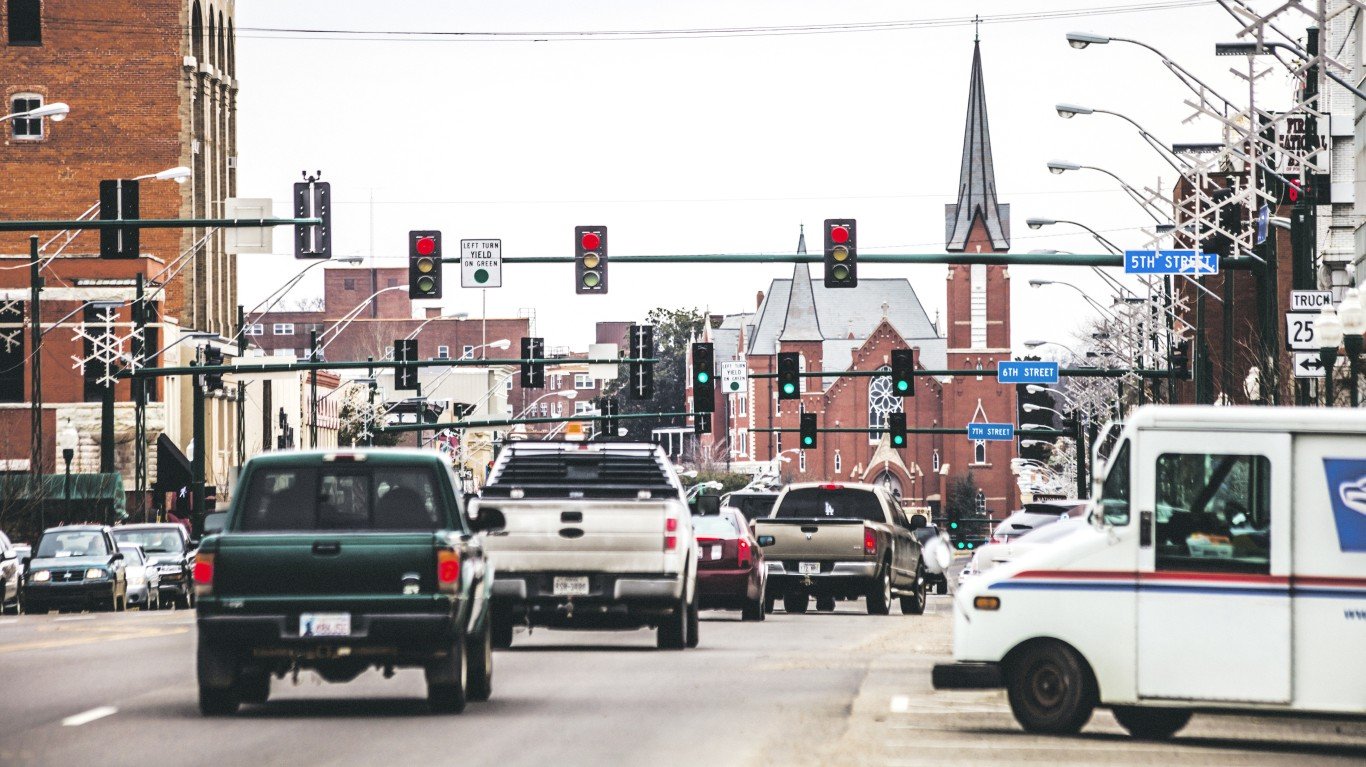
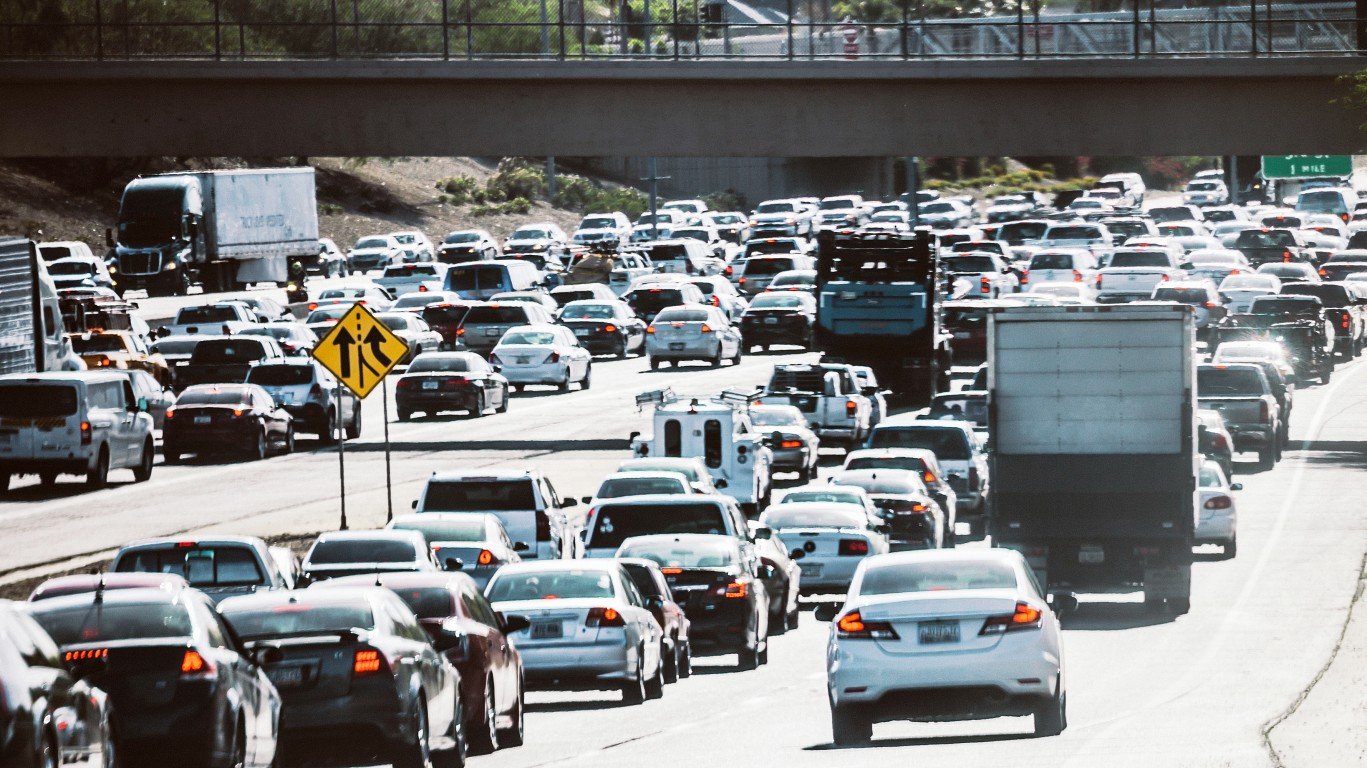
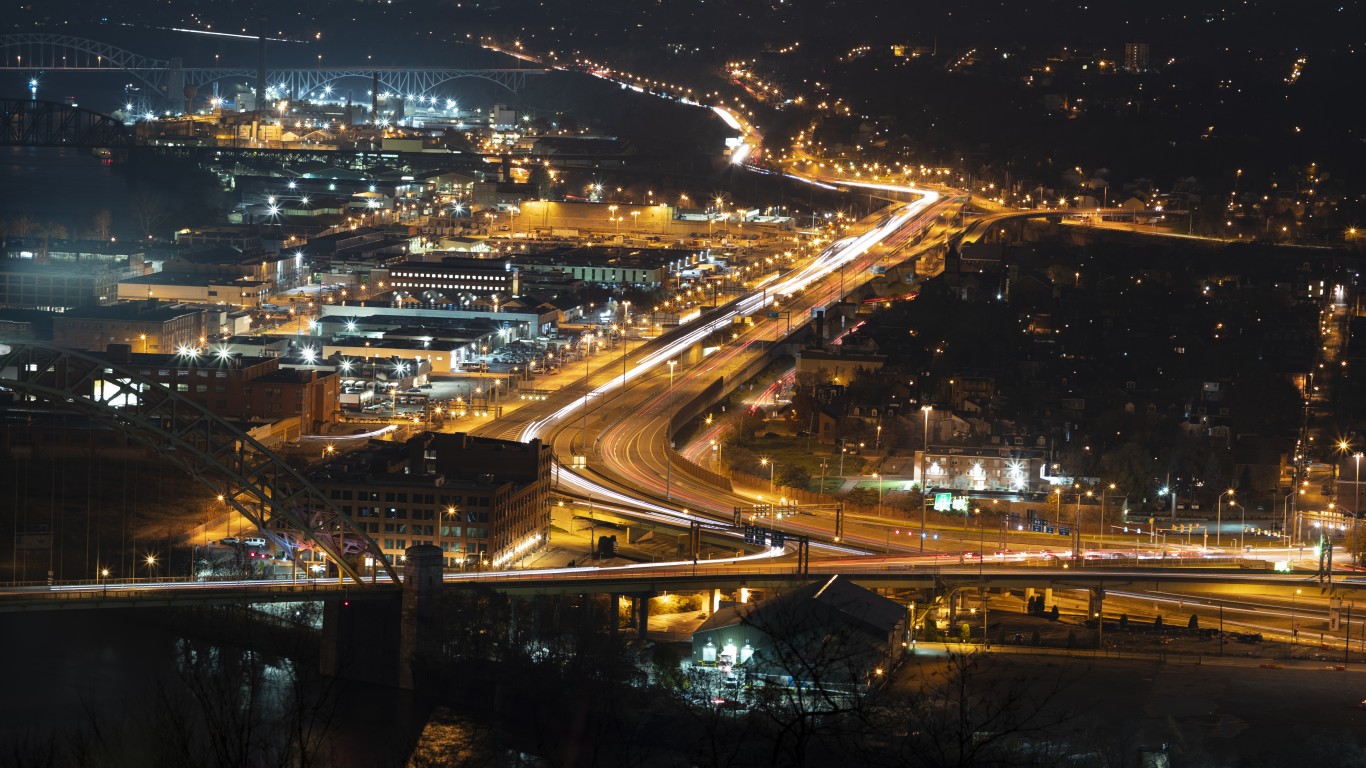
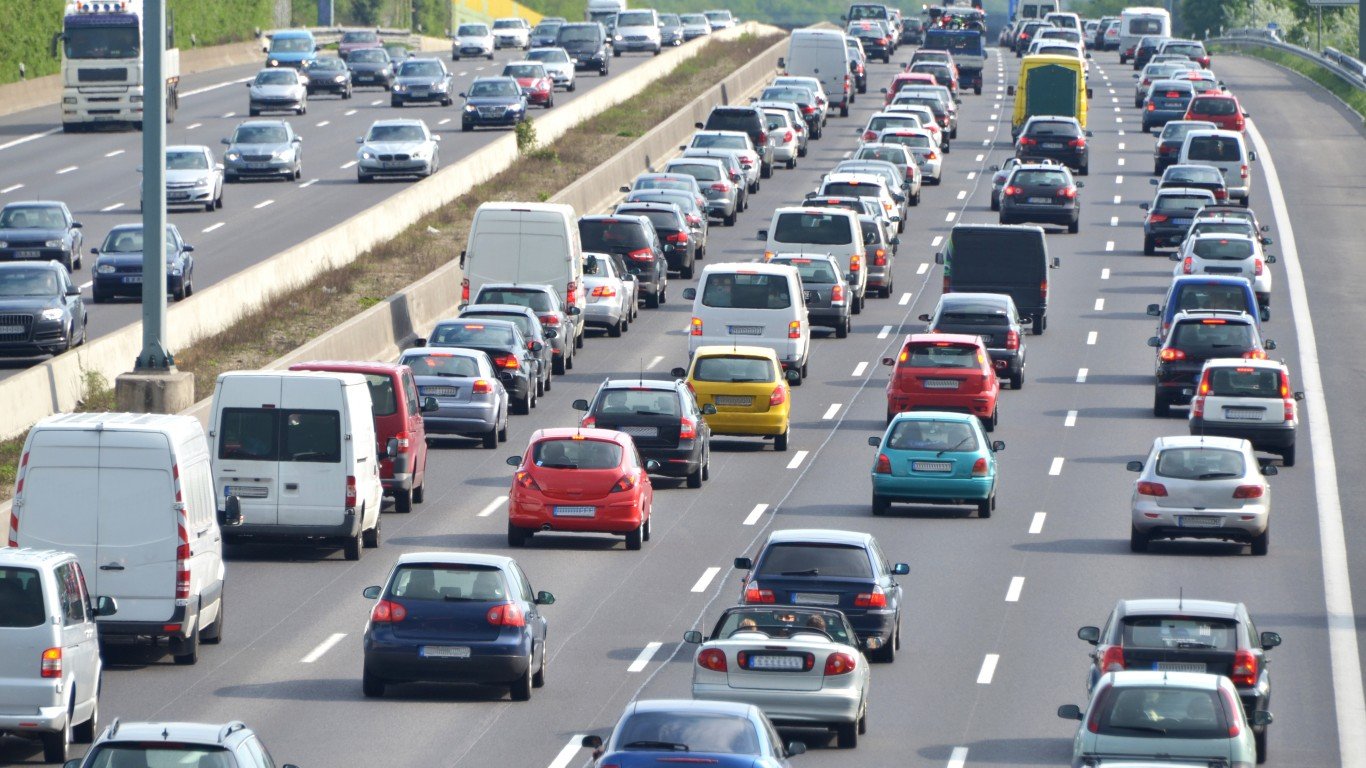
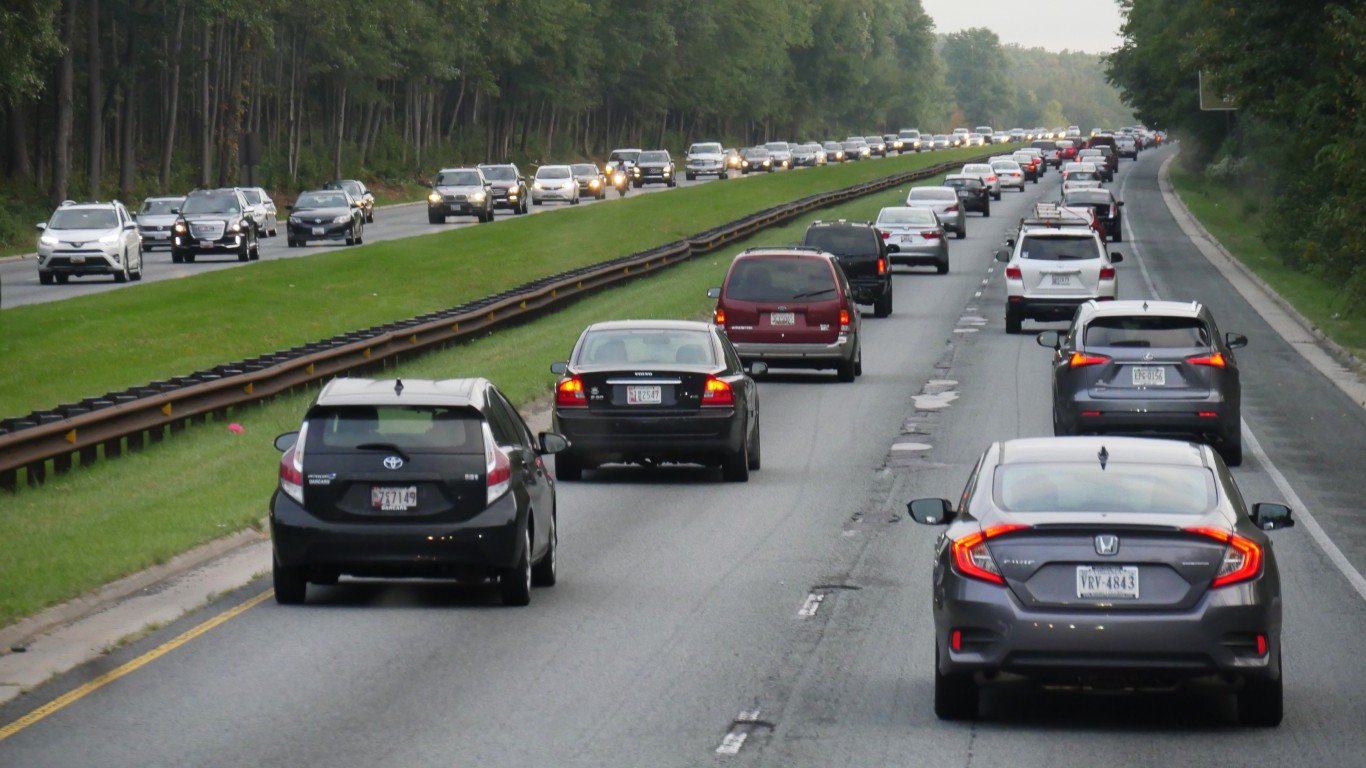
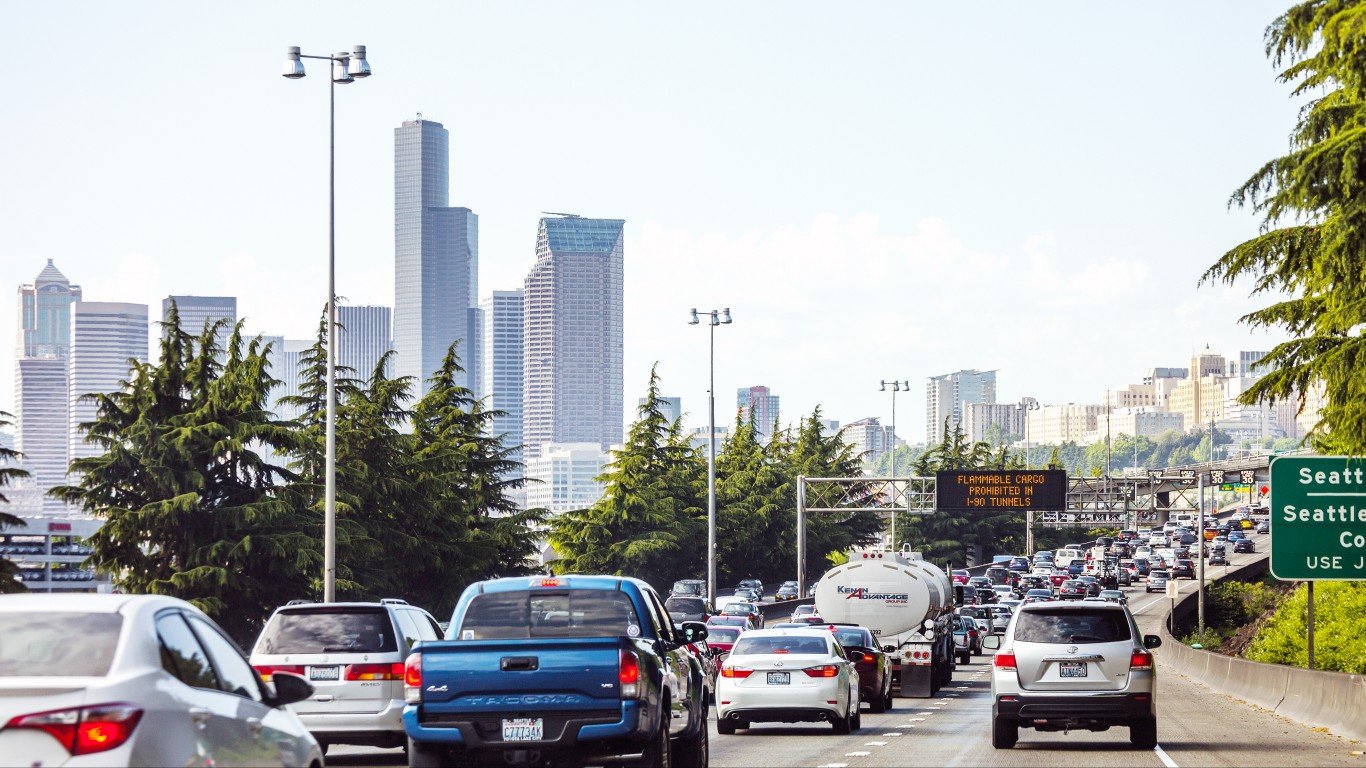
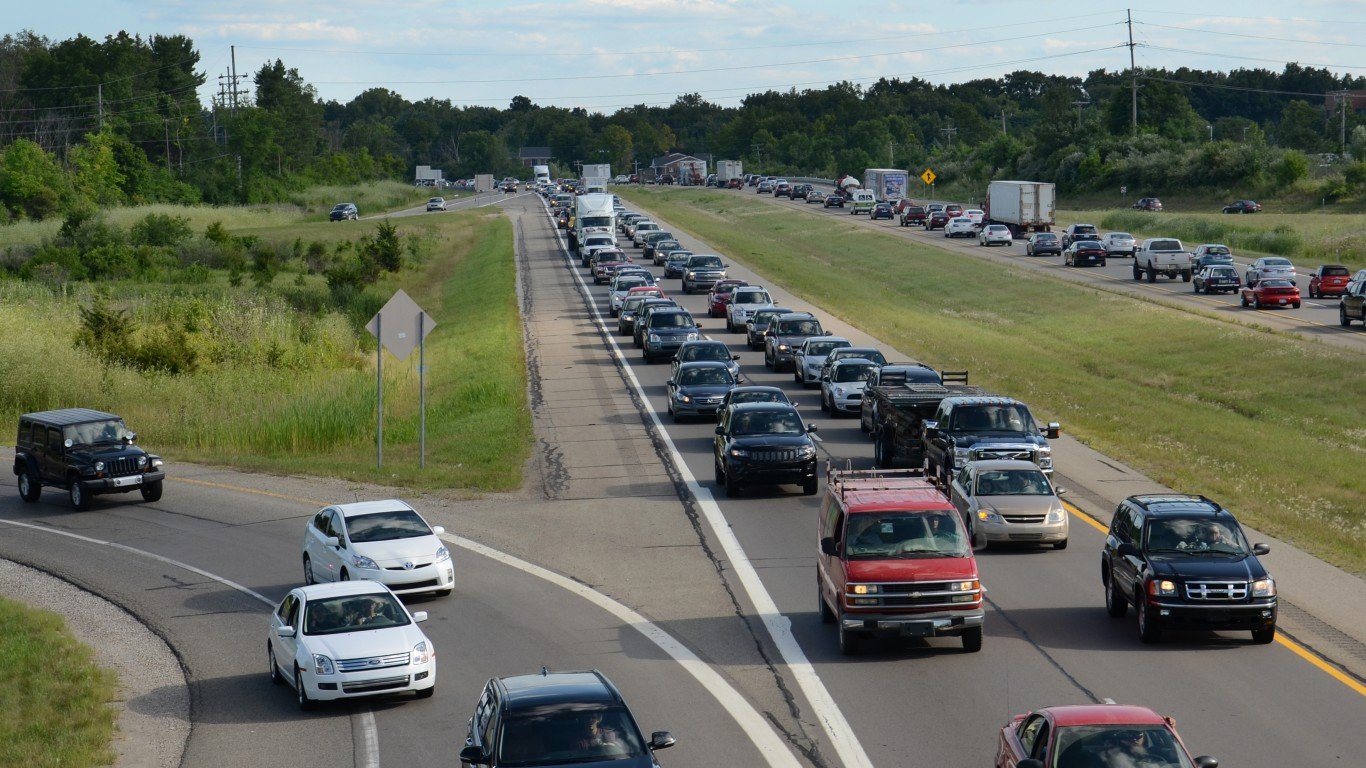
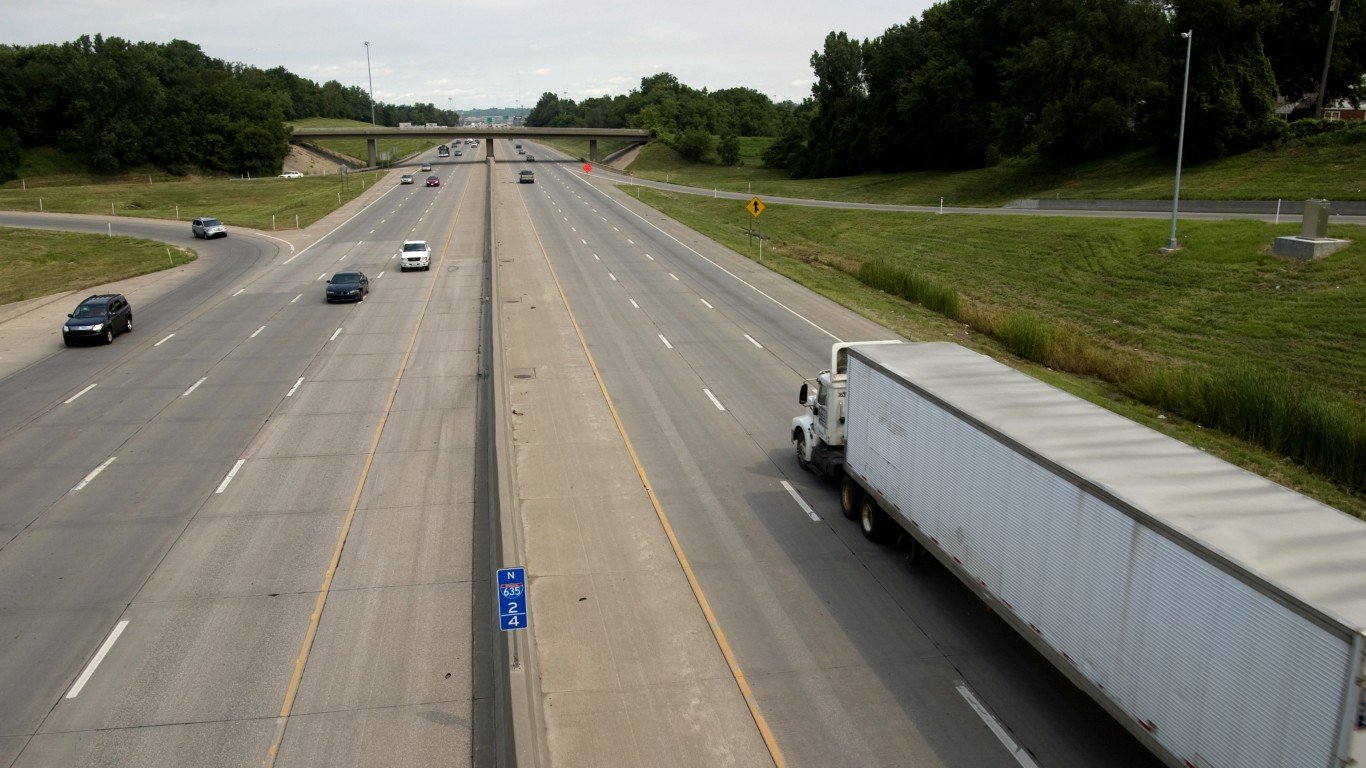
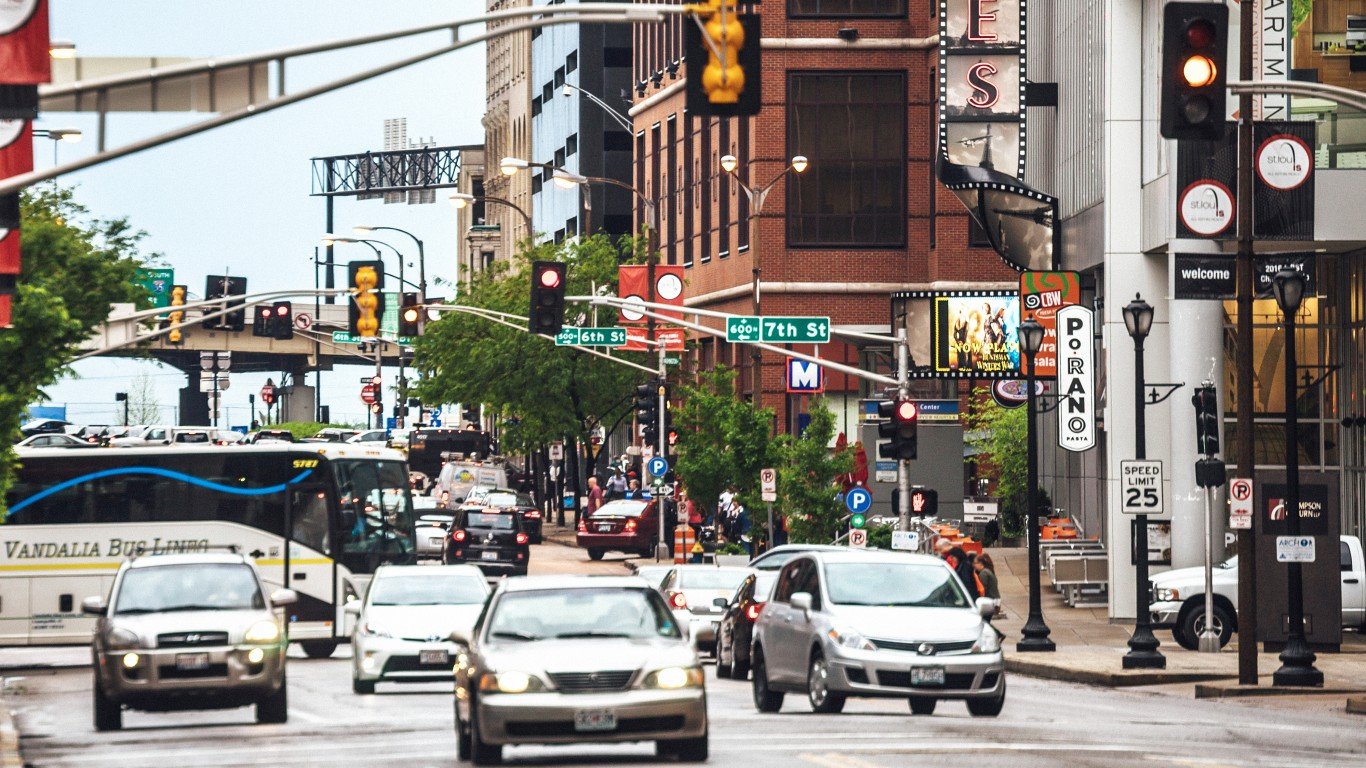
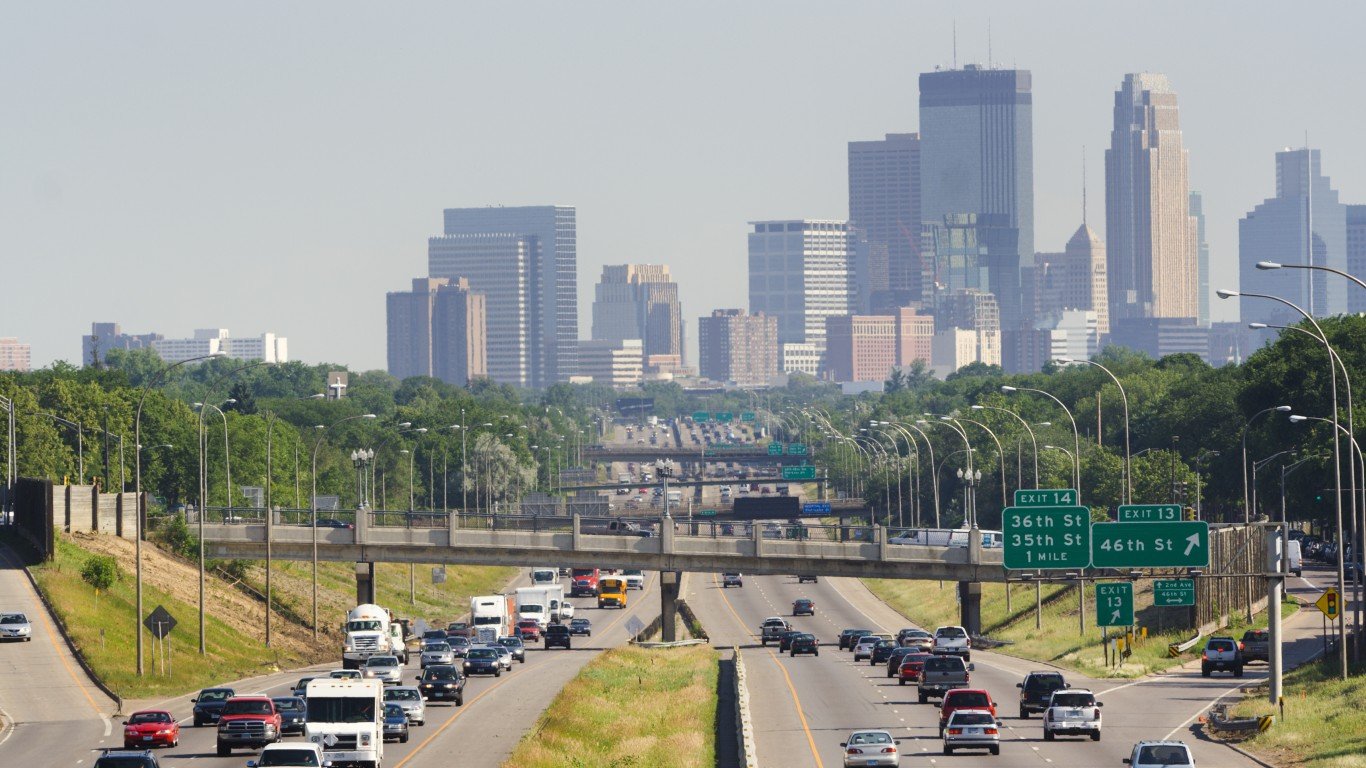
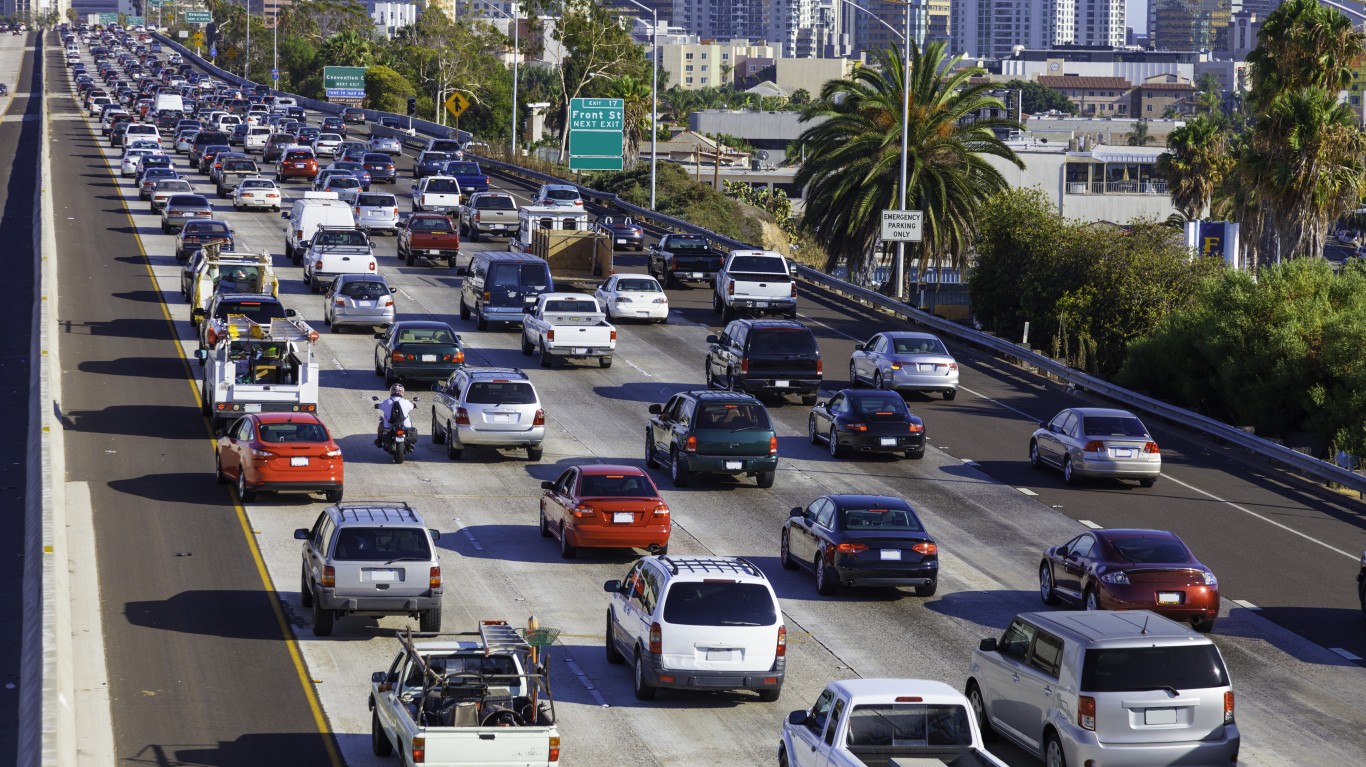
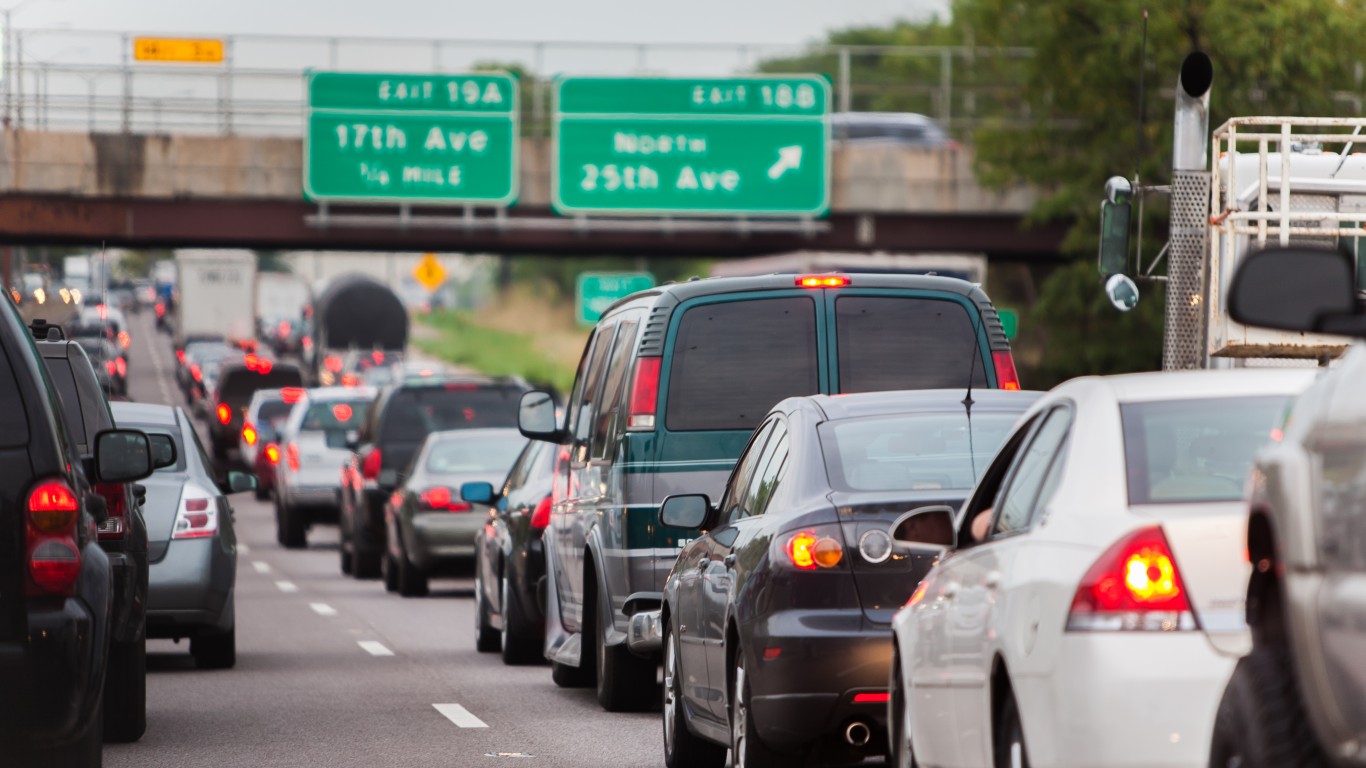
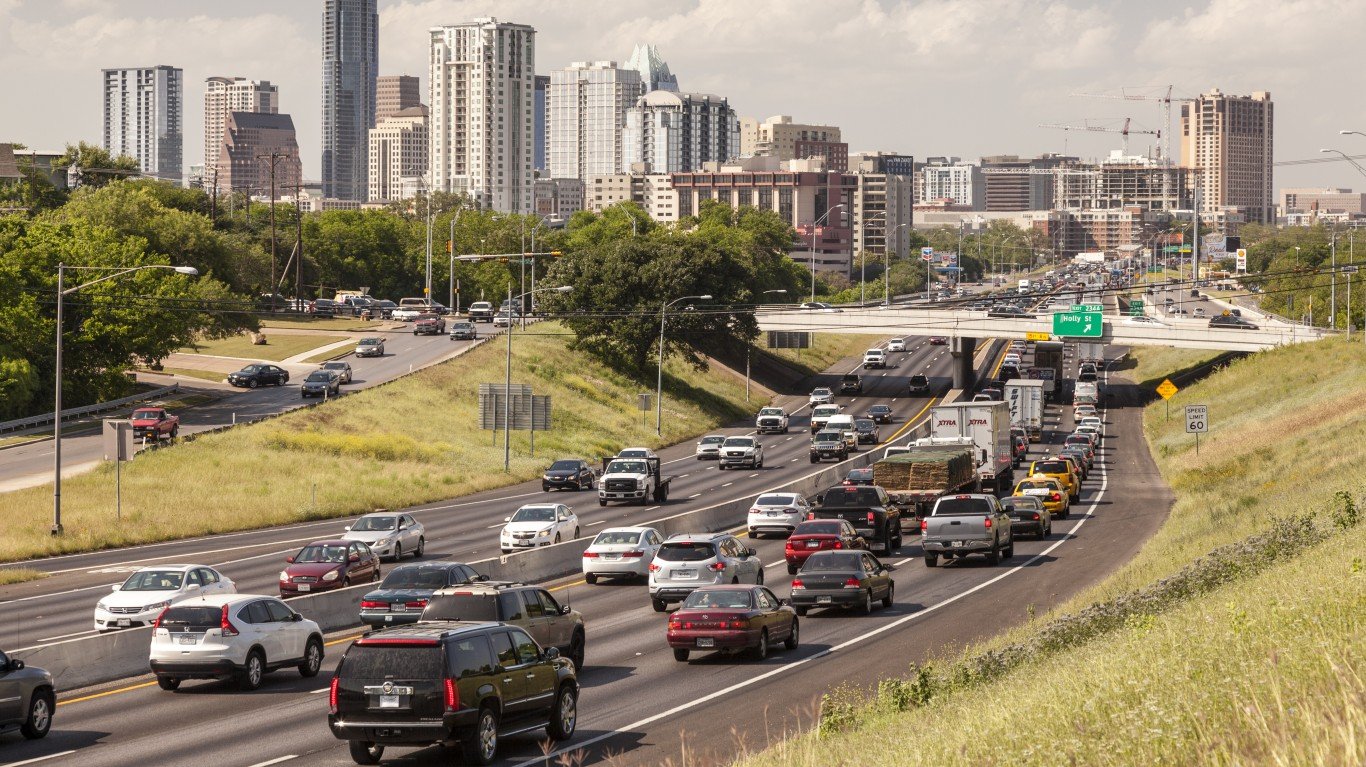
No doubt most people would agree that sitting in traffic is one of the least fun things to do. And it has costs — it increases air pollution levels, increases gas expenses, and of course, increases our idle time spent behind the wheel. It has also been shown that stop-and-go traffic can increase car accidents. Of course, congestion is not uniform nationwide.
To find the state with the worst traffic congestion in America, 24/7 Wall St. reviewed libertarian Reason Foundation’s 27th Annual Highway Report, which provides data for 2020. The report includes a congestion measure from Texas A&M Transportation Institute’s 2021 Urban Mobility Report. The measure, annual hours of delay per auto commuter, evaluates “the extra travel time endured throughout the year by auto commuters who make trips during the peak period” in urbanized areas. States are ranked here from least amount of time delayed sitting in peak-hour congestion to most time delayed. As it highly correlates to traffic congestion, we also added population density per square mile of land of each state from the Census Bureau.
Nationwide, commuters spent an average of 27.04 hours driving in congested traffic in urbanized areas in 2020. Among the 50 states, annual hours of delay range from 6.5 in Wyoming to a whopping 48 in New Jersey. New Jersey is also the most densely-populated state with nearly 1,300 people per square mile. The next most densely-populated state, Rhode Island, ranks fifth on the list with commuters spending 32.7 hours a year in traffic congestion. Massachusetts ranks third in both congestion and population density.
The congestion problem is naturally primarily concentrated in major cities, and states that have larger metropolitan areas tend to rank lower on the list. So while commuters in six states spent fewer than 10 hours sitting in peak-hour congestion, and commuters in 31 other states spent less than 30 hours, commuters in New Jersey, New York, and Massachusetts spent more than 40 hours of delay per year in traffic congestion. (Also see: This State Has the Worst Highways in America.)
50. Wyoming
- Annual peak hours spent in congestion per auto commuter, 2020: 6.5
- Avg. population density, 2020: 5.9 people per sq. mile of land — 2nd lowest
- System width (state-controlled highways), 2020: 2.34 average lanes — 19th narrowest
- Pct. urban interstate mileage in poor condition, 2020: 6.70% — 10th highest
- State-controlled highway miles, 2020: 15,792 — 13th lowest
49. Iowa
- Annual peak hours spent in congestion per auto commuter, 2020: 7.5
- Avg. population density, 2020: 57.1 people per sq. mile of land — 15th lowest
- System width (state-controlled highways), 2020: 2.57 average lanes — 20th widest
- Pct. urban interstate mileage in poor condition, 2020: 4.72% — 18th highest
- State-controlled highway miles, 2020: 22,918 — 22nd lowest
48. Montana
- Annual peak hours spent in congestion per auto commuter, 2020: 8.0
- Avg. population density, 2020: 7.4 people per sq. mile of land — 3rd lowest
- System width (state-controlled highways), 2020: 2.29 average lanes — 13th narrowest
- Pct. urban interstate mileage in poor condition, 2020: 1.74% — 13th lowest
- State-controlled highway miles, 2020: 25,211 — 25th lowest
47. North Dakota

- Annual peak hours spent in congestion per auto commuter, 2020: 8.6
- Avg. population density, 2020: 11.3 people per sq. mile of land — 4th lowest
- System width (state-controlled highways), 2020: 2.33 average lanes — 17th narrowest
- Pct. urban interstate mileage in poor condition, 2020: 0.98% — 2nd lowest
- State-controlled highway miles, 2020: 17,245 — 15th lowest
46. South Dakota
- Annual peak hours spent in congestion per auto commuter, 2020: 9.8
- Avg. population density, 2020: 11.7 people per sq. mile of land — 5th lowest
- System width (state-controlled highways), 2020: 2.32 average lanes — 16th narrowest
- Pct. urban interstate mileage in poor condition, 2020: 1.14% — 4th lowest
- State-controlled highway miles, 2020: 17,955 — 17th lowest
45. West Virginia
- Annual peak hours spent in congestion per auto commuter, 2020: 10.0
- Avg. population density, 2020: 74.6 people per sq. mile of land — 22nd lowest
- System width (state-controlled highways), 2020: 2.06 average lanes — the narrowest
- Pct. urban interstate mileage in poor condition, 2020: 8.99% — 6th highest
- State-controlled highway miles, 2020: 71,054 — 7th highest
44. Idaho
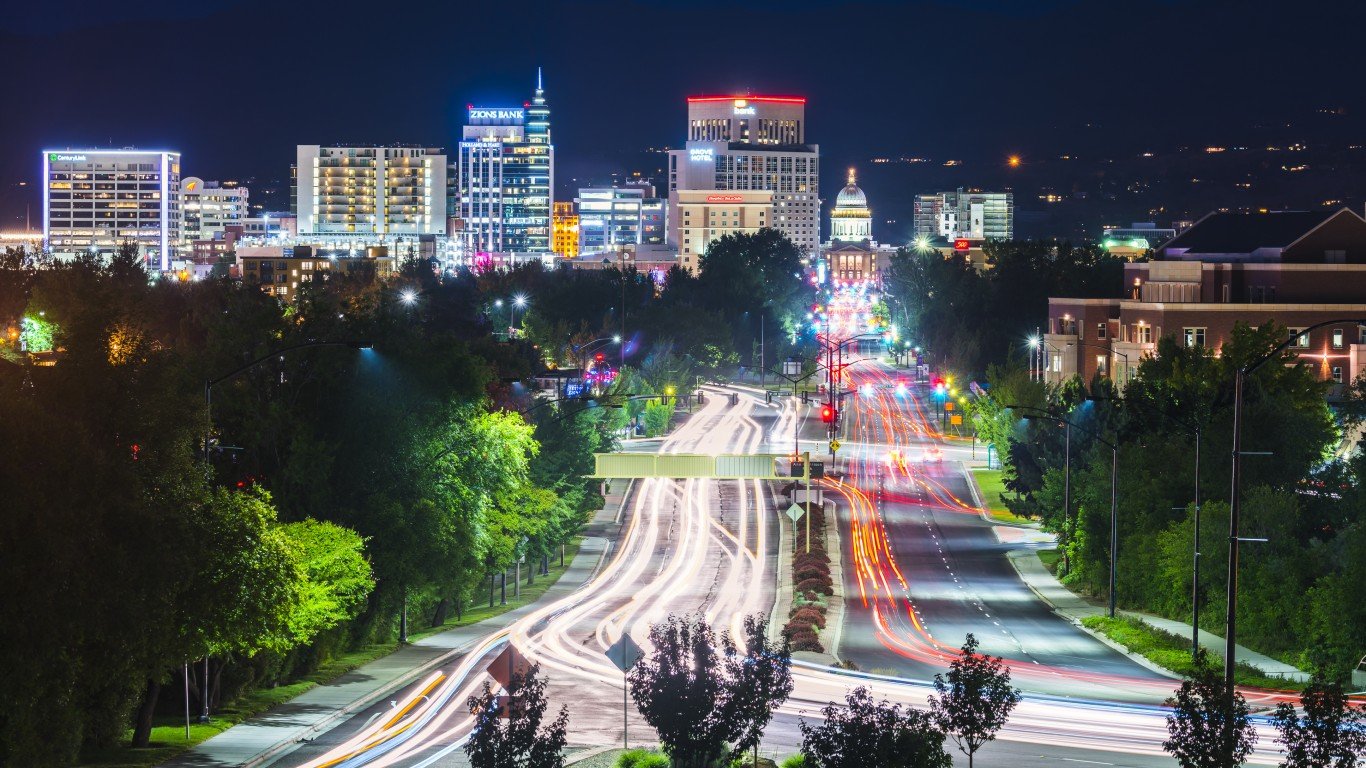
- Annual peak hours spent in congestion per auto commuter, 2020: 11.3
- Avg. population density, 2020: 22.3 people per sq. mile of land — 7th lowest
- System width (state-controlled highways), 2020: 2.47 average lanes — 24th narrowest
- Pct. urban interstate mileage in poor condition, 2020: 1.66% — 11th lowest
- State-controlled highway miles, 2020: 12,272 — 10th lowest
42. Nebraska
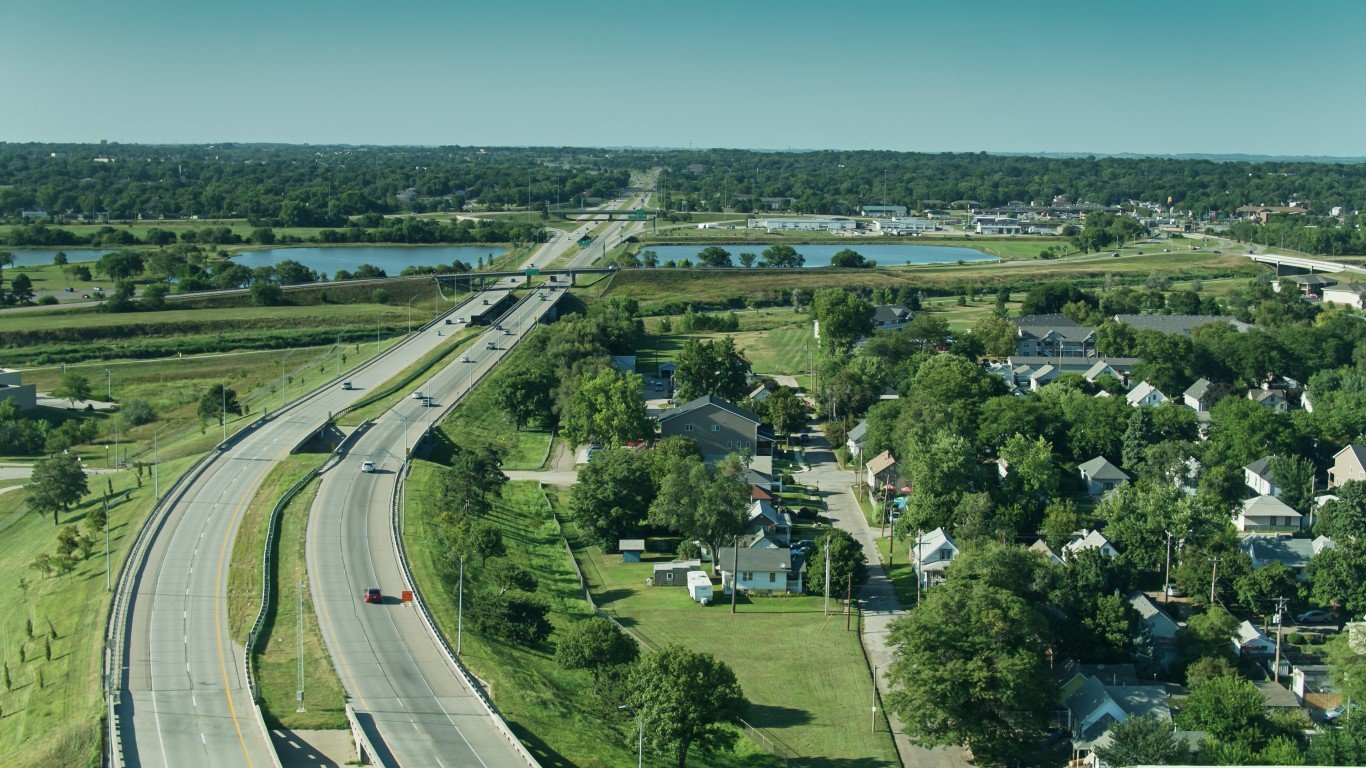
- Annual peak hours spent in congestion per auto commuter, 2020: 14.7
- Avg. population density, 2020: 25.5 people per sq. mile of land — 8th lowest
- System width (state-controlled highways), 2020: 2.27 average lanes — 11th narrowest
- Pct. urban interstate mileage in poor condition, 2020: 3.85% — 22nd highest
- State-controlled highway miles, 2020: 22,541 — 21st lowest
42. Maine
- Annual peak hours spent in congestion per auto commuter, 2020: 14.7
- Avg. population density, 2020: 44.2 people per sq. mile of land — 13th lowest
- System width (state-controlled highways), 2020: 2.09 average lanes — 3rd narrowest
- Pct. urban interstate mileage in poor condition, 2020: 1.43% — 7th lowest
- State-controlled highway miles, 2020: 17,467 — 16th lowest
41. Alabama
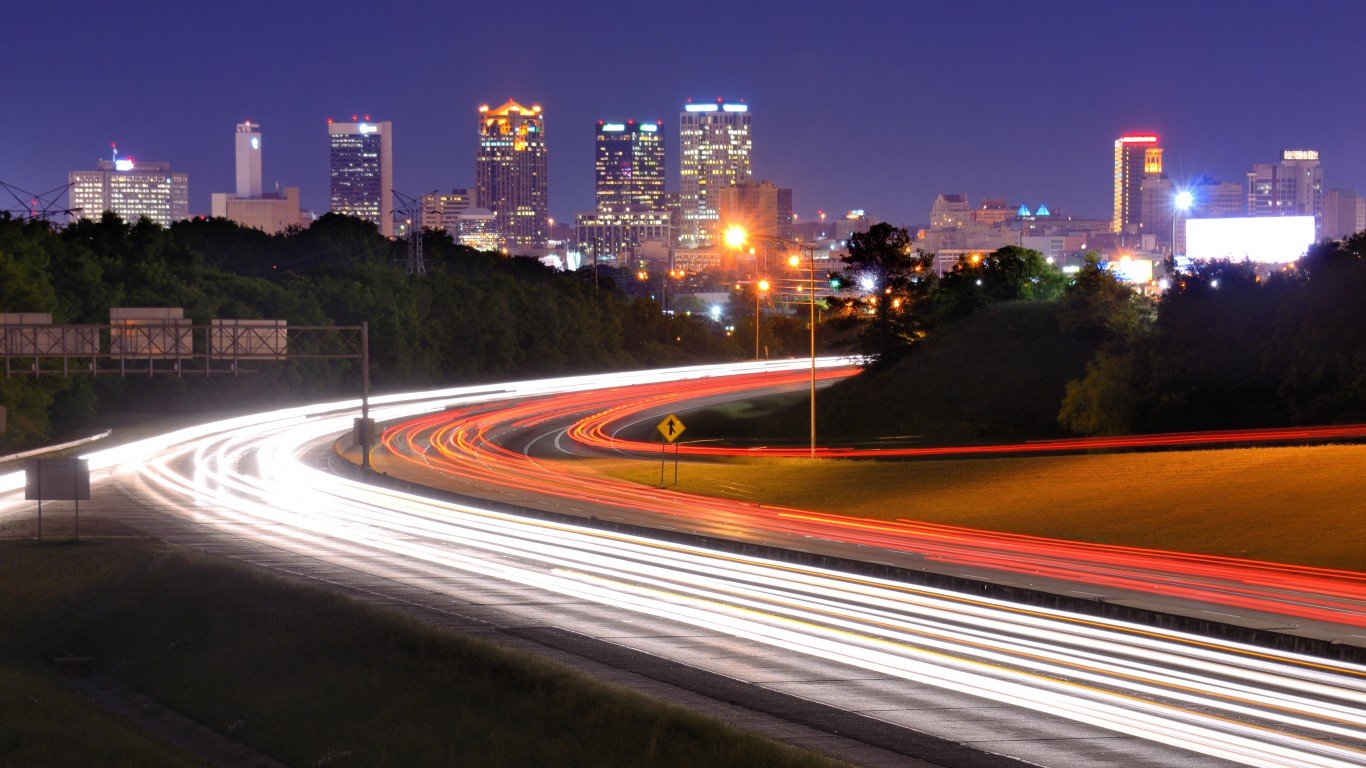
- Annual peak hours spent in congestion per auto commuter, 2020: 16.2
- Avg. population density, 2020: 99.2 people per sq. mile of land — 24th lowest
- System width (state-controlled highways), 2020: 2.72 average lanes — 10th widest
- Pct. urban interstate mileage in poor condition, 2020: 5.16% — 15th highest
- State-controlled highway miles, 2020: 29,707 — 20th highest
39. Nevada
- Annual peak hours spent in congestion per auto commuter, 2020: 16.4
- Avg. population density, 2020: 28.3 people per sq. mile of land — 9th lowest
- System width (state-controlled highways), 2020: 2.52 average lanes — 24th widest
- Pct. urban interstate mileage in poor condition, 2020: 2.48% — 17th lowest
- State-controlled highway miles, 2020: 13,509 — 11th lowest
39. North Carolina
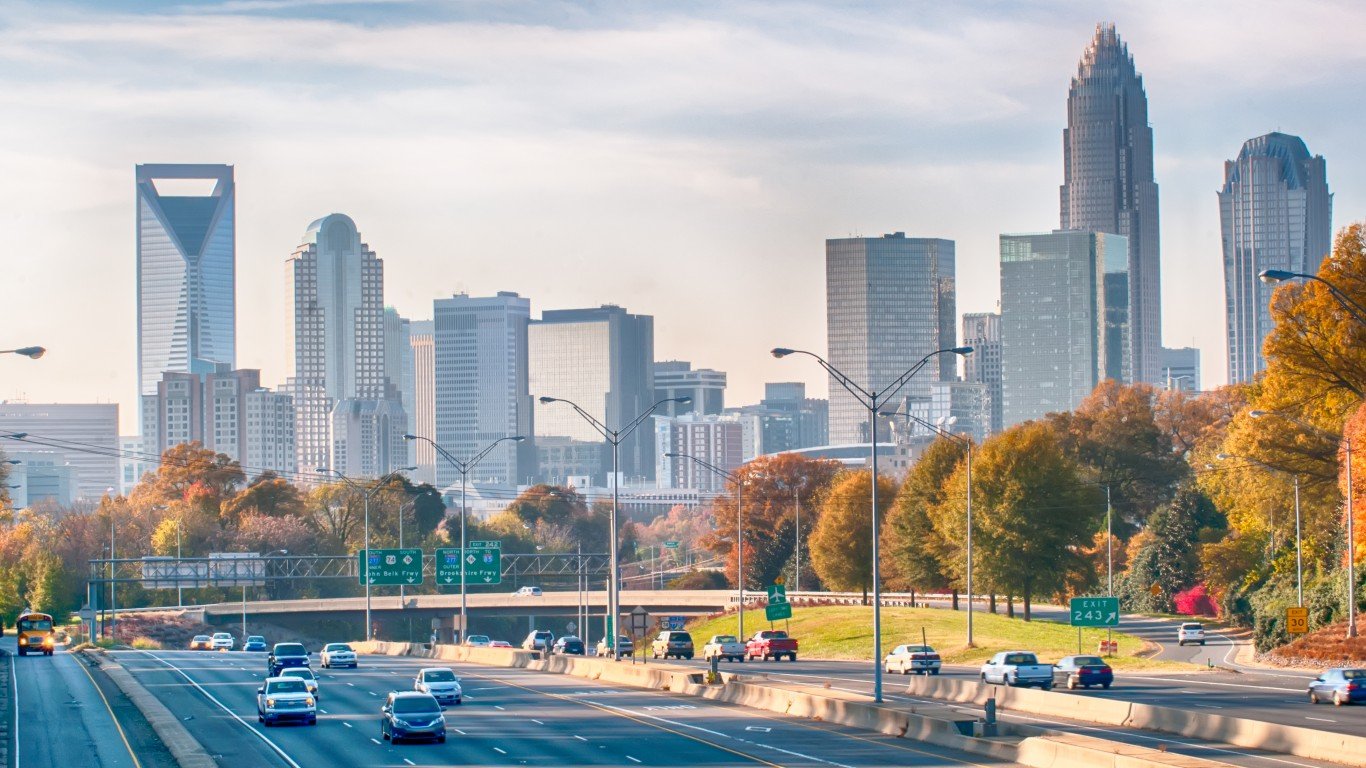
- Annual peak hours spent in congestion per auto commuter, 2020: 16.4
- Avg. population density, 2020: 214.7 people per sq. mile of land — 15th highest
- System width (state-controlled highways), 2020: 2.16 average lanes — 4th narrowest
- Pct. urban interstate mileage in poor condition, 2020: 2.27% — 15th lowest
- State-controlled highway miles, 2020: 173,653 — 2nd highest
37. Utah
- Annual peak hours spent in congestion per auto commuter, 2020: 17.0
- Avg. population density, 2020: 39.7 people per sq. mile of land — 11th lowest
- System width (state-controlled highways), 2020: 2.73 average lanes — 9th widest
- Pct. urban interstate mileage in poor condition, 2020: 2.69% — 20th lowest
- State-controlled highway miles, 2020: 16,023 — 14th lowest
37. Wisconsin
- Annual peak hours spent in congestion per auto commuter, 2020: 17.0
- Avg. population density, 2020: 108.8 people per sq. mile of land — 25th highest
- System width (state-controlled highways), 2020: 2.54 average lanes — 22nd widest
- Pct. urban interstate mileage in poor condition, 2020: 5.23% — 14th highest
- State-controlled highway miles, 2020: 29,806 — 19th highest
36. Alaska
- Annual peak hours spent in congestion per auto commuter, 2020: 17.1
- Avg. population density, 2020: 1.3 people per sq. mile of land — the lowest
- System width (state-controlled highways), 2020: 2.09 average lanes — 2nd narrowest
- Pct. urban interstate mileage in poor condition, 2020: 1.69% — 12th lowest
- State-controlled highway miles, 2020: 11,754 — 8th lowest
35. New Mexico
- Annual peak hours spent in congestion per auto commuter, 2020: 17.6
- Avg. population density, 2020: 17.5 people per sq. mile of land — 6th lowest
- System width (state-controlled highways), 2020: 2.47 average lanes — 23rd narrowest
- Pct. urban interstate mileage in poor condition, 2020: 3.57% — 23rd highest
- State-controlled highway miles, 2020: 29,430 — 21st highest
34. South Carolina
- Annual peak hours spent in congestion per auto commuter, 2020: 18.5
- Avg. population density, 2020: 170.2 people per sq. mile of land — 19th highest
- System width (state-controlled highways), 2020: 2.19 average lanes — 7th narrowest
- Pct. urban interstate mileage in poor condition, 2020: 1.13% — 3rd lowest
- State-controlled highway miles, 2020: 90,552 — 4th highest
33. Florida
- Annual peak hours spent in congestion per auto commuter, 2020: 18.8
- Avg. population density, 2020: 401.4 people per sq. mile of land — 8th highest
- System width (state-controlled highways), 2020: 3.71 average lanes — the widest
- Pct. urban interstate mileage in poor condition, 2020: 1.59% — 9th lowest
- State-controlled highway miles, 2020: 45,013 — 12th highest
31. Vermont
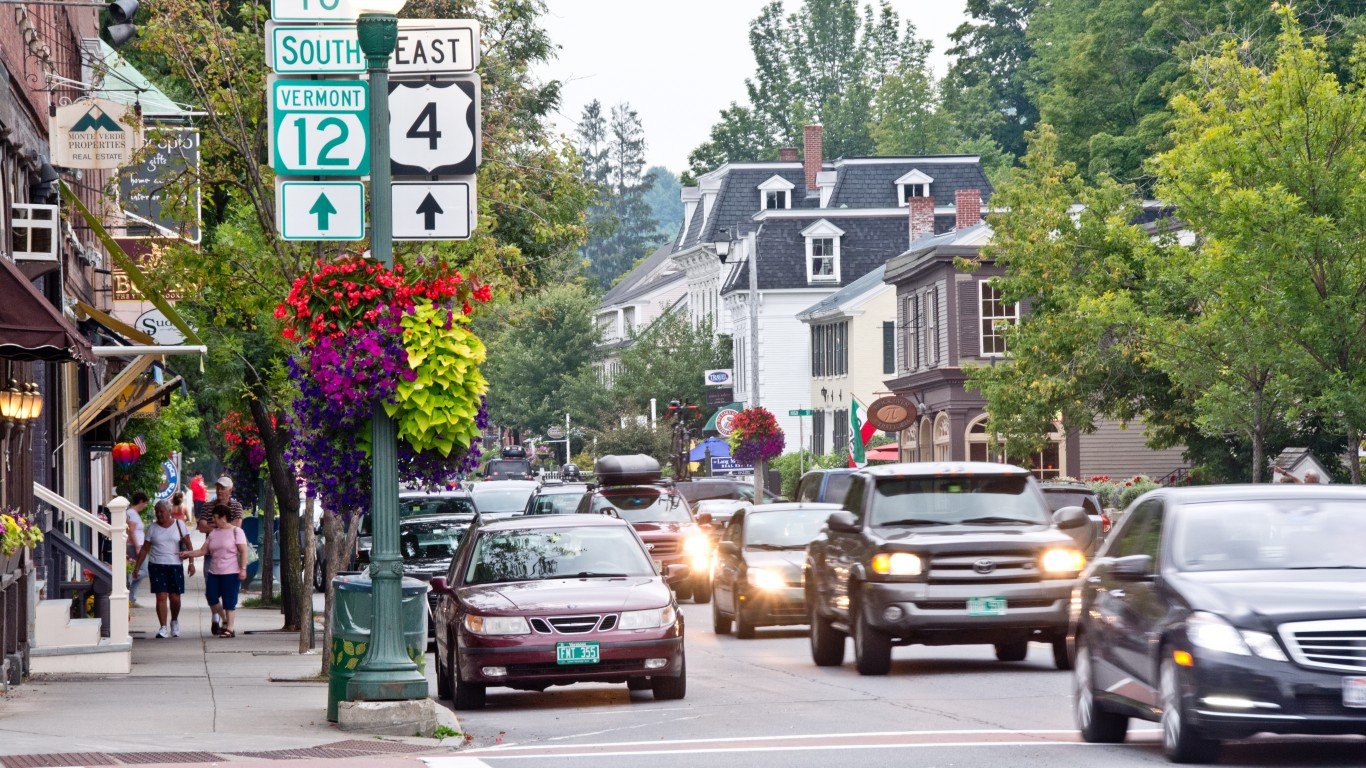
- Annual peak hours spent in congestion per auto commuter, 2020: 19.0
- Avg. population density, 2020: 69.8 people per sq. mile of land — 20th lowest
- System width (state-controlled highways), 2020: 2.28 average lanes — 12th narrowest
- Pct. urban interstate mileage in poor condition, 2020: 1.37% — 6th lowest
- State-controlled highway miles, 2020: 5,998 — 3rd lowest
31. Kentucky
- Annual peak hours spent in congestion per auto commuter, 2020: 19.0
- Avg. population density, 2020: 114.1 people per sq. mile of land — 23rd highest
- System width (state-controlled highways), 2020: 2.25 average lanes — 10th narrowest
- Pct. urban interstate mileage in poor condition, 2020: 2.32% — 16th lowest
- State-controlled highway miles, 2020: 62,346 — 8th highest
30. New Hampshire
- Annual peak hours spent in congestion per auto commuter, 2020: 19.1
- Avg. population density, 2020: 153.8 people per sq. mile of land — 21st highest
- System width (state-controlled highways), 2020: 2.17 average lanes — 5th narrowest
- Pct. urban interstate mileage in poor condition, 2020: 0.16% — the lowest
- State-controlled highway miles, 2020: 8,453 — 4th lowest
29. Indiana
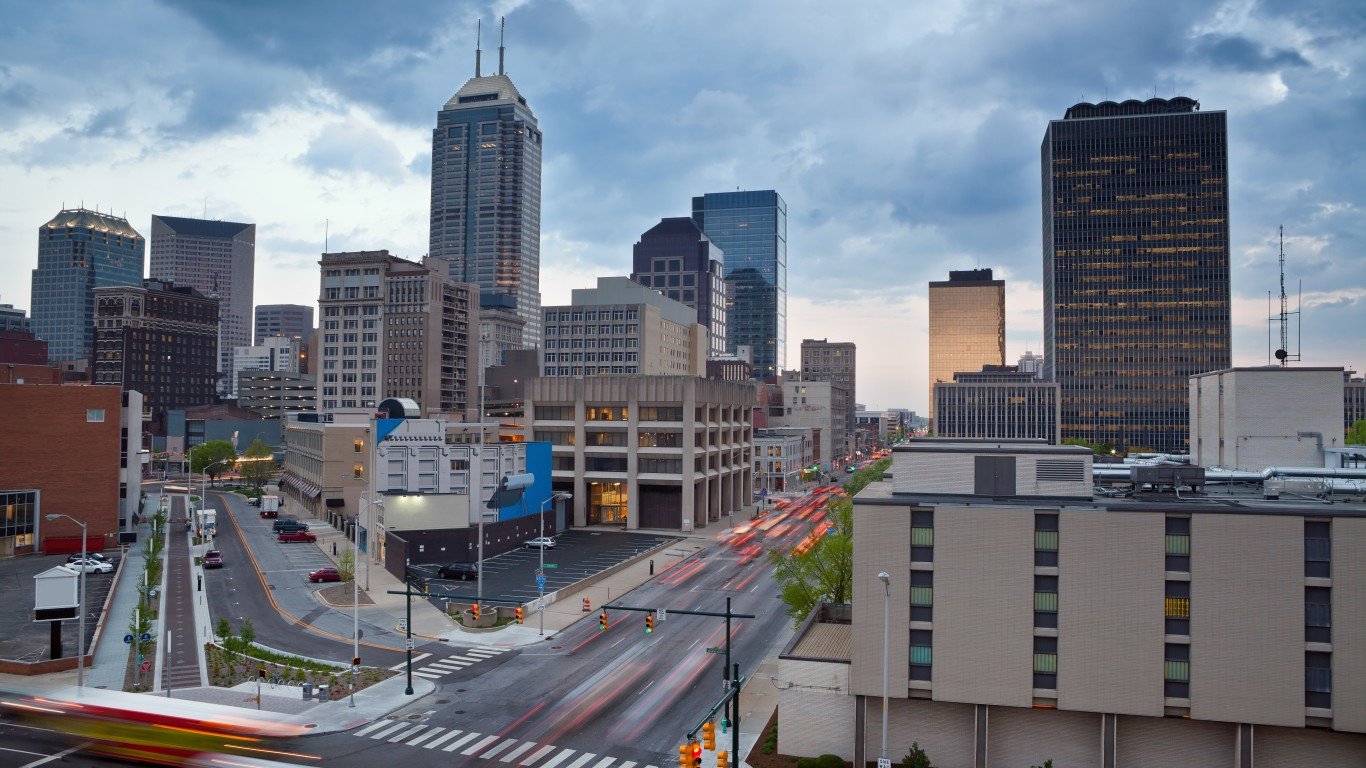
- Annual peak hours spent in congestion per auto commuter, 2020: 19.4
- Avg. population density, 2020: 189.4 people per sq. mile of land — 16th highest
- System width (state-controlled highways), 2020: 2.58 average lanes — 18th widest
- Pct. urban interstate mileage in poor condition, 2020: 4.24% — 20th highest
- State-controlled highway miles, 2020: 28,445 — 23rd highest
28. Louisiana
- Annual peak hours spent in congestion per auto commuter, 2020: 19.5
- Avg. population density, 2020: 107.8 people per sq. mile of land — 25th lowest
- System width (state-controlled highways), 2020: 2.35 average lanes — 20th narrowest
- Pct. urban interstate mileage in poor condition, 2020: 11.99% — 2nd highest
- State-controlled highway miles, 2020: 40,154 — 14th highest
27. Virginia
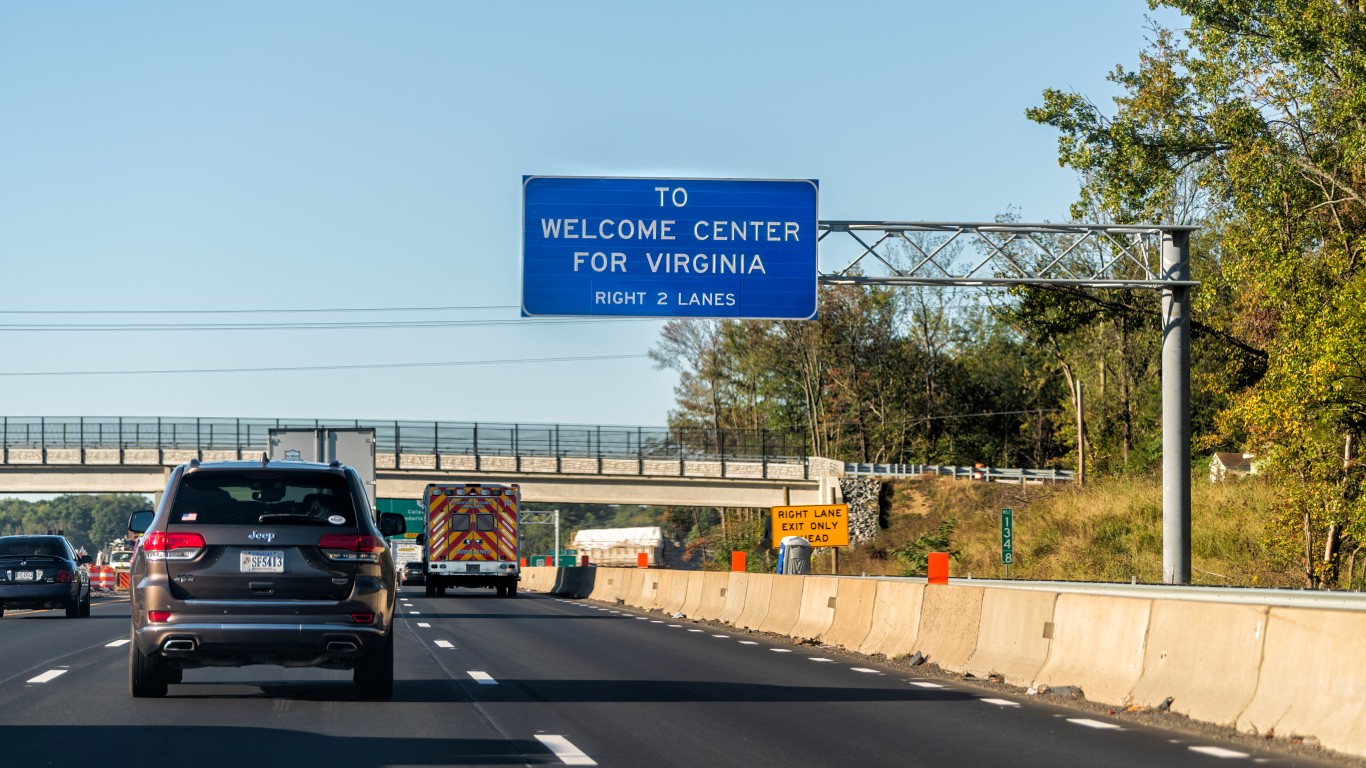
- Annual peak hours spent in congestion per auto commuter, 2020: 19.9
- Avg. population density, 2020: 218.6 people per sq. mile of land — 14th highest
- System width (state-controlled highways), 2020: 2.18 average lanes — 6th narrowest
- Pct. urban interstate mileage in poor condition, 2020: 2.57% — 19th lowest
- State-controlled highway miles, 2020: 128,989 — 3rd highest
26. Arkansas
- Annual peak hours spent in congestion per auto commuter, 2020: 20.4
- Avg. population density, 2020: 57.9 people per sq. mile of land — 17th lowest
- System width (state-controlled highways), 2020: 2.31 average lanes — 15th narrowest
- Pct. urban interstate mileage in poor condition, 2020: 5.13% — 16th highest
- State-controlled highway miles, 2020: 38,078 — 16th highest
25. Hawaii
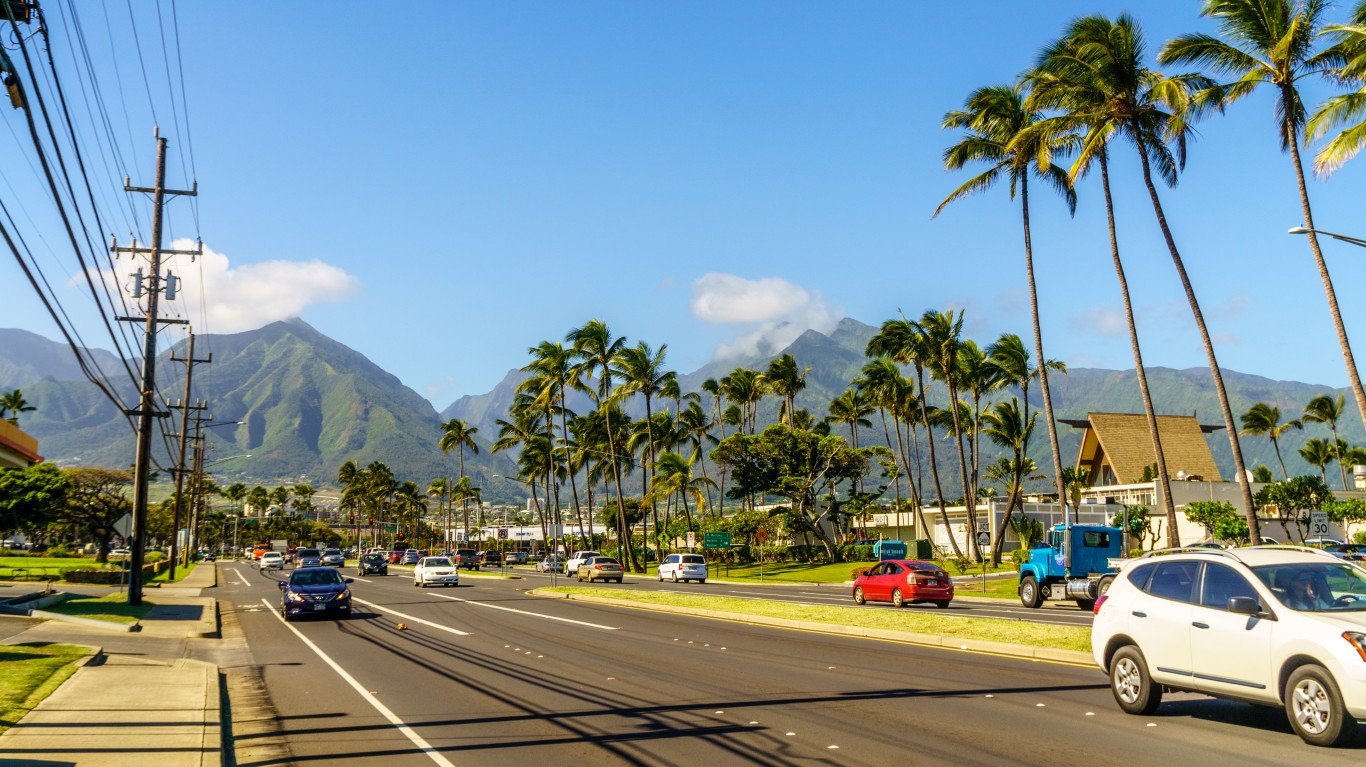
- Annual peak hours spent in congestion per auto commuter, 2020: 20.7
- Avg. population density, 2020: 226.6 people per sq. mile of land — 13th highest
- System width (state-controlled highways), 2020: 2.61 average lanes — 15th widest
- Pct. urban interstate mileage in poor condition, 2020: 25.88% — the highest
- State-controlled highway miles, 2020: 2,477 — the lowest
23. Arizona
- Annual peak hours spent in congestion per auto commuter, 2020: 22.2
- Avg. population density, 2020: 62.9 people per sq. mile of land — 18th lowest
- System width (state-controlled highways), 2020: 2.93 average lanes — 5th widest
- Pct. urban interstate mileage in poor condition, 2020: 2.13% — 14th lowest
- State-controlled highway miles, 2020: 20,046 — 20th lowest
23. Mississippi
- Annual peak hours spent in congestion per auto commuter, 2020: 22.2
- Avg. population density, 2020: 63.1 people per sq. mile of land — 19th lowest
- System width (state-controlled highways), 2020: 2.59 average lanes — 17th widest
- Pct. urban interstate mileage in poor condition, 2020: 3.13% — 25th highest
- State-controlled highway miles, 2020: 28,310 — 24th highest
22. Tennessee
- Annual peak hours spent in congestion per auto commuter, 2020: 22.5
- Avg. population density, 2020: 167.6 people per sq. mile of land — 20th highest
- System width (state-controlled highways), 2020: 2.68 average lanes — 11th widest
- Pct. urban interstate mileage in poor condition, 2020: 1.66% — 10th lowest
- State-controlled highway miles, 2020: 37,746 — 17th highest
21. Ohio

- Annual peak hours spent in congestion per auto commuter, 2020: 22.6
- Avg. population density, 2020: 288.8 people per sq. mile of land — 10th highest
- System width (state-controlled highways), 2020: 2.58 average lanes — 19th widest
- Pct. urban interstate mileage in poor condition, 2020: 4.56% — 19th highest
- State-controlled highway miles, 2020: 49,681 — 10th highest
20. Colorado
- Annual peak hours spent in congestion per auto commuter, 2020: 22.8
- Avg. population density, 2020: 55.7 people per sq. mile of land — 14th lowest
- System width (state-controlled highways), 2020: 2.55 average lanes — 21st widest
- Pct. urban interstate mileage in poor condition, 2020: 6.64% — 11th highest
- State-controlled highway miles, 2020: 23,022 — 23rd lowest
19. Pennsylvania
- Annual peak hours spent in congestion per auto commuter, 2020: 22.9
- Avg. population density, 2020: 290.6 people per sq. mile of land — 9th highest
- System width (state-controlled highways), 2020: 2.22 average lanes — 9th narrowest
- Pct. urban interstate mileage in poor condition, 2020: 6.13% — 12th highest
- State-controlled highway miles, 2020: 88,322 — 5th highest
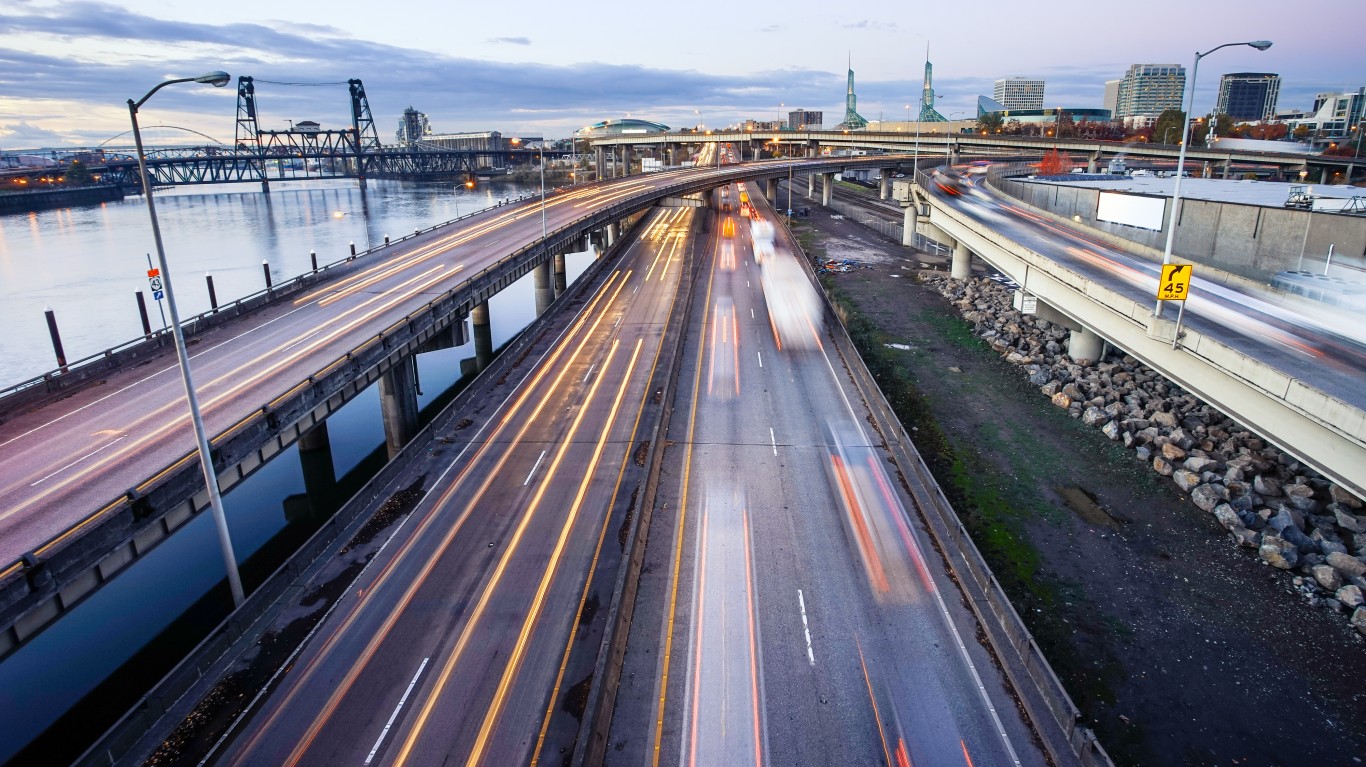
18. Oregon
- Annual peak hours spent in congestion per auto commuter, 2020: 23.0
- Avg. population density, 2020: 44.1 people per sq. mile of land — 12th lowest
- System width (state-controlled highways), 2020: 2.43 average lanes — 21st narrowest
- Pct. urban interstate mileage in poor condition, 2020: 2.88% — 21st lowest
- State-controlled highway miles, 2020: 18,460 — 18th lowest
17. Maryland
- Annual peak hours spent in congestion per auto commuter, 2020: 23.5
- Avg. population density, 2020: 636.1 people per sq. mile of land — 5th highest
- System width (state-controlled highways), 2020: 2.87 average lanes — 6th widest
- Pct. urban interstate mileage in poor condition, 2020: 6.94% — 9th highest
- State-controlled highway miles, 2020: 14,928 — 12th lowest
15. Washington
- Annual peak hours spent in congestion per auto commuter, 2020: 24.3
- Avg. population density, 2020: 115.9 people per sq. mile of land — 22nd highest
- System width (state-controlled highways), 2020: 2.62 average lanes — 14th widest
- Pct. urban interstate mileage in poor condition, 2020: 2.92% — 22nd lowest
- State-controlled highway miles, 2020: 18,450 — 19th lowest
15. Michigan
- Annual peak hours spent in congestion per auto commuter, 2020: 24.3
- Avg. population density, 2020: 178 people per sq. mile of land — 18th highest
- System width (state-controlled highways), 2020: 2.84 average lanes — 7th widest
- Pct. urban interstate mileage in poor condition, 2020: 7.79% — 8th highest
- State-controlled highway miles, 2020: 27,366 — 25th highest
14. Kansas
- Annual peak hours spent in congestion per auto commuter, 2020: 24.7
- Avg. population density, 2020: 35.9 people per sq. mile of land — 10th lowest
- System width (state-controlled highways), 2020: 2.33 average lanes — 18th narrowest
- Pct. urban interstate mileage in poor condition, 2020: 3.08% — 25th lowest
- State-controlled highway miles, 2020: 24,037 — 24th lowest
13. Missouri
- Annual peak hours spent in congestion per auto commuter, 2020: 28.1
- Avg. population density, 2020: 89.5 people per sq. mile of land — 23rd lowest
- System width (state-controlled highways), 2020: 2.3 average lanes — 14th narrowest
- Pct. urban interstate mileage in poor condition, 2020: 3.03% — 24th lowest
- State-controlled highway miles, 2020: 77,693 — 6th highest
12. Minnesota
- Annual peak hours spent in congestion per auto commuter, 2020: 28.5
- Avg. population density, 2020: 71.7 people per sq. mile of land — 21st lowest
- System width (state-controlled highways), 2020: 2.49 average lanes — 25th widest
- Pct. urban interstate mileage in poor condition, 2020: 3.20% — 24th highest
- State-controlled highway miles, 2020: 29,176 — 22nd highest
11. Georgia
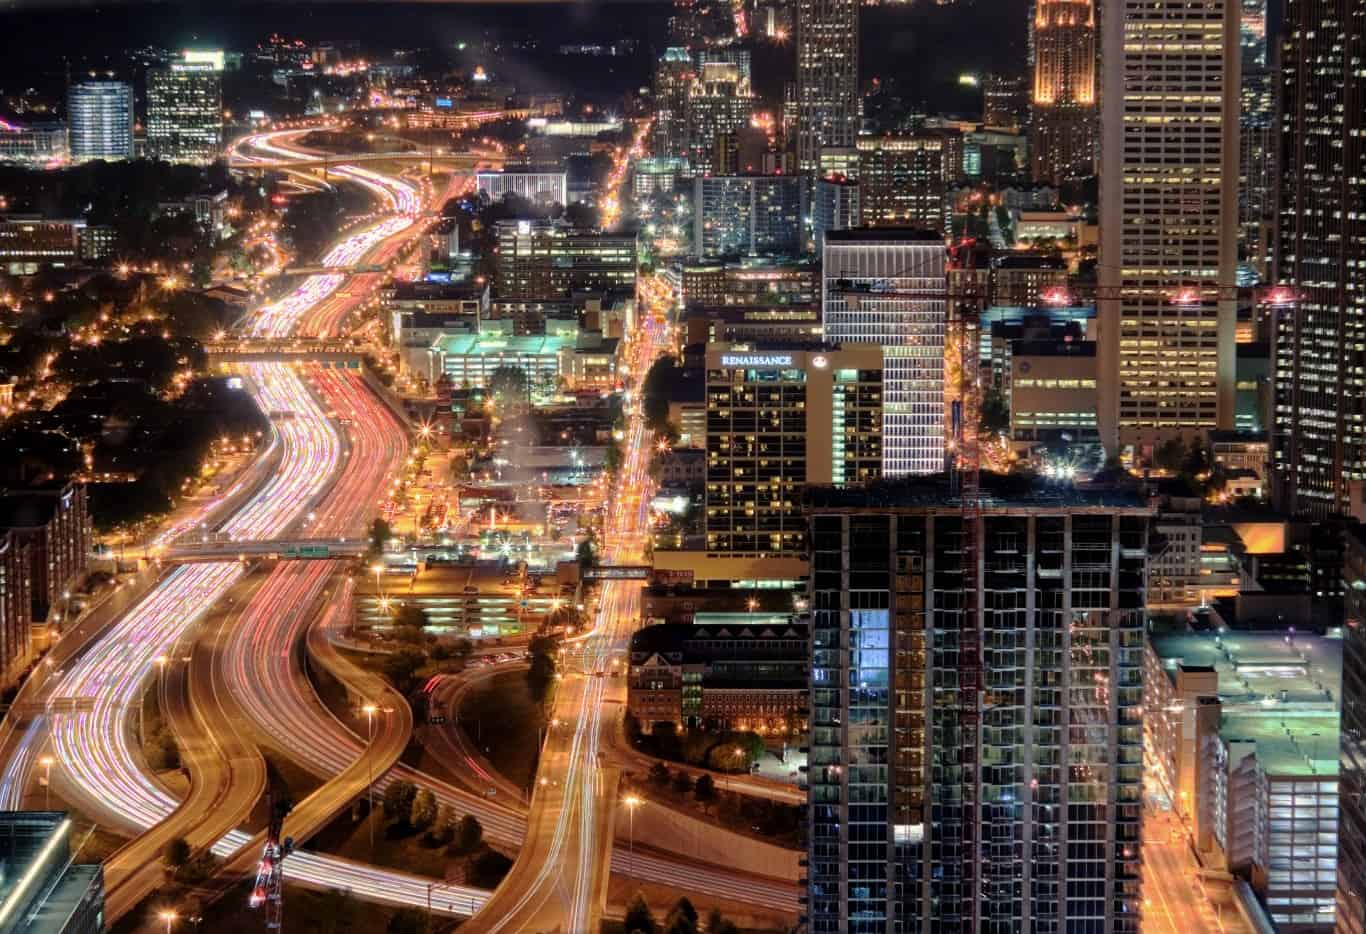
- Annual peak hours spent in congestion per auto commuter, 2020: 28.9
- Avg. population density, 2020: 185.6 people per sq. mile of land — 17th highest
- System width (state-controlled highways), 2020: 2.76 average lanes — 8th widest
- Pct. urban interstate mileage in poor condition, 2020: 1.36% — 5th lowest
- State-controlled highway miles, 2020: 49,497 — 11th highest
10. Oklahoma
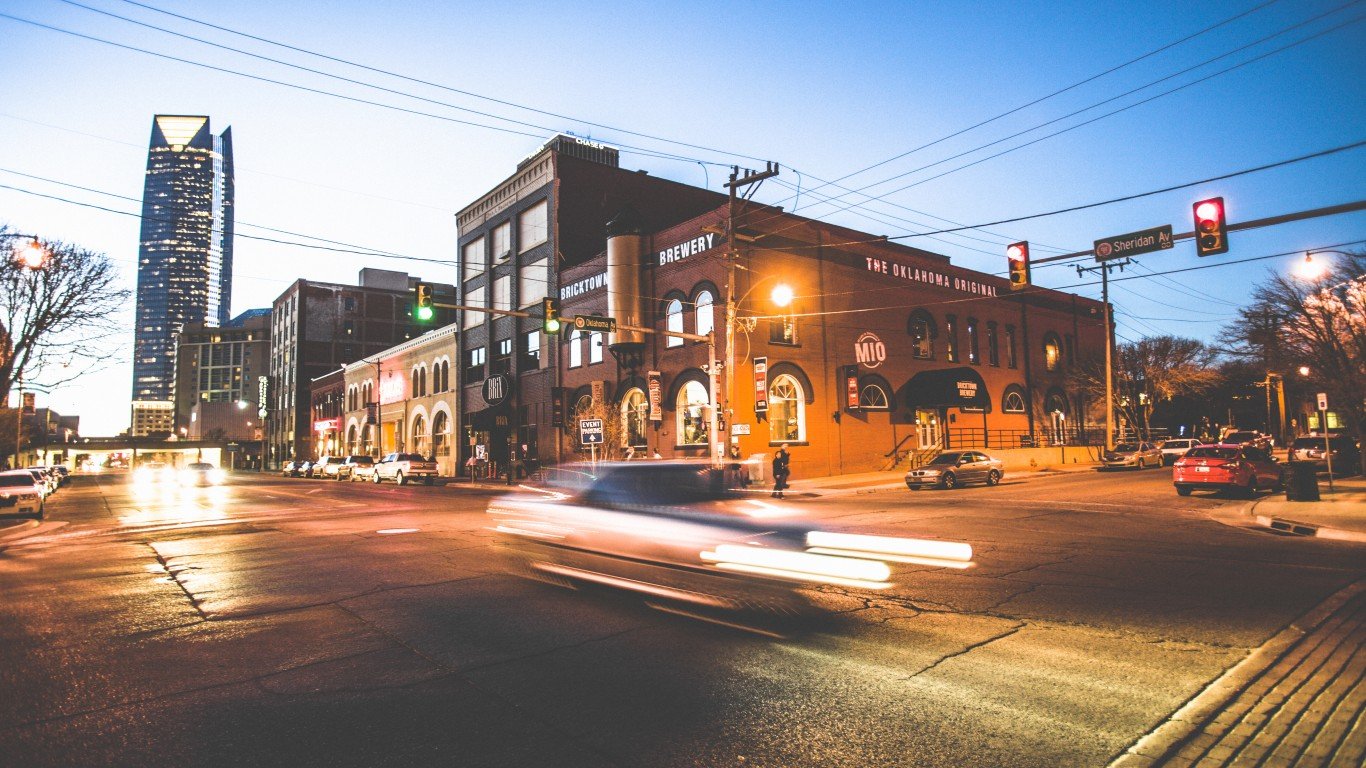
- Annual peak hours spent in congestion per auto commuter, 2020: 29.6
- Avg. population density, 2020: 57.7 people per sq. mile of land — 16th lowest
- System width (state-controlled highways), 2020: 2.48 average lanes — 25th narrowest
- Pct. urban interstate mileage in poor condition, 2020: 5.42% — 13th highest
- State-controlled highway miles, 2020: 30,407 — 18th highest
9. Connecticut
- Annual peak hours spent in congestion per auto commuter, 2020: 30.2
- Avg. population density, 2020: 744.7 people per sq. mile of land — 4th highest
- System width (state-controlled highways), 2020: 2.65 average lanes — 13th widest
- Pct. urban interstate mileage in poor condition, 2020: 1.57% — 8th lowest
- State-controlled highway miles, 2020: 9,827 — 7th lowest
8. Delaware
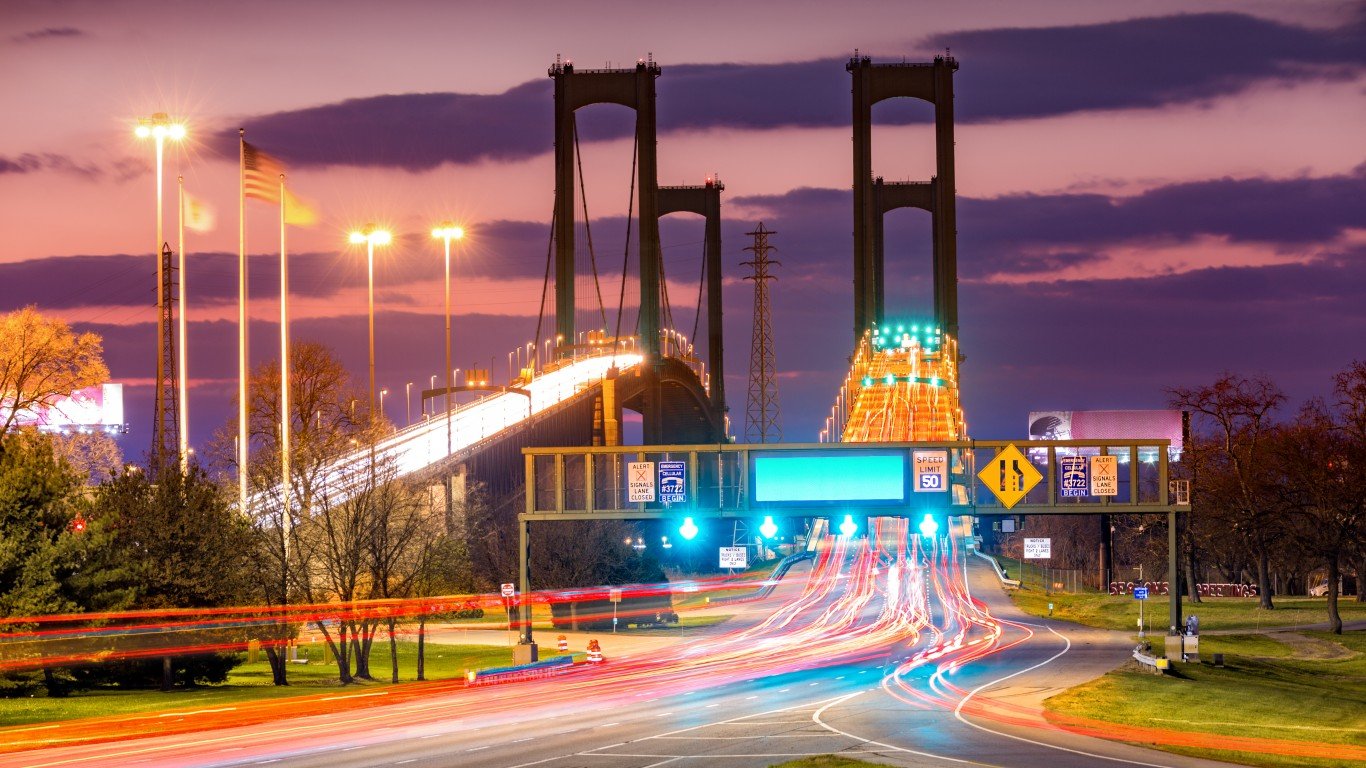
- Annual peak hours spent in congestion per auto commuter, 2020: 30.8
- Avg. population density, 2020: 508 people per sq. mile of land — 6th highest
- System width (state-controlled highways), 2020: 2.2 average lanes — 8th narrowest
- Pct. urban interstate mileage in poor condition, 2020: 8.67% — 7th highest
- State-controlled highway miles, 2020: 11,998 — 9th lowest
7. California
- Annual peak hours spent in congestion per auto commuter, 2020: 31.3
- Avg. population density, 2020: 253.7 people per sq. mile of land — 11th highest
- System width (state-controlled highways), 2020: 3.46 average lanes — 3rd widest
- Pct. urban interstate mileage in poor condition, 2020: 9.38% — 4th highest
- State-controlled highway miles, 2020: 52,004 — 9th highest
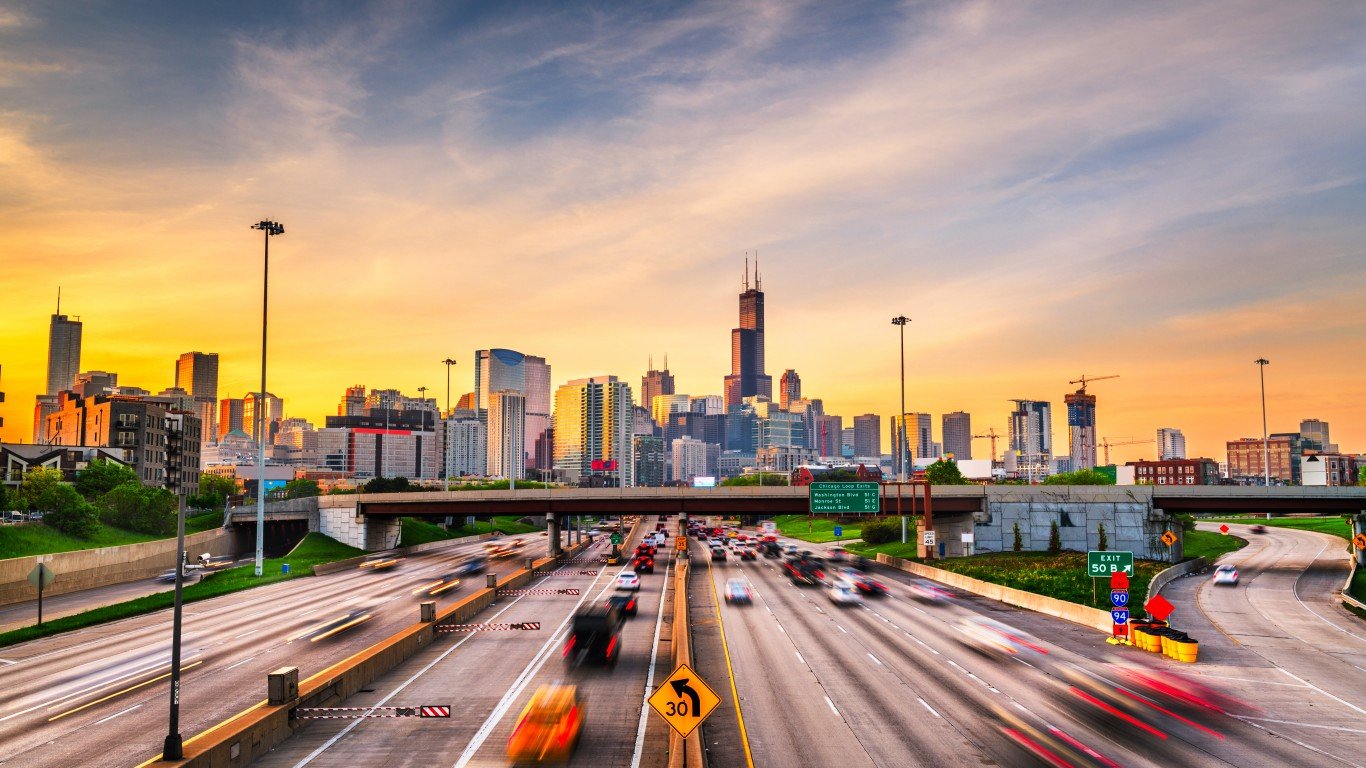
6. Illinois
- Annual peak hours spent in congestion per auto commuter, 2020: 32.0
- Avg. population density, 2020: 230.8 people per sq. mile of land — 12th highest
- System width (state-controlled highways), 2020: 2.65 average lanes — 12th widest
- Pct. urban interstate mileage in poor condition, 2020: 4.82% — 17th highest
- State-controlled highway miles, 2020: 42,169 — 13th highest
5. Rhode Island

- Annual peak hours spent in congestion per auto commuter, 2020: 32.7
- Avg. population density, 2020: 1,061.40 people per sq. mile of land — 2nd highest
- System width (state-controlled highways), 2020: 2.6 average lanes — 16th widest
- Pct. urban interstate mileage in poor condition, 2020: 2.49% — 18th lowest
- State-controlled highway miles, 2020: 2,870 — 2nd lowest
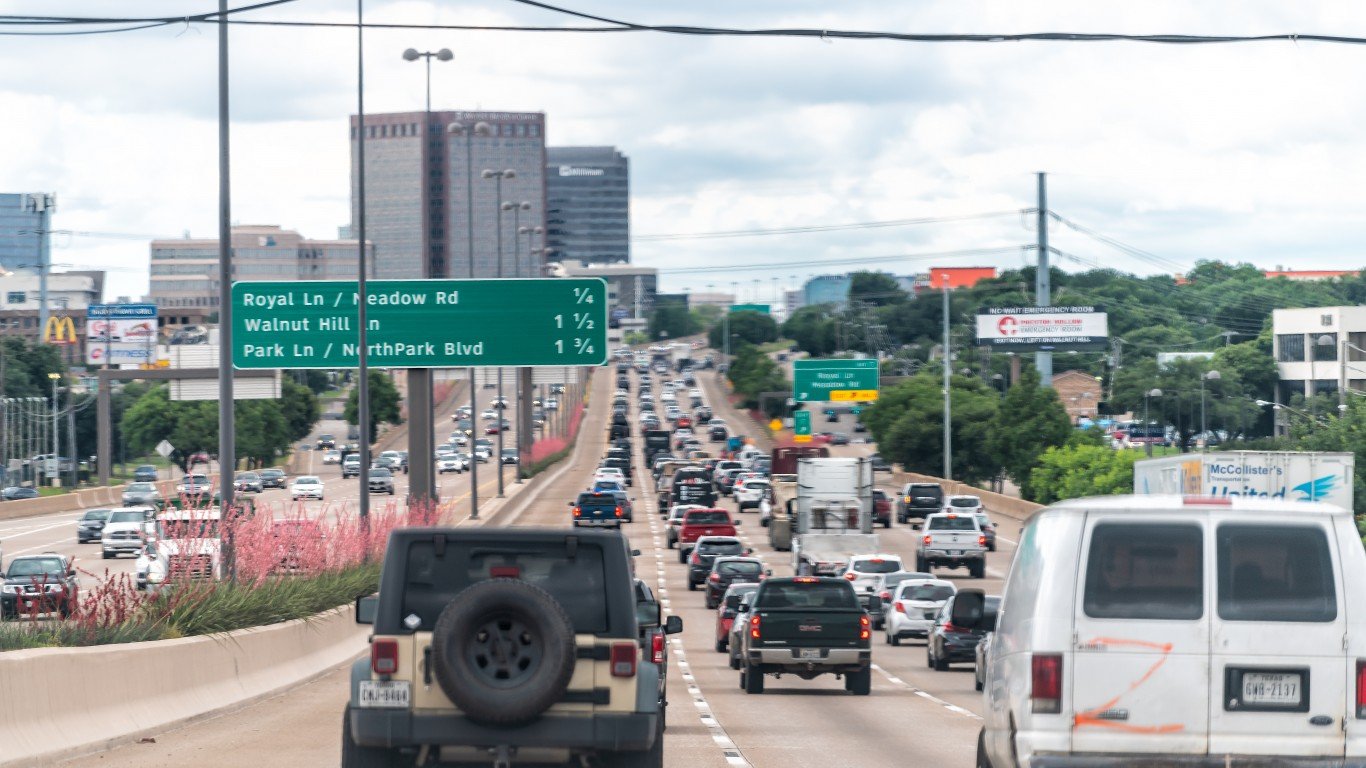
4. Texas
- Annual peak hours spent in congestion per auto commuter, 2020: 34.9
- Avg. population density, 2020: 111.6 people per sq. mile of land — 24th highest
- System width (state-controlled highways), 2020: 2.46 average lanes — 22nd narrowest
- Pct. urban interstate mileage in poor condition, 2020: 3.97% — 21st highest
- State-controlled highway miles, 2020: 198,465 — the highest
3. Massachusetts
- Annual peak hours spent in congestion per auto commuter, 2020: 40.4
- Avg. population density, 2020: 901.2 people per sq. mile of land — 3rd highest
- System width (state-controlled highways), 2020: 3.19 average lanes — 4th widest
- Pct. urban interstate mileage in poor condition, 2020: 2.99% — 23rd lowest
- State-controlled highway miles, 2020: 9,556 — 6th lowest
2. New York

- Annual peak hours spent in congestion per auto commuter, 2020: 43.2
- Avg. population density, 2020: 428.7 people per sq. mile of land — 7th highest
- System width (state-controlled highways), 2020: 2.53 average lanes — 23rd widest
- Pct. urban interstate mileage in poor condition, 2020: 9.39% — 3rd highest
- State-controlled highway miles, 2020: 38,157 — 15th highest
1. New Jersey
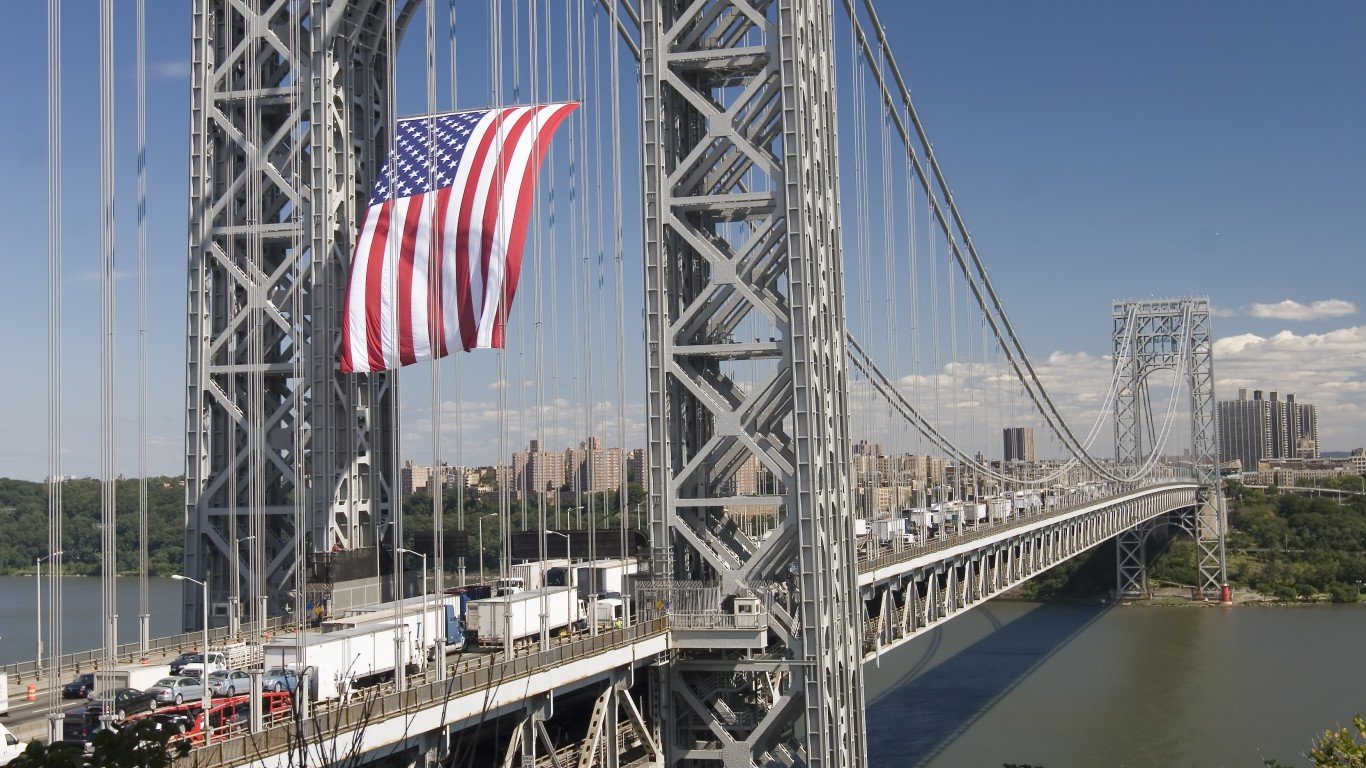
- Annual peak hours spent in congestion per auto commuter, 2020: 48.0
- Avg. population density, 2020: 1,263.00 people per sq. mile of land — the highest
- System width (state-controlled highways), 2020: 3.67 average lanes — 2nd widest
- Pct. urban interstate mileage in poor condition, 2020: 9.32% — 5th highest
- State-controlled highway miles, 2020: 8,551 — 5th lowest
Contact [email protected] for any questions or corrections.