America is the only country where there are more guns than people — as of 2022, the US has 121 guns for every 100 citizens. Gun-related violence has also increased, with more people dying of gun-related injuries in 2021 than in any other year on record. This is according to the latest available statistics from the Centers for Disease Control and Prevention (CDC).
Gun sales have hit record highs in the United States in recent years. According to the Bureau of Alcohol, Tobacco, Firearms, and Explosives, 36.6 million firearms were manufactured and sold in the U.S. between 2020 and 2022, a 60% increase over the preceding three-year period. And as consumer demand for firearms has spiked, so too have instances of criminal gun violence. (These are the states where anyone can get a gun today.)
Every year, American law enforcement agencies seize thousands of firearms suspected to have been used in a crime. As part of the investigation, the ATF often traces these firearms back to their original point of sale. While not all guns traced by the ATF have been used in a crime — and not all firearms used for illicit purposes are traced — federal tracing data offers valuable insight into trends and geographic patterns related to gun violence in the United States. In the last year, for example, some U.S. cities have reported a surge in suspected criminal firearm investigations.
Using ATF firearm tracing data as a proxy for criminal offenses, 24/7 Wall St. identified the U.S. cities where gun crime is surging. We considered the 10 cities in each state with the most firearm tracings in 2022 — 500 U.S. cities in total — and ranked them on the one-year change in ATF gun tracings. Cities in which fewer than 20 firearms were traced in 2021 were excluded from analysis.
Each of the 35 cities on this list reported a more than 50% increase in federal firearm investigations between 2021 and 2022. In many of these cities, criminal firearm investigations more than doubled year over year. (Here is a look at the states where gun deaths are increasing the fastest.)
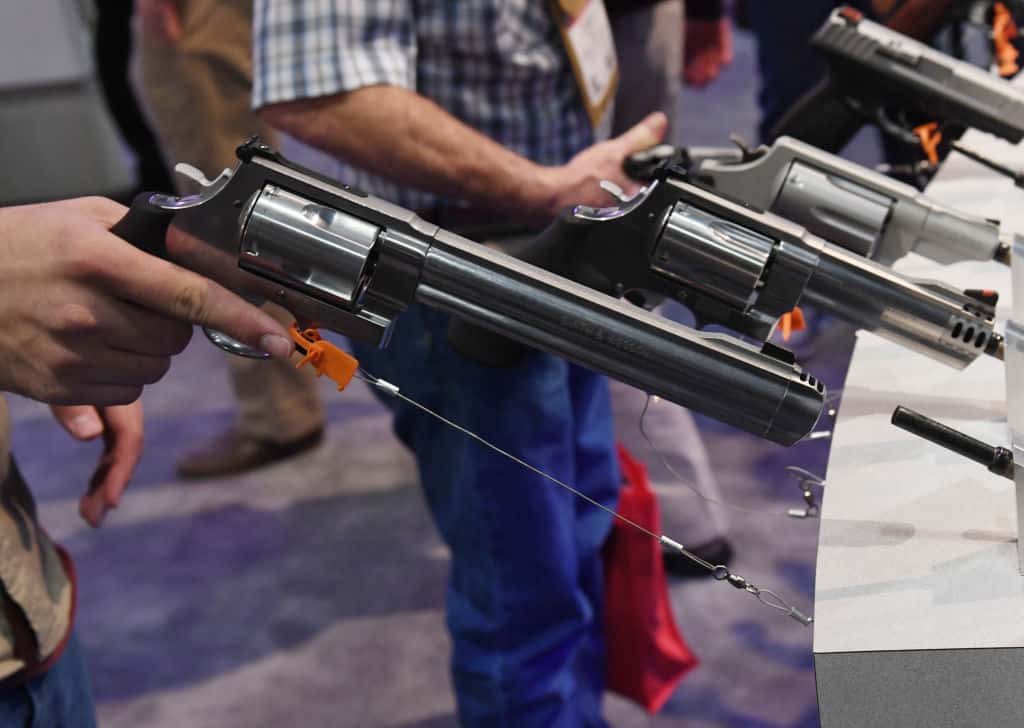
Gun-Related Crime — Why it Matters
Source: ValeStock / iStock Editorial via Getty Images
Gun violence in America is getting to be a common-place occurrence, with 8 in 10 murders involving a firearm (2021 statistics). Americans are also 26 times more likely to be shot than citizens of other high-income countries. The issue of gun control is, however, a very politicized one that is highly contended between gun control advocates and people defending their right to bear arms.
We are writing this article to give our readers a better sense of where there is a potential problem with gun-related crime and to address the general problem of gun violence. This problem costs the US up to $557 billion (total cost) per year. This is five times the national budget for the Department of Education. The money lost to these incidents could be spent much better elsewhere.
Here are the cities where gun-related crime is surging.
35. Tacoma, WA

Source: thyegn / iStock via Getty Images
- 1-yr. change in ATF firearm tracings, 2021-2022: +51.8% (+207)
- ATF firearm tracings for each year: 607 in 2022; 400 in 2021
- Change in population, 2021-2022: +0.9% (+1,902)
- ATF firearm tracings in 2022 adjusted for population: 276.9 per 100,000 people
- ATF firearm tracings in 2021 adjusted for population: 184.1 per 100,000 people
34. North Platte, NE
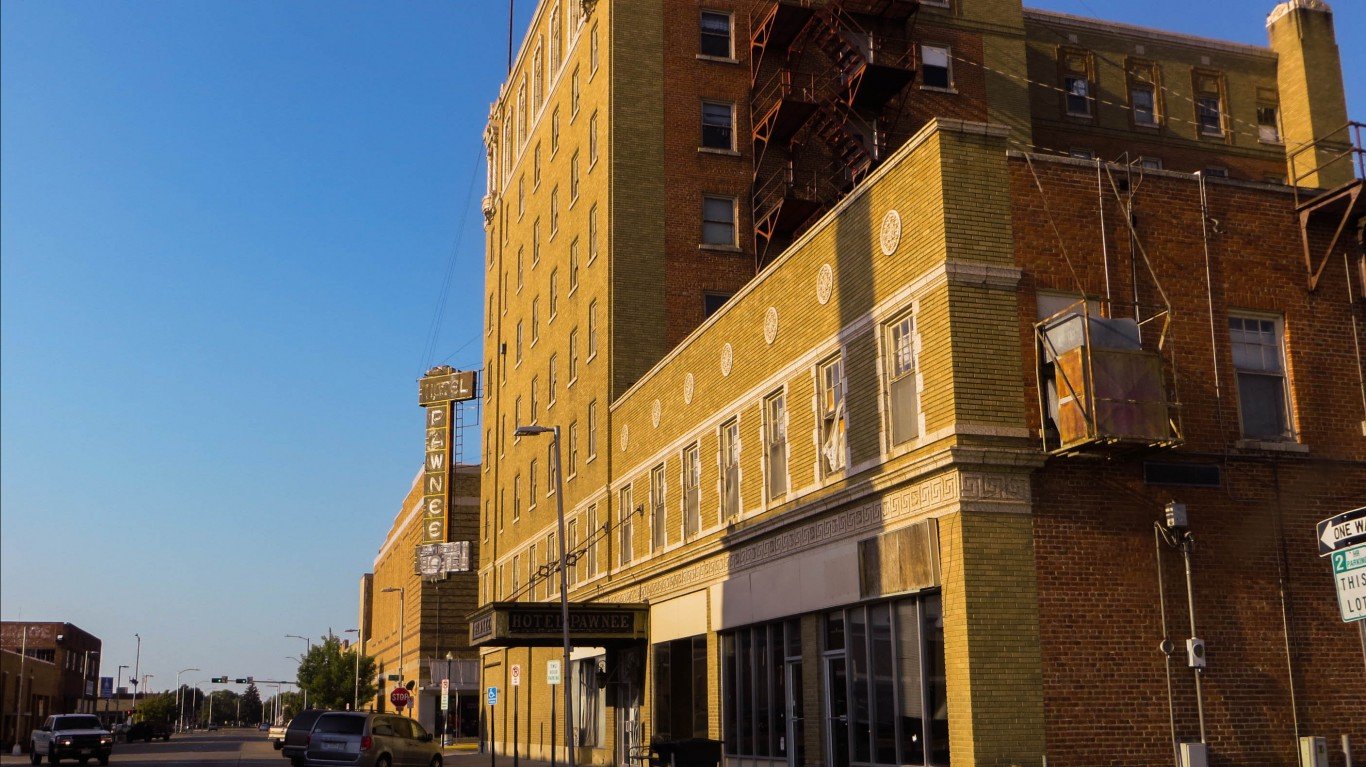
Source: davidwilson1949 / Flickr
- 1-yr. change in ATF firearm tracings, 2021-2022: +52.3% (+23)
- ATF firearm tracings for each year: 67 in 2022; 44 in 2021
- Change in population, 2021-2022: -1.0% (-234)
- ATF firearm tracings in 2022 adjusted for population: 287.4 per 100,000 people
- PATF firearm tracings in 2021 adjusted for population: 186.9 per 100,000 people
33. Saint George, UT
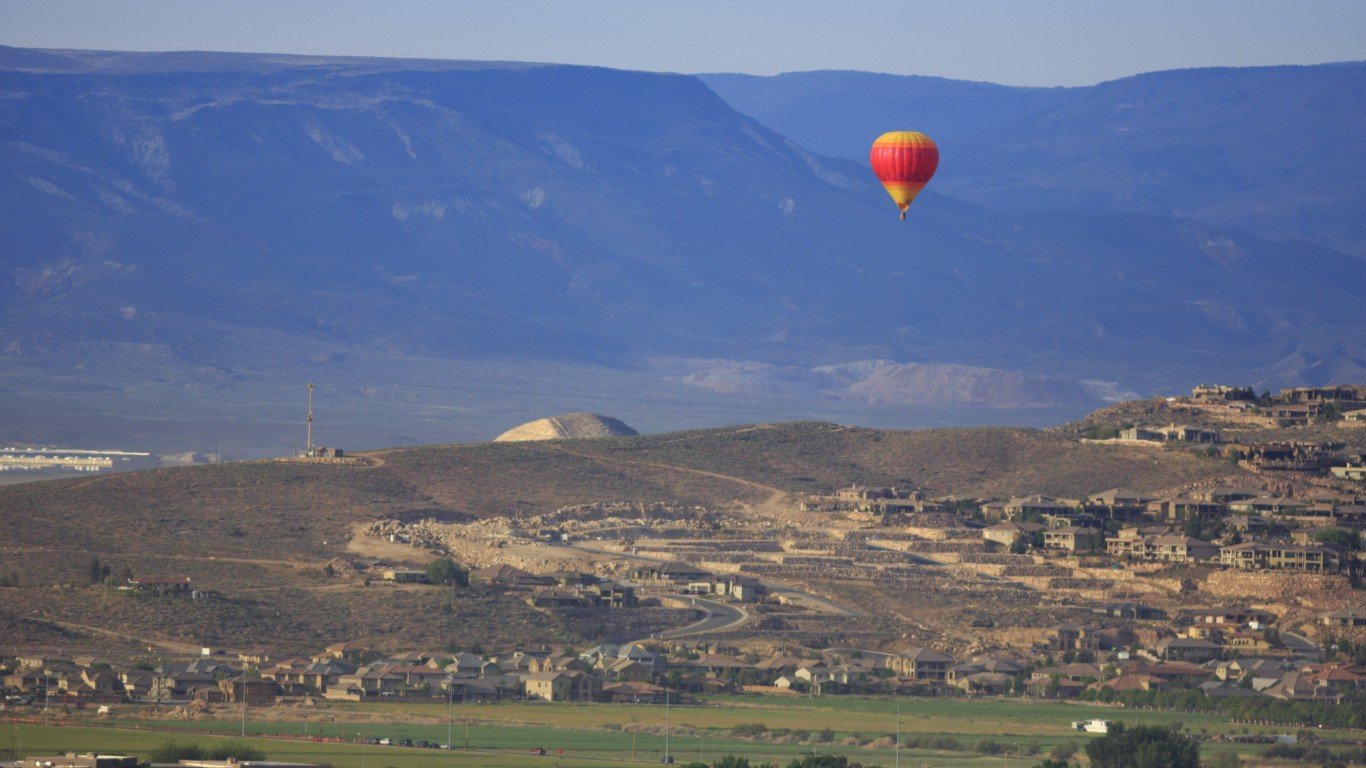
Source: SweetyMommy / Getty Images
- 1-yr. change in ATF firearm tracings, 2021-2022: +52.9% (+63)
- ATF firearm tracings for each year: 182 in 2022; 119 in 2021
- Change in population, 2021-2022: +3.6% (+3,299)
- ATF firearm tracings in 2022 adjusted for population: 189.2 per 100,000 people
- ATF firearm tracings in 2021 adjusted for population: 128.1 per 100,000 people
32. Corpus Christi, TX
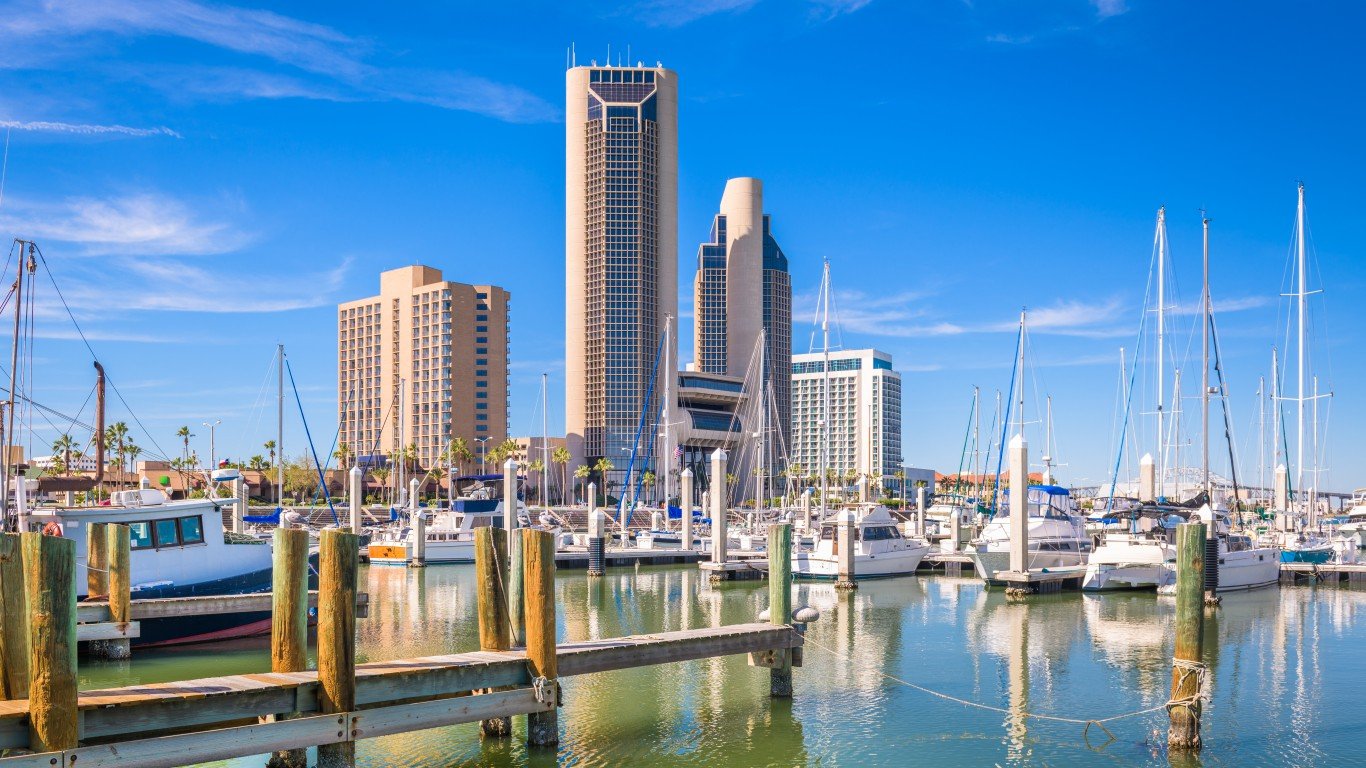
Source: Sean Pavone / iStock via Getty Images
- 1-yr. change in ATF firearm tracings, 2021-2022: +54.2% (+416)
- ATF firearm tracings for each year: 1,184 in 2022; 768 in 2021
- Change in population, 2021-2022: -0.1% (-364)
- ATF firearm tracings in 2022 adjusted for population: 372.6 per 100,000 people
- ATF firearm tracings in 2021 adjusted for population: 241.4 per 100,000 people
31. Holyoke, MA
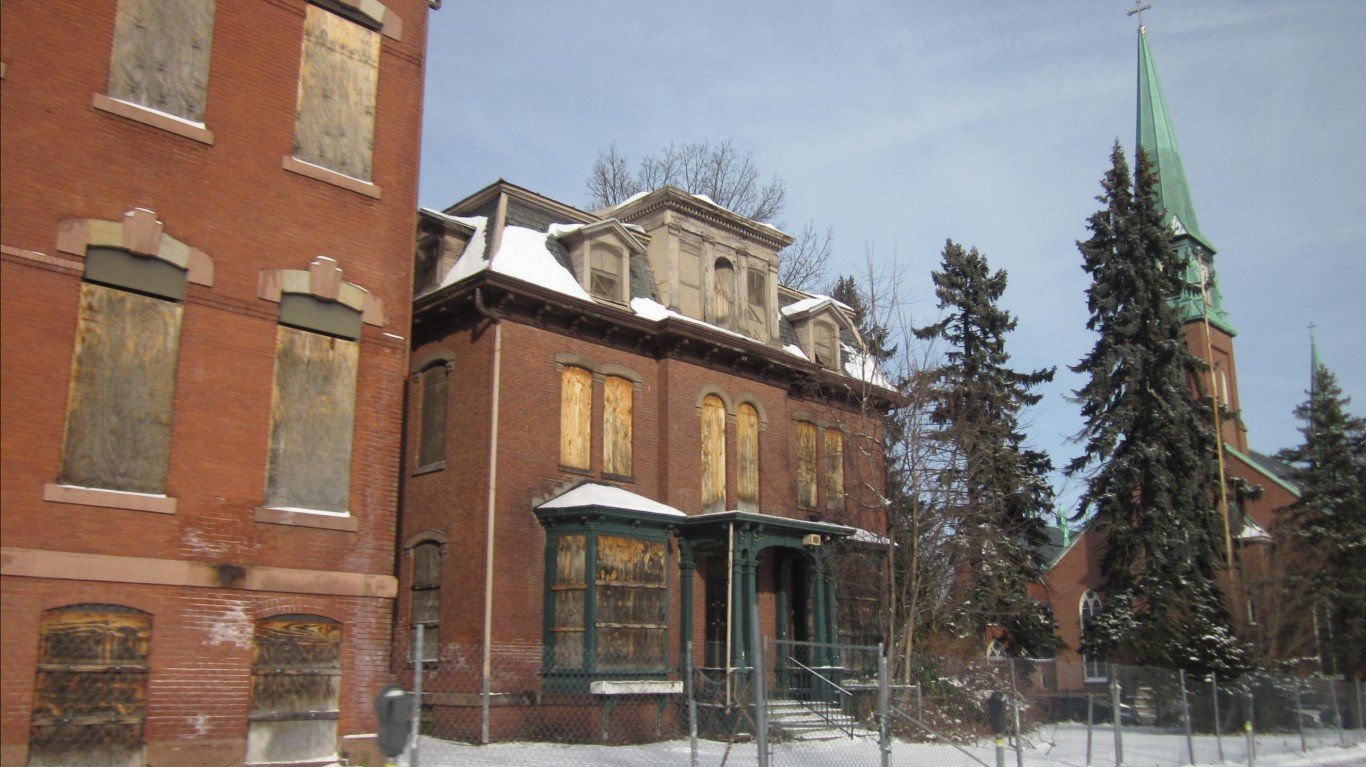
Source: dougtone / Flickr
- 1-yr. change in ATF firearm tracings, 2021-2022: +54.4% (+37)
- ATF firearm tracings for each year: 105 in 2022; 68 in 2021
- Change in populationn, 2021-2022: -0.7% (-270)
- ATF firearm tracings in 2022 adjusted for population: 274.8 per 100,000 people
- ATF firearm tracings in 2021 adjusted for population: 176.7 per 100,000 people
30. Maple Grove, MN
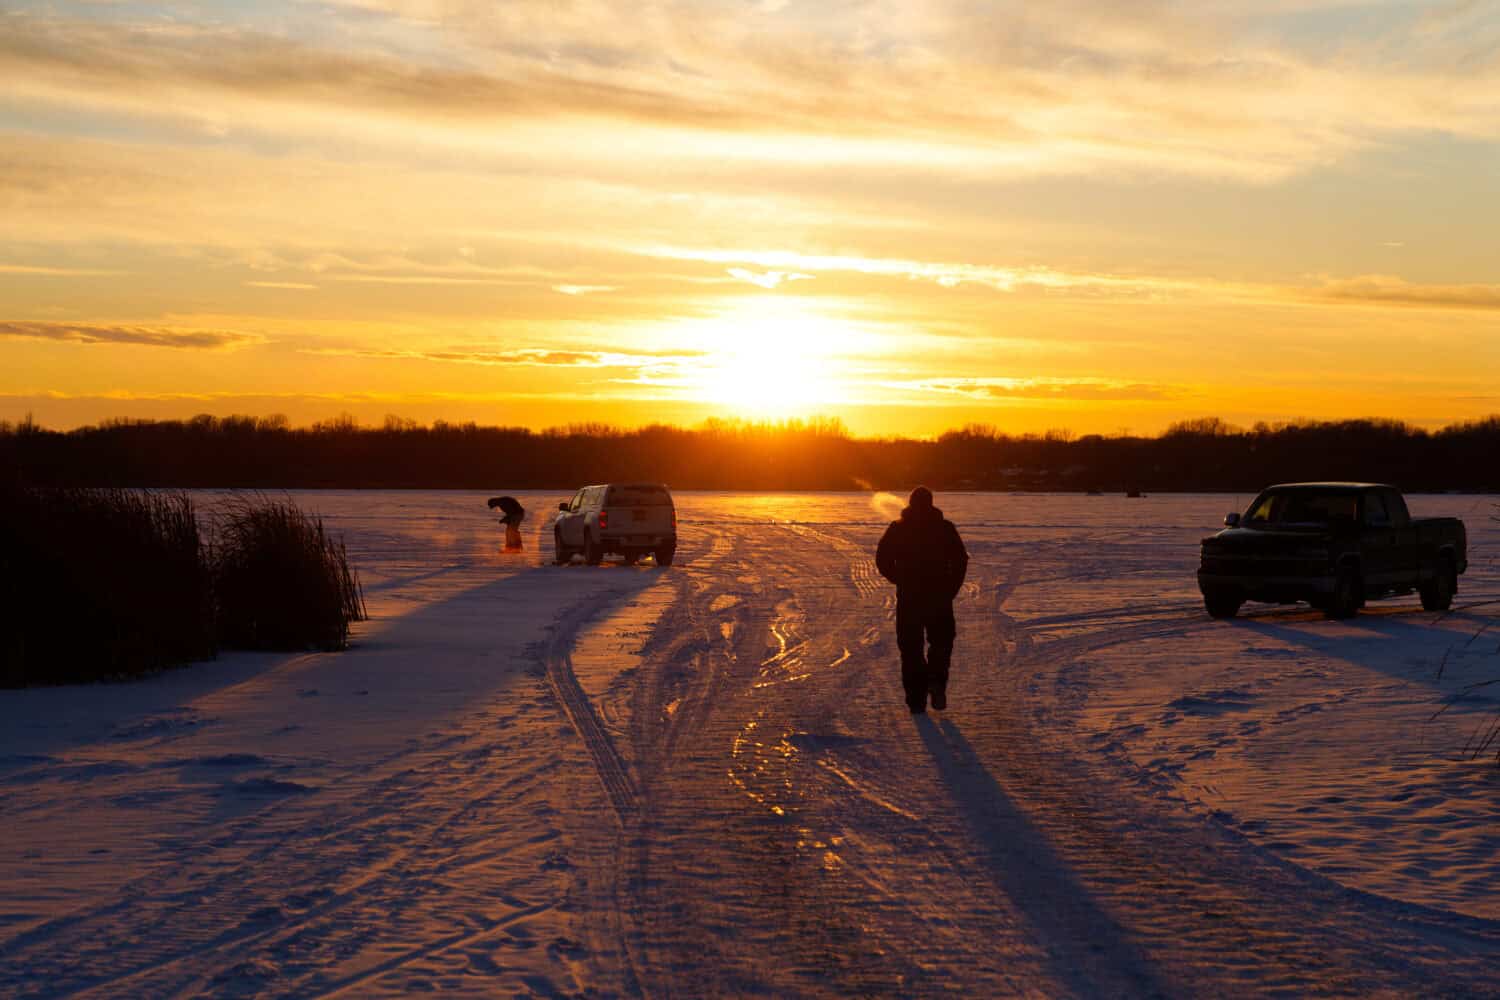
Source: Anh Luu / Shutterstock.com
- 1-yr. change in ATF firearm tracings, 2021-2022: +56.9% (+29)
- ATF firearm tracings for each year: 80 in 2022; 51 in 2021
- Change in population, 2021-2022: +0.3% (+210)
- PATF firearm tracings in 2022 adjusted for population: 114.1 per 100,000 people
- ATF firearm tracings in 2021 adjusted for population: 73.0 per 100,000 people
29. Peoria, AZ
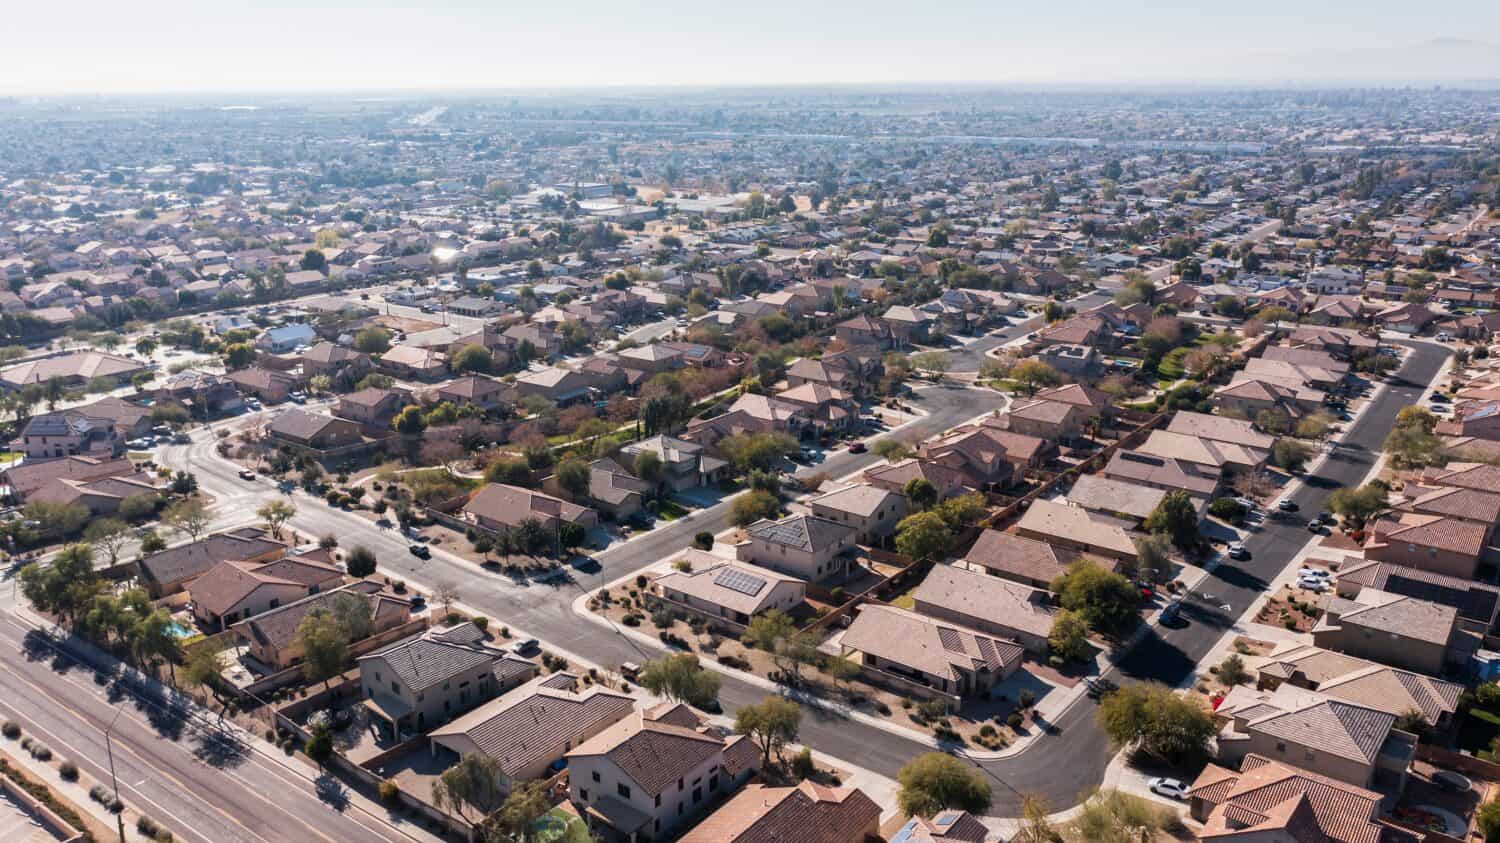
Source: Matt Gush / Shutterstock.com
- 1-yr. change in ATF firearm tracings, 2021-2022: +58.6% (+112)
- ATF firearm tracings for each year: 303 in 2022; 191 in 2021
- Change in population, 2021-2022: +1.9% (+3,559)
- ATF firearm tracings in 2022 adjusted for population: 158.4 per 100,000 people
- ATF firearm tracings in 2021 adjusted for population: 101.7 per 100,000 people
28. Racine, WI

Source: vjaksic / iStock via Getty Images
- 1-yr. change in ATF firearm tracings, 2021-2022: +59.0% (+147)
- ATF firearm tracings for each year: 396 in 2022; 249 in 2021
- Change in population, 2021-2022: -0.3% (-252)
- ATF firearm tracings in 2022 adjusted for population: 511.3 per 100,000 people
- ATF firearm tracings in 2021 adjusted for population: 320.4 per 100,000 people
27. West Allis, WI

- 1-yr. change in ATF firearm tracings, 2021-2022: +61.7% (+116)
- ATF firearm tracings for each year: 304 in 2022; 188 in 2021
- Change in population, 2021-2022: -0.5% (-313)
- ATF firearm tracings in 2022 adjusted for population: 507.5 per 100,000 people
- ATF firearm tracings in 2021 adjusted for population: 312.2 per 100,000 people
26. Syracuse, NY

Source: DebraMillet / iStock via Getty Images
- 1-yr. change in ATF firearm tracings, 2021-2022: +65.9% (+135)
- ATF firearm tracings for each year: 340 in 2022; 205 in 2021
- Change in population, 2021-2022: -0.4% (-647)
- ATF firearm tracings in 2022 adjusted for population: 232.7 per 100,000 people
- ATF firearm tracings in 2021 adjusted for population: 139.7 per 100,000 people
25.  Source: Christian Hinkle / Shutterstock.com
Source: Christian Hinkle / Shutterstock.com
- 1-yr. change in ATF firearm tracings, 2021-2022: +68.3% (+86)
- ATF firearm tracings for each year: 212 in 2022; 126 in 2021
- Change in population, 2021-2022: +0.2% (+90)
- ATF firearm tracings in 2022 adjusted for population: 473.4 per 100,000 people
- ATF firearm tracings in 2021 adjusted for population: 281.9 per 100,000 people
24. Newport News, VA

Source: DenisTangneyJr / E+ via Getty Images
- 1-yr. change in ATF firearm tracings, 2021-2022: +69.3% (+537)
- ATF firearm tracings for each year: 1,312 in 2022; 775 in 2021
- Change in population, 2021-2022: +0.03% (+49)
- ATF firearm tracings in 2022 adjusted for population: 708.7 per 100,000 people
- ATF firearm tracings in 2021 adjusted for population: 418.8 per 100,000 people
23. East Saint Louis, IL

- 1-yr. change in ATF firearm tracings, 2021-2022: +70.2% (+134)
- ATF firearm tracings for each year: 325 in 2022; 191 in 2021
- Change in population, 2021-2022: -3.3% (-641)
- ATF firearm tracings in 2022 adjusted for population: 1729.1 per 100,000 people
- ATF firearm tracings in 2021 adjusted for population: 982.7 per 100,000 people
22. Clarksburg, WV
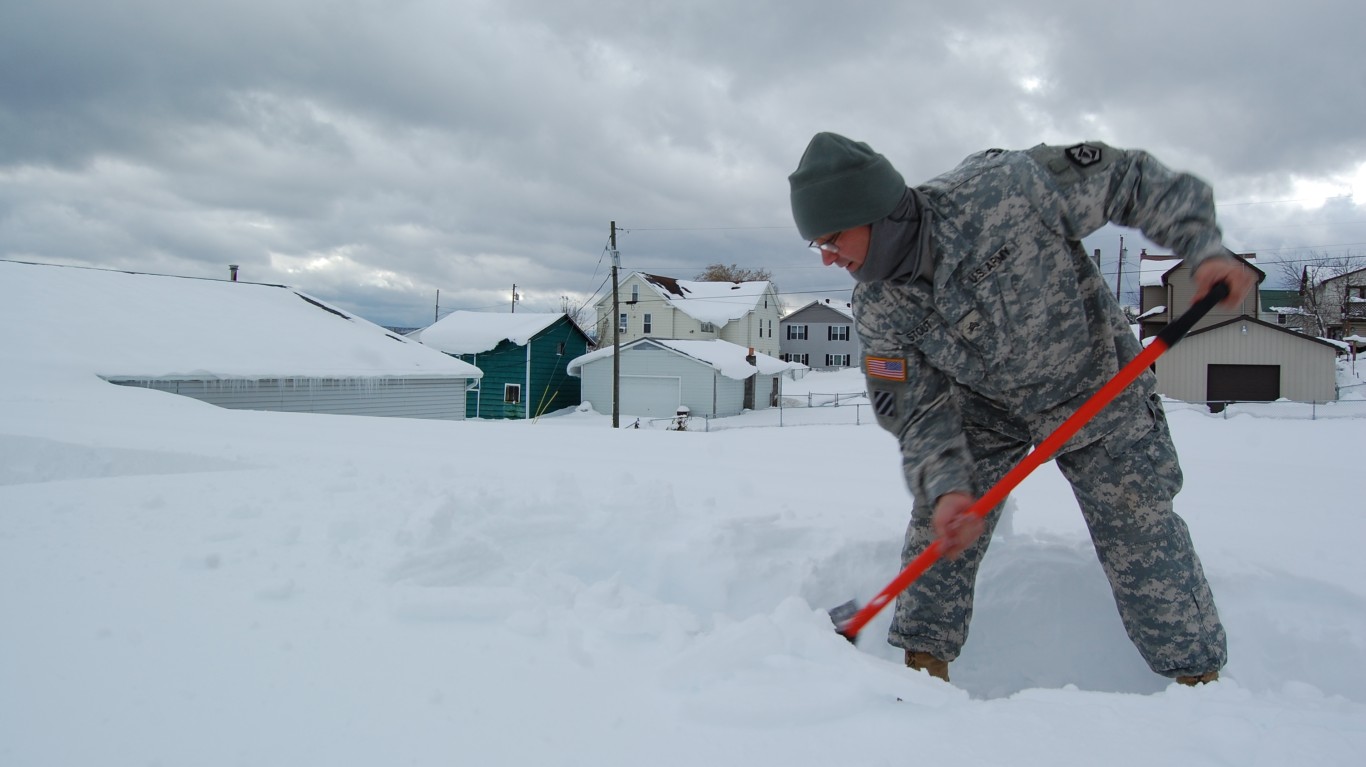
Source: dvids / Flickr
- 1-yr. change in ATF firearm tracings, 2021-2022: +73.7% (+42)
- ATF firearm tracings for each year: 99 in 2022; 57 in 2021
- Change in population, 2021-2022: -0.7% (-108)
- ATF firearm tracings in 2022 adjusted for population: 619.6 per 100,000 people
- ATF firearm tracings in 2021 adjusted for population: 354.4 per 100,000 people
21. Elizabethtown, KY
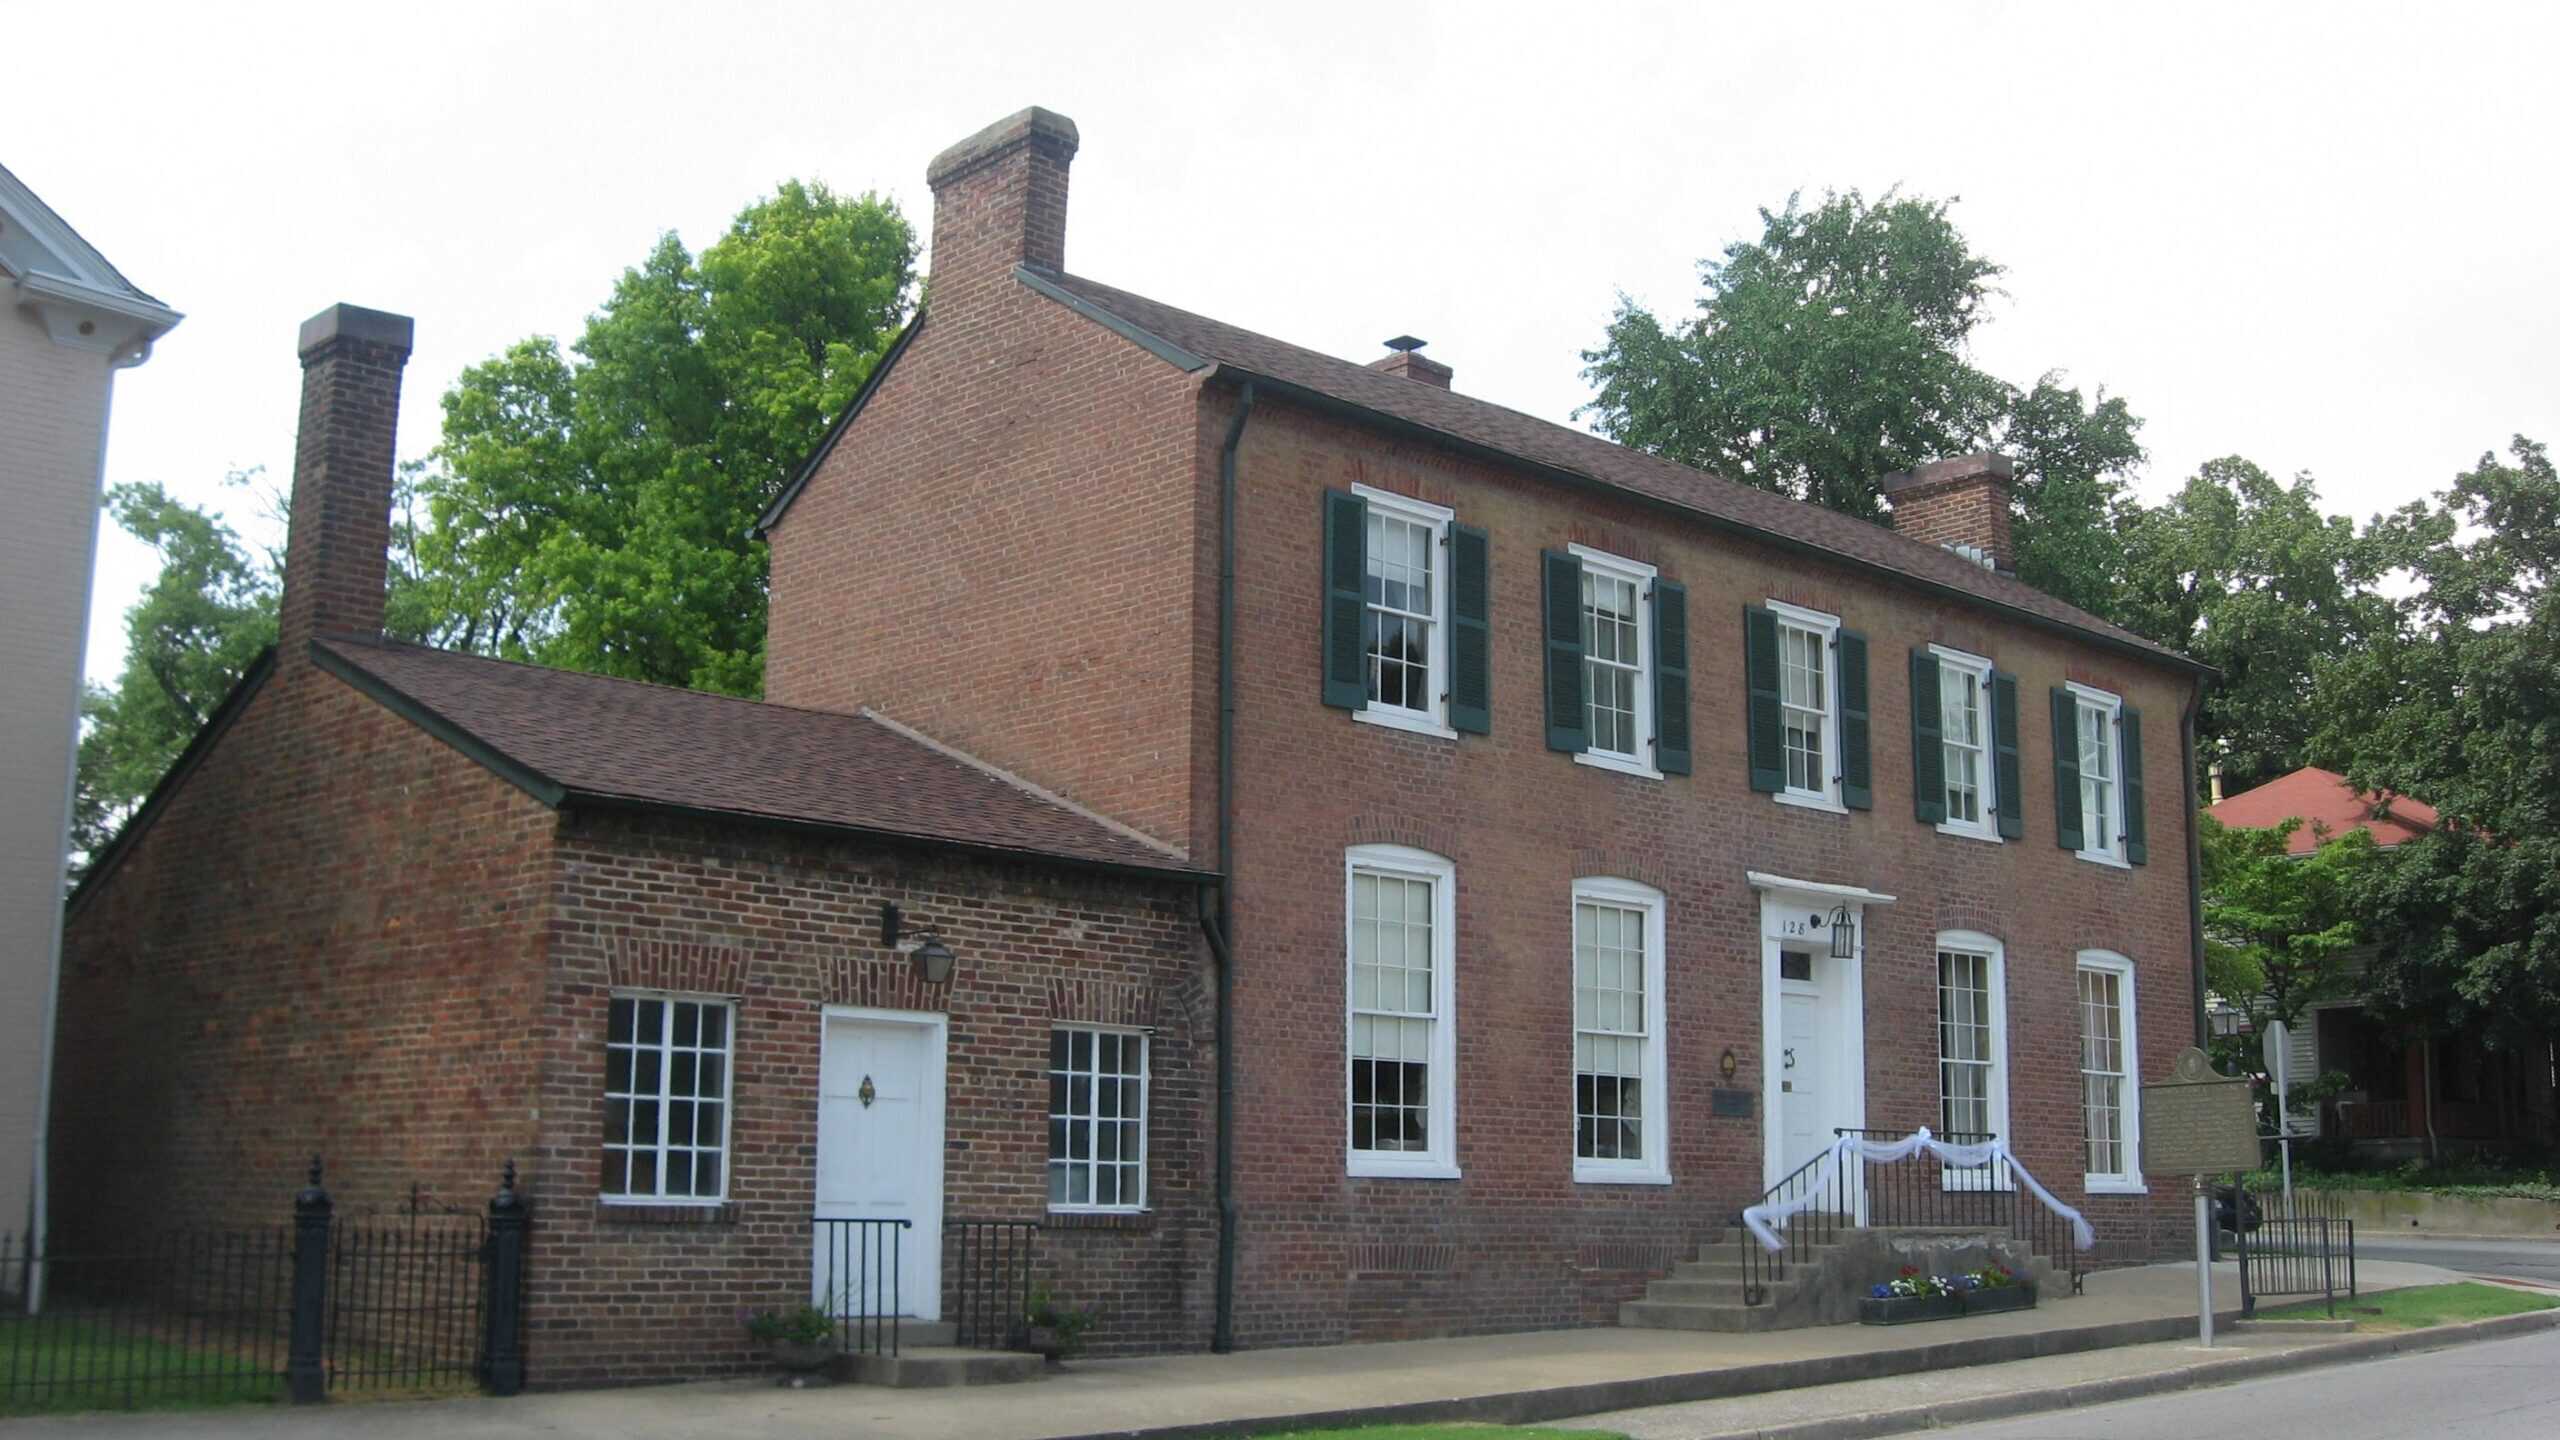
Source: Public Domain / Wikimedia Commons
- 1-yr. change in ATF firearm tracings, 2021-2022: +74.7% (+62)
- ATF firearm tracings for each year: 145 in 2022; 83 in 2021
- Change in population, 2021-2022: +1.2% (+359)
- ATF firearm tracings in 2022 adjusted for population: 461.4 per 100,000 people
- ATF firearm tracings in 2021 adjusted for population: 267.2 per 100,000 people
20. Myrtle Beach, SC
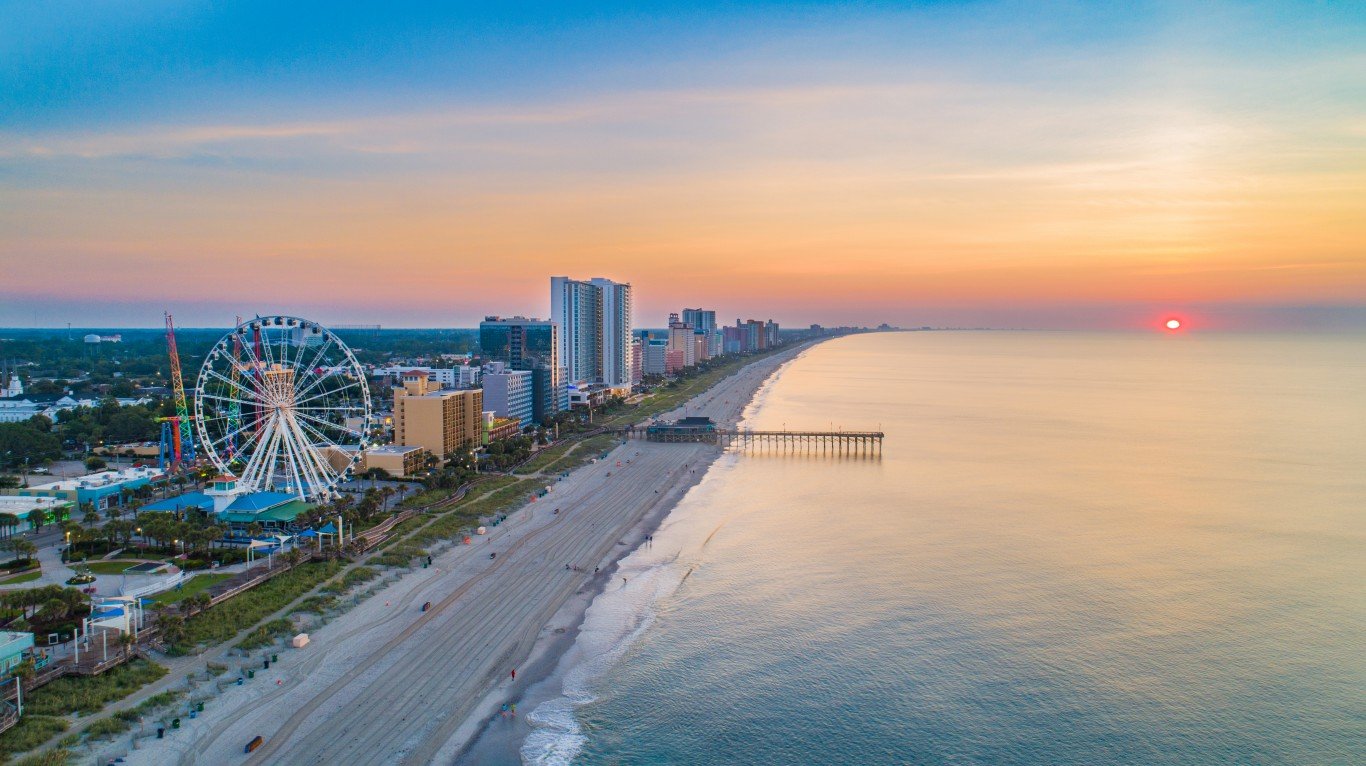
Source: Kruck20 / iStock via Getty Images
- 1-yr. change in ATF firearm tracings, 2021-2022: +76.9% (+247)
- ATF firearm tracings for each year: 568 in 2022; 321 in 2021
- Change in population, 2021-2022: +2.7% (+948)
- ATF firearm tracings in 2022 adjusted for population: 1575.0 per 100,000 people
- ATF firearm tracings in 2021 adjusted for population: 914.1 per 100,000 people
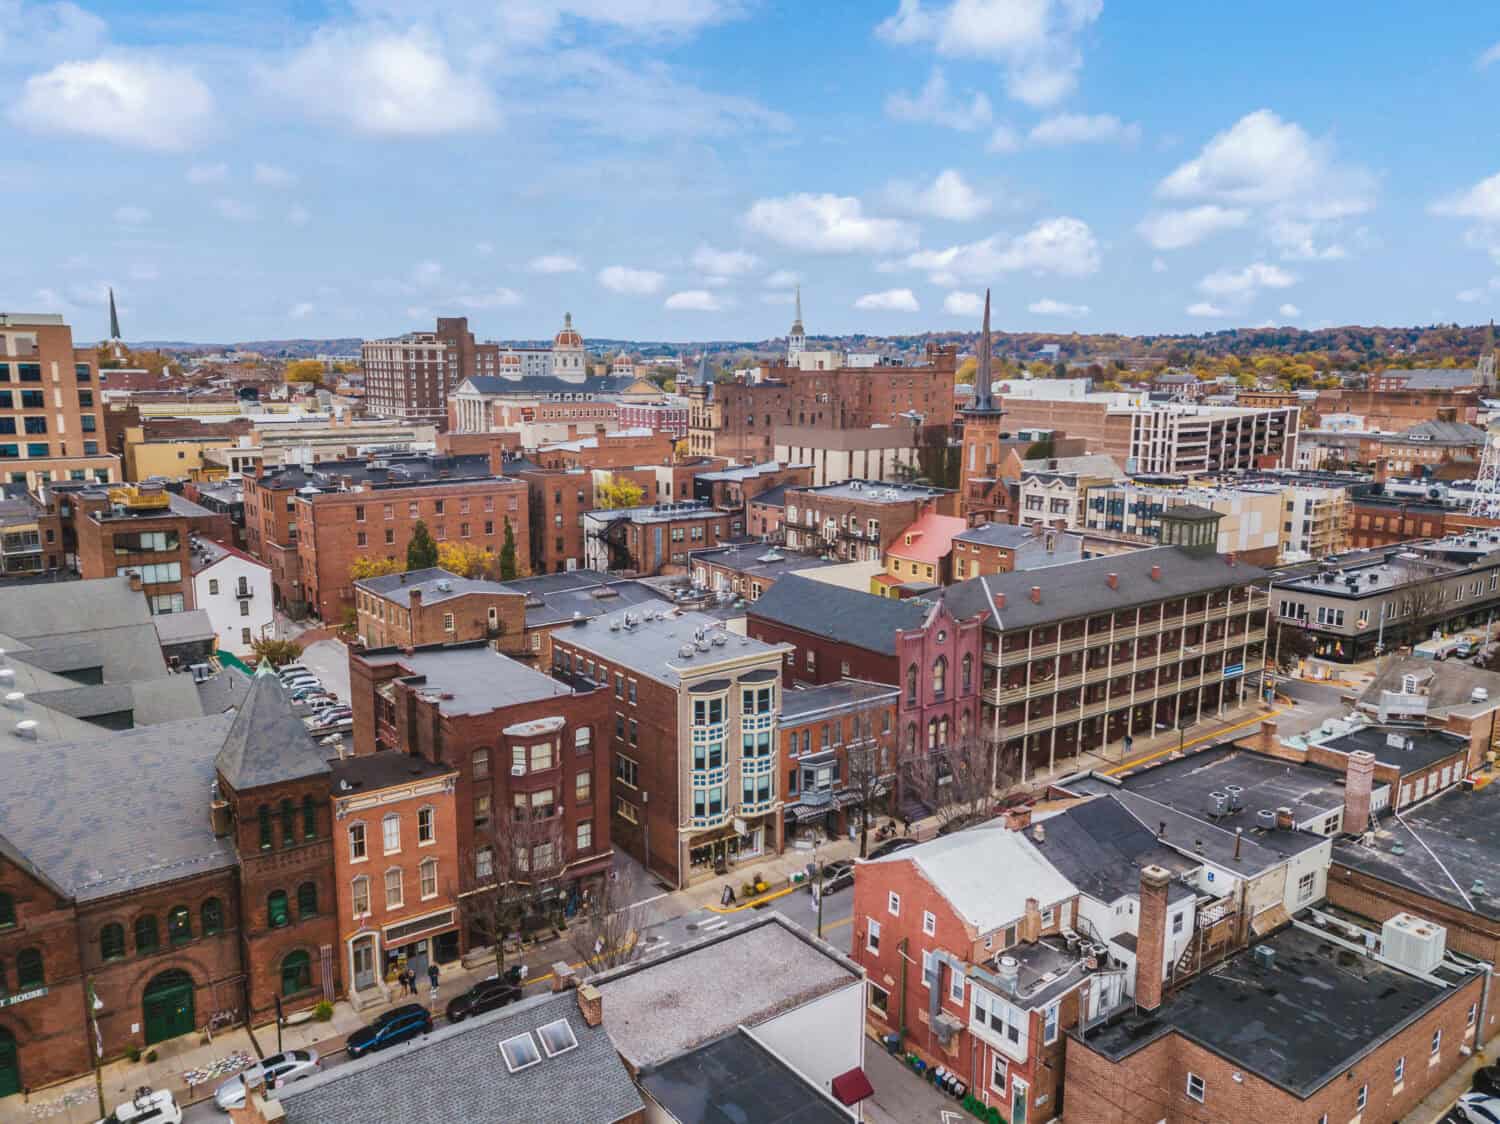
19. Chester, PA
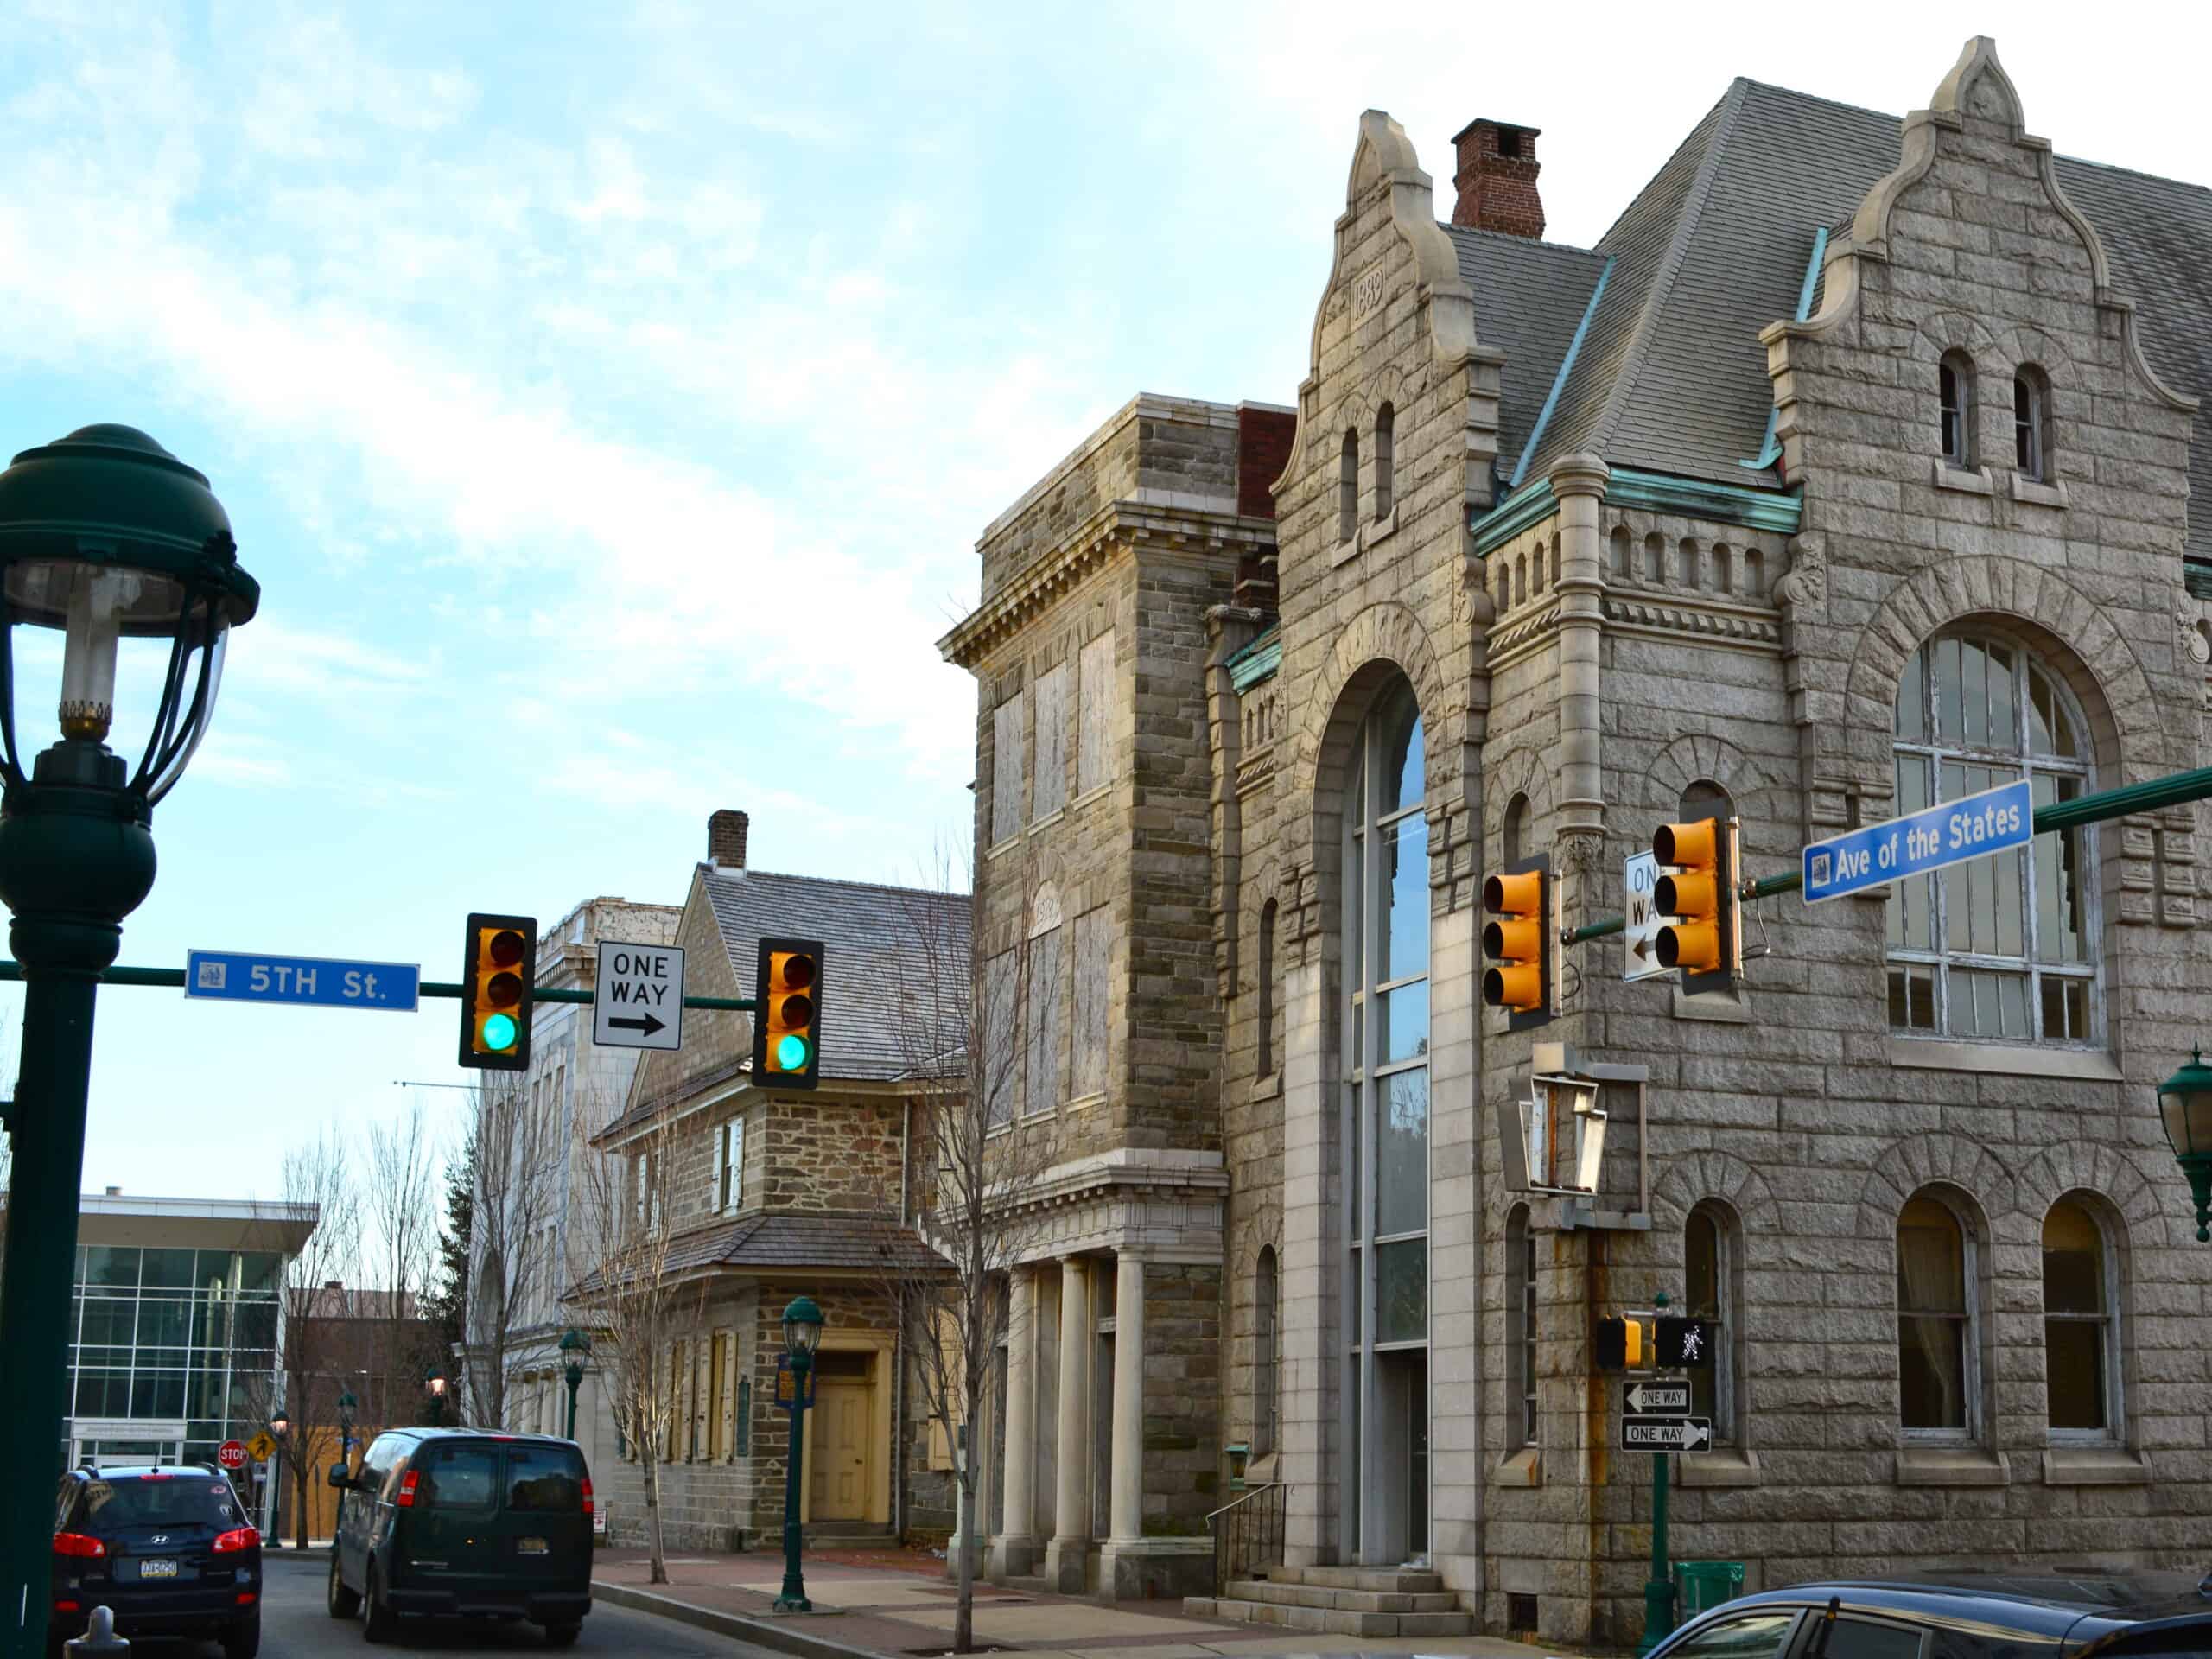
Source: Public Domain / Wikimedia Commons
- 1-yr. change in ATF firearm tracings, 2021-2022: +87.7% (+100)
- ATF firearm tracings for each year: 214 in 2022; 114 in 2021
- Change in population, 2021-2022: +0.7% (+229)
- ATF firearm tracings in 2022 adjusted for population: 647.5 per 100,000 people
- ATF firearm tracings in 2021 adjusted for population: 347.4 per 100,000 people
18. Murfreesboro, TN
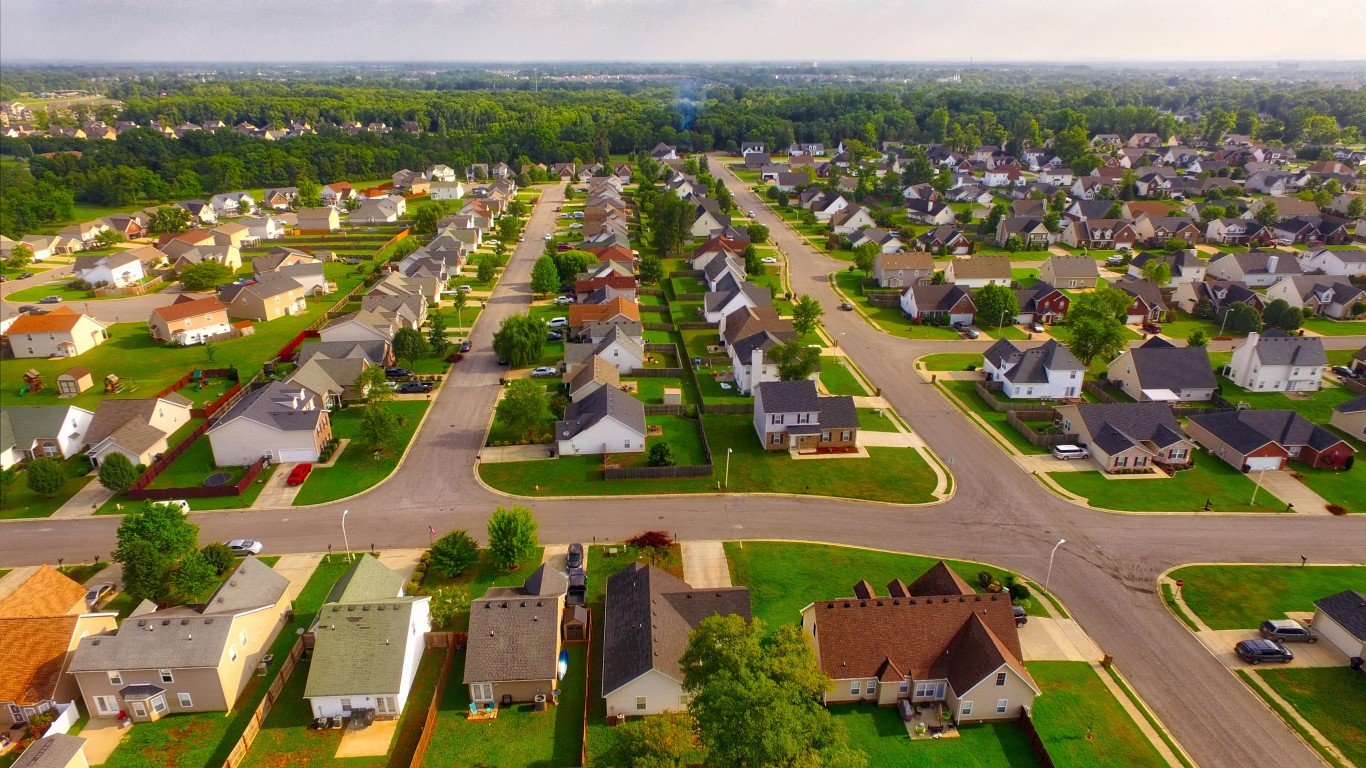
Source: Barry Richards / iStock via Getty Images
- 1-yr. change in ATF firearm tracings, 2021-2022: +95.9% (+162)
- ATF firearm tracings for each year: 331 in 2022; 169 in 2021
- Change in population, 2021-2022: +3.0% (+4,517)
- ATF firearm tracings in 2022 adjusted for population: 215.7 per 100,000 people
- ATF firearm tracings in 2021 adjusted for population: 113.4 per 100,000 people
17. Fresno, CA

Source: Jacob Boomsma / Shutterstock.com
- 1-yr. change in ATF firearm tracings, 2021-2022: +98.0% (+944)
- ATF firearm tracings for each year: 1,907 in 2022; 963 in 2021
- Change in population, 2021-2022: +0.5% (+2,850)
- ATF firearm tracings in 2022 adjusted for population: 352.2 per 100,000 people
- ATF firearm tracings in 2021 adjusted for population: 178.8 per 100,000 people
16. Norman, OK
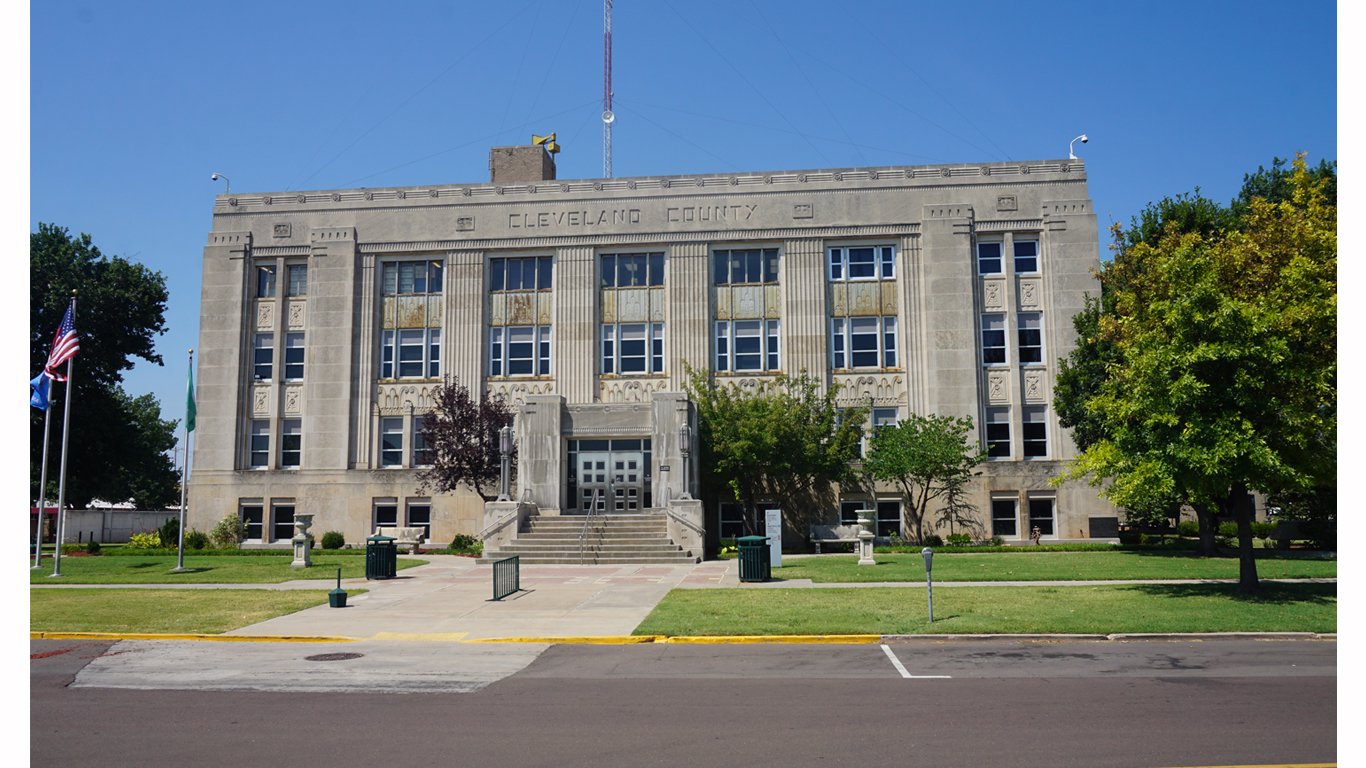
Source: Michael Barera / Wikimedia Commons
- 1-yr. change in ATF firearm tracings, 2021-2022: +100.0% (+28)
- ATF firearm tracings for each year: 56 in 2022; 28 in 2021
- Change in population, 2021-2022: +1.6% (+1,956)
- ATF firearm tracings in 2022 adjusted for population: 43.9 per 100,000 people
- ATF firearm tracings in 2021 adjusted for population: 22.3 per 100,000 people
15. Las Cruces, NM
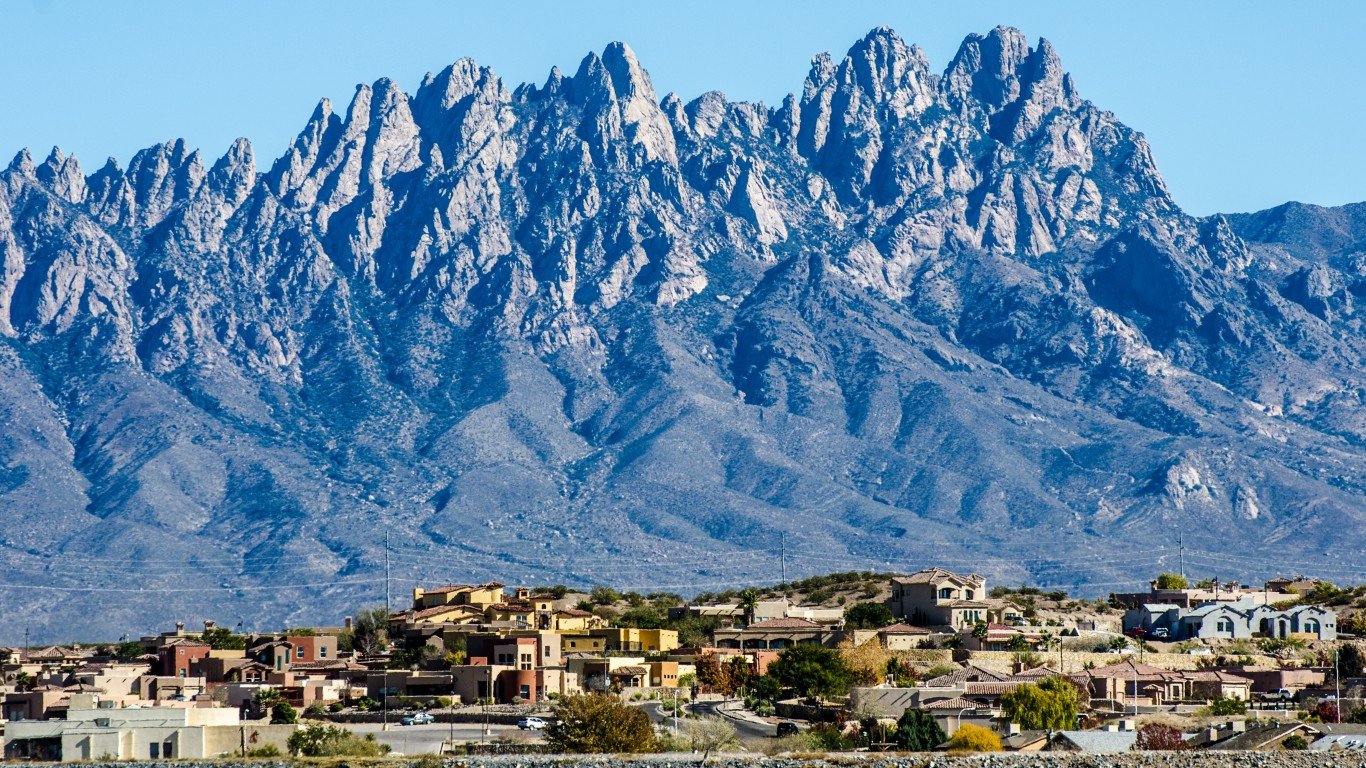
Source: SWCargill / iStock via Getty Images
- 1-yr. change in ATF firearm tracings, 2021-2022: +104.5% (+139)
- ATF firearm tracings for each year: 272 in 2022; 133 in 2021
- Change in population, 2021-2022: +1.2% (+1,339)
- ATF firearm tracings in 2022 adjusted for population: 244.4 per 100,000 people
- ATF firearm tracings in 2021 adjusted for population: 121.0 per 100,000 people
14. Ogden, UT

Source: DenisTangneyJr / iStock via Getty Images
- 1-yr. change in ATF firearm tracings, 2021-2022: +107.8% (+110)
- ATF firearm tracings by year: 212 in 2022; 102 in 2021
- Change in population, 2021-2022: +0.7% (+644)
- ATF firearm tracings in 2022 adjusted for population: 244.4 per 100,000 people
- ATF firearm tracings in 2021 adjusted for population: 118.5 per 100,000 people
13. Aurora, CO
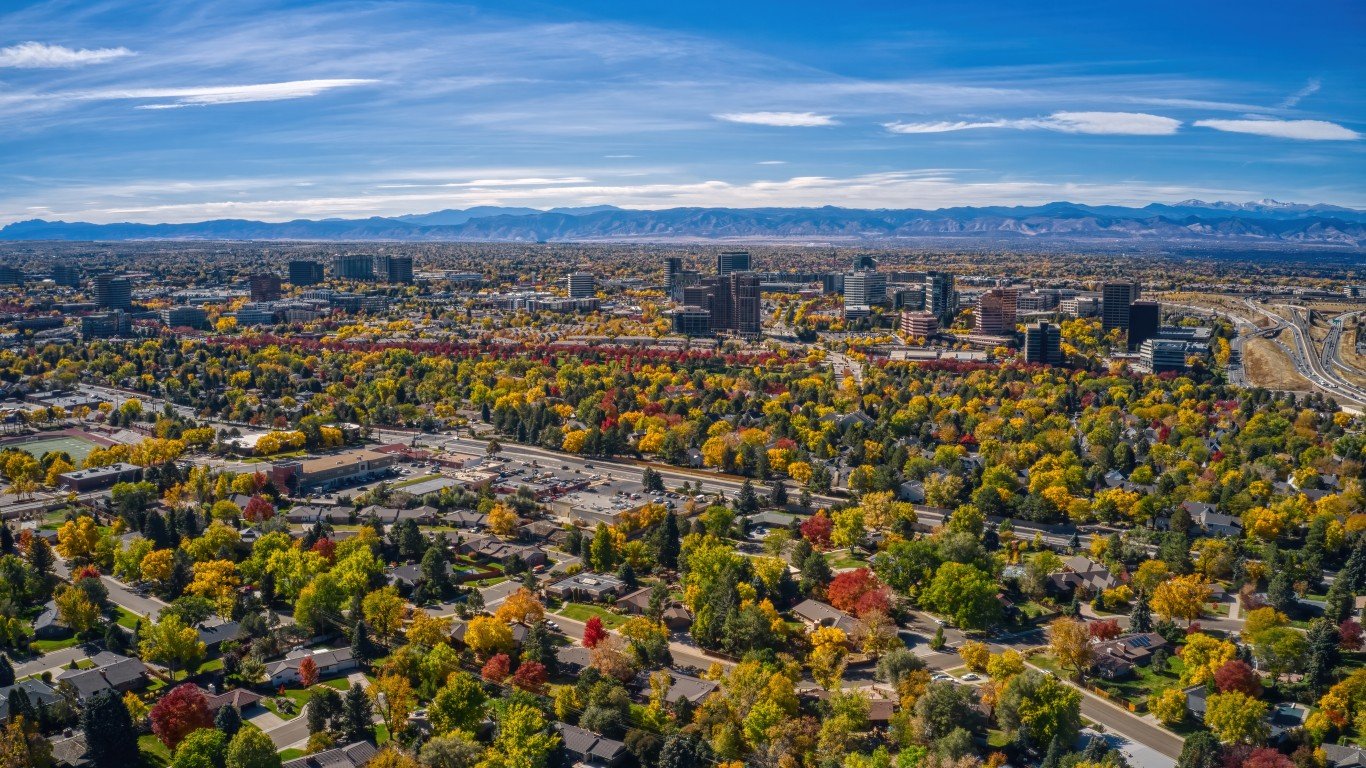
Source: Jacob Boomsma / iStock via Getty Images
- 1-yr. change in ATF firearm tracings, 2021-2022: +113.8% (+272)
- ATF firearm tracings by year: 511 in 2022; 239 in 2021
- Change in population, 2021-2022: +1.0% (+3,853)
- ATF firearm tracings in 2022 adjusted for population: 131.9 per 100,000 people
- ATF firearm tracings in 2021 adjusted for population: 62.3 per 100,000 people
12. Duluth, MN
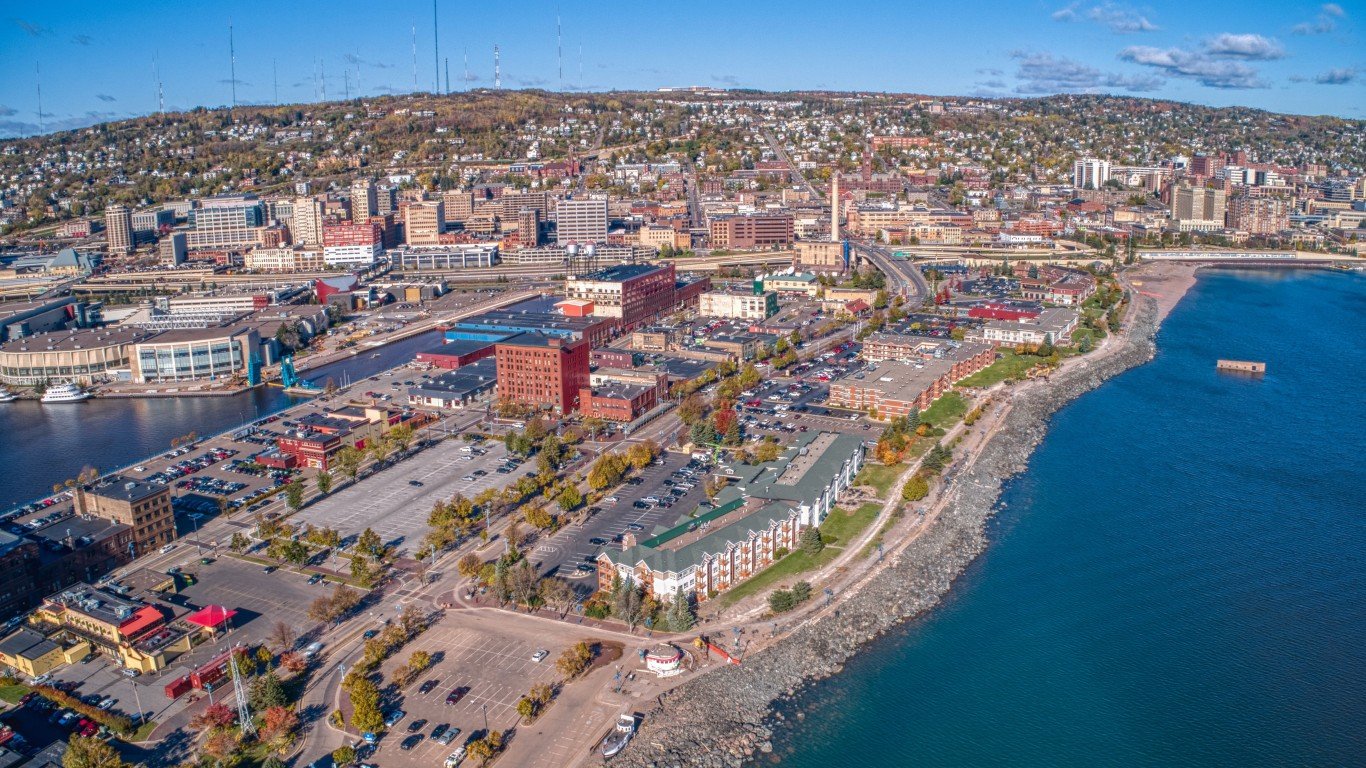
Source: Jacob Boomsma / iStock via Getty Images
- 1-yr. change in ATF firearm tracings, 2021-2022: +114.3% (+80)
- ATF firearm tracings for each year: 150 in 2022; 70 in 2021
- Change in population, 2021-2022: +0.1% (+61)
- ATF firearm tracings in 2022 adjusted for population: 172.9 per 100,000 people
- ATF firearm tracings in 2021 adjusted for population: 80.7 per 100,000 people
11. Wasilla, AK

Source: miracky / iStock via Getty Images
- 1-yr. change in ATF firearm tracings, 2021-2022: +129.4% (+44)
- ATF firearm tracings for each year: 78 in 2022; 34 in 2021
- Change in population, 2021-2022: +1.9% (+169)
- ATF firearm tracings in 2022 adjusted for population: 841.7 per 100,000 people
- ATF firearm tracings in 2021 adjusted for population: 373.7 per 100,000 people
10. Anchorage, AK

Source: John Pennell / iStock via Getty Images
- 1-yr. change in ATF firearm tracings, 2021-2022: +129.5% (+500)
- ATF firearm tracings for each year: 886 in 2022; 386 in 2021
- Change in population, 2021-2022: -0.6% (-1,871)
- ATF firearm tracings in 2022 adjusted for population: 304.8 per 100,000 people
- ATF firearm tracings in 2021 adjusted for population: 131.9 per 100,000 people
9. Honolulu, HI

Source: Aerial view of Hilton Hawaiian Village, Trauma Symposium, Photo Gallery of Lifescience Resources Hawaii July 2013 by Lifescience Resources Photo Gallery / BY 2.0 (https://creativecommons.org/licenses/by/2.0/)
- 1-yr. change in ATF firearm tracings, 2021-2022: +136.7% (+41)
- ATF firearm tracings for each year: 71 in 2022; 30 in 2021
- Change in population, 2021-2022: -0.9% (-3,007)
- ATF firearm tracings in 2022 adjusted for population: 20.4 per 100,000 people
- ATF firearm tracings in 2021 adjusted for population: 8.5 per 100,000 people
8. Lihue, HI

Source: Hotaik Sung / iStock via Getty Images
- 1-yr. change in ATF firearm tracings, 2021-2022: +150.0% (+33)
- ATF firearm tracings for each year: 55 in 2022; 22 in 2021
- Change in population, 2021-2022: +3.3% (+278)
- ATF firearm tracings in 2022 adjusted for population: 635.9 per 100,000 people
- ATF firearm tracings in 2021 adjusted for population: 262.8 per 100,000 people
7. Austin, TX

Source: Jonathan Ross / iStock via Getty Images
- 1-yr. change in ATF firearm tracings, 2021-2022: +156.7% (+1,042)
- ATF firearm tracings for each year: 1,707 in 2022; 665 in 2021
- Change in population, 2021-2022: +1.4% (+13,544)
- ATF firearm tracings in 2022 adjusted for population: 178.1 per 100,000 people
- ATF firearm tracings in 2021 adjusted for population: 70.4 per 100,000 people
6. Sioux City, IA
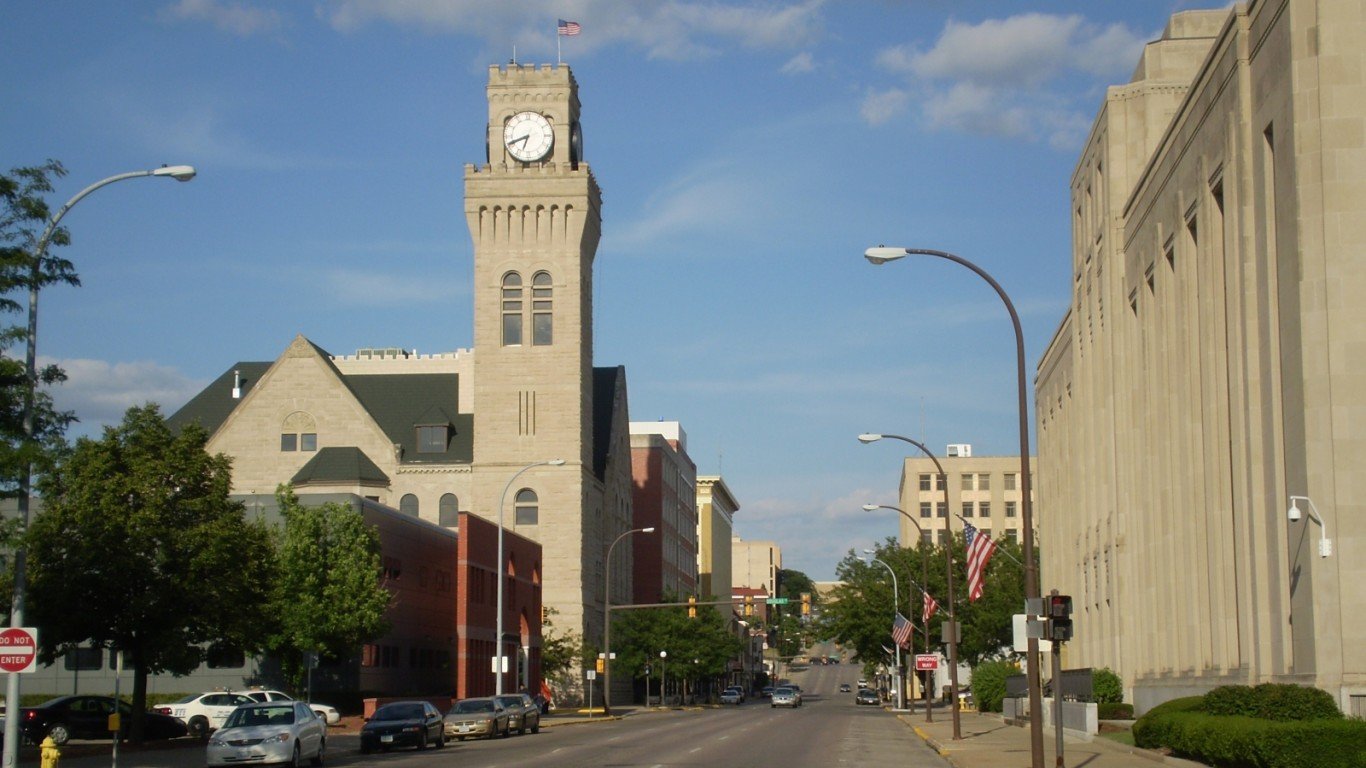
Source: BergmannD / iStock via Getty Images
- 1-yr. change in ATF firearm tracings, 2021-2022: +159.2% (+121)
- ATF firearm tracings for each year: 197 in 2022; 76 in 2021
- Change in population, 2021-2022: +0.5% (+388)
- ATF firearm tracings in 2022 adjusted for population: 230.5 per 100,000 people
- ATF firearm tracings in 2021 adjusted for population: 89.3 per 100,000 people
5. Great Falls, MT

Source: leezsnow / iStock via Getty Images
- 1-yr. change in ATF firearm tracings, 2021-2022: +164.7% (+140)
- ATF firearm tracings for each year: 225 in 2022; 85 in 2021
- Change in population, 2021-2022: -0.01% (-8)
- ATF firearm tracings in 2022 adjusted for population: 372.7 per 100,000 people
- ATF firearm tracings in 2021 adjusted for population: 140.8 per 100,000 people
4. New Britain, CT
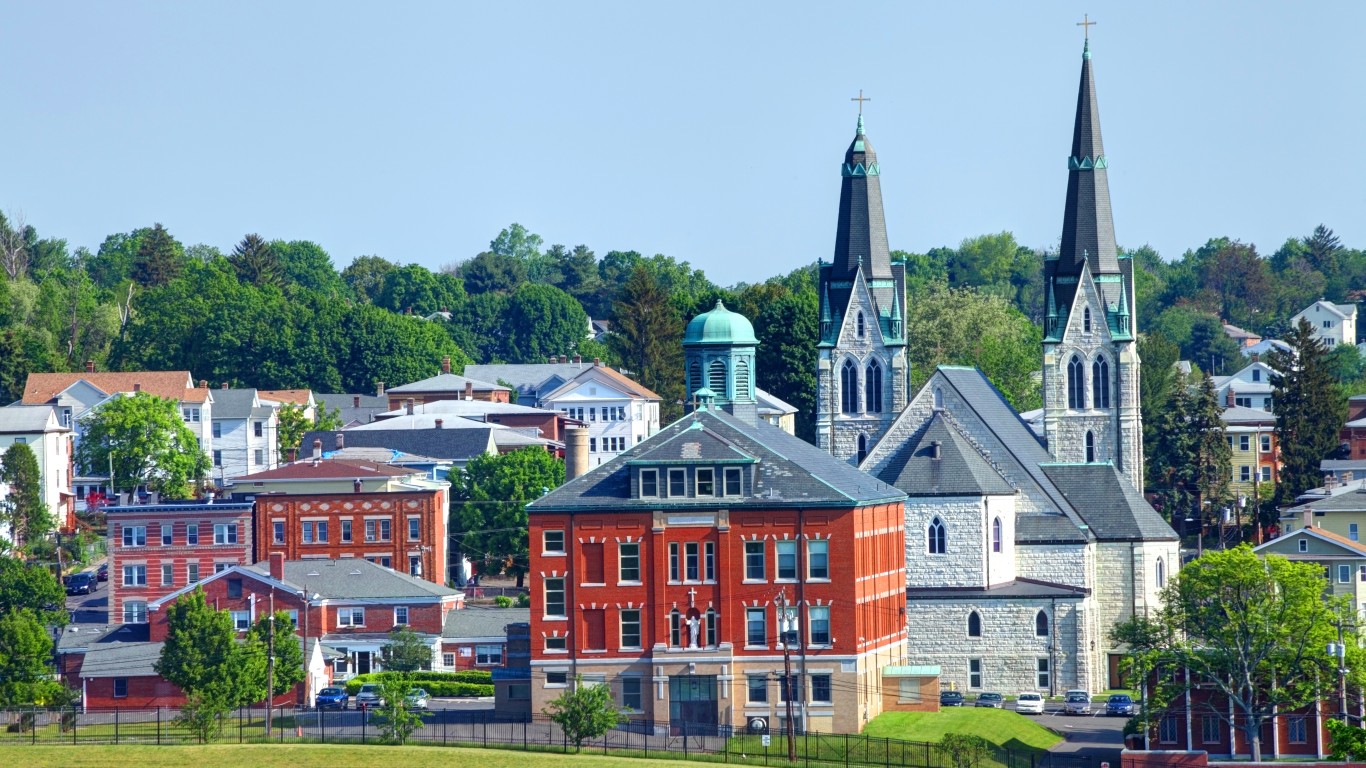
Source: DenisTangneyJr / iStock via Getty Images
- 1-yr. change in ATF firearm tracings, 2021-2022: +165.2% (+114)
- ATF firearm tracings for each year: 183 in 2022; 69 in 2021
- Change in population, 2021-2022: +0.3% (+190)
- ATF firearm tracings in 2022 adjusted for population: 246.6 per 100,000 people
- ATF firearm tracings in 2021 adjusted for population: 93.2 per 100,000 people
3. Farmington, NM
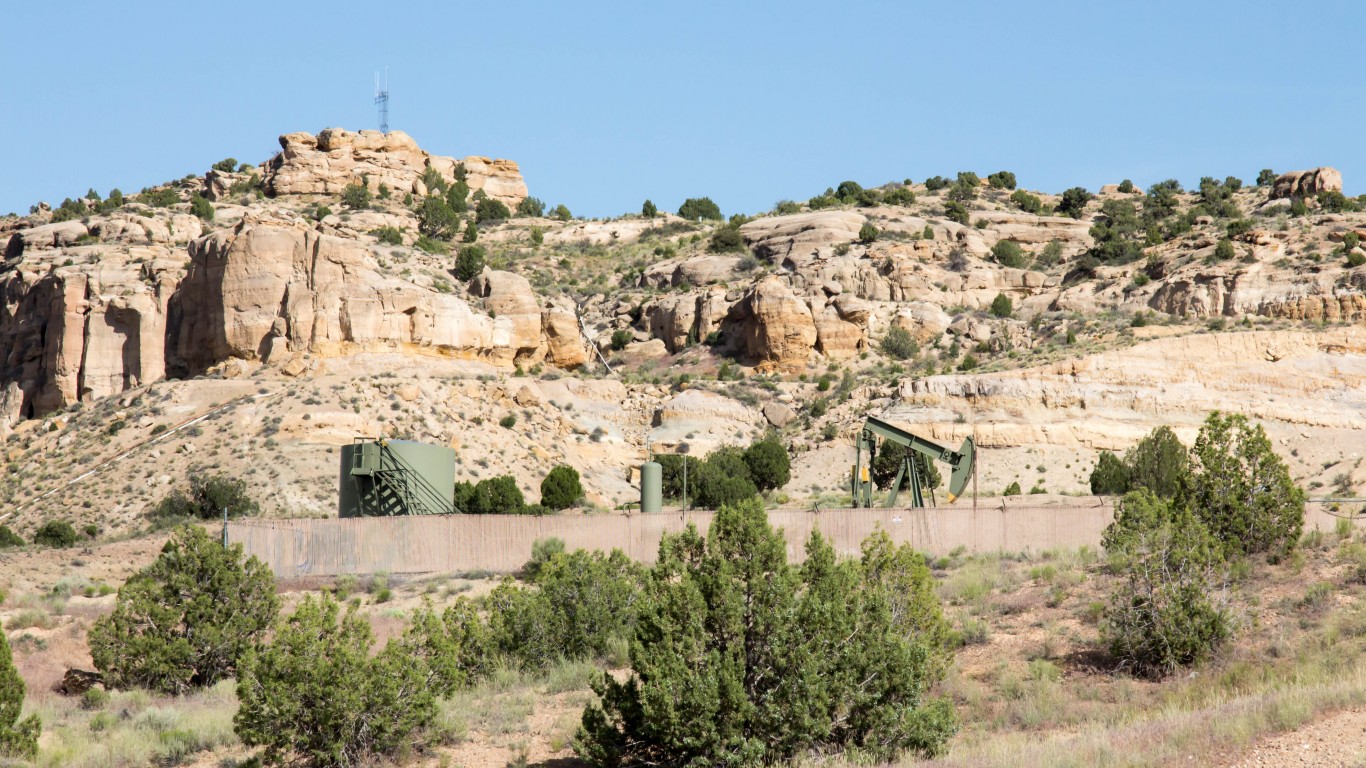
Source: KaraGrubis / iStock via Getty Images
- 1-yr. change in ATF firearm tracings, 2021-2022: +176.9% (+92)
- ATF firearm tracings for each year: 144 in 2022; 52 in 2021
- Change in population, 2021-2022: -0.5% (-239)
- ATF firearm tracings in 2022 adjusted for population: 310.0 per 100,000 people
- ATF firearm tracings in 2021 adjusted for population: 111.4 per 100,000 people
2. Fort Worth, TX
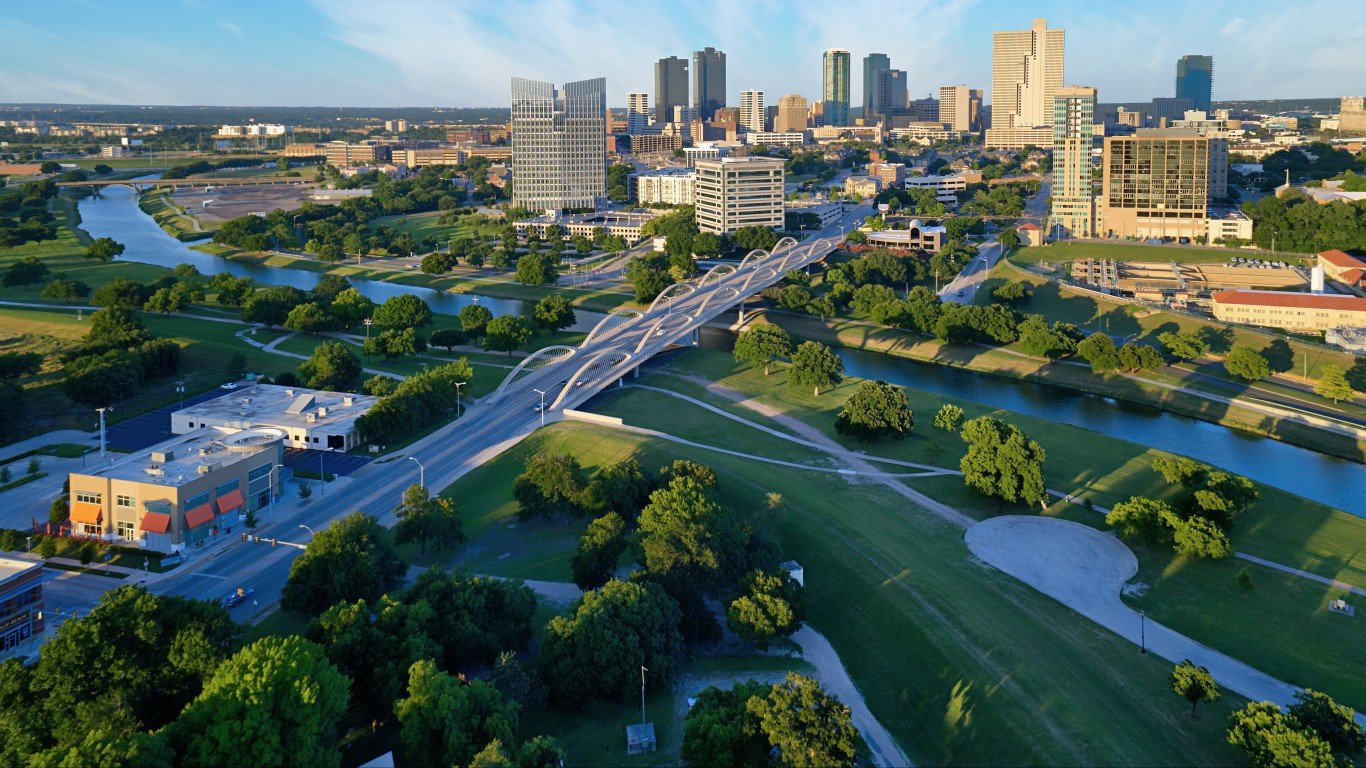
Source: Barbara Smyers / iStock via Getty Images
- 1-yr. change in ATF firearm tracings, 2021-2022: +274.3% (+1,975)
- ATF firearm tracings for each year: 2,695 in 2022; 720 in 2021
- Change in population, 2021-2022: +1.8% (+16,194)
- ATF firearm tracings in 2022 adjusted for population: 291.5 per 100,000 people
- ATF firearm tracings in 2021 adjusted for population: 79.3 per 100,000 people
1. Montgomery, AL

Source: Sean Pavone / iStock via Getty Images
- 1-yr. change in ATF firearm tracings, 2021-2022: +317.0% (+596)
- ATF firearm tracings for each year: 784 in 2022; 188 in 2021
- Change in population, 2021-2022: -0.6% (-1,203)
- ATF firearm tracings in 2022 adjusted for population: 392.4 per 100,000 people
- ATF firearm tracings in 2021 adjusted for population: 93.5 per 100,000 people
Want to Retire Early? Start Here (Sponsor)
Want retirement to come a few years earlier than you’d planned? Or are you ready to retire now, but want an extra set of eyes on your finances?
Now you can speak with up to 3 financial experts in your area for FREE. By simply clicking here you can begin to match with financial professionals who can help you build your plan to retire early. And the best part? The first conversation with them is free.
Click here to match with up to 3 financial pros who would be excited to help you make financial decisions.
Thank you for reading! Have some feedback for us?
Contact the 24/7 Wall St. editorial team.
Editors' Picks