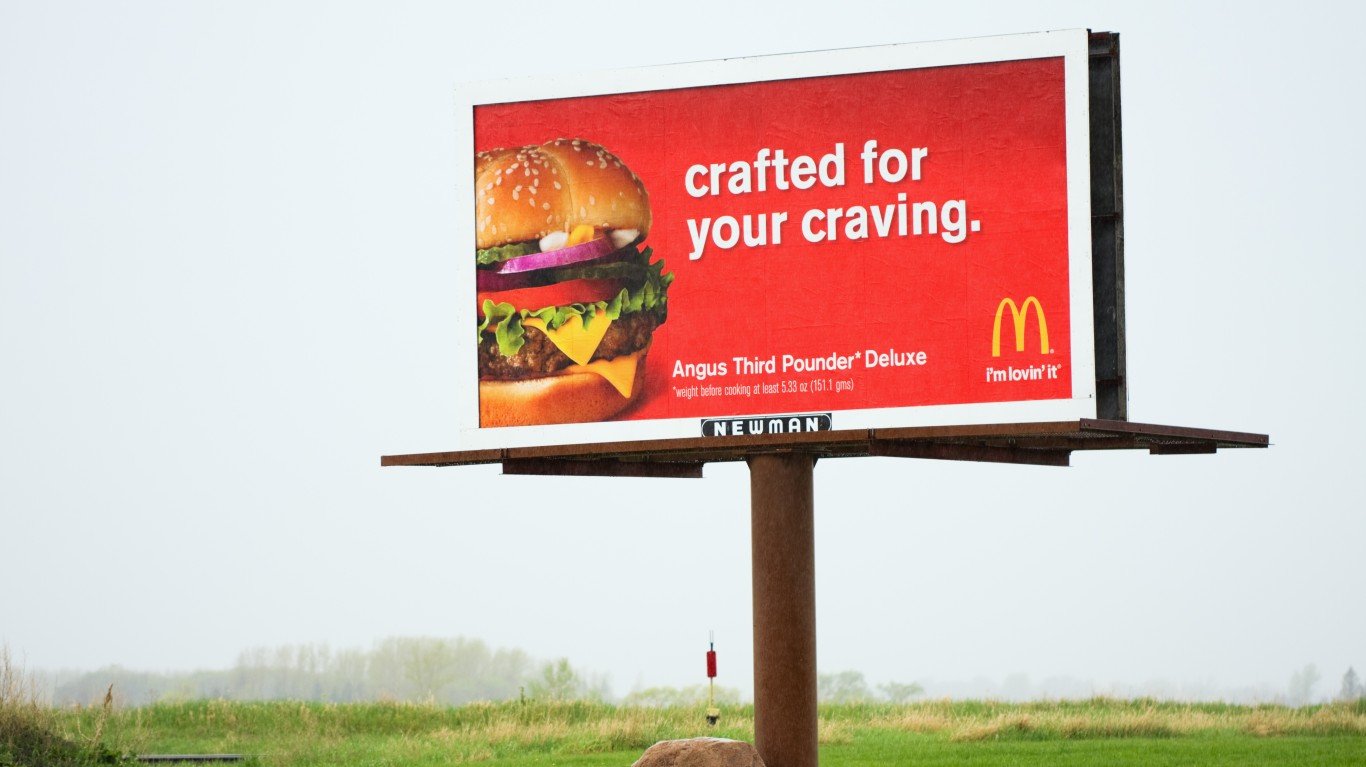
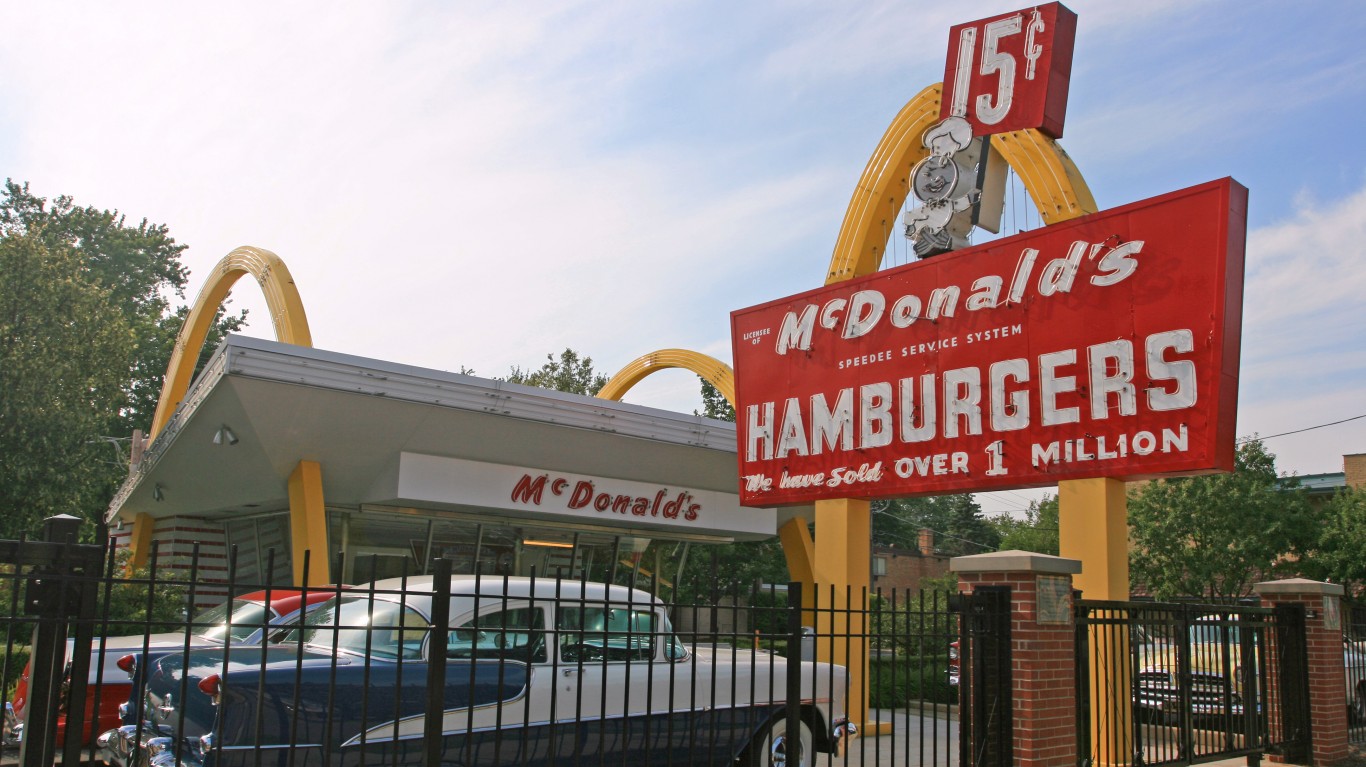
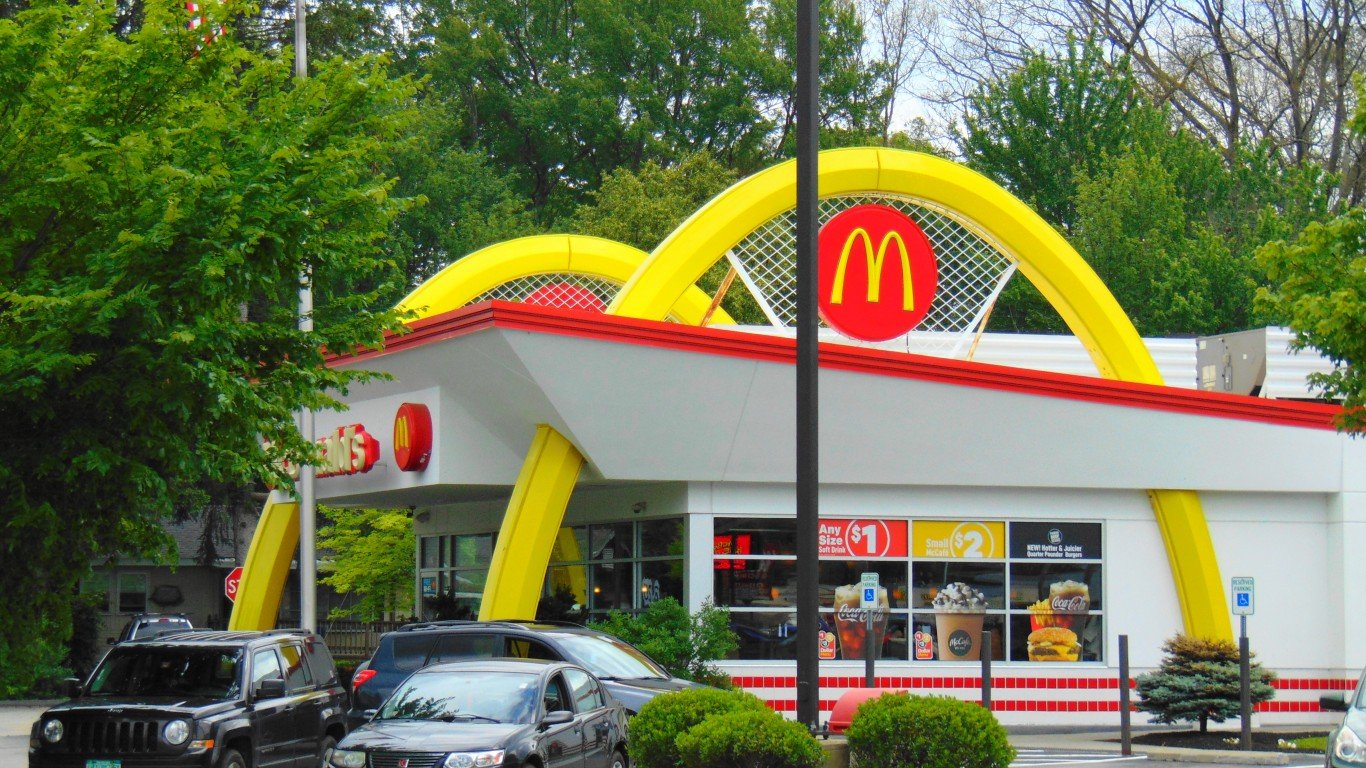
The United States has had stronger-than-expected growth, leading the World Bank to upgrade its outlook on the global economy this June. America’s economy is the world’s biggest, comprising 80% of the World Bank’s outlook. The deputy chief economist stated, “U.S. growth is exceptional.” There are many ways to measure the factors that impact the global, national, and local economies of the world. One such litmus test, albeit unconventional and steeped in pop culture, is the Big Mac Index, published by the Economist magazine. The magazine uses Big Mac prices to approximate the cost of living, or purchasing power, in countries worldwide. When it debuted in 1967, the Big Mac cost 45 cents, equivalent to $3.95 today, but the current average price is $5.17. These days, the sandwich’s price in the US varies considerably from state to state.
A Big Mac is supposed to taste the same regardless of where you are, but the same can’t be said for the price, which varies dramatically by location. Prices in each state range from $4.19 to $7.09, while the “true cost” of a Big Mac — after adjusting for income, taxes, and cost of living — ranges from $3.44 to $6.54. This “true cost” is highest in the East Coast states of Maine, Rhode Island, Massachusetts, and Vermont, as well as the Southern states of Arkansas and Mississippi, two of the poorer states in the Union.
To identify the “true cost” of a Big Mac in each state, 24/7 Wall St. adjusted the average price by the state’s disposable income per capita (income after taxes) and cost of living (based on regional price parities.) In other words, considering income, taxes, cost of living, and actual Big Mac price in each state — we calculated the true cost for residents living in that state. The 50 states were then ranked by the “true cost” of a Big Mac.
The prices for each state and the national average price of $5.17 came from Zippia’s How Much A Big Mac Costs In Every State and are as of August 2023. Disposable income per capita figures, which are income per capita figures after taxes, are for 2022 and came from the Bureau of Labor Statistics. The national per capita disposable income was $55,832 that year. Regional price parities for 2021, which express the cost of living in the state, are from the Bureau of Economic Analysis. Population data came from the Census Bureau’s 2022 American Community Survey. We should note the idea came from Pantry and Larder, though we took a different approach.
Why Are We Writing About the Big Mac?
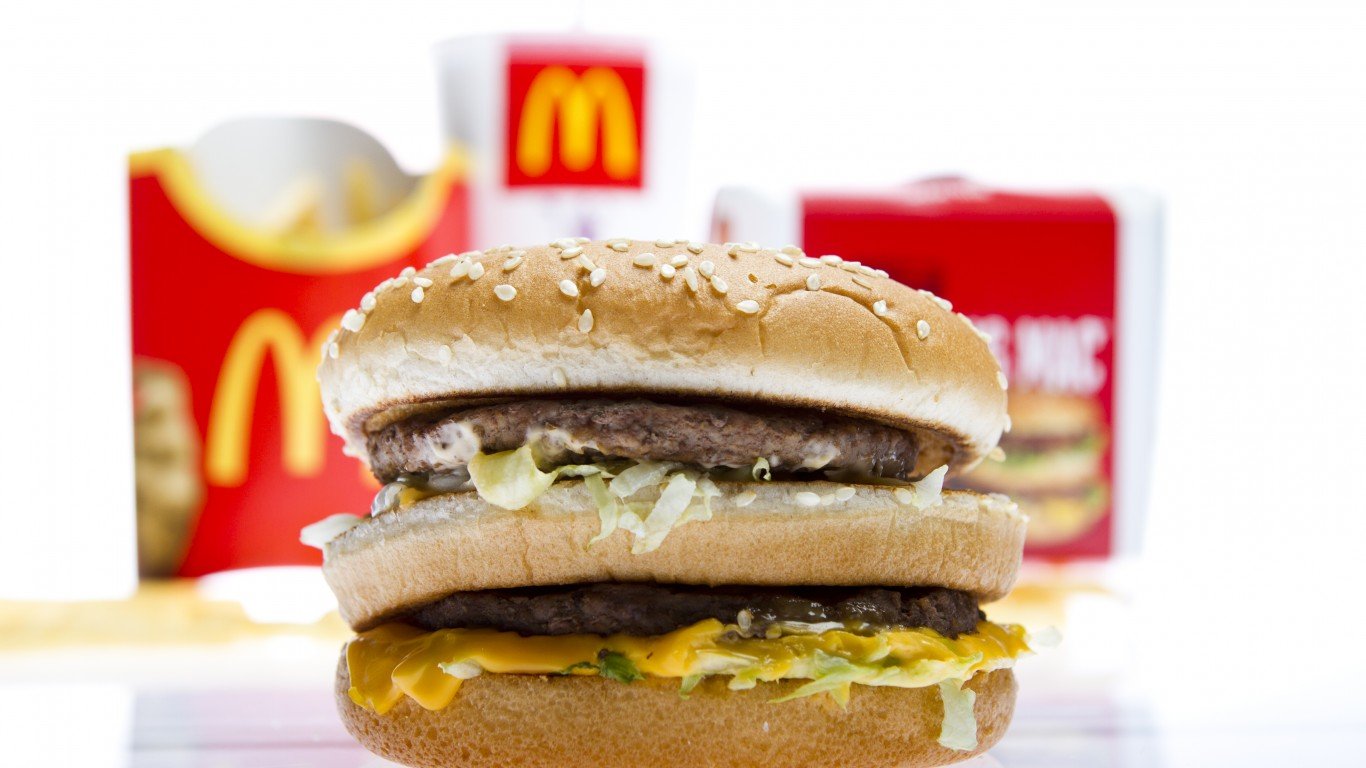
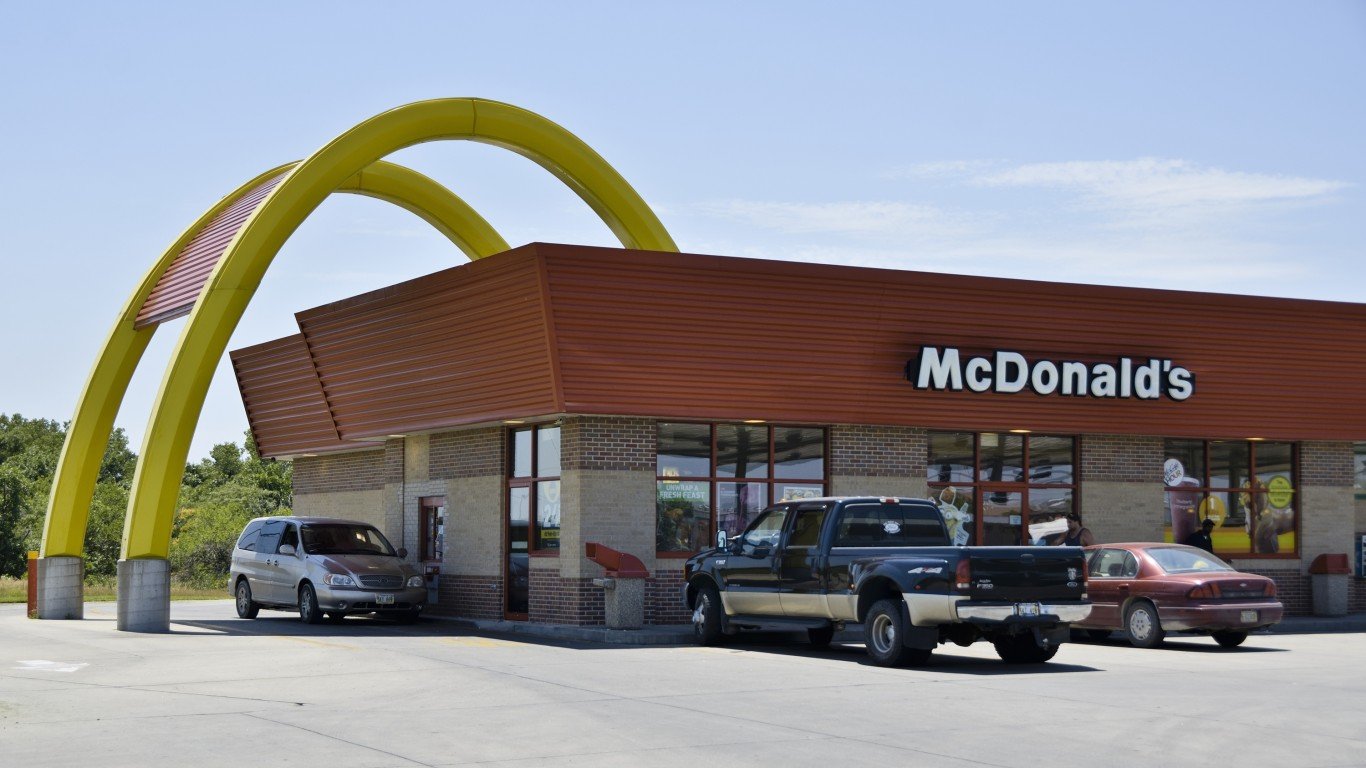
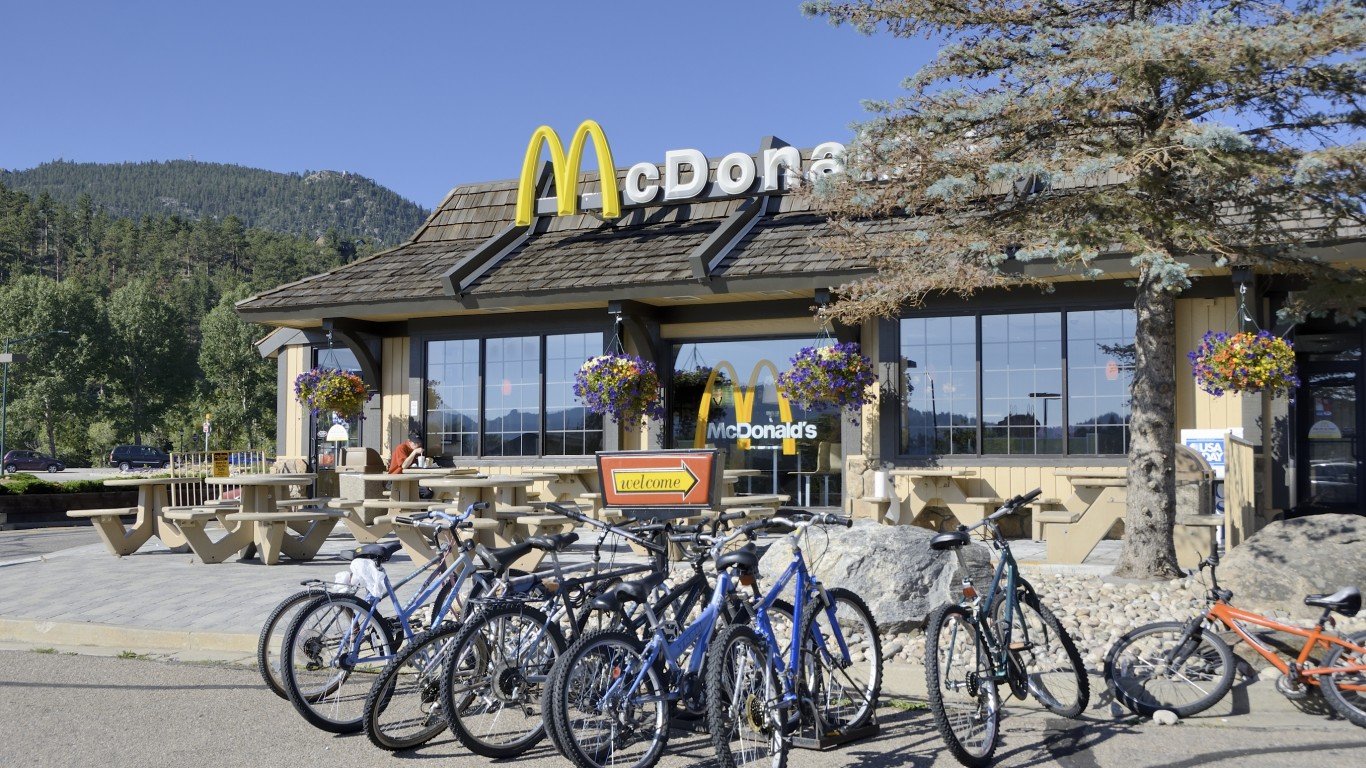
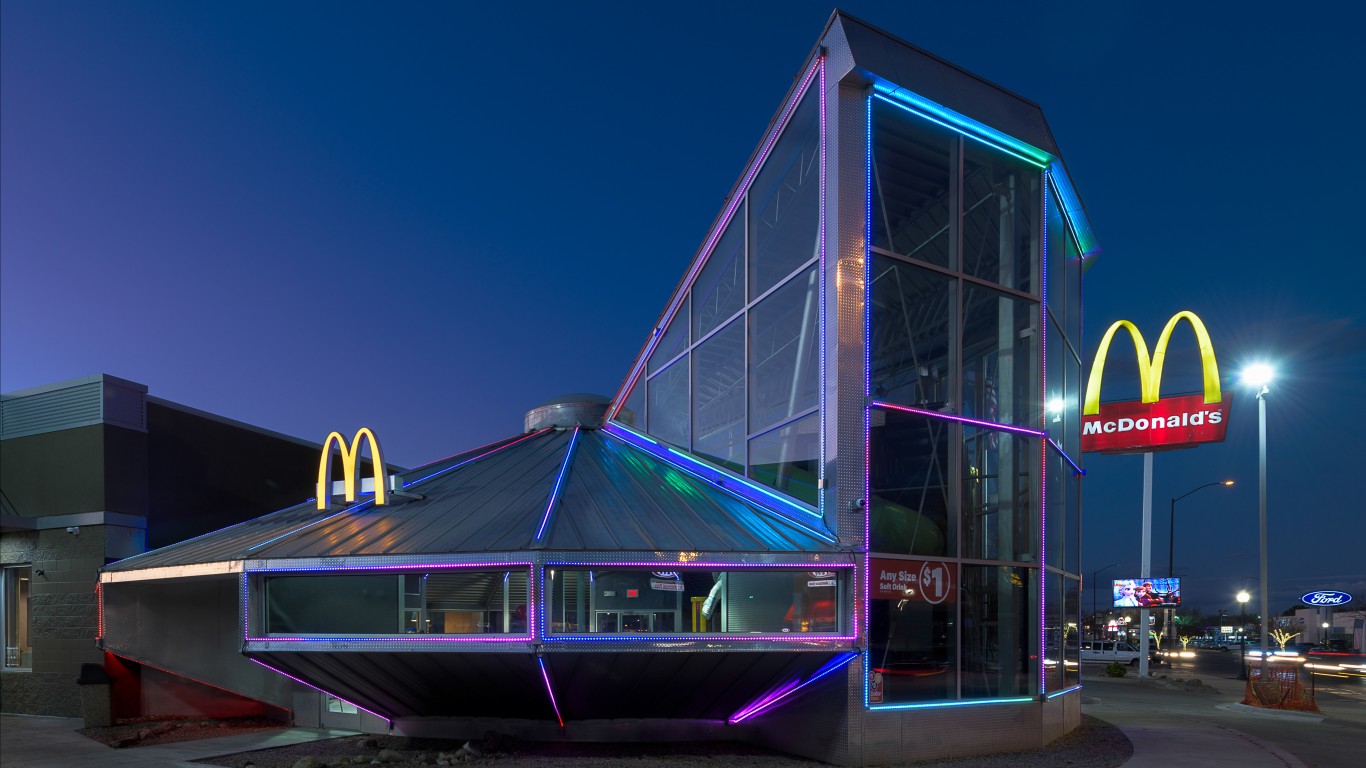
Source: spflaum1 / iStock Editorial via Getty Images
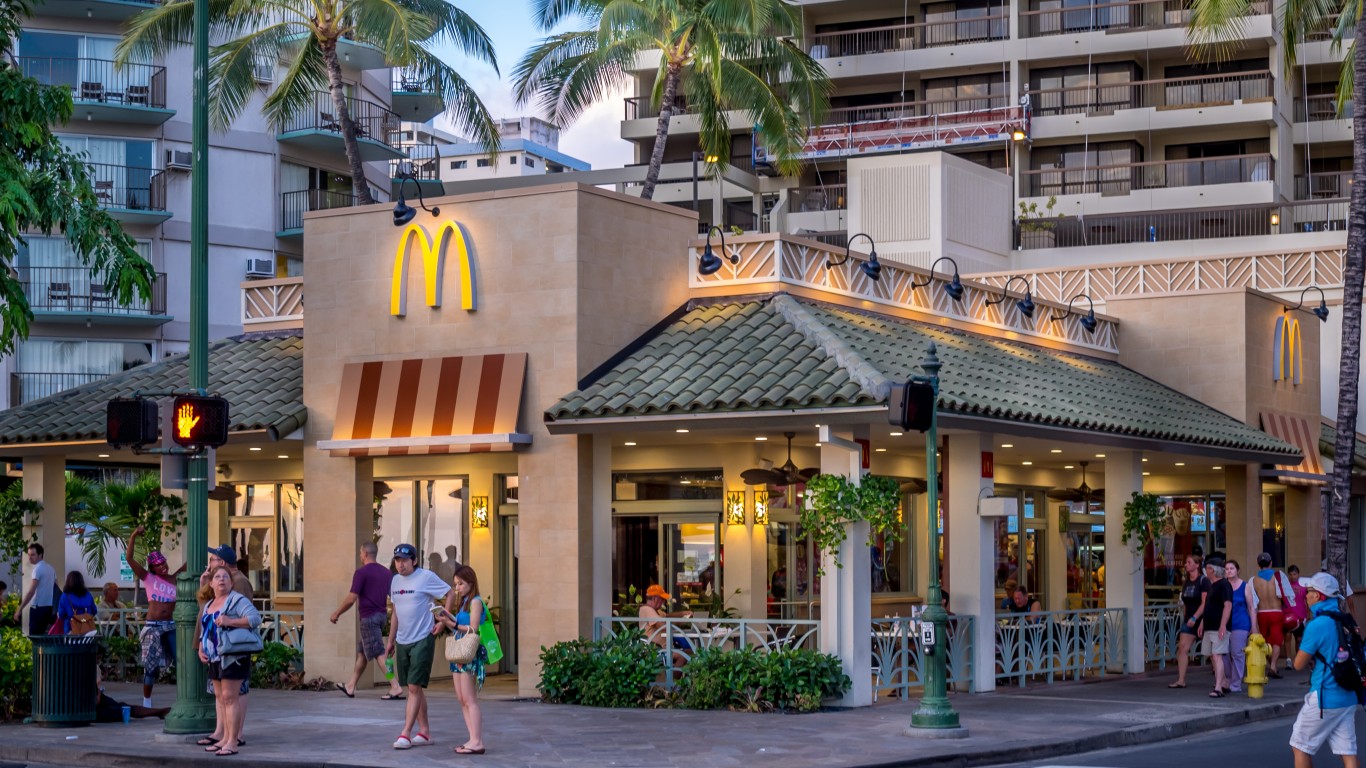
The Big Mac index is just one of many ways economists assess the different factors that impact an “everyday” person and how much money they have to spend. Since its opening in April 1955, McDonald’s has reigned supreme worldwide. With around 40,275 locations around the globe, it’s easy to see how many menu items are increasingly popular. The Big Mac was first introduced in 1967, and this popular burger has come a long way since. It is estimated that 900 million are sold annually globally, and 550 million are sold in the US alone.
Here are the states where a Big Mac is unaffordable.
50. Wyoming
Source: RiverNorthPhotography / iStock Unreleased via Getty Images
The population in Wyoming in 2022 was 581,381 people. Their cost of living in 2021 was 8.6% lower than the national average, making them the 14th lowest state in the nation. Wyoming’s 2022 disposable income reached $62,227, which is 11.5% higher than the national average, ranking them the 9th highest in the country. The actual price of a Big Mac in August 2023 was $4.19, 19.0% lower than the national average price, placing them as the 2nd lowest. The “true cost” of a Big Mac with all of these numbers considered is $3.44.
49. South Dakota
Source: peeterv / iStock via Getty Images
The “true” cost of a Big Mac in South Dakota is $3.83. South Dakota had a population of 909,824 in 2022, with the cost of living (2021) 9.9% lower than the national average, placing them the 7th lowest in the nation. Their 2022 disposable income was $59,688, 6.9% higher than the national average, ranking them the 11th highest in the country. The actual price of a Big Mac in South Dakota in August 2023 was $4.54, 12.2% lower than the national average price, making them the 12th lowest.
48. Nebraska
Source: RiverNorthPhotography / iStock Unreleased via Getty Images
Nebraska had a 2022 population of 1,967,923, with the cost of living (2021) 8.2% than the national average, placing them at the 16th lowest in the nation. With a disposable income of $55,766, rating it 0.1% lower than the national average and making it the 19th highest in the country, the “true cost” of a Big Mac, with all things considered, is $3.94. The actual cost of a Big Mac in Nebraska in August 2023 was $4.29, 17.0% lower than the national average price, ranking them as the 6th lowest.
47. Pennsylvania
Source: bgwalker / iStock Unreleased via Getty Images
The population in Pennsylvania in 2022 was 12,972,008 people. Their cost of living in 2021 was 3.6% lower than the national average, making them the 23rd highest state in the nation. Pennsylvania’s 2022 disposable income reached $56,034, which is 0.4% higher than the national average, ranking it the 18th highest in the country. The actual price of a Big Mac in August 2023 was $4.29, 17.0% lower than the national average price, placing them as the 6th lowest. The “true cost” of a Big Mac, with all of these numbers considered, is $4.12.
46. Washington
Source: Colleen Michaels / iStock Editorial via Getty Images
The “true” cost of a Big Mac in Washington is $4.19. Washington had a population of 7,785,786 in 2022, with the cost of living (2021) 8.9% higher than the national average, placing them the 5th highest in the nation. Their 2022 disposable income was $65,210, 16.8% higher than the national average, ranking them the 4th highest in the country. The actual price of a Big Mac in Washington in August 2023 was $4.49, 13.2% lower than the national average price, making them the 11th lowest.
45. Kansas
Source: tupungato / iStock Editorial via Getty Images
Kansas had a 2022 population of 2,937,150, with the cost of living (2021) 8.8% lower than the national average, placing them at the 12th lowest in the nation. With a disposable income of $52,484, rating it 6.0% lower than the national average and making it the 23rd lowest in the country, the “true cost” of a Big Mac, with all things considered, is $4.35. The actual cost of a Big Mac in Kansas in August 2023 was $4.49, 13.2% lower than the national average price, ranking them as the 11th lowest.
44. Ohio
Source: cak757 / Flickr
The population of Ohio in 2022 was 11,756,058 people. Their cost of living in 2021 was 7.5% lower than the national average, making them the 19th lowest state in the nation. Ohio’s 2022 disposable income reached $50,577, which is 9.4% higher than the national average, ranking it the 18th lowest in the country. The actual price of a Big Mac in August 2023 was $4.29, 17.0% lower than the national average price, placing them as the 6th lowest. The “true cost” of a Big Mac, with all of these numbers considered, is $4.38.
43. North Carolina
Source: RiverNorthPhotography / iStock Unreleased via Getty Images
The “true” cost of a Big Mac in North Carolina is $4.41. North Carolina had a population of 10,698,973 in 2022, with the cost of living (2021) 6.2% lower than the national average, placing them the 23rd lowest in the nation. Their 2022 disposable income was $49,728, 10.9% lower than the national average, ranking them the 16th lowest in the country. The actual price of a Big Mac in North Carolina in August 2023 was $4.19, 19.0% lower than the national average price, making them the 2nd lowest.
42. Florida
Source: M. Suhail / iStock Editorial via Getty Images
Florida had a 2022 population of 22,244,823, with the cost of living (2021) 1.4% higher than the national average, placing them at the 15th highest in the nation. With a disposable income of $54,596, rating it 2.2% higher than the national average and making it the 21st highest in the country, the “true cost” of a Big Mac, with all things considered, is $4.45. The actual cost of a Big Mac in Florida in August 2023 was $4.29, 17.0% lower than the national average price, ranking them as the 6th lowest.
41. Indiana
Source: valeriebb / Flickr
The population of Indiana in 2022 was 6,833,037 people. Their cost of living in 2021 was 7.3% lower than the national average, making them the 20th lowest state in the nation. Indiana’s 2022 disposable income reached $50,796, which is 9.0% lower than the national average, ranking it the 19th lowest in the country. The actual price of a Big Mac in August 2023 was $4.40, 14.9% lower than the national average price, placing them as the 8th lowest. The “true cost” of a Big Mac, with all of these numbers considered, is $4.48.
40. Iowa
Source: RiverNorthPhotography / iStock Unreleased via Getty Images
The “true” cost of a Big Mac in Iowa is $4.50. Iowa had a population of 3,200,517 in 2022, with the cost of living (2021) 10.4% lower than the national average, placing it as the 5th lowest in the nation. Their 2022 disposable income was $52,071, 6.7% lower than the national average, ranking them the 20th lowest in the country. The actual price of a Big Mac in Iowa in August 2023 was $4.69, 9.3% lower than the national average price, making them the 17th lowest.
39. Wisconsin
Source: spflaum1 / iStock Editorial via Getty Images
Wisconsin had a 2022 population of 5,892,539, with the cost of living (2021) 6.7% lower than the national average, placing them at the 21st lowest in the nation. With a disposable income of $53,062, rating it 5.0% lower than the national average and making it the 25th lowest in the country, the “true cost” of a Big Mac, with all things considered, is $4.51. The actual cost of a Big Mac in Wisconsin in August 2023 was $4.59, 11.2% lower than the national average price, ranking them as the 13th lowest.
38. Nevada
Source: RiverNorthPhotography / iStock Unreleased via Getty Images
The population of Nevada in 2022 was 3,177,772 people. Their cost of living in 2021 was 4.5% lower than the national average, making them the 25th highest state in the nation. Nevada’s 2022 disposable income reached $53,076, which is 4.9% lower than the national average, ranking it the 12th lowest in the country. The actual price of a Big Mac in August 2023 was $4.49, 13.2% lower than the national average price, placing them as the 11th lowest. The “true cost” of a Big Mac, with all of these numbers considered, is $4.51.
37. Minnesota
Source: skhoward / iStock Unreleased via Getty Images
The “true” cost of a Big Mac in Minnesota is $4.60. Minnesota had a population of 5,717,184 in 2022, with the cost of living (2021) 1.6% lower than the national average, placing it as the 19th highest in the nation. Their 2022 disposable income was $57,359, 2.7% higher than the national average, ranking them the 16th highest in the country. The actual price of a Big Mac in Minnesota in August 2023 was $4.80, 7.2% lower than the national average price, making them the 21st lowest.
36. Utah
Source: RiverNorthPhotography / iStock Unreleased via Getty Images
Utah had a 2022 population of 3,380,800, with the cost of living (2021) 5.4% lower than the national average, placing them at the 25th lowest in the nation. With a disposable income of $49,632, rating it 11.1% lower than the national average and making it the 15th lowest in the country, the “true cost” of a Big Mac, with all things considered, is $4.67. The actual cost of a Big Mac in Utah in August 2023 was $4.39, 15.1% lower than the national average price, ranking them as the 7th lowest.
35. North Dakota
Source: DenisTangneyJr / E+ via Getty Images
The population of North Dakota in 2022 was 779,261 people. Their cost of living in 2021 was 8.9% lower than the national average, making them the 11th lowest state in the nation. North Dakota’s 2022 disposable income reached $58,659, which is 5.1% higher than the national average, ranking it the 13th highest in the country. The actual price of a Big Mac in August 2023 was $5.39, 4.3% higher than the national average price, placing them as the 17th highest. The “true cost” of a Big Mac, with all of these numbers considered, is $4.67.
34. Oklahoma
Source: angstdei / Flickr
The “true” cost of a Big Mac in Oklahoma is $4.79. Oklahoma had a population of 4,019,800 in 2022, with the cost of living (2021) 9.7% lower than the national average, placing it as the 18th lowest in the nation. Their 2022 disposable income was $49,398, 11.5% higher than the national average, ranking them the 12th lowest in the country. The actual price of a Big Mac in Oklahoma in August 2023 was $4.69, 9.3% lower than the national average price, making them the 17th lowest.
33. Louisiana
Source: sfe-co2 / iStock Editorial via Getty Images
Louisiana had a 2022 population of 4,590,241, with the cost of living (2021) 8.7% lower than the national average, placing them at the 13th lowest in the nation. With a disposable income of $48,882, rating it 12.4% lower than the national average and making it the 9th lowest in the country, the “true cost” of a Big Mac, with all things considered, is $4.89. The actual cost of a Big Mac in Louisiana in August 2023 was $4.69, 9.3% lower than the national average price, ranking them as the 17th lowest.
32. Virginia
Source: Alexandre Tziripouloff / iStock Editorial via Getty Images
The population of Virginia in 2022 was 8,683,619 people. Their cost of living in 2021 was 2.3% higher than the national average, making them the 13th highest state in the nation. Virginia’s 2022 disposable income reached $57,789, which is 3.5% higher than the national average, ranking it the 15th highest in the country. The actual price of a Big Mac in August 2023 was $4.99, 3.5% lower than the national average price, placing them as the 24th highest. The “true cost” of a Big Mac, with all of these numbers considered, is $4.93.
31. Tennessee
Source: jjbers / Flickr
The “true” cost of a Big Mac in Tennessee is $4.94. Tennessee had a population of 7,051,339 in 2022, with the cost of living (2021) 9.1% lower than the national average, placing it as the 10th lowest in the nation. Their 2022 disposable income was $52,262, 6.4% lower than the national average, ranking them the 22nd lowest in the country. The actual price of a Big Mac in Tennessee in August 2023 was $5.09, 1.5% lower than the national average price, making them the 25th highest.
30. Connecticut
Source: carminesalvatore / iStock Editorial via Getty Images
Connecticut had a 2022 population of 3,626,205, with the cost of living (2021) 2.6% higher than the national average, placing them at the 11th highest in the nation. With a disposable income of $69,247 rating it 24.0% higher than the national average and making it the 6th highest in the country, the “true cost” of a Big Mac, with all things considered, is $5.04. The actual cost of a Big Mac in Connecticut in August 2023 was $6.09, 17.8% higher than the national average price, ranking them as the 6th highest.
29. Kentucky
Source: JerryGrugin / iStock Editorial via Getty Images
The population of Kentucky in 2022 was 4,512,310 people. Their cost of living in 2021 was 10.9% lower than the national average, making them the 3rd lowest state in the nation. Kentucky’s 2022 disposable income reached $46,016, which is 17.6% lower than the national average, ranking it the 4th lowest in the country. The actual price of a Big Mac in August 2023 was $4.69, 9.3% lower than the national average price, placing them as the 17th lowest. The “true cost” of a Big Mac, with all of these numbers considered, is $5.07.
28. Michigan
Source: RiverNorthPhotography / iStock Unreleased via Getty Images
The “true” cost of a Big Mac in Michigan is $5.12. Michigan had a population of 10,034,118 in 2022, with the cost of living (2021) 5.7% lower than the national average, placing it as the 24th lowest in the nation. Their 2022 disposable income was $49,254, 11.8% lower than the national average, ranking them the 10th lowest in the country. The actual price of a Big Mac in Michigan in August 2023 was $4.79, 7.4% lower than the national average price, making them the 20th lowest.
27. New York
Source: wallix / iStock Editorial via Getty Images
New York had a 2022 population of 19,677,151, with the cost of living (2021) 9.5% higher than the national average, placing them at the 3rd highest in the nation. With a disposable income of $63,118, rating it 13.0% higher than the national average and making it the 7th highest in the country, the “true cost” of a Big Mac, with all things considered, is $5.12. The actual cost of a Big Mac in New York in August 2023 was $5.29, 2.3% higher than the national average price, ranking them as the 21st highest.
26. Alabama
Source: toddmedia / iStock Unreleased via Getty Images
The population of Alabama in 2022 was 5,074,296 people. Their cost of living in 2021 was 11.9% lower than the national average, making them the 2nd lowest state in the nation. Alabama’s 2022 disposable income reached $45,079, which is 19.3% lower than the national average, ranking it the 3rd lowest in the country. The actual price of a Big Mac in August 2023 was $4.70, 9.1% lower than the national average price, placing them as the 18th lowest. The “true cost” of a Big Mac, with all of these numbers considered, is $5.13.
25. Maryland
Source: mdgovpics / Flickr
The “true” cost of a Big Mac in Maryland is $5.19. Maryland had a population of 6,164,660 in 2022, with the cost of living (2021) 6.2% higher than the national average, placing it as the 7th highest in the nation. Their 2022 disposable income was $59,307, 6.2% higher than the national average, ranking them the 7th highest in the country. The actual price of a Big Mac in Maryland in August 2023 was $5.19, 0.4% higher than the national average price, making them the 22nd highest.
24. Colorado
Source: RiverNorthPhotography / iStock Unreleased via Getty Images
Colorado had a 2022 population of 5,839,926, with the cost of living (2021) 3.0% higher than the national average, placing them at the 10th highest in the nation. With a disposable income of $62,984, rating it 12.8% higher than the national average and making it the 8th highest in the country, the “true cost” of a Big Mac, with all things considered, is $5.20. The actual cost of a Big Mac in Colorado in August 2023 was $5.69, 10.1% higher than the national average price, ranking them as the 11th highest.
23. Montana
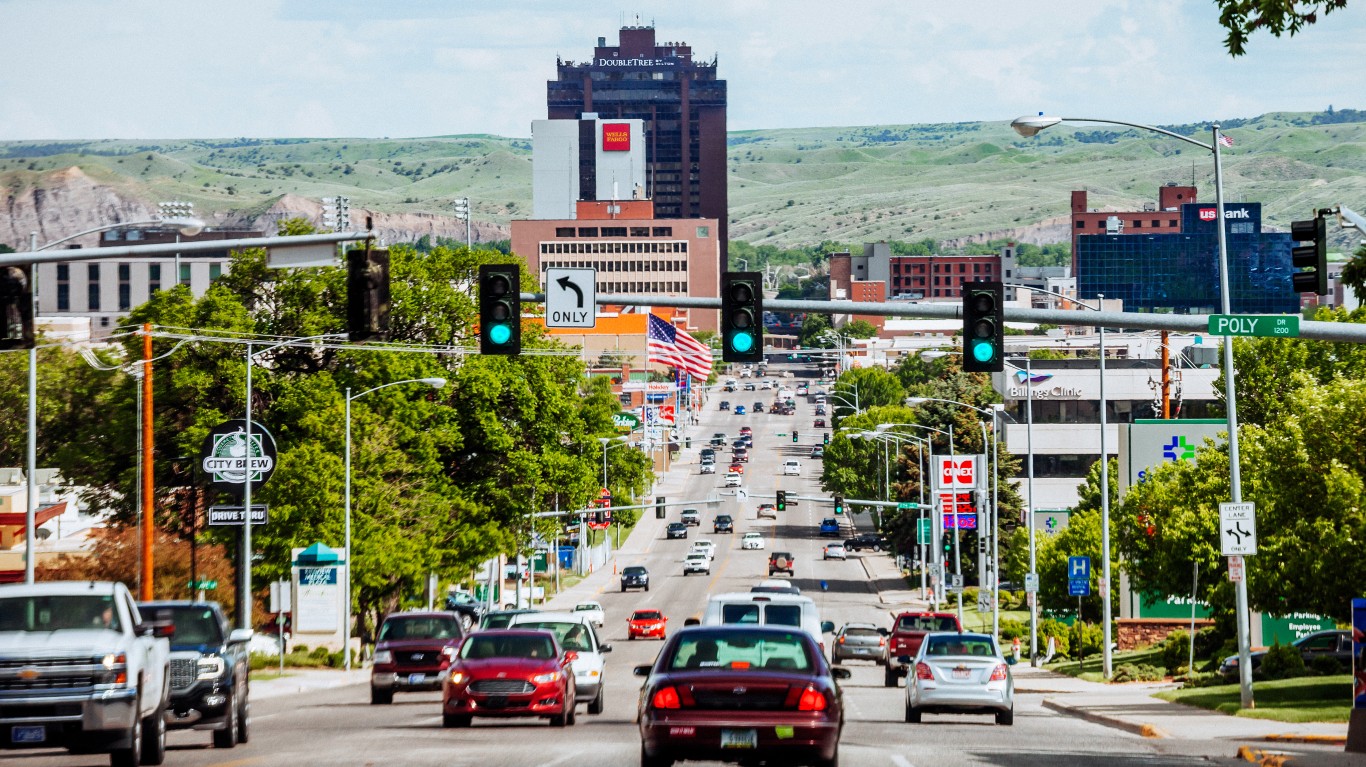
Source: peeterv / iStock via Getty Images
The population of Montana in 2022 was 1,122,867 people. Their cost of living in 2021 was 8.4% lower than the national average, making them the 15th lowest state in the nation. Montana’s 2022 disposable income reached $49,936, which is 10.6% lower than the national average, ranking it the 17th lowest in the country. The actual price of a Big Mac in August 2023 was $5.19, 0.4% higher than the national average price, placing them as the 22nd highest. The “true cost” of a Big Mac, with all of these numbers considered, is $5.31.
22. New Jersey

Source: SeanPavonePhoto / iStock via Getty Images
The “true” cost of a Big Mac in New Jersey is $5.36. New Jersey had a population of 9,261,699 in 2022, with the cost of living (2021) 9.1% higher than the national average, placing it as the 4th highest in the nation. Their 2022 disposable income was $65,844, 17.9% higher than the national average, ranking them the 3rd highest in the country. The actual price of a Big Mac in New Jersey in August 2023 was $5.79, 12.0% higher than the national average price, making them the 10th highest.
21. Oregon
Source: hapabapa / iStock Editorial via Getty Images
Oregon had a 2022 population of 4,240,137, with the cost of living (2021) 3.0% higher than the national average, placing them at the 23rd highest in the nation. With a disposable income of $53,361, rating it 4.4% lower than the national average and making it 23rd highest in the country, the “true cost” of a Big Mac, with all things considered, is $5.39. The actual cost of a Big Mac in Oregon in August 2023 was $5.00, 3.3% lower than the national average price, ranking them as the 25th lowest.
20. Texas
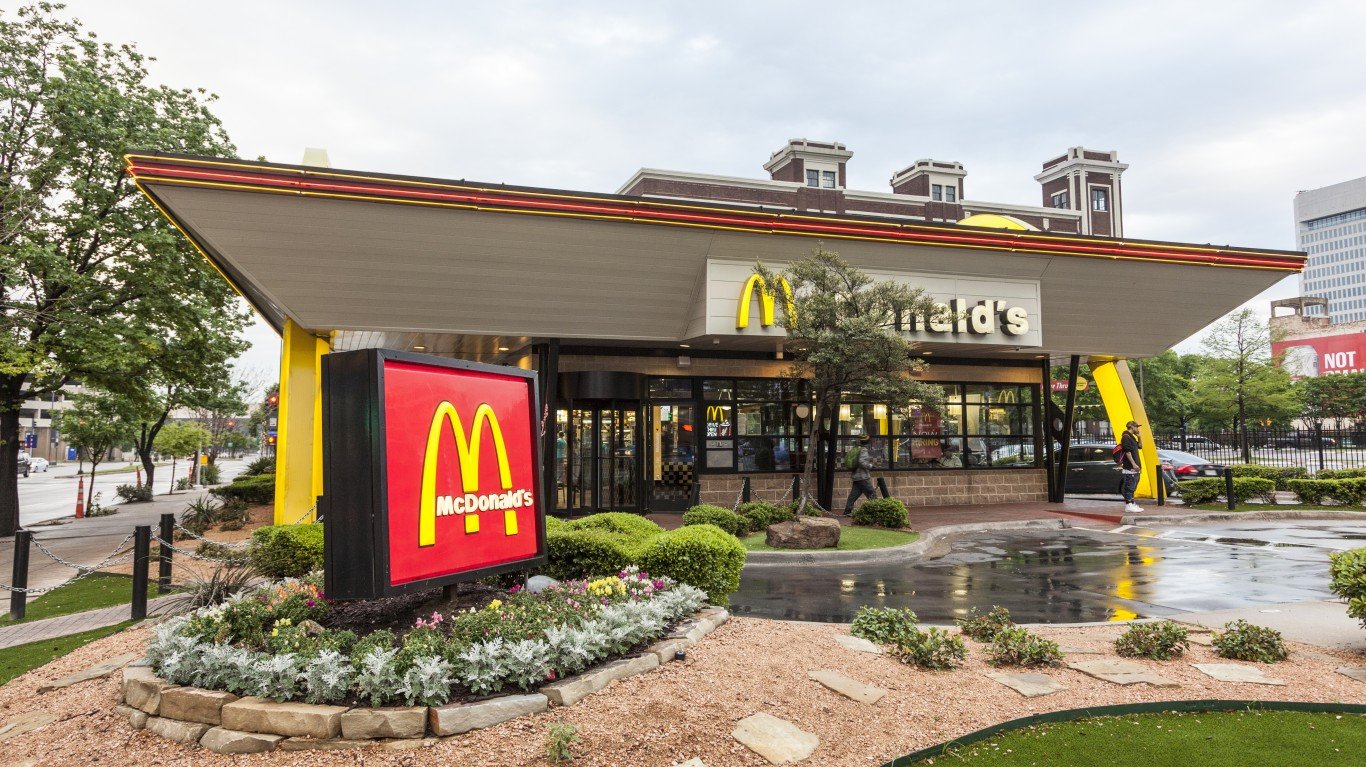
Source: typhoonski / iStock Editorial via Getty Images
The population of Texas in 2022 was 30,029,572 people. Their cost of living in 2021 was 1.5% lower than the national average, making them the 18th highest state in the nation. Texas’s 2022 disposable income reached $54,488, which is 2.4% lower than the national average, ranking it the 22nd highest in the country. The actual price of a Big Mac in August 2023 was $5.36, 3.7% higher than the national average price, placing them as the 19th highest. The “true cost” of a Big Mac, with all of these numbers considered, is $5.41.
19. New Mexico
Source: gnagel / iStock Editorial via Getty Images
The “true” cost of a Big Mac in New Mexico is $5.41. New Mexico had a population of 2,113,344 in 2022, with the cost of living (2021) 10.1% lower than the national average, placing it as the 6th lowest in the nation. Their 2022 disposable income was $46,270, 17.1% lower than the national average, ranking them the 6th lowest in the country. The actual price of a Big Mac in New Mexico in August 2023 was $4.99, 3.5% lower than the national average price, making them the 24th lowest.
18. South Carolina
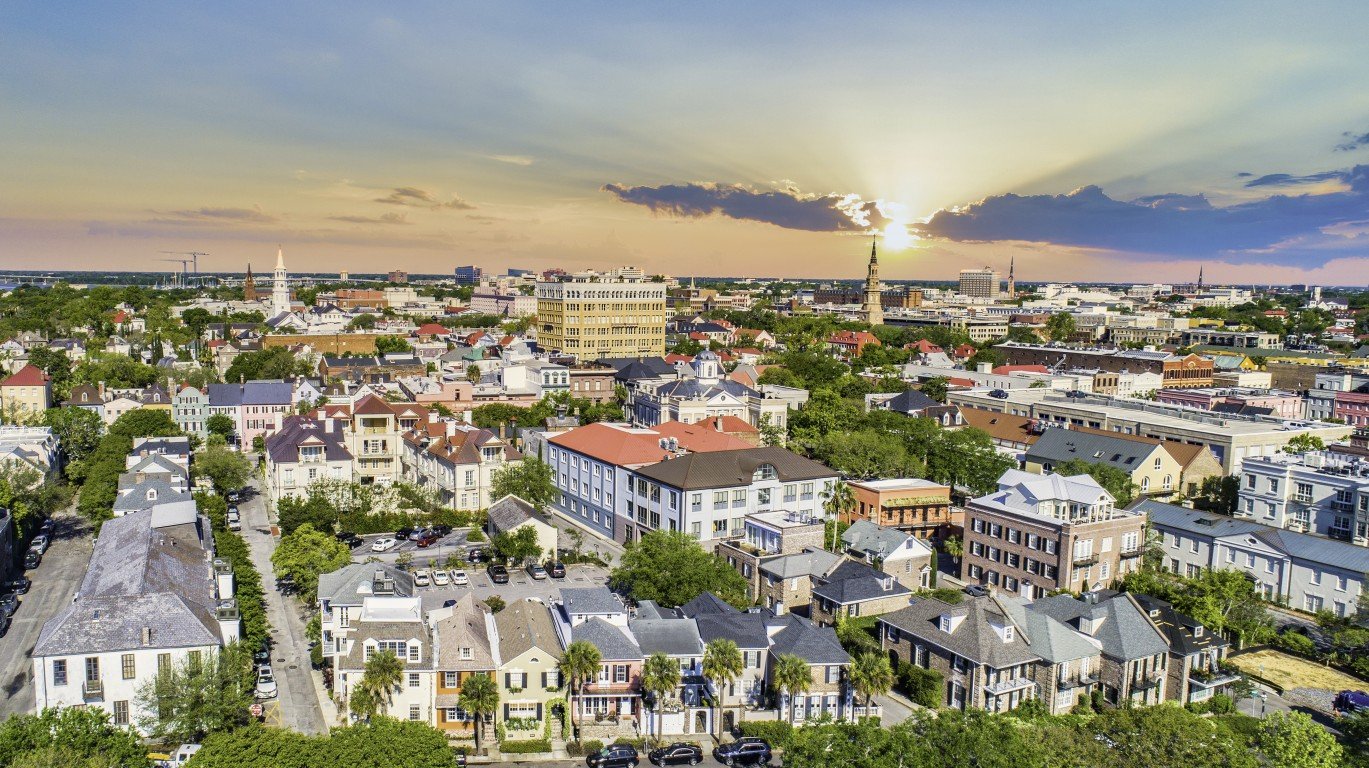
Source: Kruck20 / iStock via Getty Images
South Carolina had a 2022 population of 5,282,634, with the cost of living (2021) 6.3% lower than the national average, placing them at the 22nd lowest in the nation. With a disposable income of $46,720, rating it 16.3% lower than the national average and making it the 7th lowest in the country, the “true cost” of a Big Mac, with all things considered, is $5.48. The actual cost of a Big Mac in South Carolina in August 2023 was $4.89, 5.4% lower than the national average price, ranking them as the 22nd lowest.
17. West Virginia
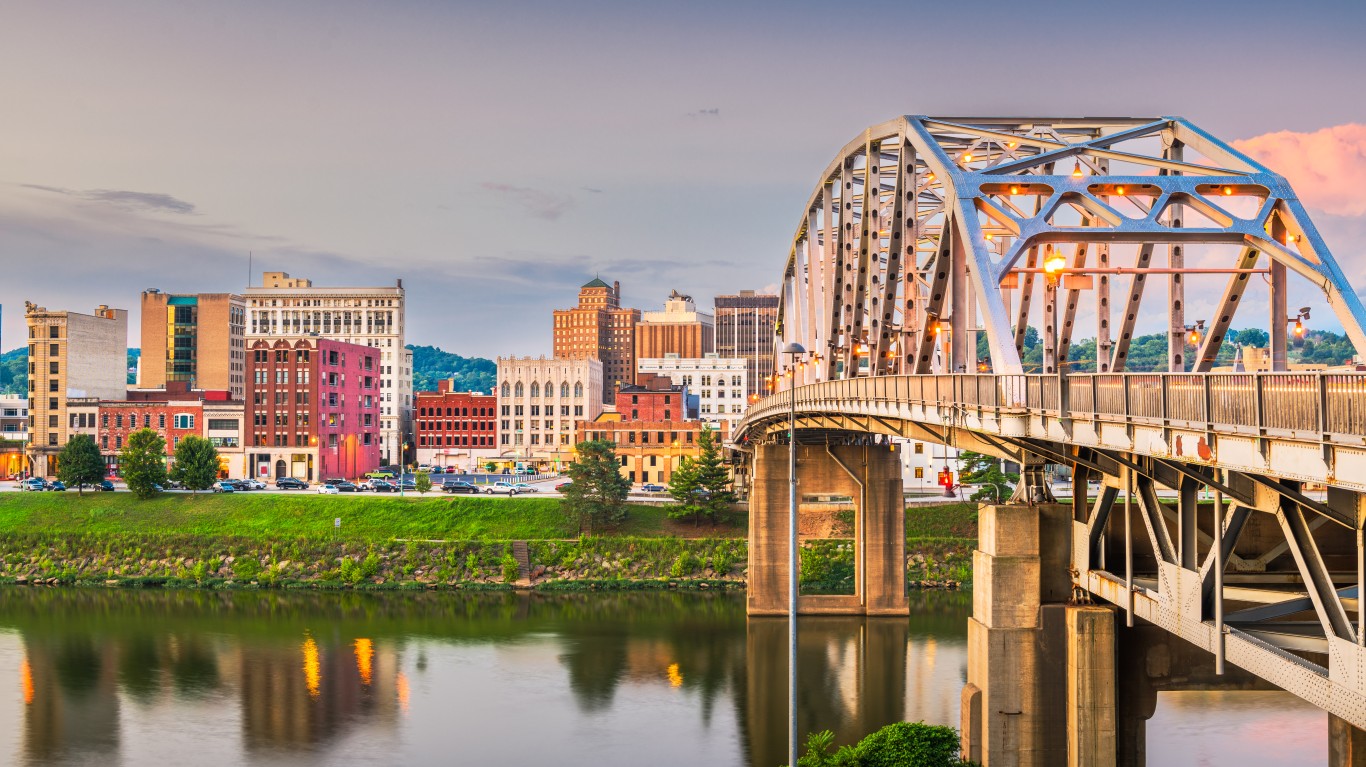
Source: Sean Pavone / iStock via Getty Images
The population of West Virginia in 2022 was 1,775,156 people. Their cost of living in 2021 was 9.2% lower than the national average, making them the 19th lowest state in the nation. West Virginia’s 2022 disposable income reached $43,972, which is 21.2% lower than the national average, ranking it the 2nd lowest in the country. The actual price of a Big Mac in August 2023 was $4.79, 7.4% higher than the national average price, placing them as the 20th lowest. The “true cost” of a Big Mac, with all of these numbers considered, is $5.52.
16. New Hampshire
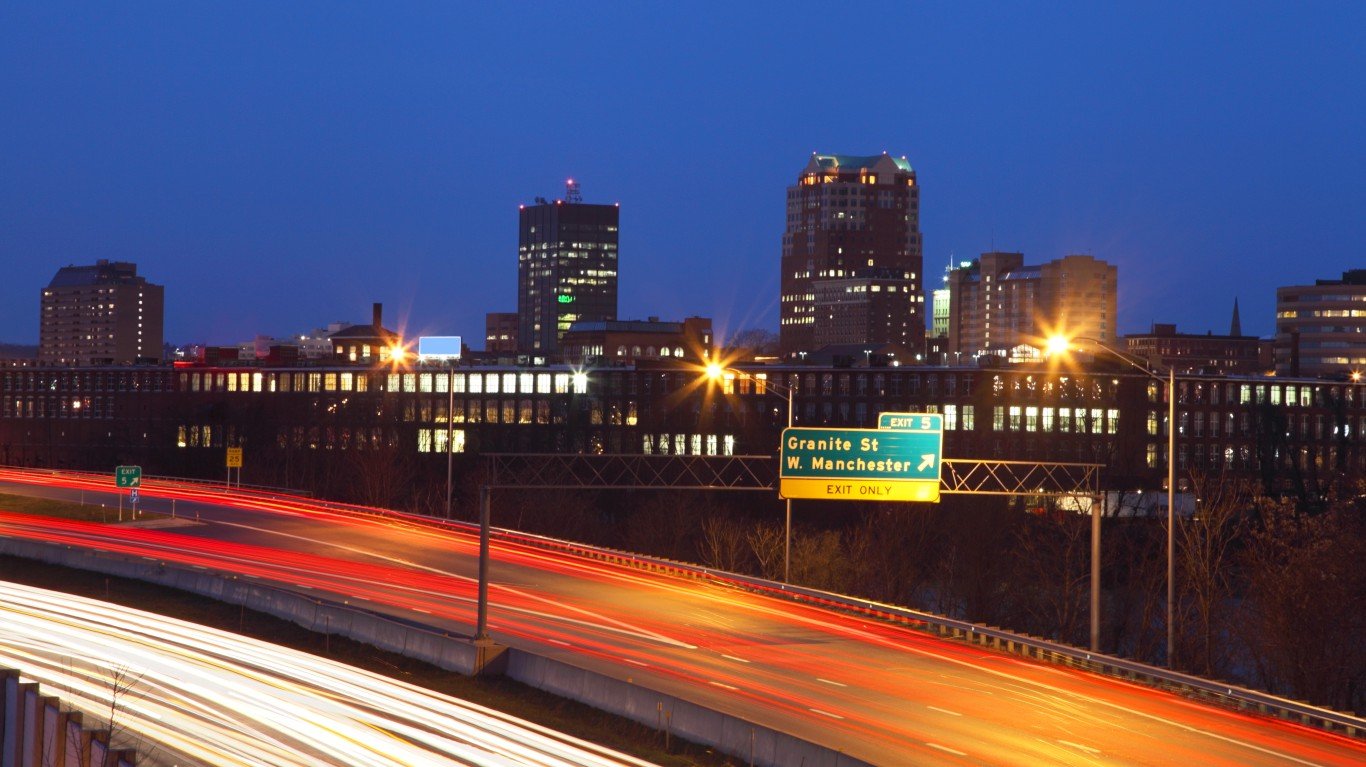
Source: DenisTangneyJr / iStock via Getty Images
The “true” cost of a Big Mac in New Hampshire is $5.55. New Hampshire had a population of 1,395,231 in 2022, with the cost of living (2021) 2.5% higher than the national average, placing it as the 12th highest in the nation. Their 2022 disposable income was $64,826, 16.1% higher than the national average, ranking them the 5th highest in the country. The actual price of a Big Mac in New Hampshire in August 2023 was $6.29, 21.7% higher than the national average price, making them the 3rd highest.
15. Georgia
Source: Melissa Kopka / iStock Editorial via Getty Images
Georgia had a 2022 population of 10,912,876, with the cost of living (2021) 4.2% lower than the national average, placing them at the 24th highest in the nation. With a disposable income of $49,538, rating it 11.3% lower than the national average and making it the 14th lowest in the country, the “true cost” of a Big Mac, with all things considered, is $5.56. The actual cost of a Big Mac in Georgia in August 2023 was $5.15, 0.4% lower than the national average price, ranking them as the 24th highest.
14. Delaware
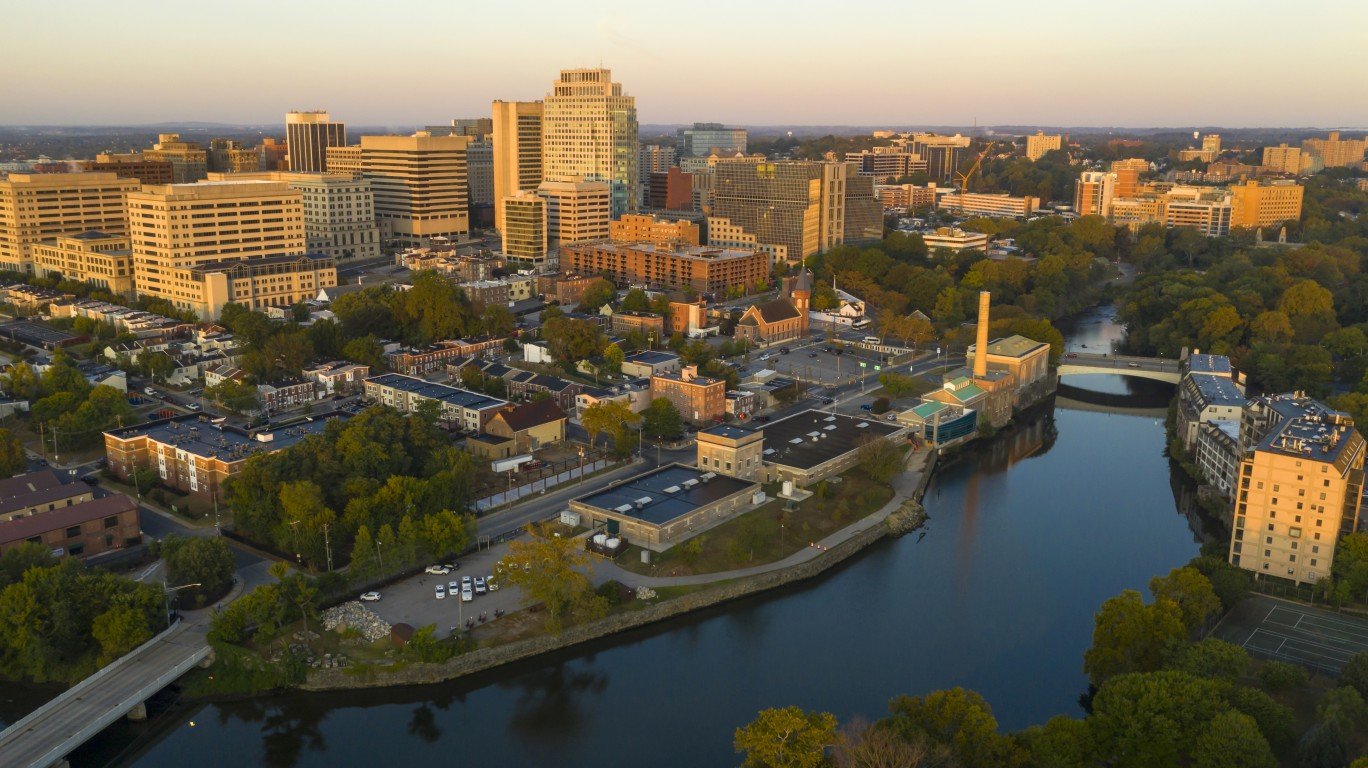
Source: ChrisBoswell / iStock via Getty Images
The population of Delaware in 2022 was 1,018,396 people. Their cost of living in 2021 was 2.3% lower than the national average, making them the 20th highest state in the nation. Delaware’s 2022 disposable income reached $52,591, which is 5.8% lower than the national average, ranking it the 25th lowest in the country. The actual price of a Big Mac in August 2023 was $5.49, 6.2% higher than the national average price, placing them as the 14th highest. The “true cost” of a Big Mac, with all of these numbers considered, is $5.69.
13. Idaho
Source: krblokhin / iStock Editorial via Getty Images
The “true” cost of a Big Mac in Idaho is $5.77. Idaho had a population of 1,939,033 in 2022, with the cost of living (2021) 8.2% lower than the national average, placing it as the 17th lowest in the nation. Their 2022 disposable income was $47,859, 14.3% lower than the national average, ranking them the 8th lowest in the country. The actual price of a Big Mac in Idaho in August 2023 was $5.39, 4.3% higher than the national average price, making them the 17th highest.
12. California
Source: Allard1 / iStock Editorial via Getty Images
California had a 2022 population of 39,029,342, with the cost of living (2021) 11.8% higher than the national average, placing them at the 2nd highest in the nation. With a disposable income of $63,219, rating it 13.2% higher than the national average and making it the 2nd highest in the country, the “true cost” of a Big Mac, with all things considered, is $5.82. The actual cost of a Big Mac in California in August 2023 was $5.89, 13.9% higher than the national average price, ranking them as the 9th highest.
11. Illinois
Source: blanscape / iStock Editorial via Getty Images
The population of Illinois in 2022 was 12,582,032 people. Their cost of living in 2021 was 1.4% higher than the national average, making them the 14th highest state in the nation. Illinois’s 2022 disposable income reached $58,437, which is 4.7% higher than the national average, ranking it the 14th highest in the country. The actual price of a Big Mac in August 2023 was $6.09, 17.8% higher than the national average price, placing them as the 6th highest. The “true cost” of a Big Mac, with all of these numbers considered, is $5.90.
10. Missouri
Source: kzoocowboy / Flickr
The “true” cost of a Big Mac in Missouri is $5.92. Missouri had a population of 6,177,957 in 2022, with the cost of living (2021) 8.0% lower than the national average, placing it as the 18th lowest in the nation. Their 2022 disposable income was $49,367, 11.6% lower than the national average, ranking them the 11th lowest in the country. The actual price of a Big Mac in Missouri in August 2023 was $5.69, 10.1% higher than the national average price, making them the 11th highest.
9. Arkansas
Source: peeterv / iStock Unreleased via Getty Images
Arkansas had a 2022 population of 3,045,637, with the cost of living (2021) 10.6% higher than the national average, placing them at the 4th lowest in the nation. With a disposable income of $46,218, rating it 17.2% lower than the national average and making it the 5th lowest in the country, the “true cost” of a Big Mac, with all things considered, is $5.93. The actual cost of a Big Mac in Arkansas in August 2023 was $5.49, 6.2% higher than the national average price, ranking them as the 14th highest.
8. Rhode Island
Source: jjbers / Flickr
The population of Rhode Island in 2022 was 1,093,734 people. Their cost of living in 2021 was 2.1% higher than the national average, making them the 14th highest state in the nation. Rhode Island’s 2022 disposable income reached $56,289, which is 0.8% higher than the national average, ranking it the 17th highest in the country. The actual price of a Big Mac in August 2023 was $5.99, 15.9% higher than the national average price, placing them as the 8th highest. The “true cost” of a Big Mac, with all of these numbers considered, is $6.06.
7. Massachusetts
Source: jjbers / Flickr
The “true” cost of a Big Mac in Massachusetts is $6.09. Massachusetts had a population of 6,981,974 in 2022, with the cost of living (2021) 6.6% higher than the national average, placing it as the 6th highest in the nation. Their 2022 disposable income was $69,316, 24.2% higher than the national average, ranking them the highest in the country. The actual price of a Big Mac in Massachusetts in August 2023 was $7.09, 37.1% higher than the national average price, making them the highest.
6. Arizona
Source: FiledIMAGE / iStock Editorial via Getty Images
Arizona had a 2022 population of 7,359,197, with the cost of living (2021) 3.3% lower than the national average, placing them at the 22nd highest in the nation. With a disposable income of $49,493, rating it 11.4% lower than the national average and making it the 13th lowest in the country, the “true cost” of a Big Mac, with all things considered, is $6.10. The actual cost of a Big Mac in Arizona in August 2023 was $5.59, 8.1% higher than the national average price, ranking them as the 13th highest.
5. Alaska
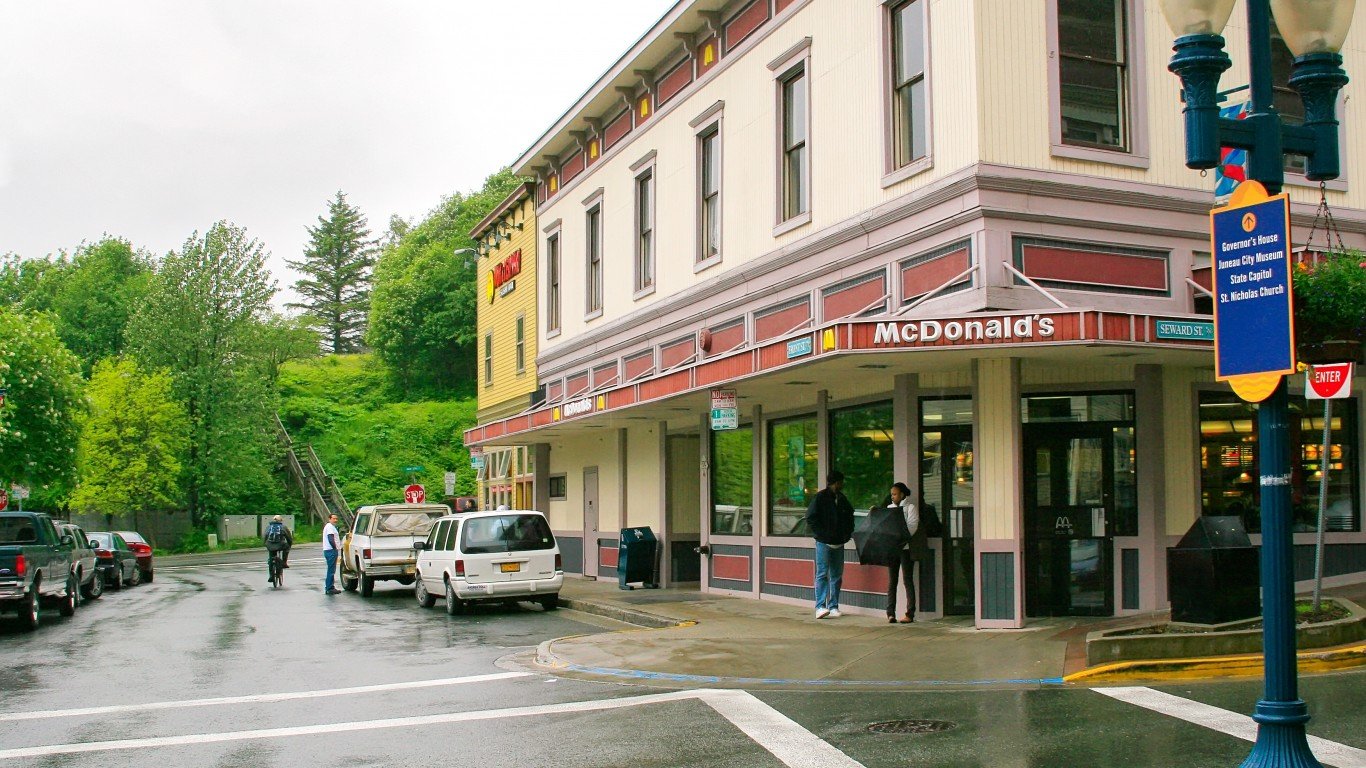
Source: Ruth Peterkin / iStock Editorial via Getty Images
The population of Alaska in 2022 was 733,583 people. Their cost of living in 2021 was 4.4% higher than the national average, making them the 8th highest state in the nation. Alaska’s 2022 disposable income reached $62,045, which is 11.1% higher than the national average, ranking it the 10th highest in the country. The actual price of a Big Mac in August 2023 was $6.50, 25.7% higher than the national average price, placing them as the 2nd highest. The “true cost” of a Big Mac, with all of these numbers considered, is $6.11.
4. Mississippi
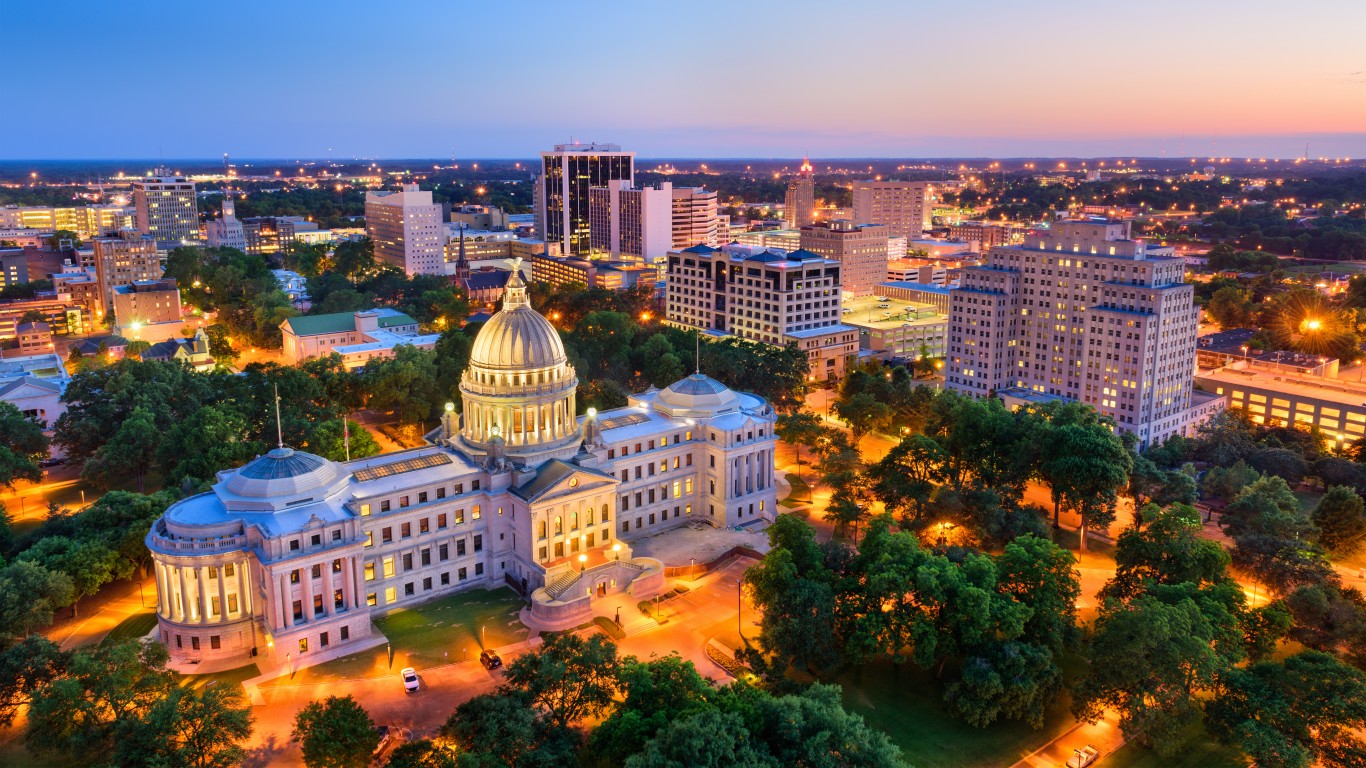
Source: SeanPavonePhoto / iStock via Getty Images
The “true” cost of a Big Mac in Mississippi is $6.23. Mississippi had a population of 2,940,057 in 2022, with the cost of living (2021) 13.4% lower than the national average, placing it as the lowest in the nation. Their 2022 disposable income was $41,887, 25.0% lower than the national average, ranking them the lowest in the country. The actual price of a Big Mac in Mississippi in August 2023 was $5.40, 4.4% higher than the national average price, making them the 16th highest.
3. Vermont
Source: TonyBaggett / iStock Editorial via Getty Images
Vermont had a 2022 population of 647,064, with the cost of living (2021) 1.3% lower than the national average, placing them at the 17th highest in the nation. With a disposable income of $54,714, rating it 2.0% lower than the national average and making it the 20th highest in the country, the “true cost” of a Big Mac, with all things considered, is $6.33. The actual cost of a Big Mac in Vermont in August 2023 was $6.29, 21.7% higher than the national average price, ranking them as the 3rd highest.
2. Hawaii
Source: jewhyte / iStock Editorial via Getty Images
The population of Hawaii in 2022 was 1,440,196 people. Their cost of living in 2021 was 13.2% higher than the national average, making them the highest state in the nation. Hawaii’s 2022 disposable income reached $52,515, which is 5.9% lower than the national average, ranking it the 24th lowest in the country. The actual price of a Big Mac in August 2023 was $5.31, 2.7% higher than the national average price, placing them as the 20th highest. The “true cost” of a Big Mac, with all of these numbers considered, is $6.39.
1. Maine
Source: huddleston / Flickr
The “true” cost of a Big Mac in Maine is $6.54. Maine had a population of 1,385,340 in 2022, with the cost of living (2021) 2.8% lower than the national average, placing it as the 21st highest in the nation. Their 2022 disposable income was $52,236, 6.4% lower than the national average, ranking them the 21st lowest in the country. The actual price of a Big Mac in Maine in August 2023 was $6.29, 21.7% higher than the national average price, making them the 3rd highest.
ALERT: Take This Retirement Quiz Now (Sponsored)
Take the quiz below to get matched with a financial advisor today.
Each advisor has been vetted by SmartAsset and is held to a fiduciary standard to act in your best interests.
Here’s how it works:
1. Answer SmartAsset advisor match quiz
2. Review your pre-screened matches at your leisure. Check out the advisors’ profiles.
3. Speak with advisors at no cost to you. Have an introductory call on the phone or introduction in person and choose whom to work with in the future
Take the retirement quiz right here.
Thank you for reading! Have some feedback for us?
Contact the 24/7 Wall St. editorial team.
Editors' Picks