There is no set definition for the middle class, but one thing everybody seems to agree on is that America’s middle class has been shrinking for the past 50 years or so. The share of adults who live in middle-class households fell from 61% in 1971 to 50% in 2021, according to the Pew Research Center. Despite this, middle class Americans remain the biggest income group — by the number of people that is, not aggregate income earned.
In fact, even though the upper income group is far smaller, with 21% of adults, the aggregate income earned by the upper income group is 50% to the middle class’s 42%. And of course, the aggregate income of the middle class has shrunk from 62% in 1970, even as the upper income group’s aggregate income rose from 29% to 50%. So where do we see the middle class shrinking the most?
To determine the cities where the middle class is shrinking, 24/7 Wall St. reviewed five-year data on family income from the U.S. Census Bureau’s American Community Survey. Cities were ranked based on the percentage-point change in the share of family households residing in middle-income census tracts from 2012 to 2022. Middle-income census tracts were defined as census tracts in which the median family income is within 25% of the median family income for the city as a whole. Only census tracts that spatially overlap with city boundaries by at least 50% were considered. Census tract and place boundaries are from the U.S. Census Bureau. Only cities with at least 150,000 residents were considered in our analysis.
Most of the cities on the list, where the middle class shrank the most in the past decade, are not very large cities, with between 150,000 to 250,000 residents. The median family income ranges among the cities on the list from $52,443 in Jackson, Mississippi to $116,103 in Portland, Oregon. (Also see: The City With the Poorest Middle Class in Every State.)
The cities span the country — six are in California, five are in Florida, and four in Texas — but the city where the middle class shrank the most is Jersey City, New Jersey. Interestingly, while some might assume that in places where the middle class is shrinking the lower-income class would be increasing, this is not always the case. In many of the places on the list, the share of families in the upper-income class rose during that time, sometimes this happened even as the share of families in the lower-income classes fell, and sometimes when it rose.
40. New Orleans, Louisiana
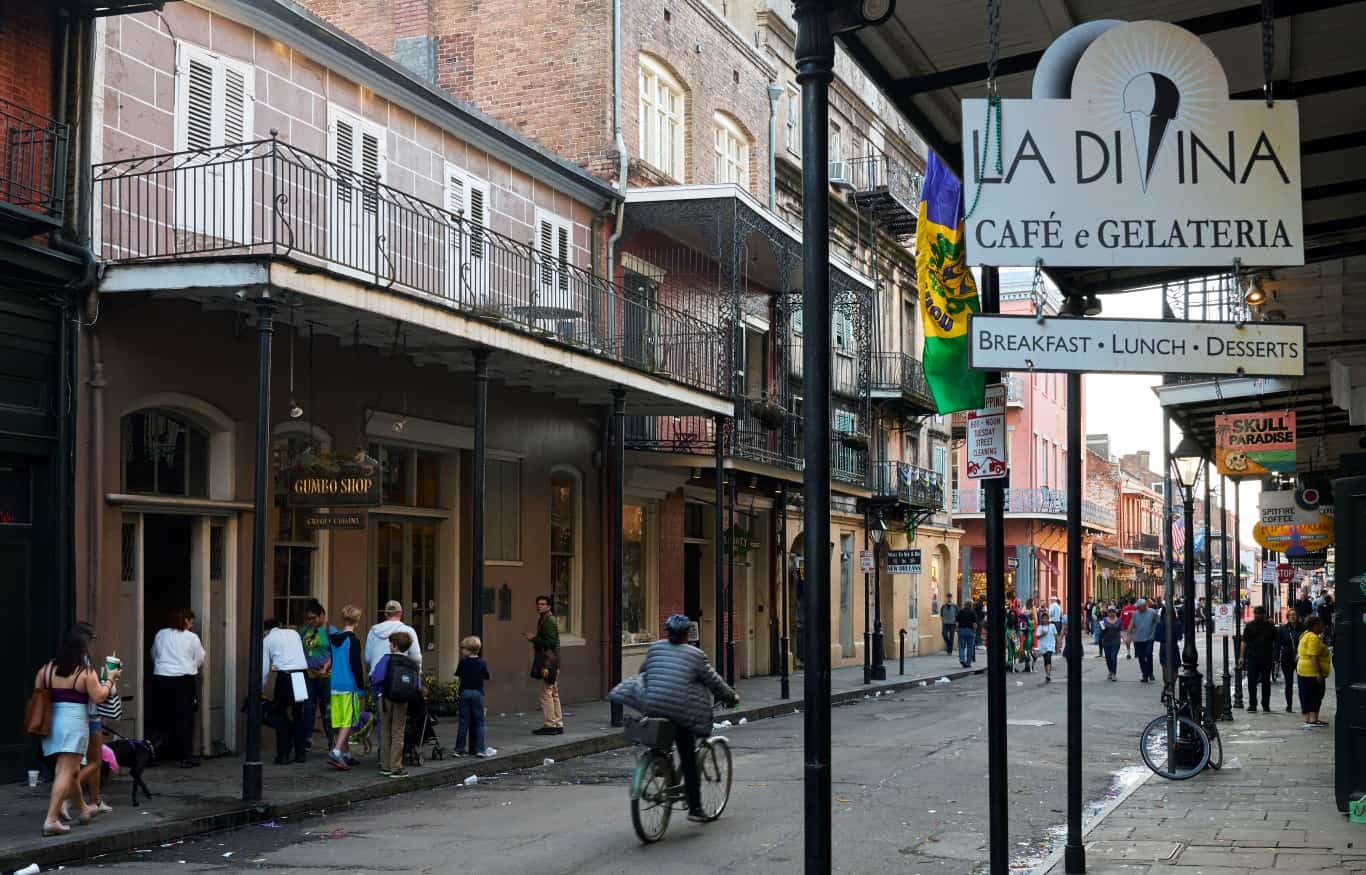
Source: pedrosz / Flickr
- Change in share of families in middle-income tracts, 2012 to 2022: -2.7 ppts.
- Change in share of families in upper-income tracts, 2012 to 2022: +8.0 ppts.
- Change in share of families in lower-income tracts, 2012 to 2022: -5.3 ppts.
- Median family income, 2022: $73,549
- Total population, 2022: 380,408
39. Pembroke Pines, Florida
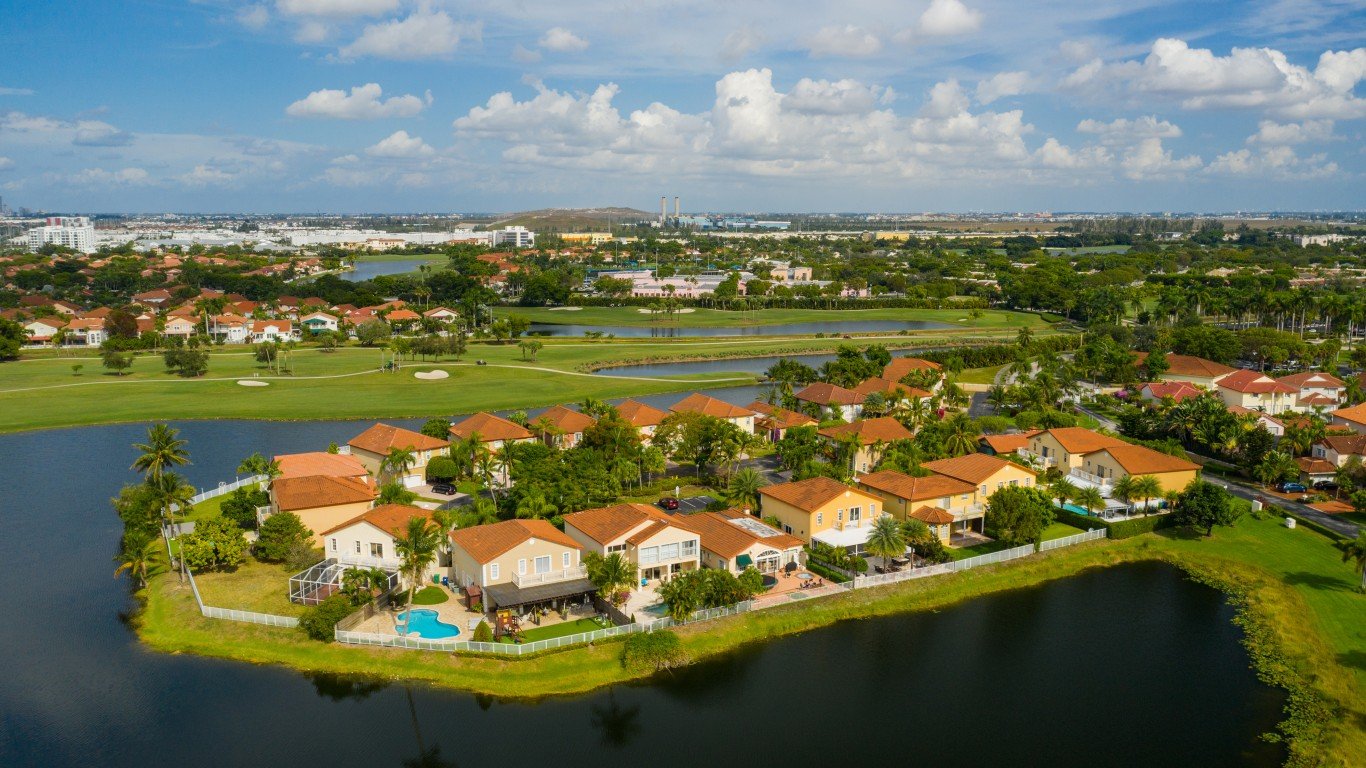
Source: felixmizioznikov / iStock via Getty Images
- Change in share of families in middle-income tracts, 2012 to 2022: -2.8 ppts.
- Change in share of families in upper-income tracts, 2012 to 2022: -1.9 ppts.
- Change in share of families in lower-income tracts, 2012 to 2022: +4.6 ppts.
- Median family income, 2022: $94,525
- Total population, 2022: 170,472
38. Des Moines, Iowa
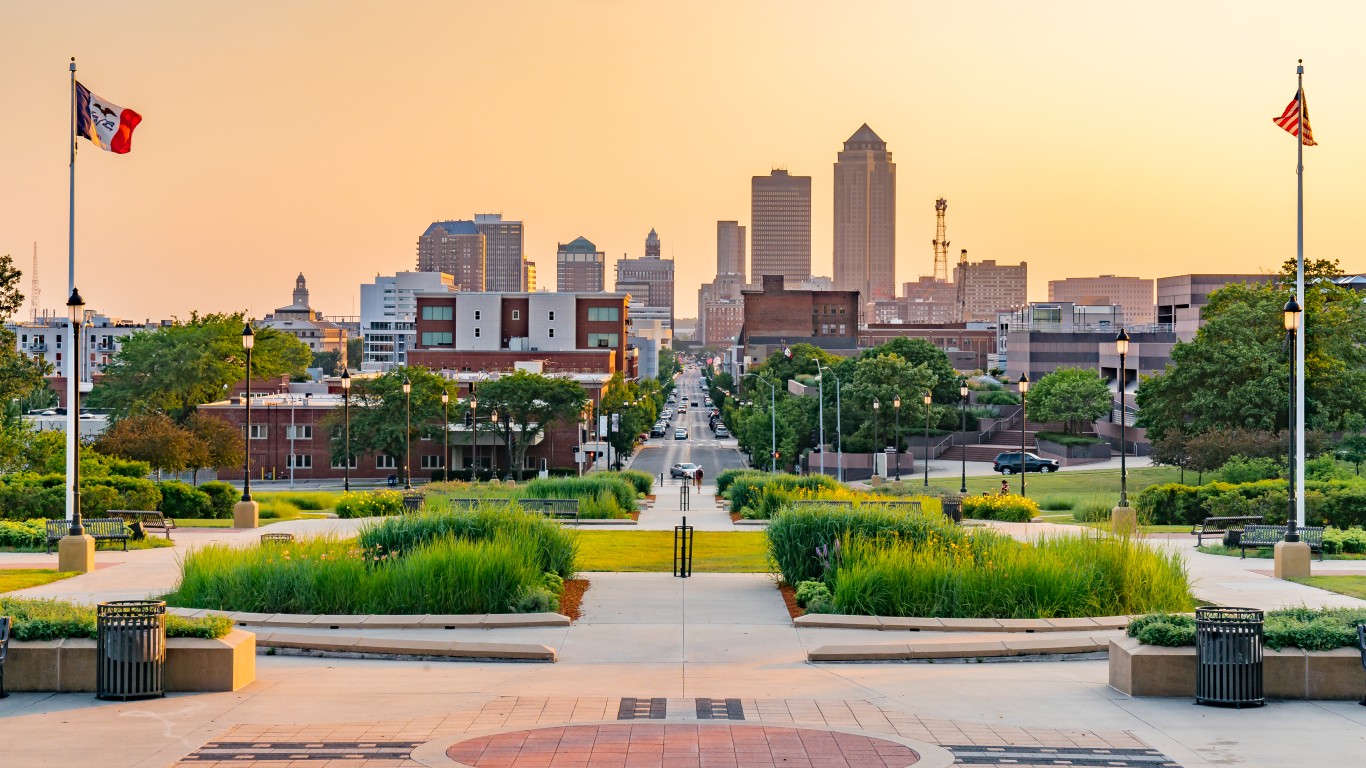
Source: pabradyphoto / iStock via Getty Images
- Change in share of families in middle-income tracts, 2012 to 2022: -2.9 ppts.
- Change in share of families in upper-income tracts, 2012 to 2022: -1.8 ppts.
- Change in share of families in lower-income tracts, 2012 to 2022: +4.7 ppts.
- Median family income, 2022: $76,602
- Total population, 2022: 213,164
37. Portland, Oregon
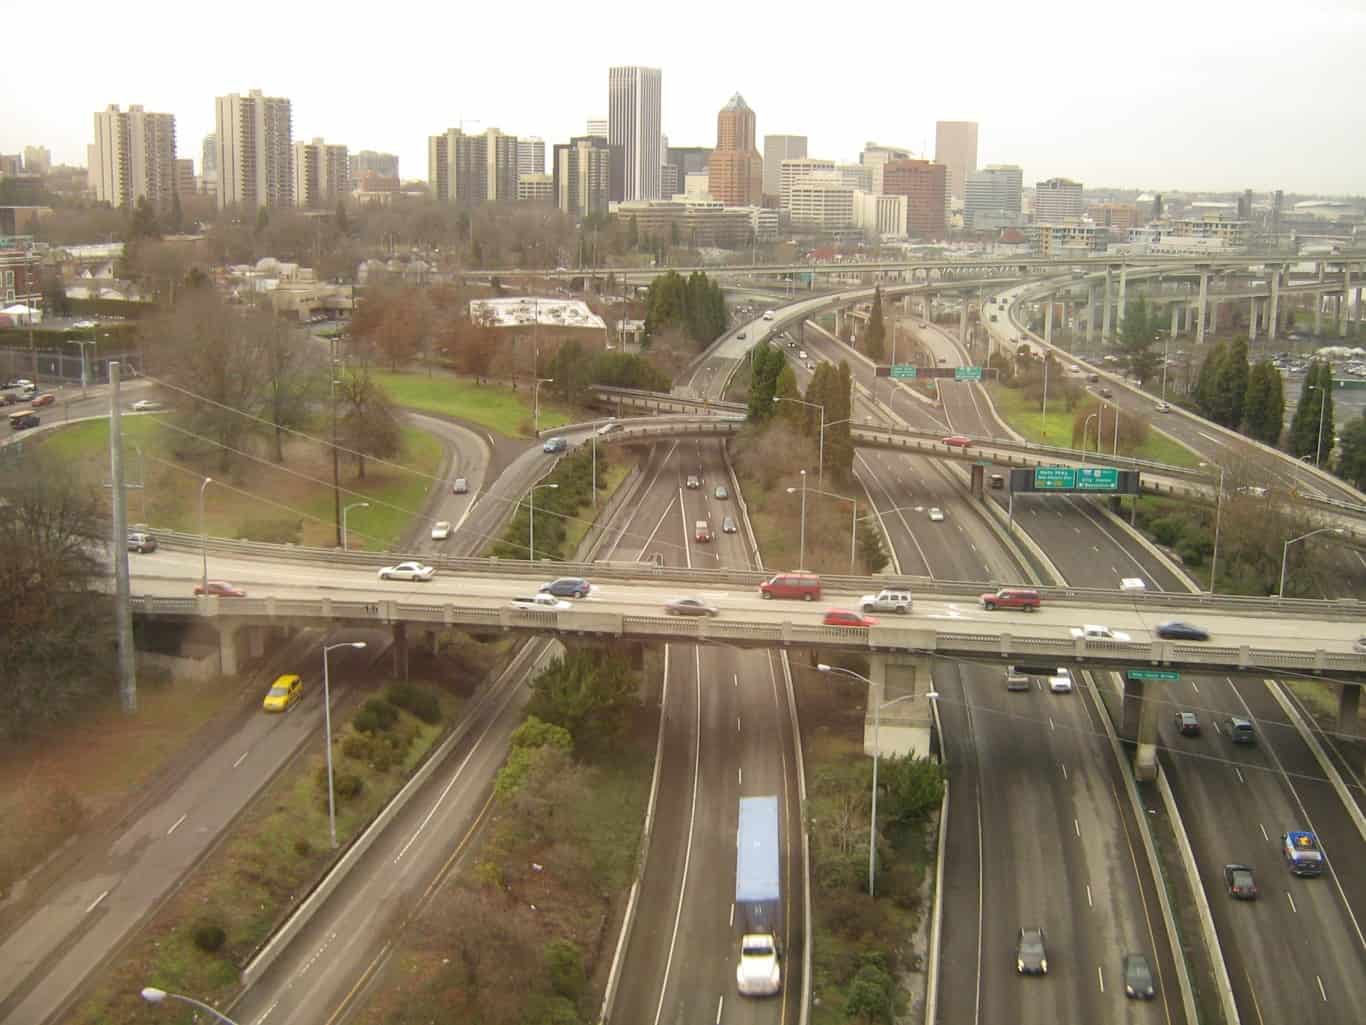
Source: giesenbauer / Flickr
- Change in share of families in middle-income tracts, 2012 to 2022: -3.0 ppts.
- Change in share of families in upper-income tracts, 2012 to 2022: +2.7 ppts.
- Change in share of families in lower-income tracts, 2012 to 2022: +0.3 ppts.
- Median family income, 2022: $116,103
- Total population, 2022: 646,101
36. El Paso, Texas
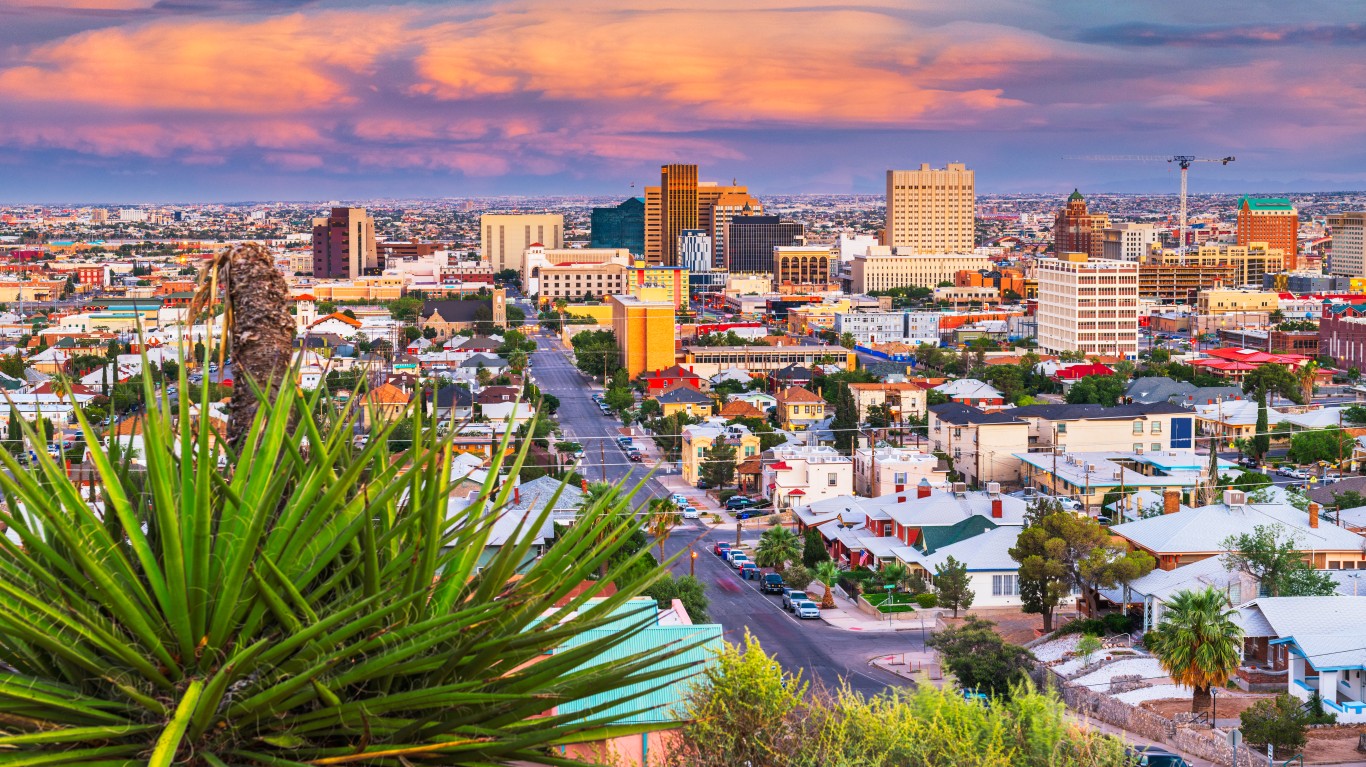
Source: Sean Pavone / iStock via Getty Images
- Change in share of families in middle-income tracts, 2012 to 2022: -3.0 ppts.
- Change in share of families in upper-income tracts, 2012 to 2022: -2.3 ppts.
- Change in share of families in lower-income tracts, 2012 to 2022: +5.3 ppts.
- Median family income, 2022: $63,067
- Total population, 2022: 677,181
35. Santa Rosa, California
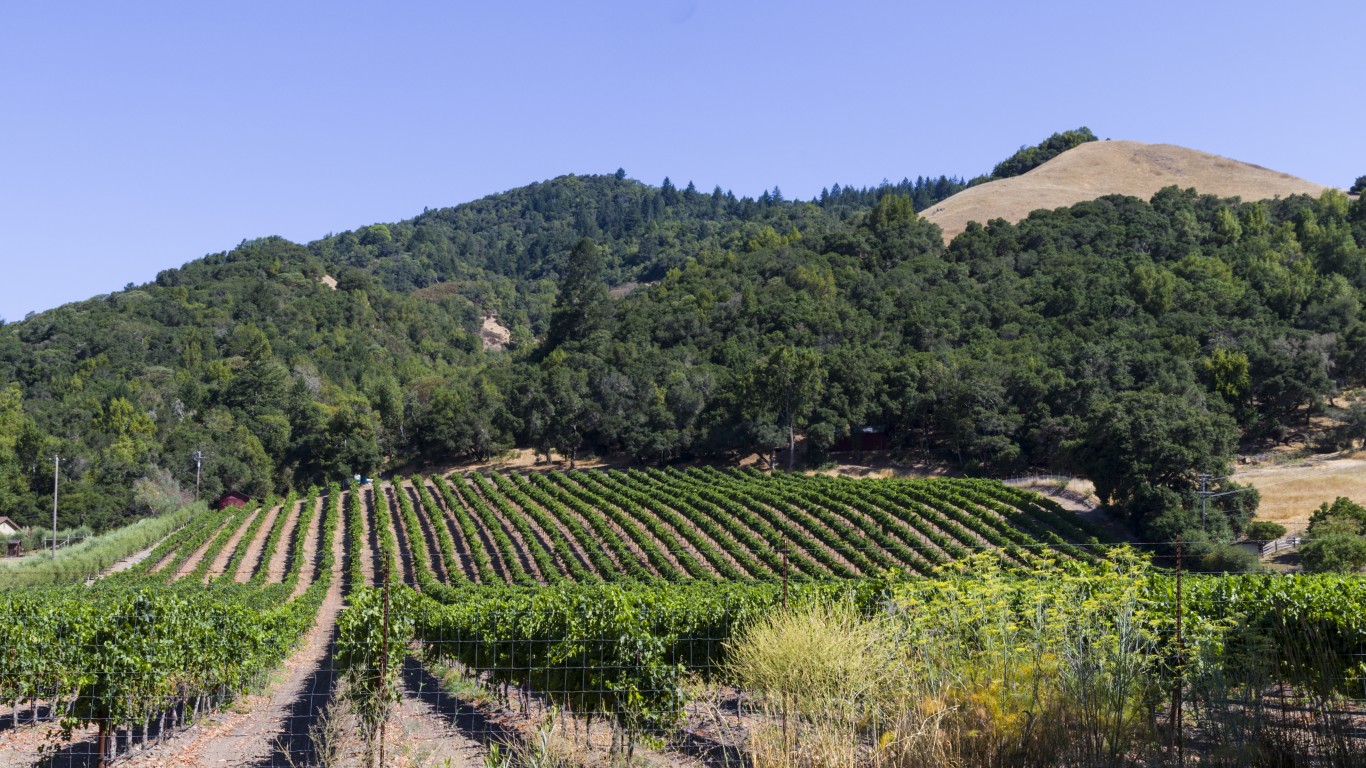
Source: Bob Corson / iStock via Getty Images
- Change in share of families in middle-income tracts, 2012 to 2022: -3.2 ppts.
- Change in share of families in upper-income tracts, 2012 to 2022: +10.6 ppts.
- Change in share of families in lower-income tracts, 2012 to 2022: -7.4 ppts.
- Median family income, 2022: $110,196
- Total population, 2022: 178,221
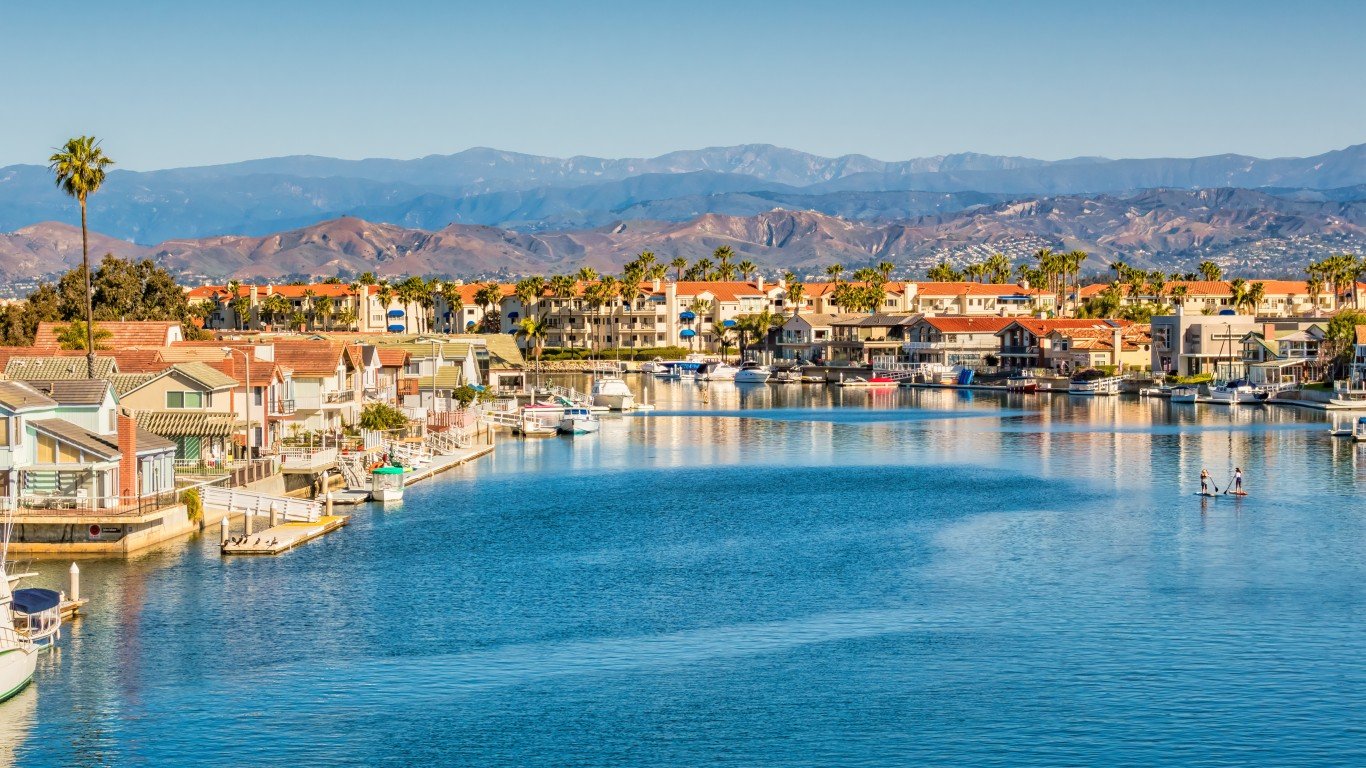
34. Escondido, California
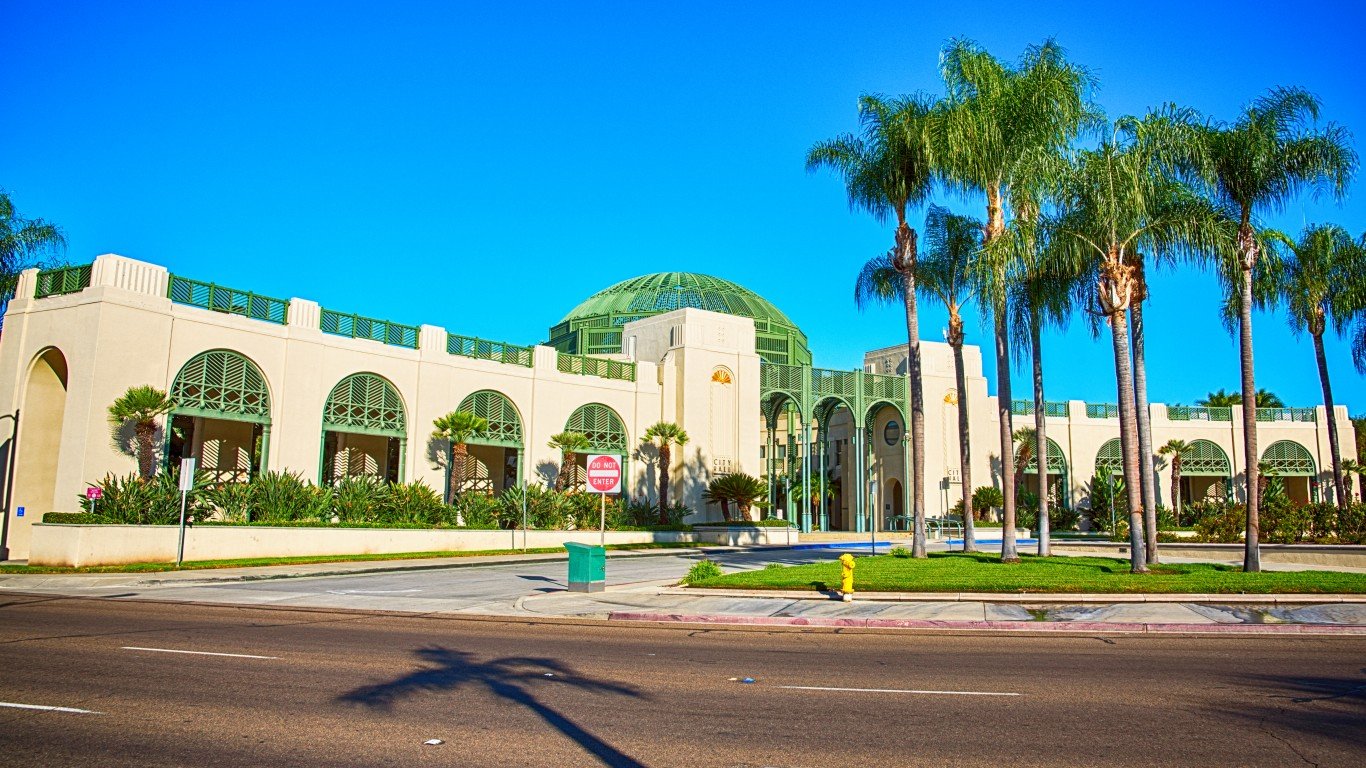
Source: Art Wager / iStock via Getty Images
- Change in share of families in middle-income tracts, 2012 to 2022: -3.3 ppts.
- Change in share of families in upper-income tracts, 2012 to 2022: -3.7 ppts.
- Change in share of families in lower-income tracts, 2012 to 2022: +7.0 ppts.
- Median family income, 2022: $89,970
- Total population, 2022: 151,114
33. Peoria, Arizona
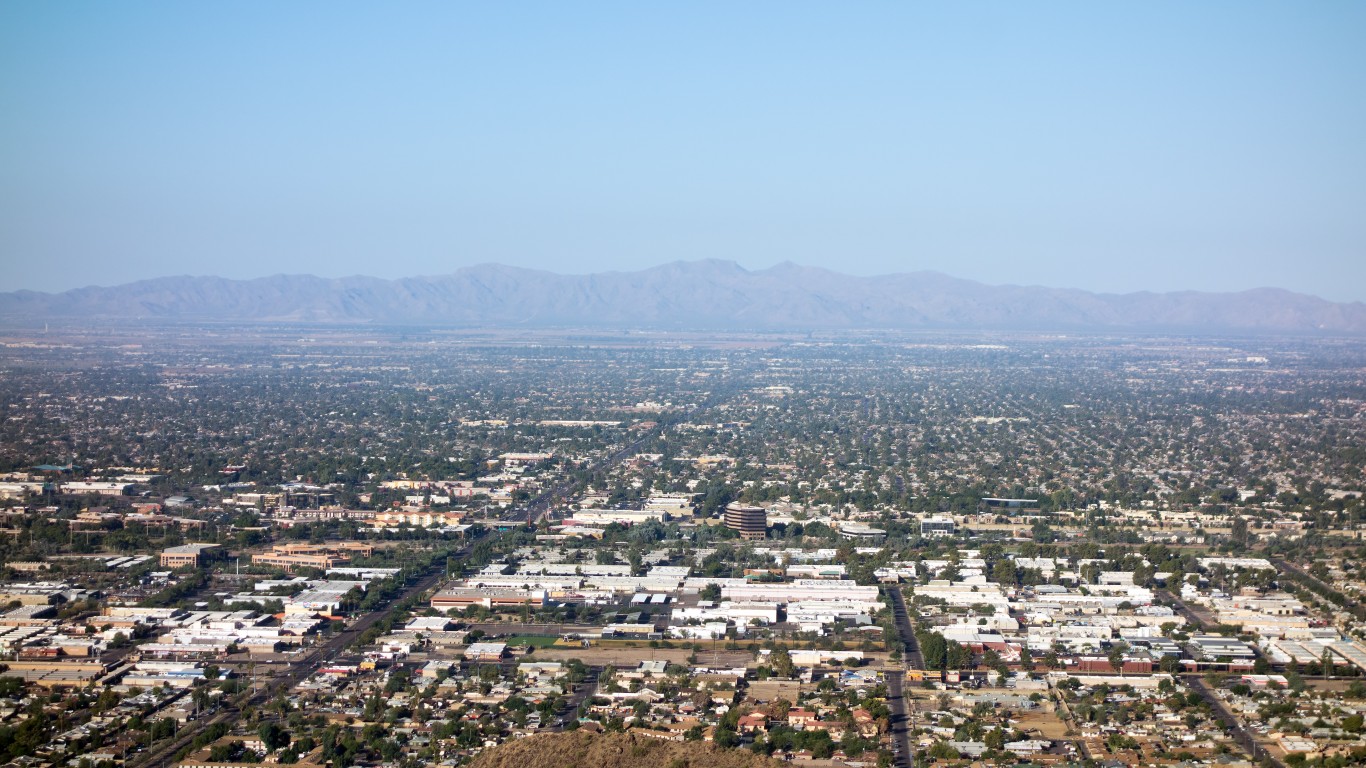
Source: EuToch / iStock via Getty Images
- Change in share of families in middle-income tracts, 2012 to 2022: -3.3 ppts.
- Change in share of families in upper-income tracts, 2012 to 2022: +3.2 ppts.
- Change in share of families in lower-income tracts, 2012 to 2022: +0.1 ppts.
- Median family income, 2022: $102,661
- Total population, 2022: 191,292
32. Glendale, Arizona
Source: Davel5957 / iStock via Getty Images
- Change in share of families in middle-income tracts, 2012 to 2022: -3.4 ppts.
- Change in share of families in upper-income tracts, 2012 to 2022: +6.0 ppts.
- Change in share of families in lower-income tracts, 2012 to 2022: -2.6 ppts.
- Median family income, 2022: $77,602
- Total population, 2022: 248,083
31. Jackson, Mississippi
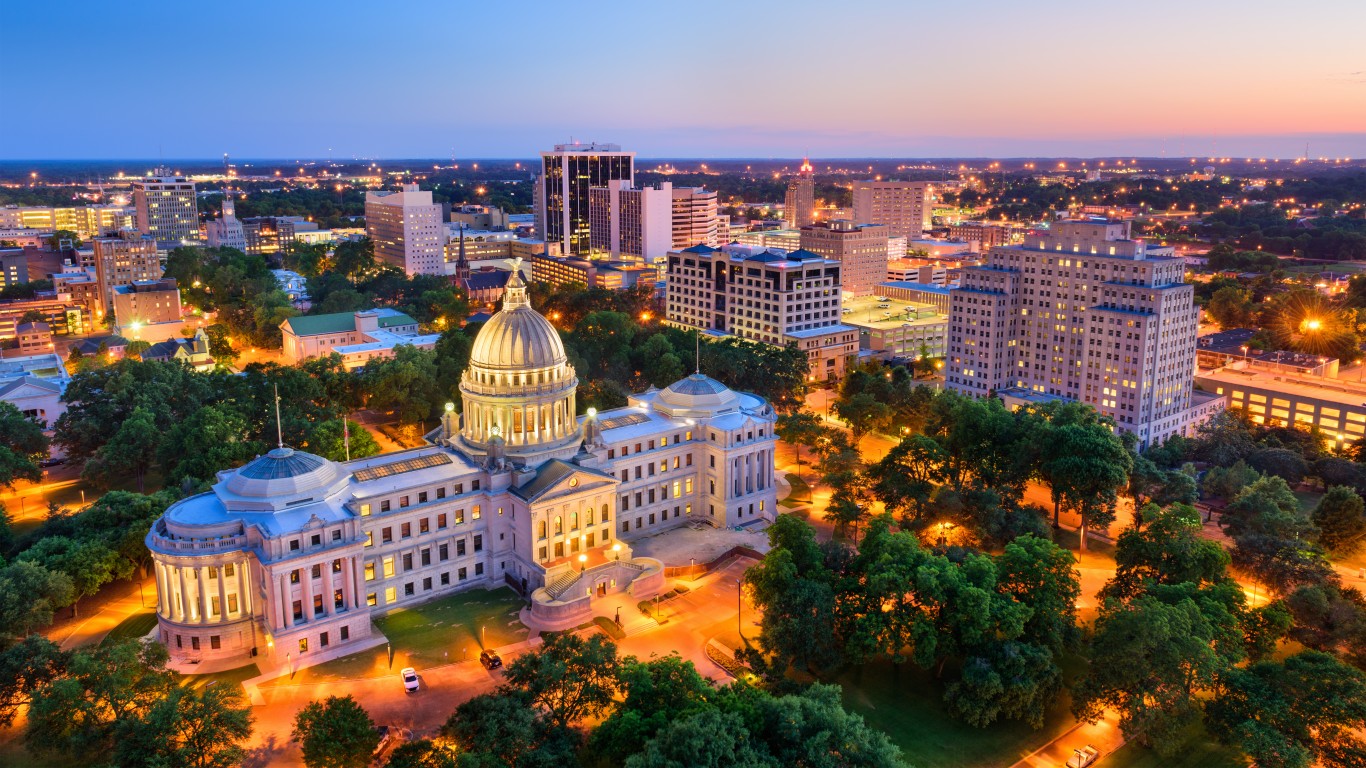
Source: SeanPavonePhoto / iStock via Getty Images
- Change in share of families in middle-income tracts, 2012 to 2022: -3.6 ppts.
- Change in share of families in upper-income tracts, 2012 to 2022: +1.0 ppts.
- Change in share of families in lower-income tracts, 2012 to 2022: +2.6 ppts.
- Median family income, 2022: $52,443
- Total population, 2022: 153,271
30. Boston, Massachusetts

Source: jjbers / Flickr
- Change in share of families in middle-income tracts, 2012 to 2022: -3.6 ppts.
- Change in share of families in upper-income tracts, 2012 to 2022: +4.6 ppts.
- Change in share of families in lower-income tracts, 2012 to 2022: -1.0 ppts.
- Median family income, 2022: $106,015
- Total population, 2022: 665,945
29. Madison, Wisconsin
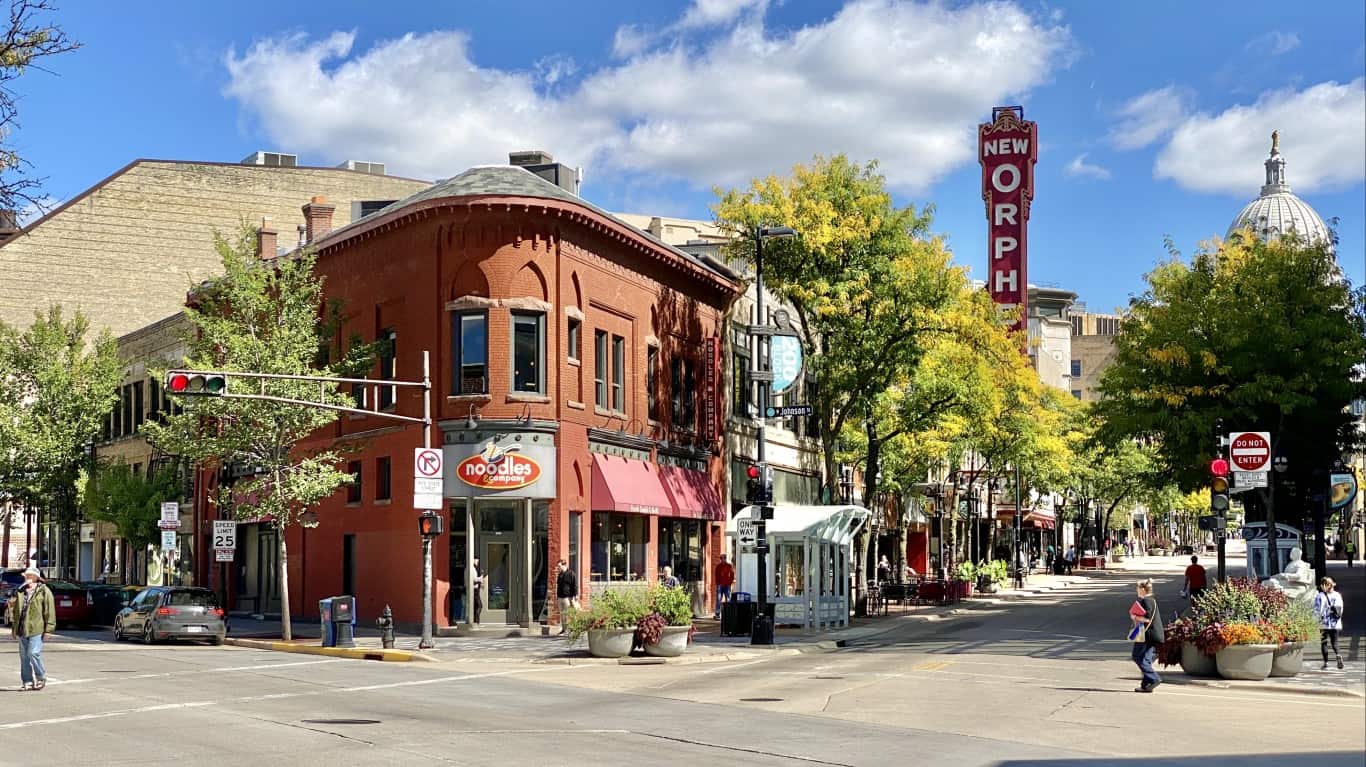
Source: warrenlemay / Flickr
- Change in share of families in middle-income tracts, 2012 to 2022: -4.0 ppts.
- Change in share of families in upper-income tracts, 2012 to 2022: +1.5 ppts.
- Change in share of families in lower-income tracts, 2012 to 2022: +2.6 ppts.
- Median family income, 2022: $111,576
- Total population, 2022: 268,516
28. Spring Valley, Nevada
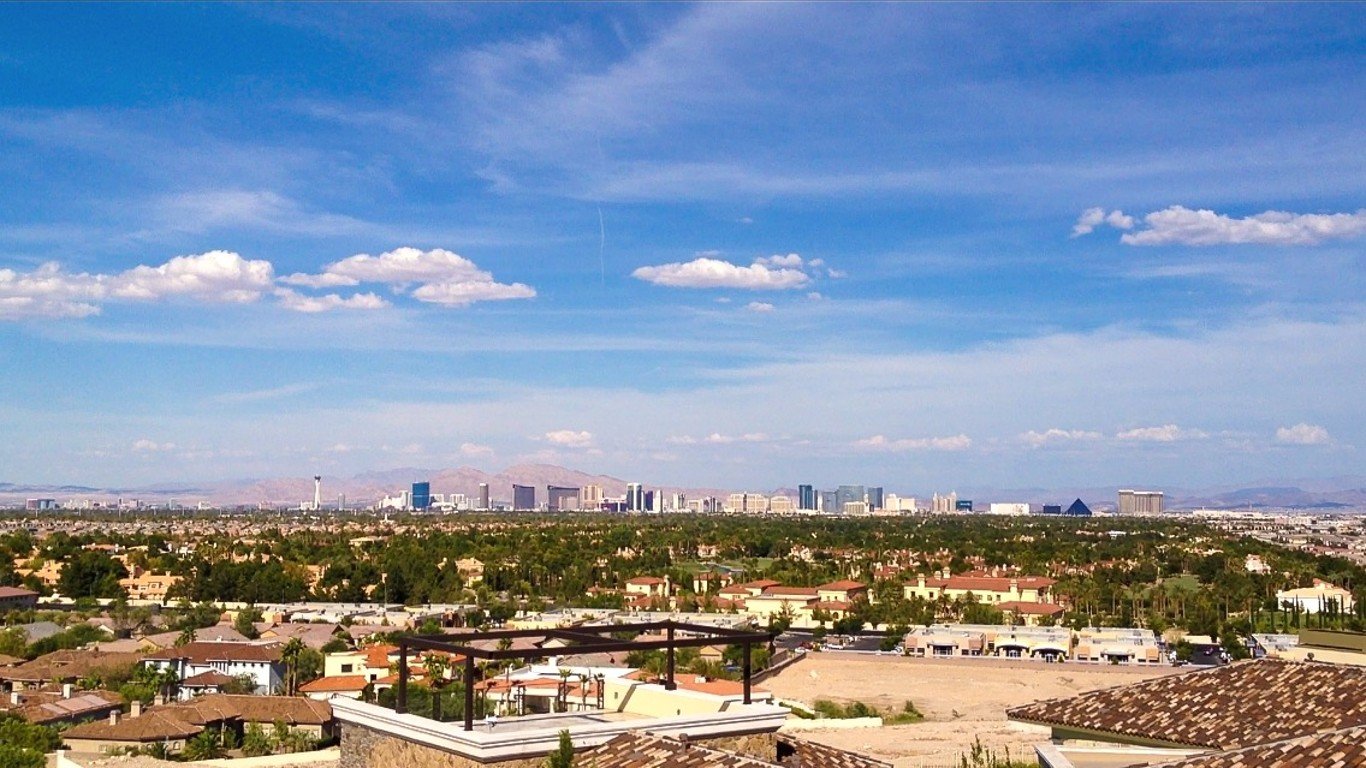
Source: By Rmvisuals - Own work, CC BY-SA 4.0, https://commons.wikimedia.org/w/index.php?curid=48658977
- Change in share of families in middle-income tracts, 2012 to 2022: -4.8 ppts.
- Change in share of families in upper-income tracts, 2012 to 2022: -2.7 ppts.
- Change in share of families in lower-income tracts, 2012 to 2022: +7.4 ppts.
- Median family income, 2022: $79,763
- Total population, 2022: 220,114
27. Birmingham, Alabama

Source: ESB Professional/Shutterstock
- Change in share of families in middle-income tracts, 2012 to 2022: -5.1 ppts.
- Change in share of families in upper-income tracts, 2012 to 2022: -3.6 ppts.
- Change in share of families in lower-income tracts, 2012 to 2022: +8.7 ppts.
- Median family income, 2022: $55,541
- Total population, 2022: 200,431
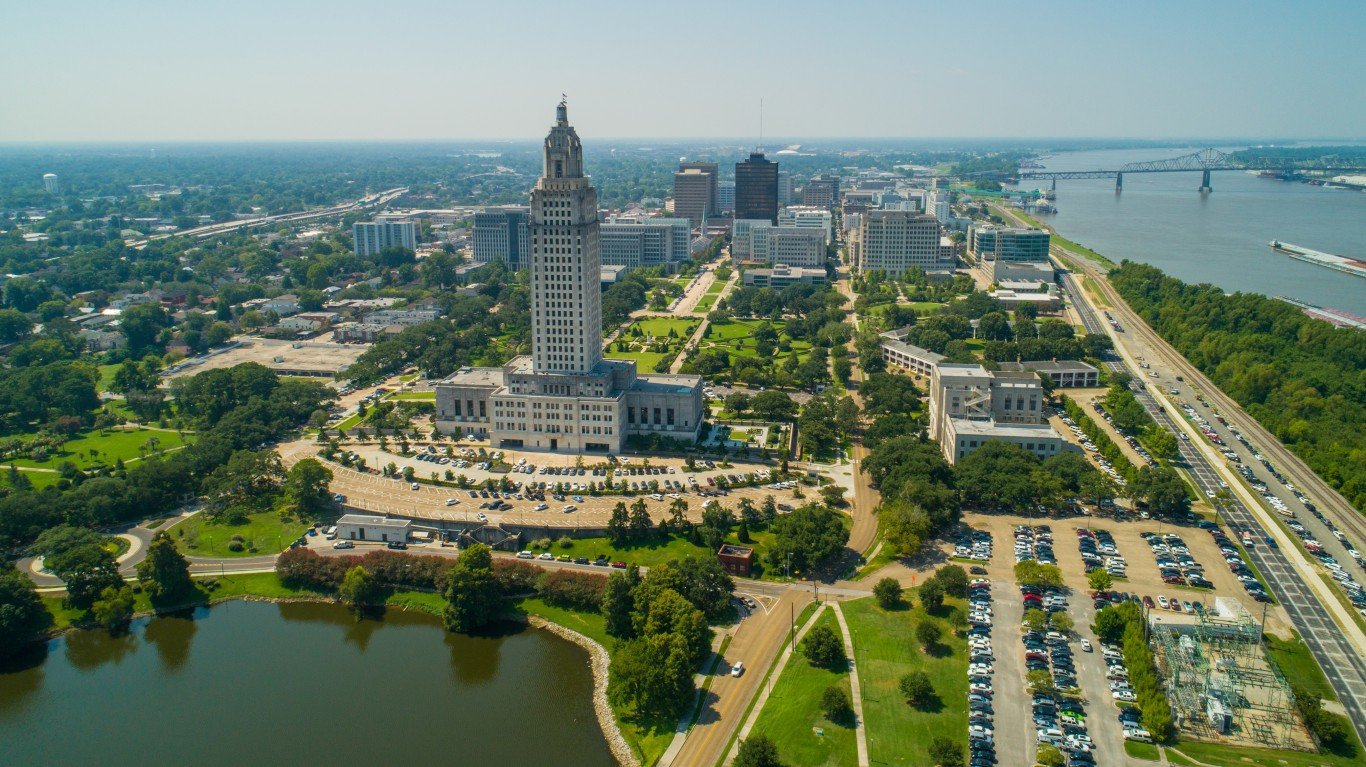
26. Baton Rouge, Louisiana
Source: felixmizioznikov / iStock via Getty Images
- Change in share of families in middle-income tracts, 2012 to 2022: -5.3 ppts.
- Change in share of families in upper-income tracts, 2012 to 2022: +3.4 ppts.
- Change in share of families in lower-income tracts, 2012 to 2022: +1.9 ppts.
- Median family income, 2022: $68,228
- Total population, 2022: 225,500
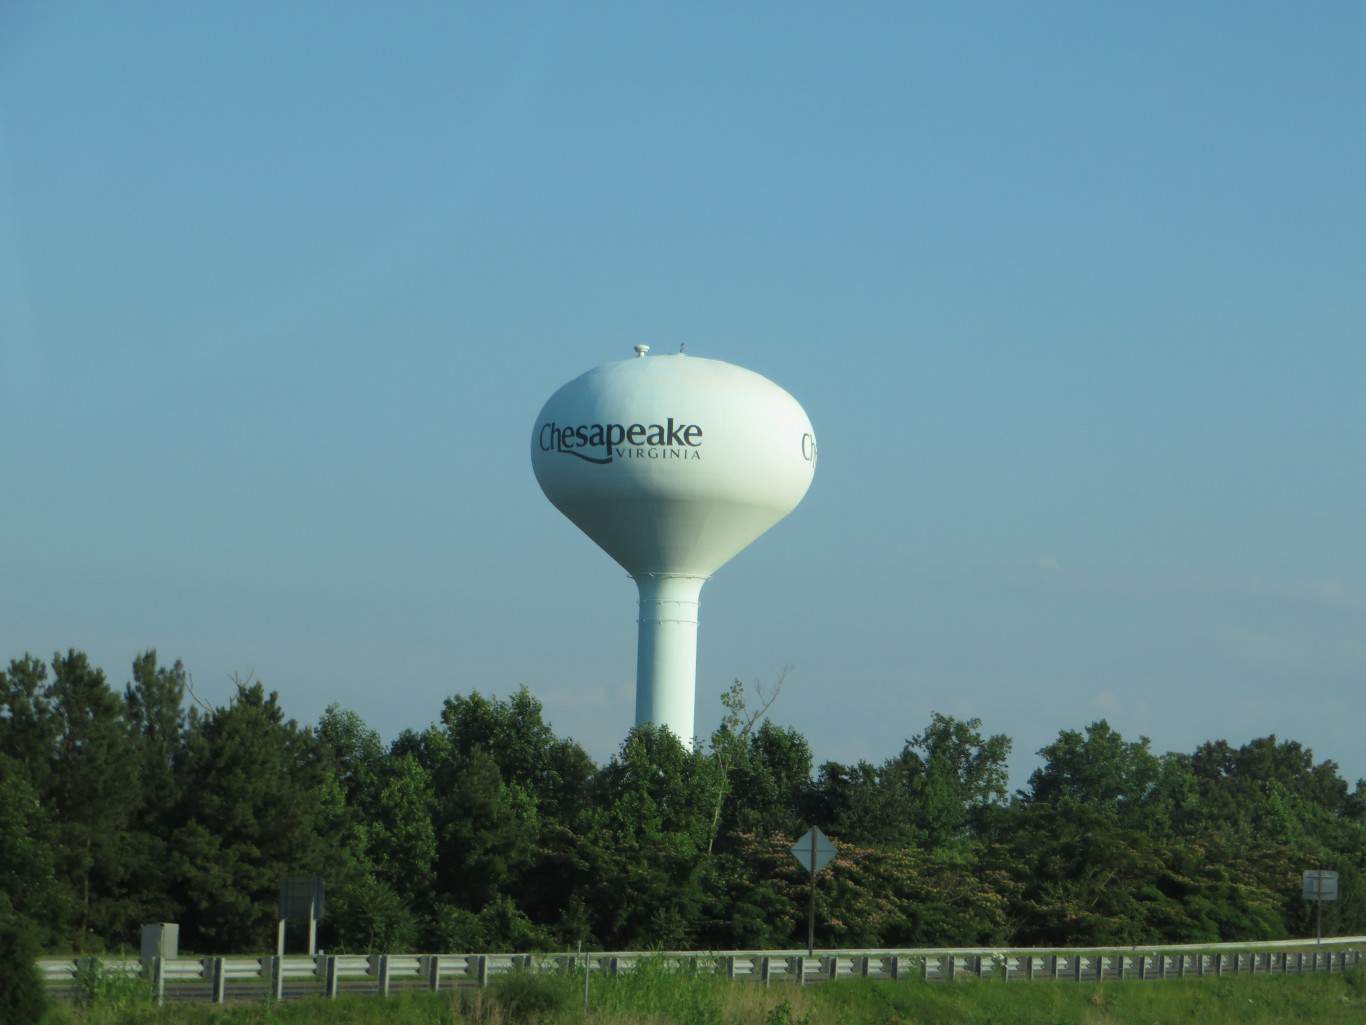
25. Chesapeake, Virginia
Source: kenlund / Flickr
- Change in share of families in middle-income tracts, 2012 to 2022: -5.4 ppts.
- Change in share of families in upper-income tracts, 2012 to 2022: +6.3 ppts.
- Change in share of families in lower-income tracts, 2012 to 2022: -0.9 ppts.
- Median family income, 2022: $109,923
- Total population, 2022: 249,377
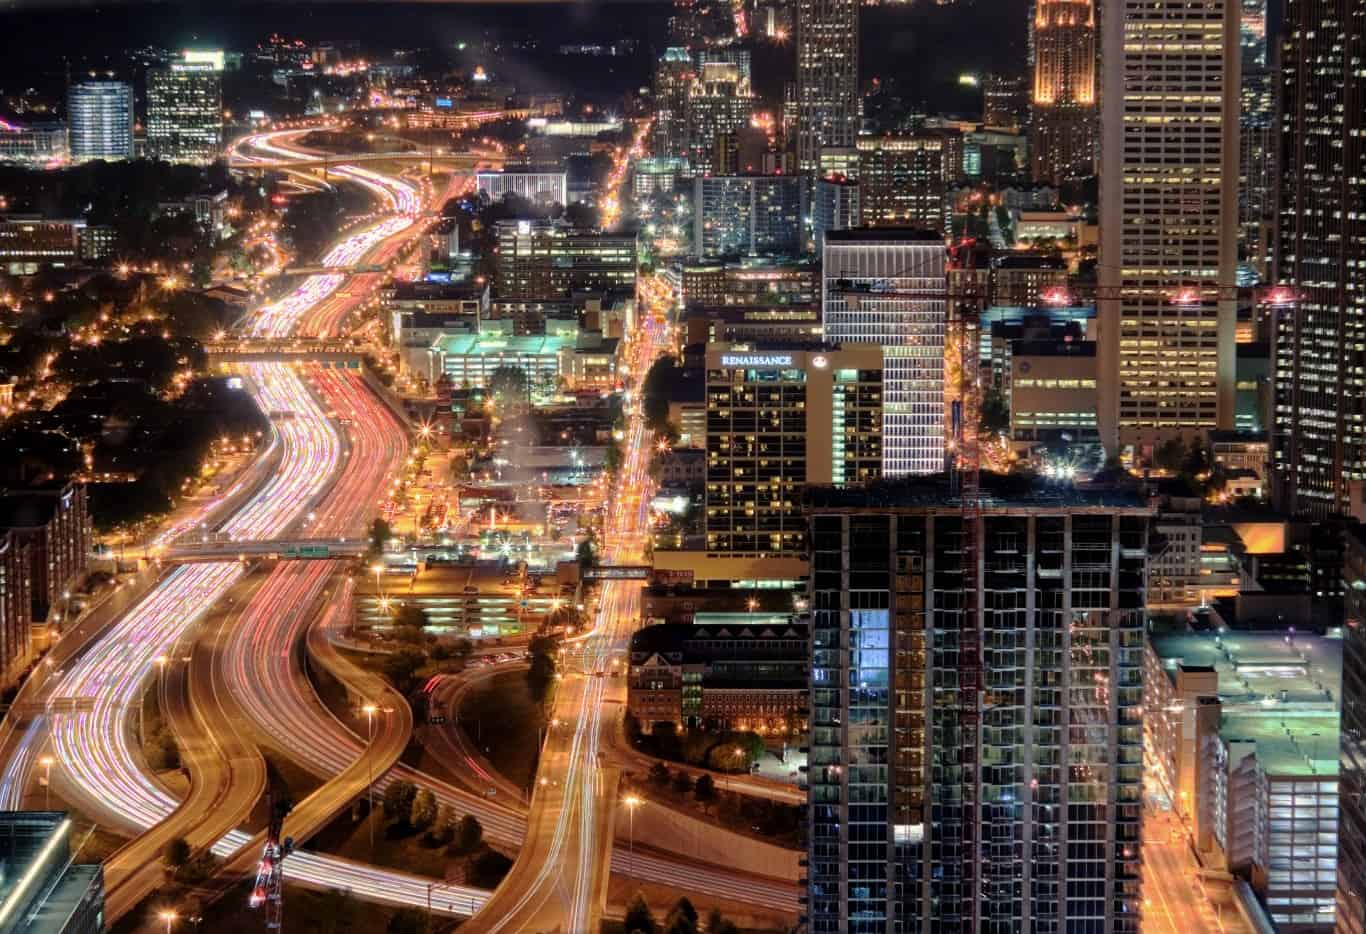
24. Atlanta, Georgia
Source: nrbelex / Flickr
- Change in share of families in middle-income tracts, 2012 to 2022: -5.6 ppts.
- Change in share of families in upper-income tracts, 2012 to 2022: +11.9 ppts.
- Change in share of families in lower-income tracts, 2012 to 2022: -6.3 ppts.
- Median family income, 2022: $103,886
- Total population, 2022: 494,838
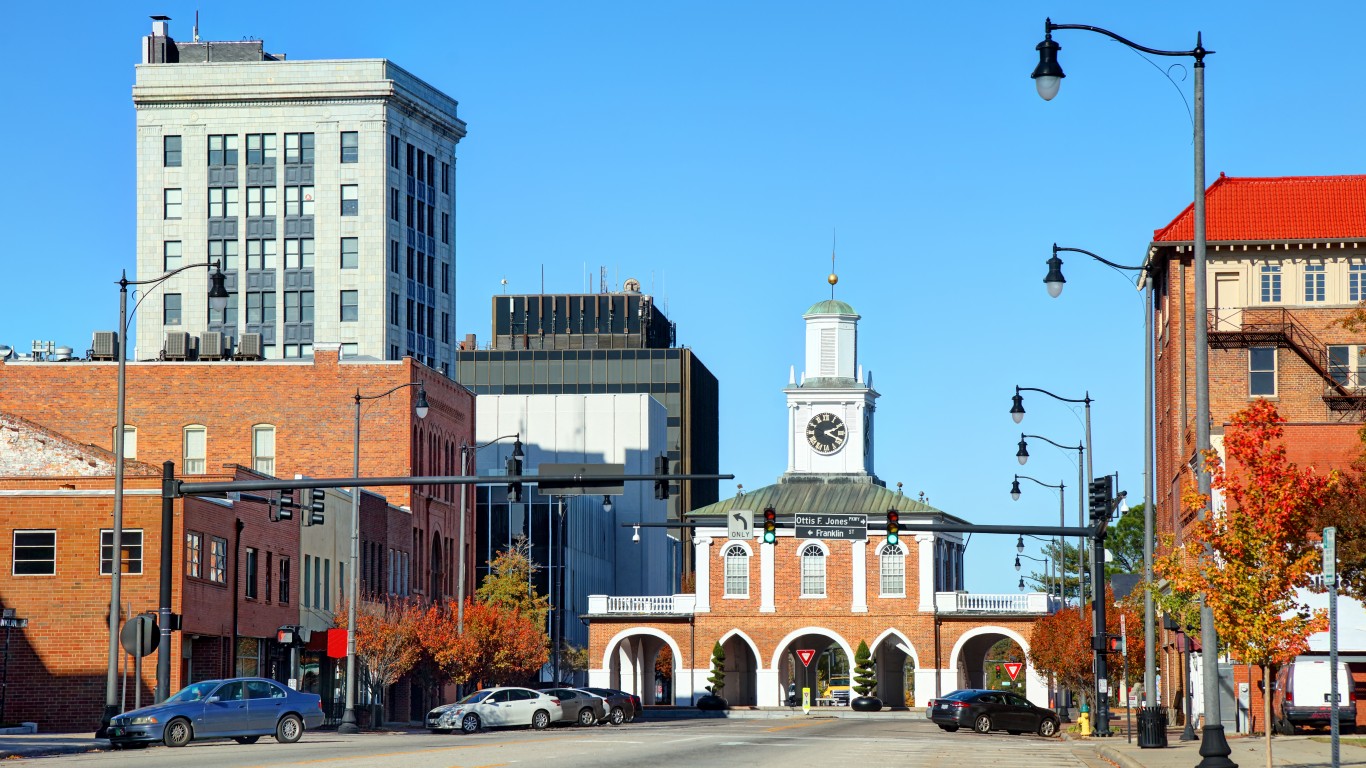
23. Fayetteville, North Carolina
Source: DenisTangneyJr / iStock via Getty Images
- Change in share of families in middle-income tracts, 2012 to 2022: -5.7 ppts.
- Change in share of families in upper-income tracts, 2012 to 2022: +8.4 ppts.
- Change in share of families in lower-income tracts, 2012 to 2022: -2.8 ppts.
- Median family income, 2022: $63,485
- Total population, 2022: 208,697
22. Corpus Christi, Texas
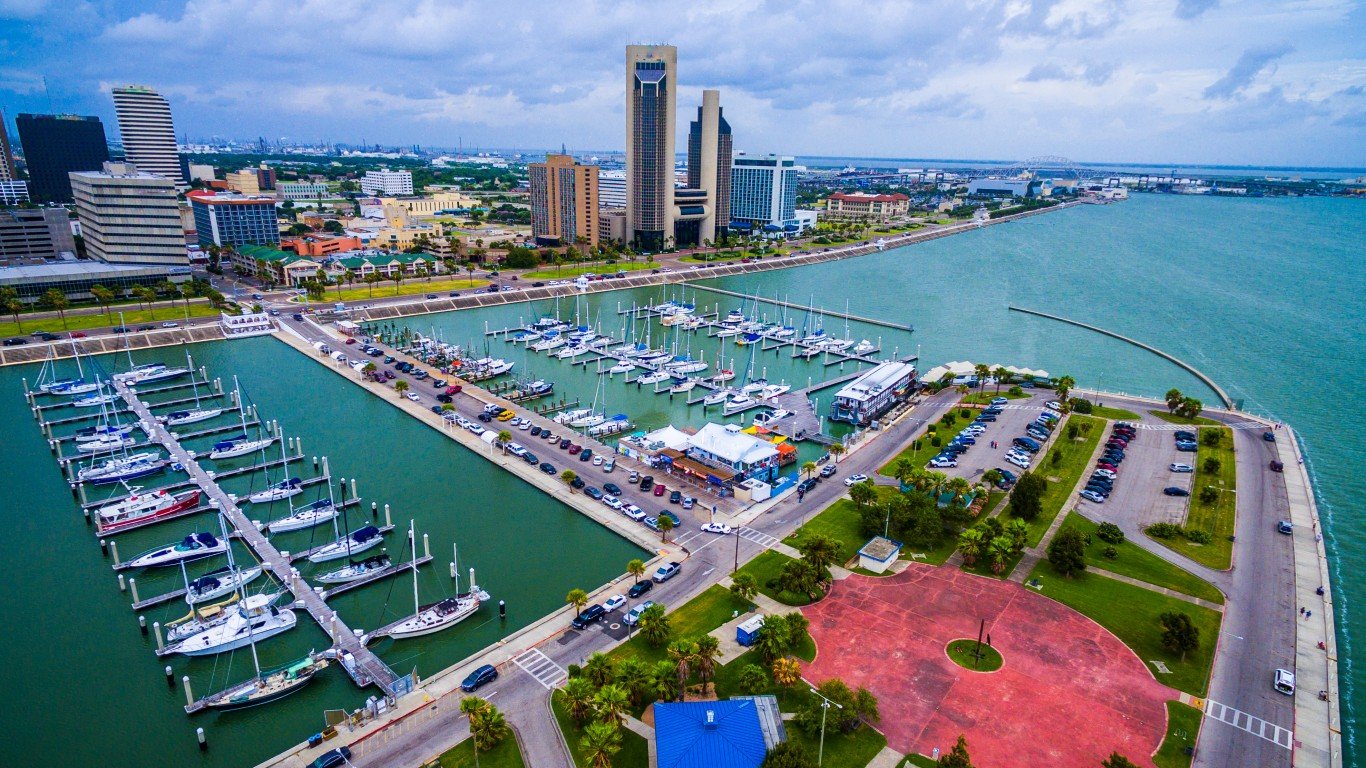
Source: RoschetzkyIstockPhoto / iStock via Getty Images
- Change in share of families in middle-income tracts, 2012 to 2022: -6.0 ppts.
- Change in share of families in upper-income tracts, 2012 to 2022: +3.5 ppts.
- Change in share of families in lower-income tracts, 2012 to 2022: +2.5 ppts.
- Median family income, 2022: $78,428
- Total population, 2022: 317,804
21. Amarillo, Texas
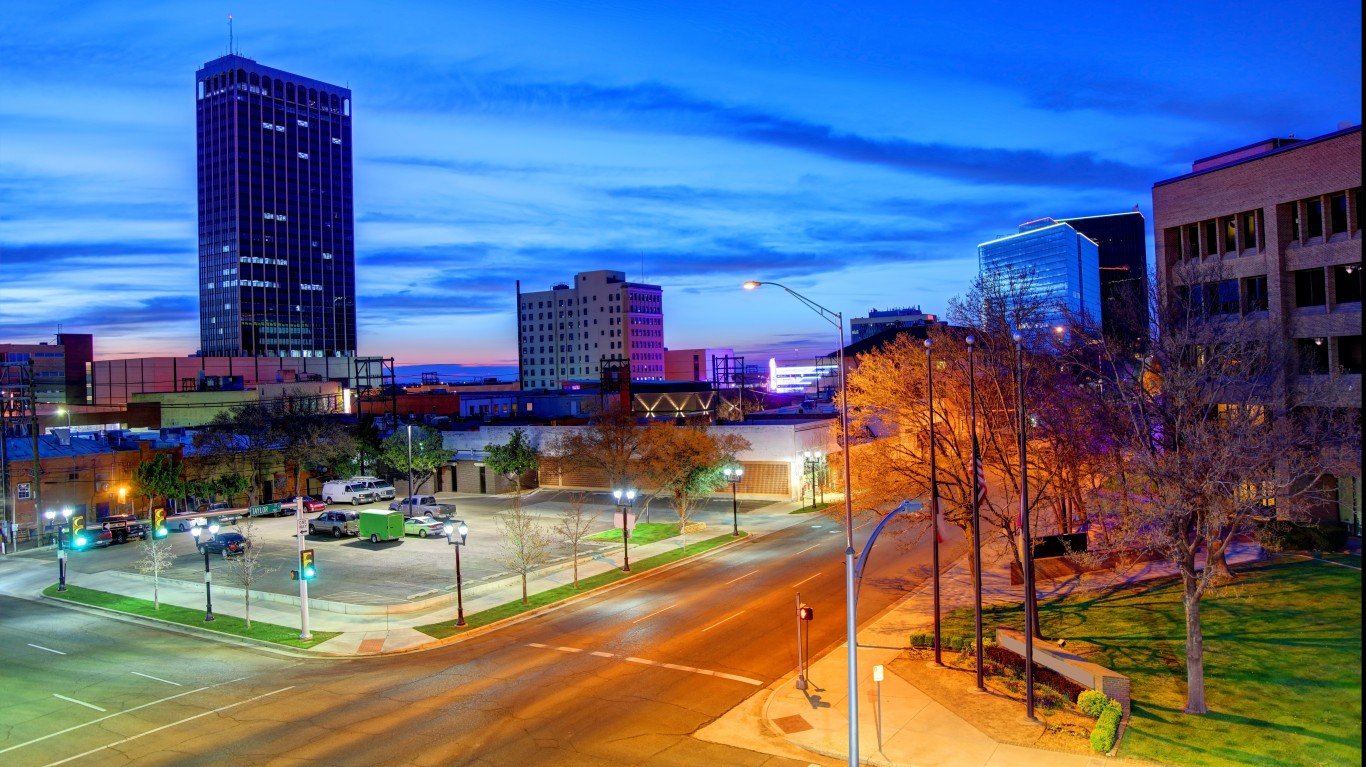
Source: DenisTangneyJr / iStock via Getty Images
- Change in share of families in middle-income tracts, 2012 to 2022: -6.7 ppts.
- Change in share of families in upper-income tracts, 2012 to 2022: -0.2 ppts.
- Change in share of families in lower-income tracts, 2012 to 2022: +6.9 ppts.
- Median family income, 2022: $76,749
- Total population, 2022: 200,360
20. Henderson, Nevada
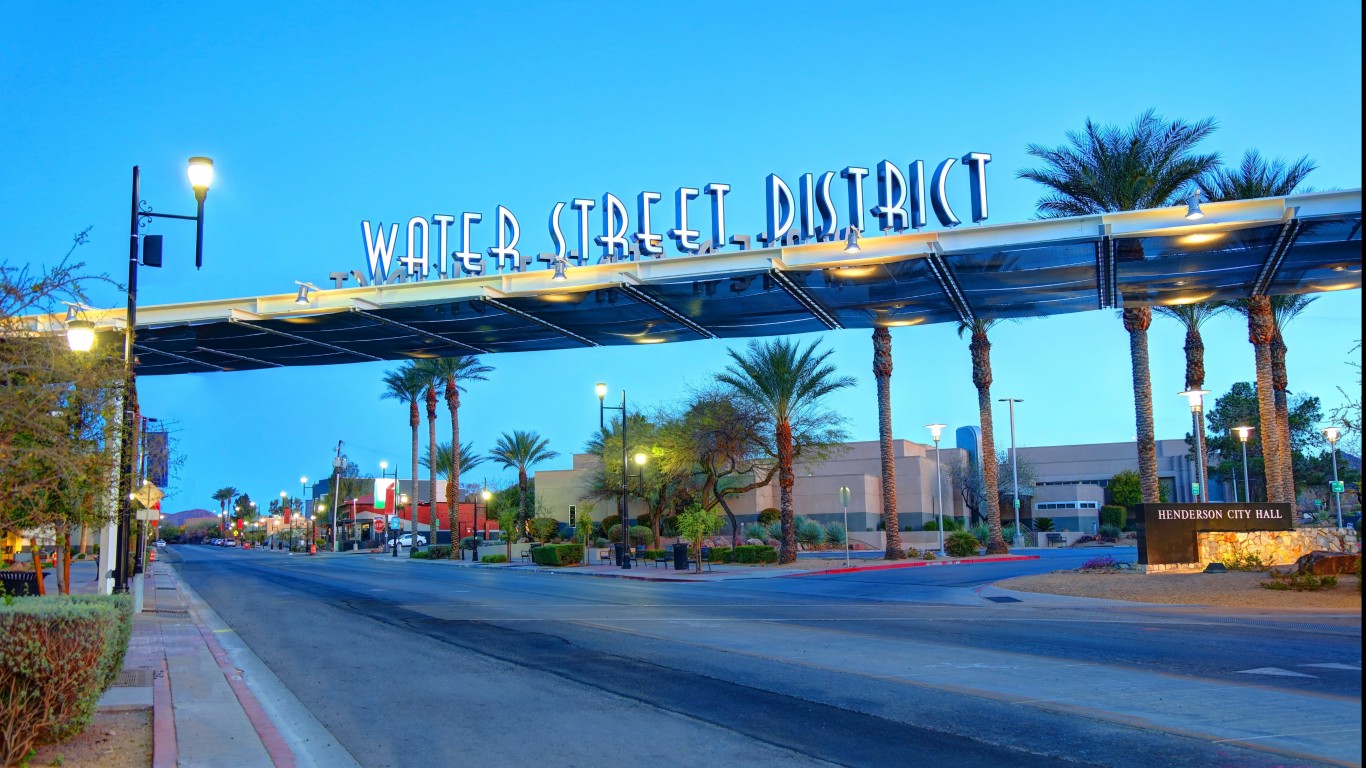
Source: DenisTangneyJr / iStock via Getty Images
- Change in share of families in middle-income tracts, 2012 to 2022: -8.1 ppts.
- Change in share of families in upper-income tracts, 2012 to 2022: +0.0 ppts.
- Change in share of families in lower-income tracts, 2012 to 2022: +8.0 ppts.
- Median family income, 2022: $100,794
- Total population, 2022: 318,063
19. Santa Ana, California
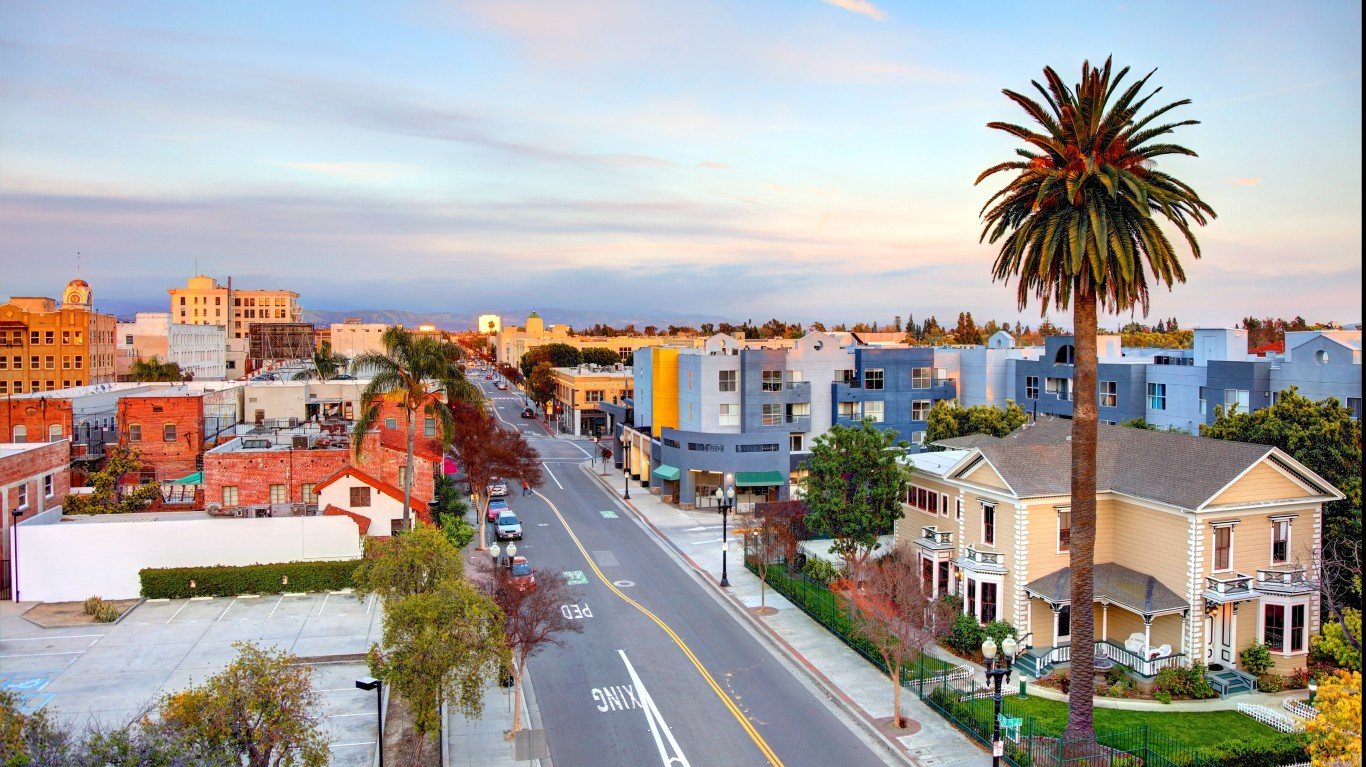
Source: DenisTangneyJr / iStock via Getty Images
- Change in share of families in middle-income tracts, 2012 to 2022: -8.3 ppts.
- Change in share of families in upper-income tracts, 2012 to 2022: +2.3 ppts.
- Change in share of families in lower-income tracts, 2012 to 2022: +6.0 ppts.
- Median family income, 2022: $83,689
- Total population, 2022: 311,379
18. Newport News, Virginia

Source: Davel5957 / iStock Unreleased via Getty Images
- Change in share of families in middle-income tracts, 2012 to 2022: -8.8 ppts.
- Change in share of families in upper-income tracts, 2012 to 2022: +0.8 ppts.
- Change in share of families in lower-income tracts, 2012 to 2022: +8.0 ppts.
- Median family income, 2022: $77,483
- Total population, 2022: 185,118
17. Hialeah, Florida
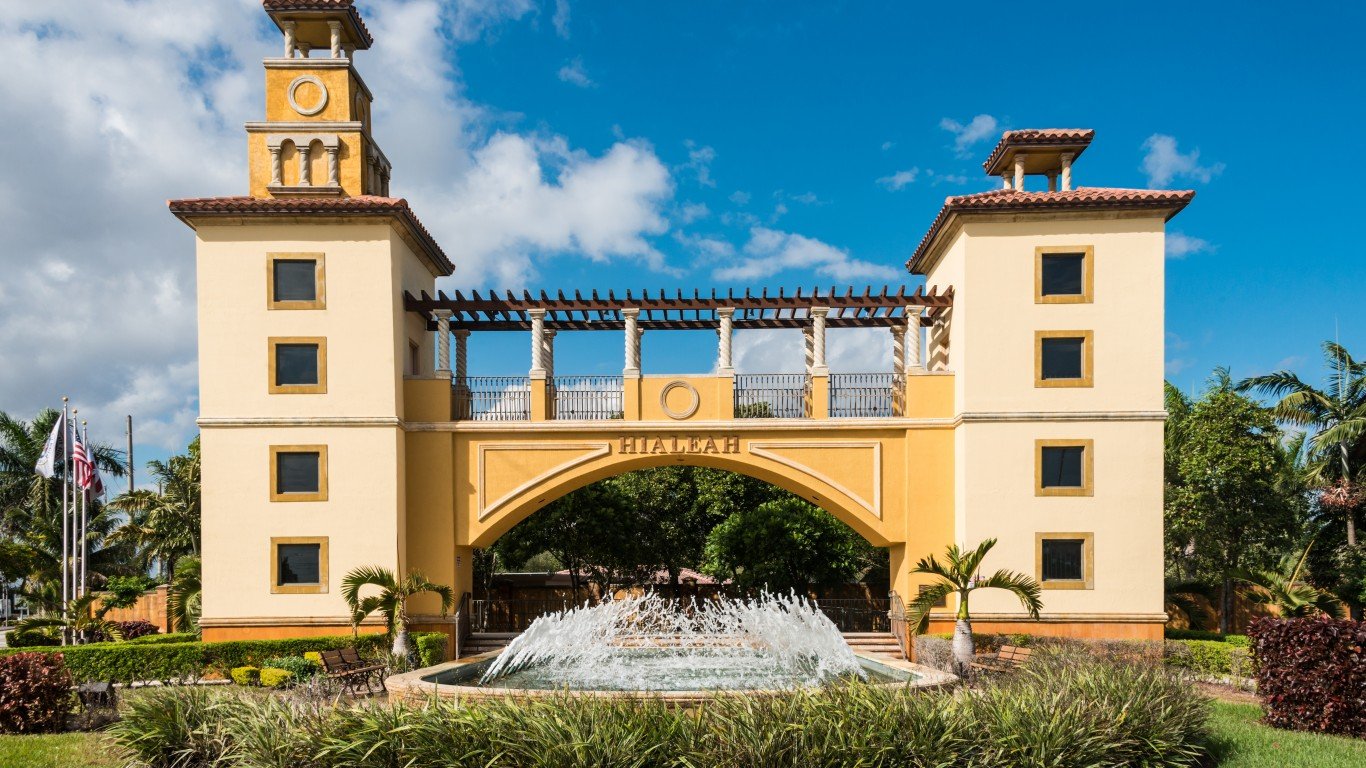
Source: Juanmonino / iStock via Getty Images
- Change in share of families in middle-income tracts, 2012 to 2022: -9.0 ppts.
- Change in share of families in upper-income tracts, 2012 to 2022: +9.5 ppts.
- Change in share of families in lower-income tracts, 2012 to 2022: -0.5 ppts.
- Median family income, 2022: $55,066
- Total population, 2022: 222,996
16. Augusta, Georgia
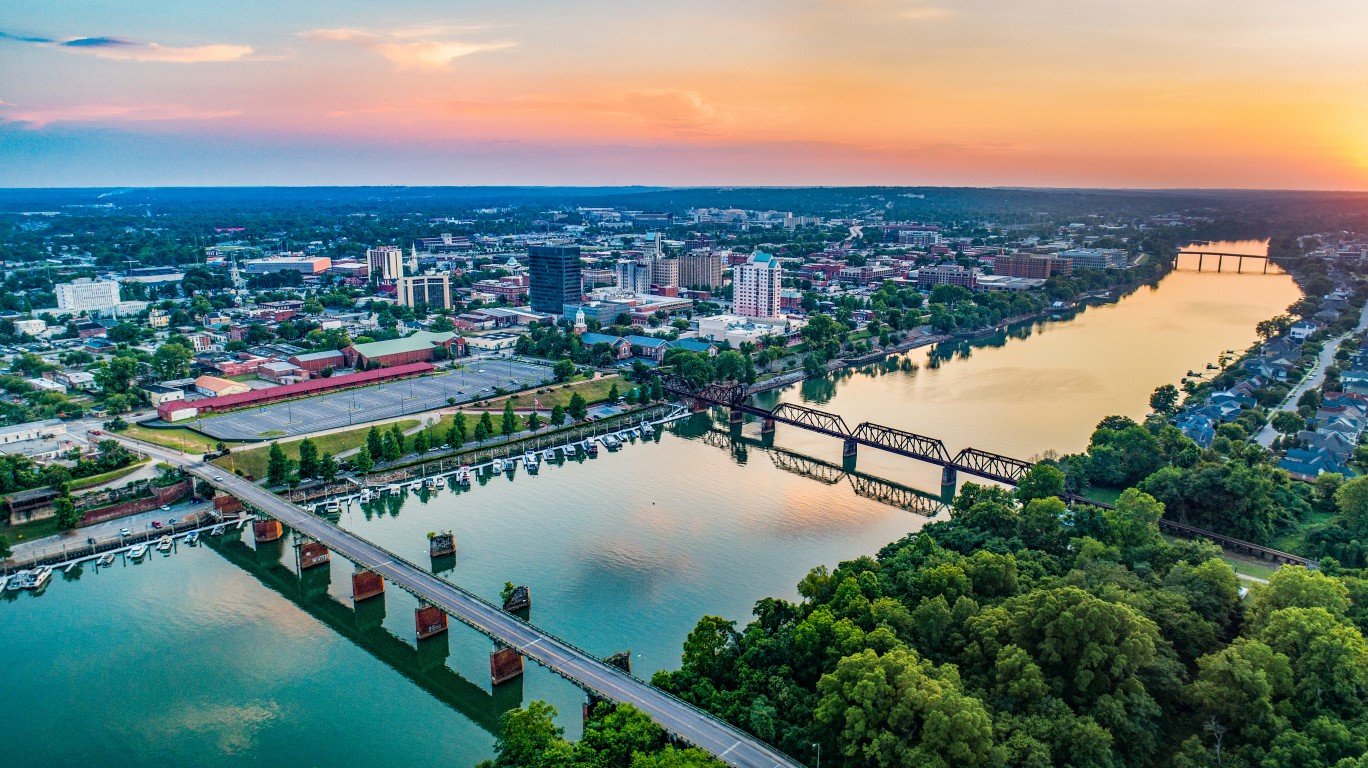
Source: Kruck20 / iStock via Getty Images
- Change in share of families in middle-income tracts, 2012 to 2022: -10.0 ppts.
- Change in share of families in upper-income tracts, 2012 to 2022: -0.4 ppts.
- Change in share of families in lower-income tracts, 2012 to 2022: +10.4 ppts.
- Median family income, 2022: $60,664
- Total population, 2022: 201,615
15. Tulsa, Oklahoma

Source: Davel5957 / E+ via Getty Images
- Change in share of families in middle-income tracts, 2012 to 2022: -10.0 ppts.
- Change in share of families in upper-income tracts, 2012 to 2022: +2.7 ppts.
- Change in share of families in lower-income tracts, 2012 to 2022: +7.4 ppts.
- Median family income, 2022: $74,430
- Total population, 2022: 411,938
14. Irvine, California
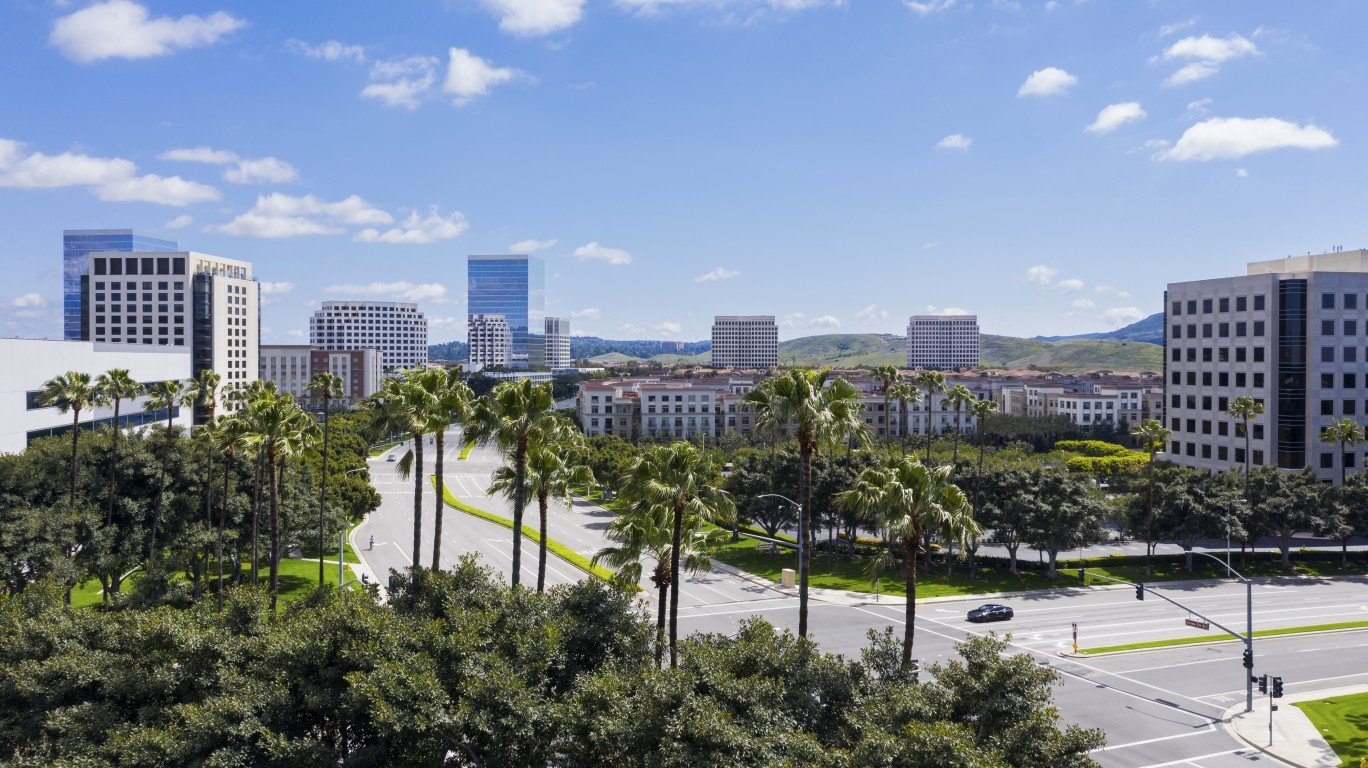
Source: MattGush / iStock via Getty Images
- Change in share of families in middle-income tracts, 2012 to 2022: -10.2 ppts.
- Change in share of families in upper-income tracts, 2012 to 2022: +3.3 ppts.
- Change in share of families in lower-income tracts, 2012 to 2022: +6.9 ppts.
- Median family income, 2022: $153,615
- Total population, 2022: 304,527
13. Sunnyvale, California
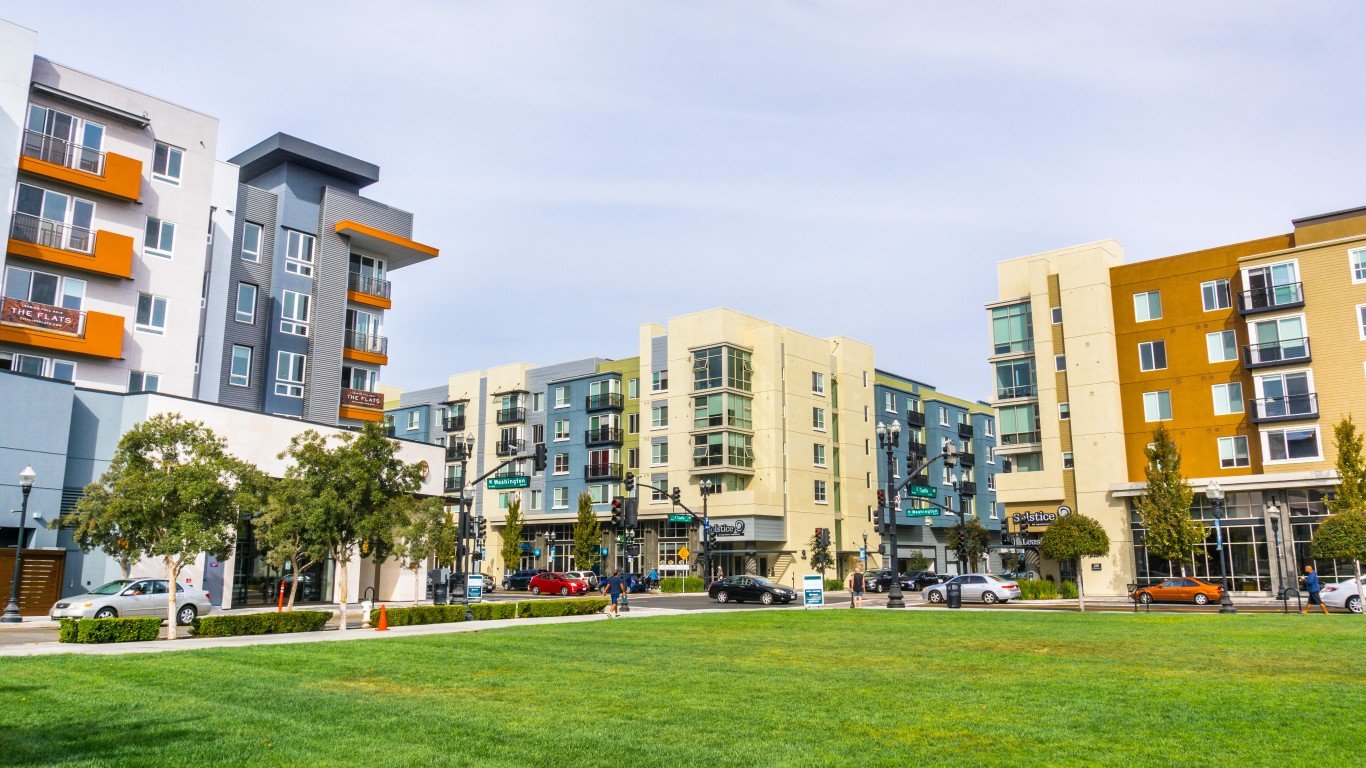
Source: Sundry Photography / iStock Editorial via Getty Images
- Change in share of families in middle-income tracts, 2012 to 2022: -10.4 ppts.
- Change in share of families in upper-income tracts, 2012 to 2022: -3.2 ppts.
- Change in share of families in lower-income tracts, 2012 to 2022: +13.5 ppts.
- Median family income, 2022: $190,031
- Total population, 2022: 154,573
12. Oxnard, California
Source: benedek / iStock via Getty Images
- Change in share of families in middle-income tracts, 2012 to 2022: -11.3 ppts.
- Change in share of families in upper-income tracts, 2012 to 2022: +0.5 ppts.
- Change in share of families in lower-income tracts, 2012 to 2022: +10.8 ppts.
- Median family income, 2022: $89,908
- Total population, 2022: 202,279
11. Tampa, Florida
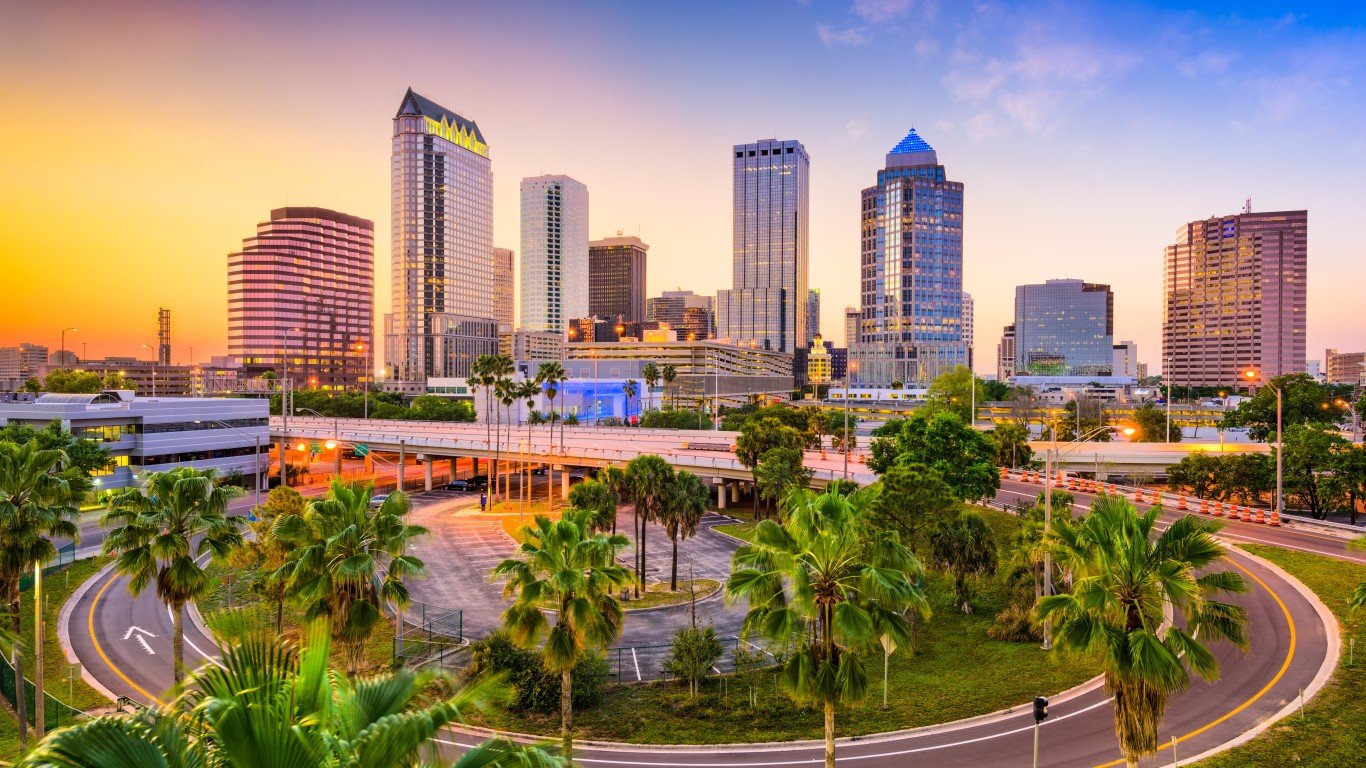
Source: SeanPavonePhoto / iStock via Getty Images
- Change in share of families in middle-income tracts, 2012 to 2022: -11.6 ppts.
- Change in share of families in upper-income tracts, 2012 to 2022: +11.0 ppts.
- Change in share of families in lower-income tracts, 2012 to 2022: +0.6 ppts.
- Median family income, 2022: $84,185
- Total population, 2022: 388,768
10. Urban Honolulu, Hawaii
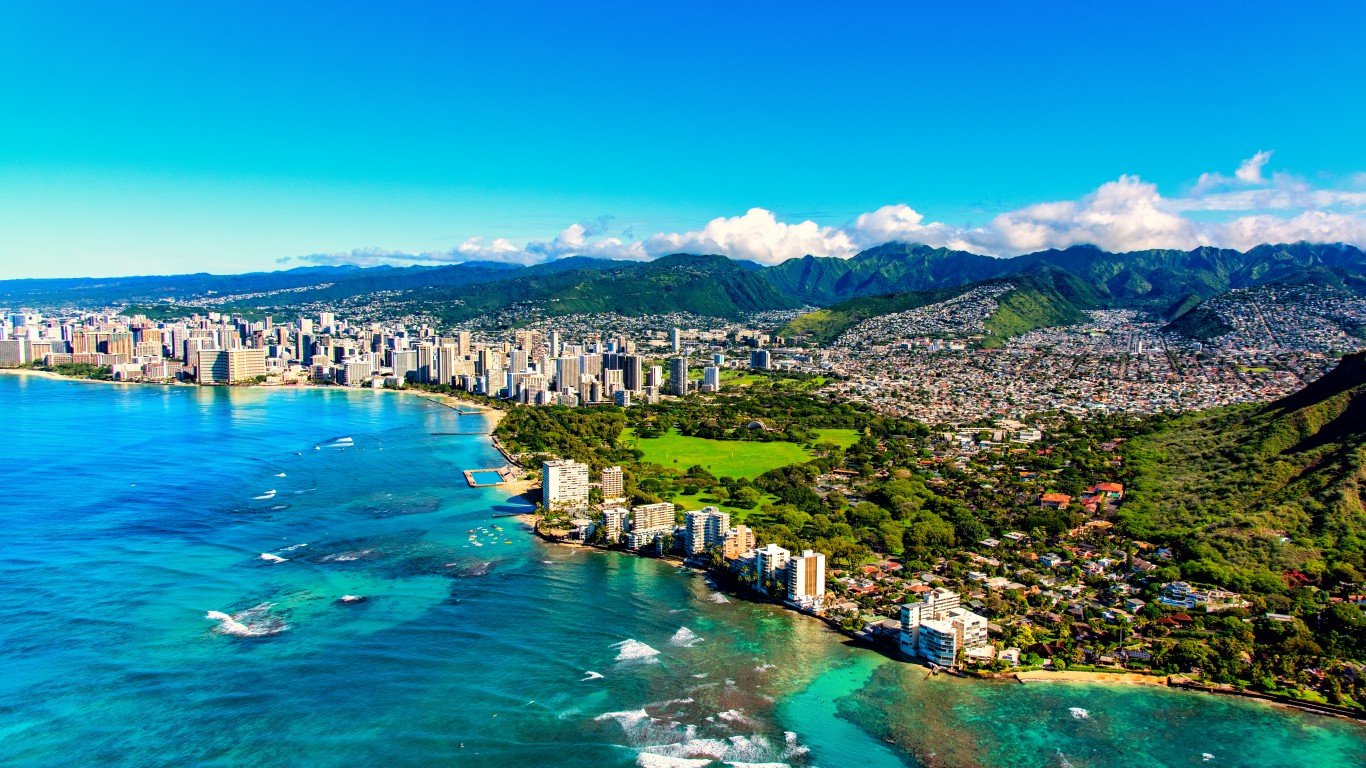
Source: Art Wager / iStock via Getty Images
- Change in share of families in middle-income tracts, 2012 to 2022: -12.1 ppts.
- Change in share of families in upper-income tracts, 2012 to 2022: +8.1 ppts.
- Change in share of families in lower-income tracts, 2012 to 2022: +4.0 ppts.
- Median family income, 2022: $106,192
- Total population, 2022: 348,547
9. Paradise, Nevada

Source: f11photo / iStock via Getty Images
- Change in share of families in middle-income tracts, 2012 to 2022: -12.5 ppts.
- Change in share of families in upper-income tracts, 2012 to 2022: +13.8 ppts.
- Change in share of families in lower-income tracts, 2012 to 2022: -1.3 ppts.
- Median family income, 2022: $68,168
- Total population, 2022: 189,733
8. Anchorage, Alaska
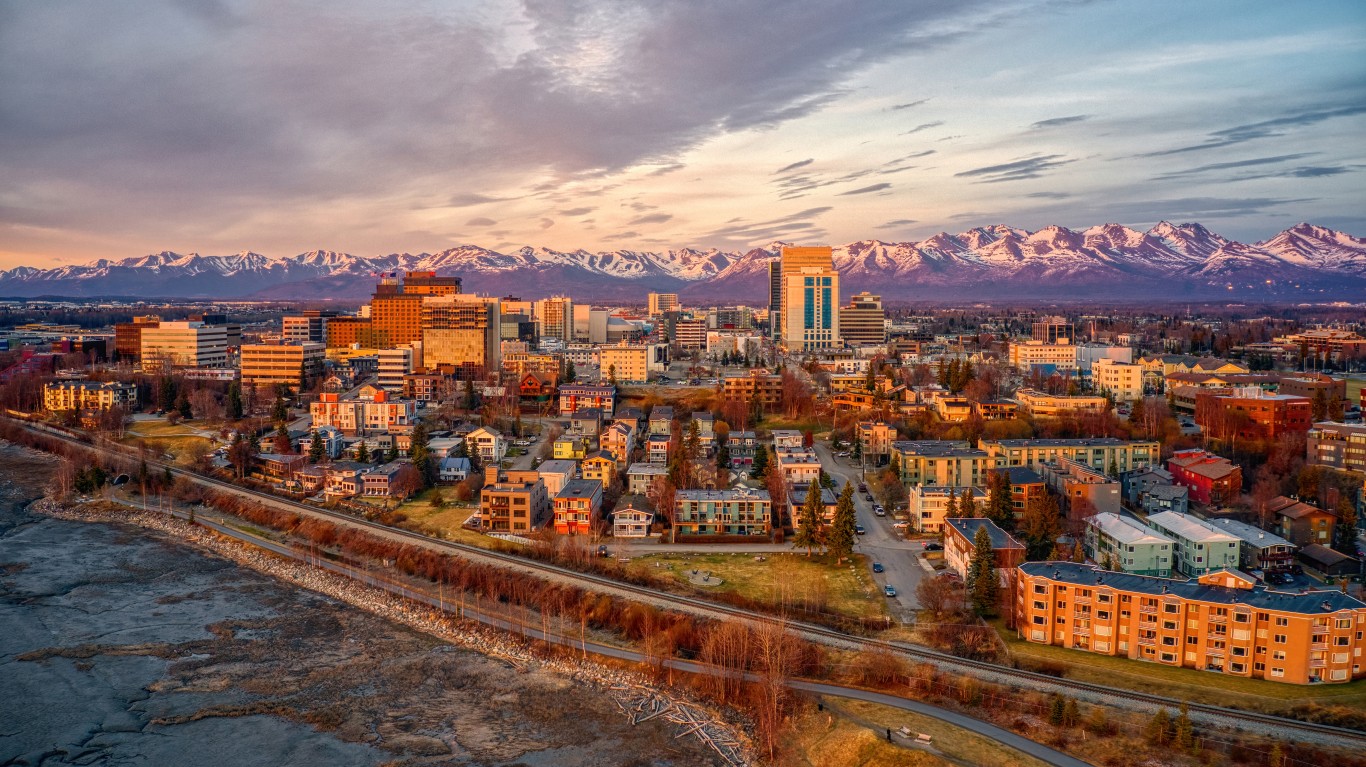
Source: Jacob Boomsma / iStock via Getty Images
- Change in share of families in middle-income tracts, 2012 to 2022: -12.7 ppts.
- Change in share of families in upper-income tracts, 2012 to 2022: +9.4 ppts.
- Change in share of families in lower-income tracts, 2012 to 2022: +3.3 ppts.
- Median family income, 2022: $115,272
- Total population, 2022: 290,674
7. Paterson, New Jersey
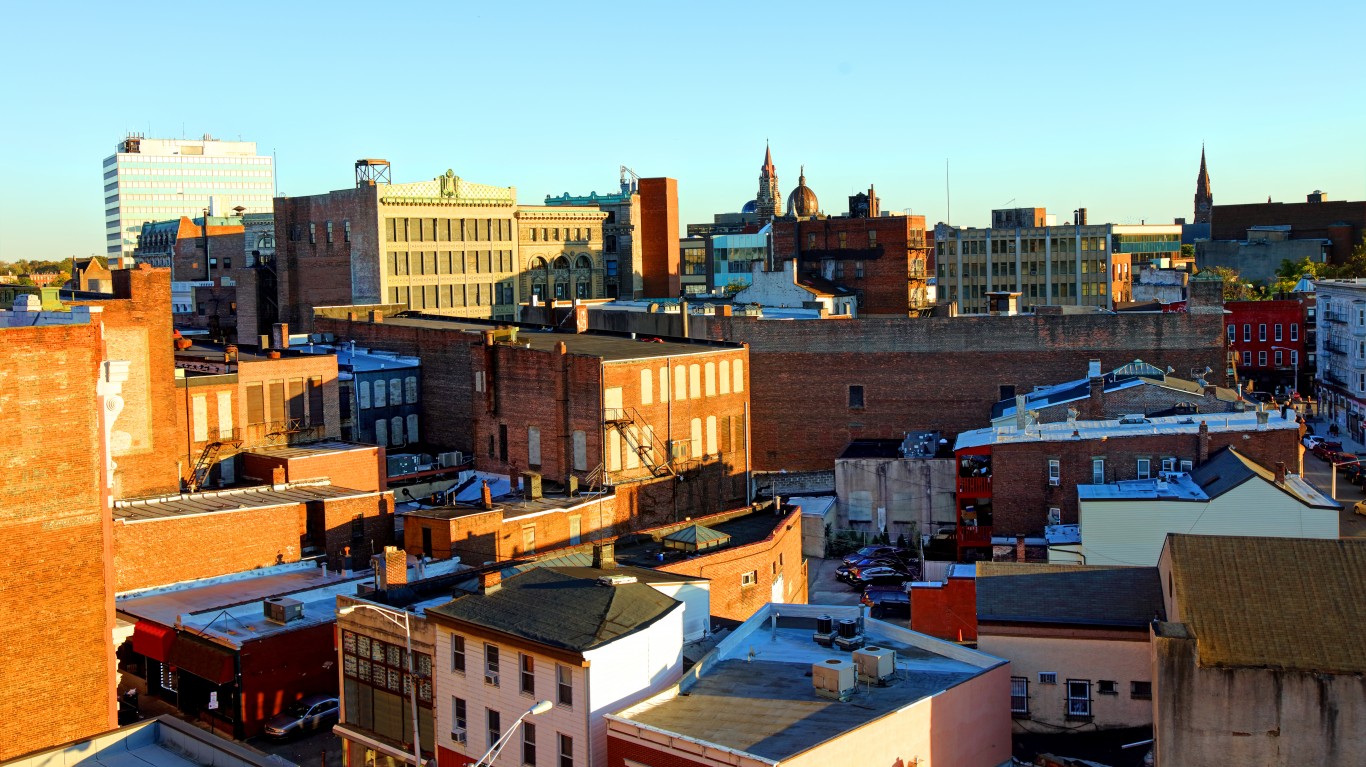
Source: DenisTangneyJr / iStock via Getty Images
- Change in share of families in middle-income tracts, 2012 to 2022: -12.8 ppts.
- Change in share of families in upper-income tracts, 2012 to 2022: +4.4 ppts.
- Change in share of families in lower-income tracts, 2012 to 2022: +8.4 ppts.
- Median family income, 2022: $59,976
- Total population, 2022: 157,864
6. Orlando, Florida

Source: squirrel02 / Flickr
- Change in share of families in middle-income tracts, 2012 to 2022: -12.9 ppts.
- Change in share of families in upper-income tracts, 2012 to 2022: +6.5 ppts.
- Change in share of families in lower-income tracts, 2012 to 2022: +6.4 ppts.
- Median family income, 2022: $74,980
- Total population, 2022: 307,738
5. Clarksville, Tennessee
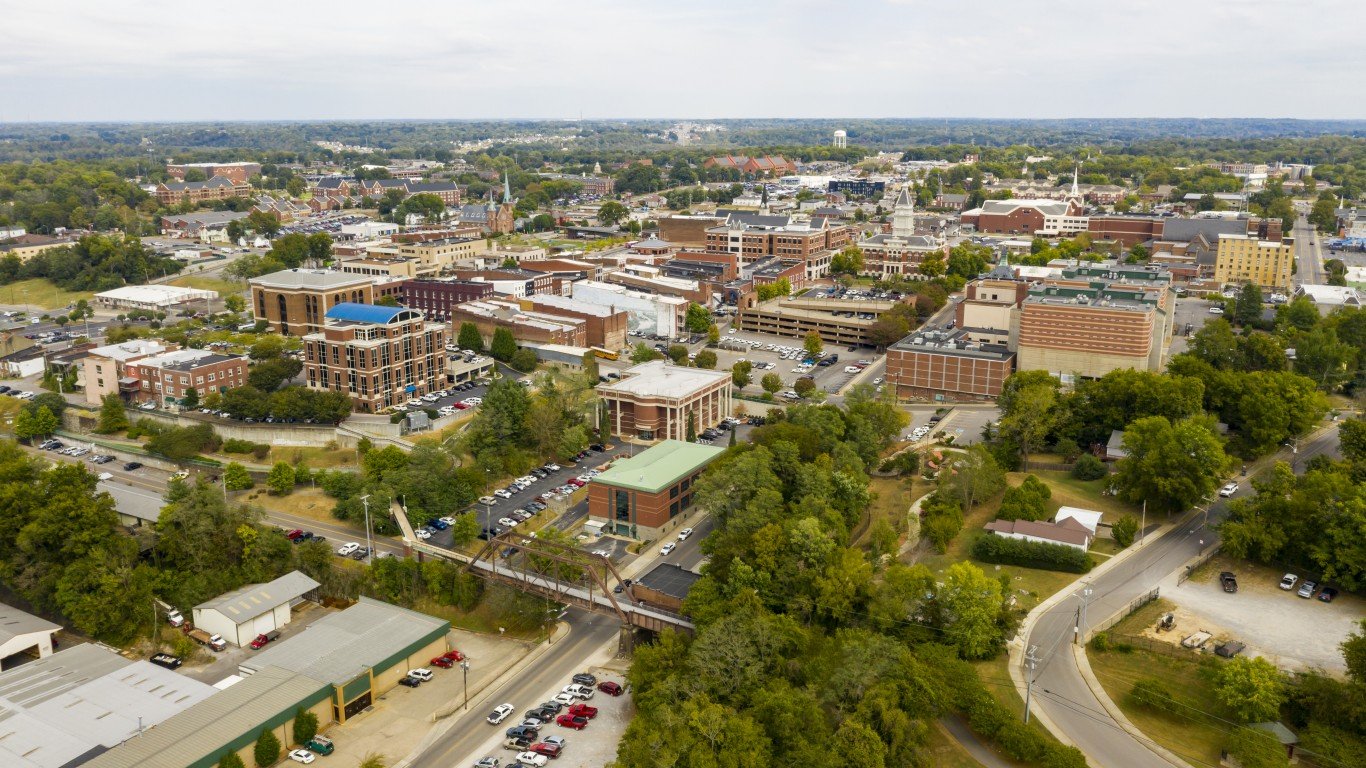
Source: ChrisBoswell / iStock via Getty Images
- Change in share of families in middle-income tracts, 2012 to 2022: -14.0 ppts.
- Change in share of families in upper-income tracts, 2012 to 2022: +5.8 ppts.
- Change in share of families in lower-income tracts, 2012 to 2022: +8.3 ppts.
- Median family income, 2022: $73,333
- Total population, 2022: 167,882
4. Laredo, Texas
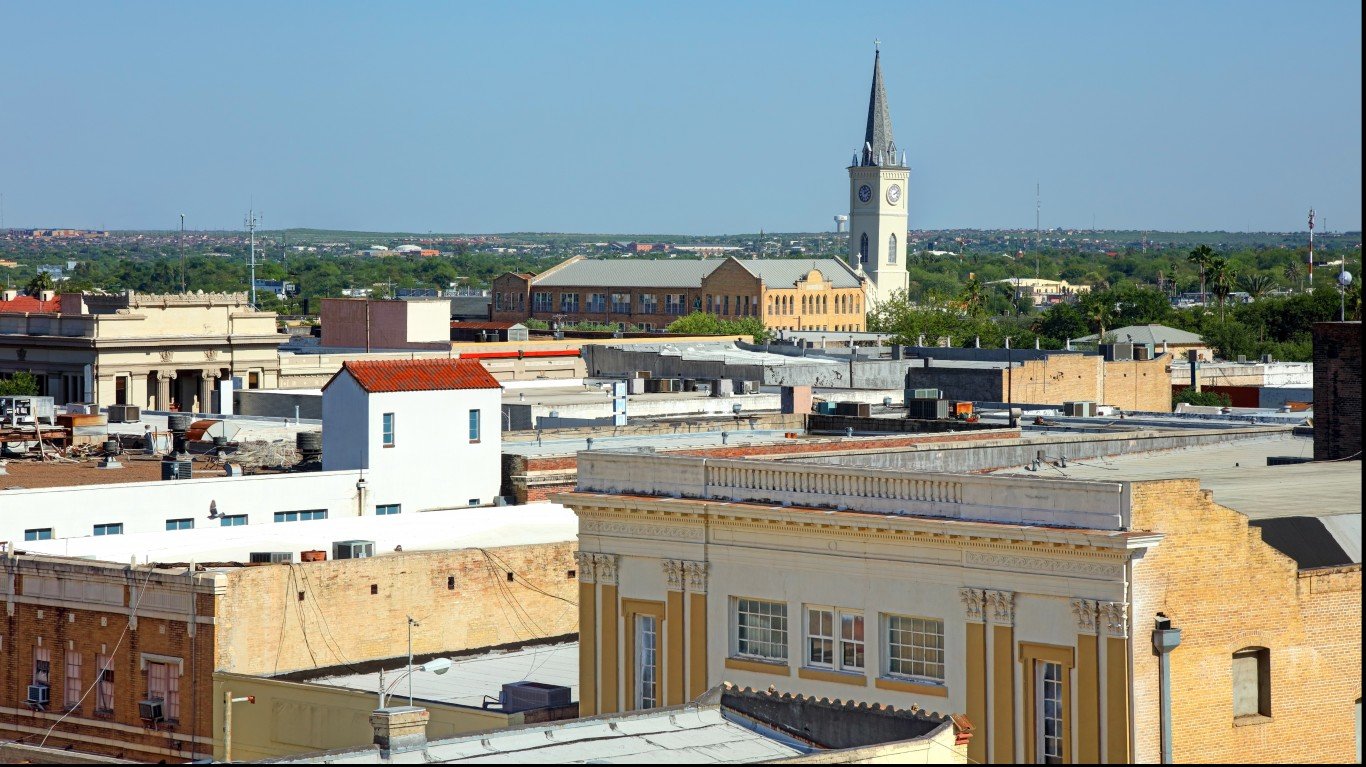
Source: DenisTangneyJr / iStock via Getty Images
- Change in share of families in middle-income tracts, 2012 to 2022: -15.6 ppts.
- Change in share of families in upper-income tracts, 2012 to 2022: +5.4 ppts.
- Change in share of families in lower-income tracts, 2012 to 2022: +10.2 ppts.
- Median family income, 2022: $66,315
- Total population, 2022: 255,293
3. Fort Lauderdale, Florida
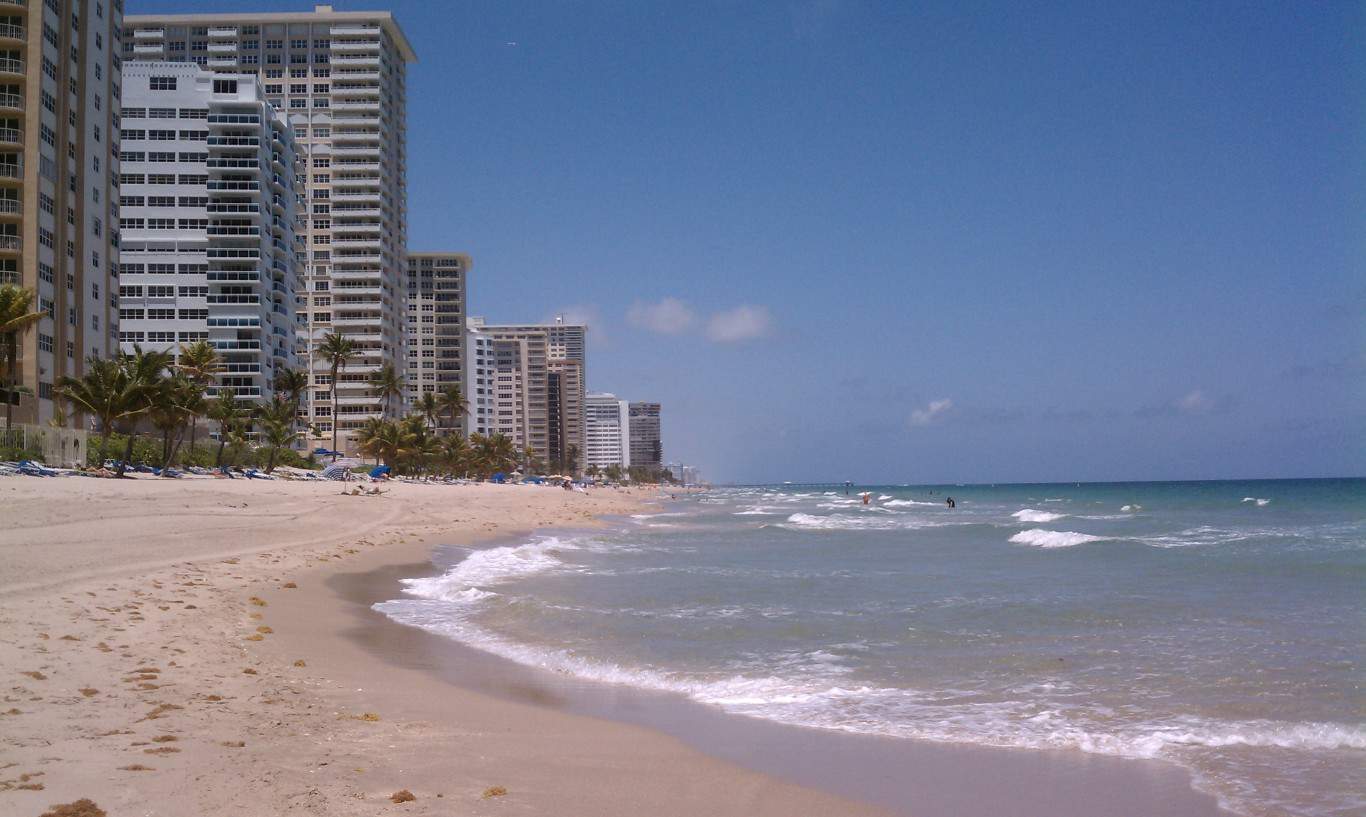
Source: epitomized / Flickr
- Change in share of families in middle-income tracts, 2012 to 2022: -16.6 ppts.
- Change in share of families in upper-income tracts, 2012 to 2022: +9.3 ppts.
- Change in share of families in lower-income tracts, 2012 to 2022: +7.3 ppts.
- Median family income, 2022: $87,676
- Total population, 2022: 182,673
2. Murfreesboro, Tennessee
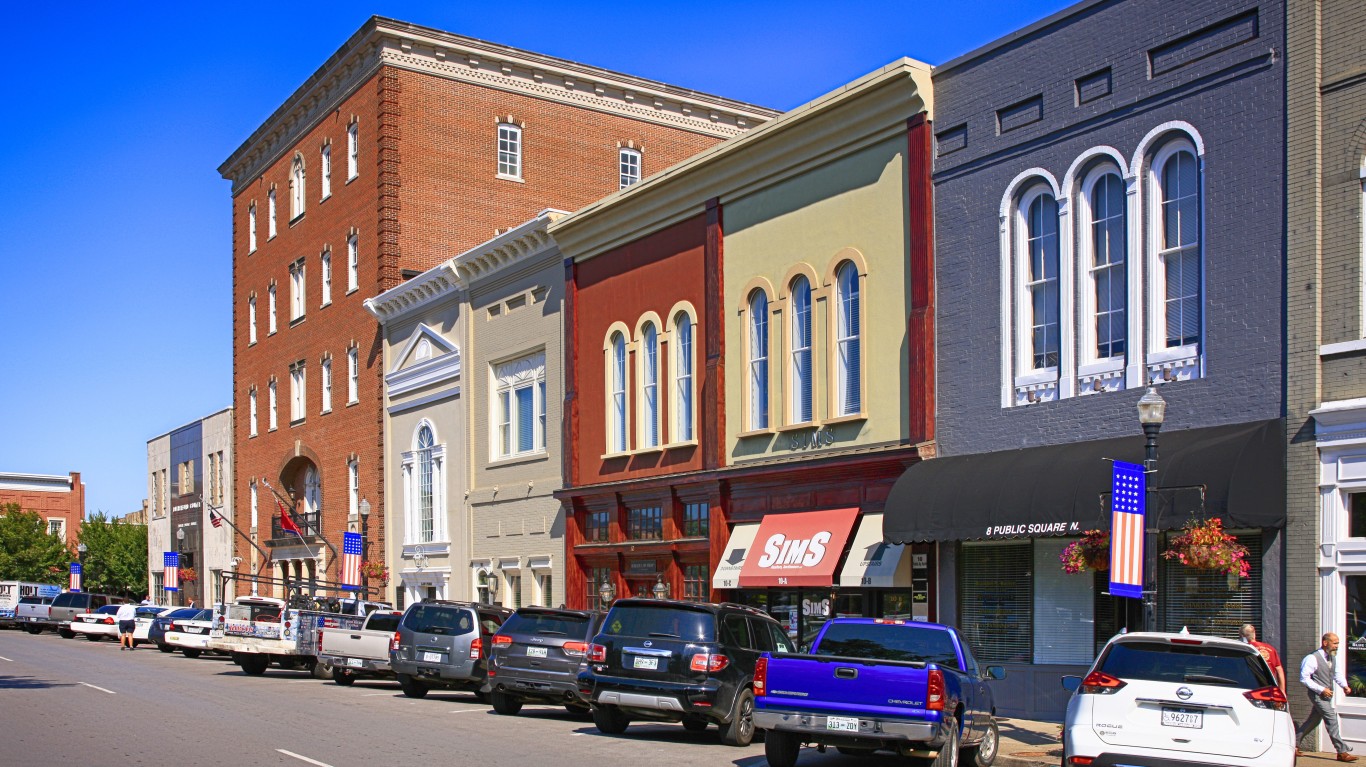
Source: csfotoimages / iStock Editorial via Getty Images
- Change in share of families in middle-income tracts, 2012 to 2022: -16.7 ppts.
- Change in share of families in upper-income tracts, 2012 to 2022: +2.1 ppts.
- Change in share of families in lower-income tracts, 2012 to 2022: +14.6 ppts.
- Median family income, 2022: $90,863
- Total population, 2022: 153,487
1. Jersey City, New Jersey

Source: Darryl Brooks/Shutterstock
- Change in share of families in middle-income tracts, 2012 to 2022: -20.1 ppts.
- Change in share of families in upper-income tracts, 2012 to 2022: +10.4 ppts.
- Change in share of families in lower-income tracts, 2012 to 2022: +9.7 ppts.
- Median family income, 2022: $102,072
- Total population, 2022: 287,899
Take This Retirement Quiz To Get Matched With An Advisor Now (Sponsored)
Are you ready for retirement? Planning for retirement can be overwhelming, that’s why it could be a good idea to speak to a fiduciary financial advisor about your goals today.
Start by taking this retirement quiz right here from SmartAsset that will match you with up to 3 financial advisors that serve your area and beyond in 5 minutes. Smart Asset is now matching over 50,000 people a month.
Click here now to get started.
Thank you for reading! Have some feedback for us?
Contact the 24/7 Wall St. editorial team.
Editors' Picks