Investing

Earnings Previews: Farfetch, Gap, Workday

Gap shopping
Dimas Ardian / Getty Images News via Getty Images

The three major U.S. equity indexes closed mixed Tuesday. The Dow Jones industrials dropped 0.47%, the S&P 500 lost 0.22% and the Nasdaq closed flat. Seven of 11 sectors ended the day with losses, led by real estate (1.5%) and health care (1.4%). Energy stocks added 3.6% to lead the gainers. Yield on the 10-year Treasury note stayed above 3%. The three major indexes were trading higher shortly after Wednesday’s opening bell.

After markets closed Tuesday, Nordstrom reported earnings per share (EPS) that beat estimates by a penny and revenue 12% higher than in the prior-year quarter. The company expects gross margins to come under pressure in the second half of the year as it cleans up its inventory. That led to lowered revenue guidance and the stock traded down by around 16% in Wednesday’s premarket.

Toll Brothers missed the consensus revenue estimate but beat on profits. Deliveries were below guidance for the quarter, and the company also lowered full-year guidance on deliveries. The company also said that it saw a “significant” decline in demand during the quarter, but that demand appears to have improved in recent weeks. Shares traded down about 2.8%.

Urban Outfitters missed the consensus profit estimate and barely topped expected revenue. Higher markdowns lowered gross profit by nearly 6%. Shares traded up about 1.2%.

After markets close Wednesday, Nvidia, Salesforce, Snowflake and Splunk will report quarterly results, while Abercrombie & Fitch, Coty, Dollar Tree and Peloton step into the earnings spotlight before markets open on Thursday.

In addition to three companies we already have previewed (Affirm, Dell and Marvell), here are three more companies scheduled to report results later on Thursday.

Farfetch

London-based Farfetch Ltd. (NYSE: FTCH) operates an e-commerce marketplace for luxury fashion goods in the United States, the United Kingdom and elsewhere. Over the past 12 months, Farfetch stock is down about 80%.

Shares traded up more than 18% Wednesday morning following an announcement by luxury goods giant Richemont that it is selling its stake in another online retailer, Yoox Net-a-Porter, to Farfetch for 50 million Farfetch shares in exchange for a 47.5% stake in Yoox. Richemont will retain a 49.3% stake in the company and write down €2.7 billion in non-cash losses on the deal. At last night’s closing price of $7.84 for Farfetch stock, the deal is valued at around $380 million. The deal is expected to close next year.

Despite its disappointing valuation, analysts remain quite bullish on Farfetch, with 14 of 22 having a Buy or Strong Buy rating. The other eight rate the stock at Hold. At a recent price of $7.84 per share, the upside based on a median price target of $18.35 is about 134%. At the high price target of $40.00, the upside potential is 410%.


Revenue for the second quarter of fiscal 2023 is forecast at $566.53 million. That would be up about 10% sequentially and by 8.3% year over year. Analysts are expecting an adjusted loss per share of $0.25, compared to the prior quarter’s loss of $0.24, and worse than the loss in the year-ago quarter of $0.17 per share. For the full fiscal year, current estimates call for an adjusted loss per share of $0.73, compared to last year’s loss of $0.55 per share, on sales of $2.49 billion, up 10.2%.

Farfetch is not expected to post a profit in 2023, 2024 or 2025. The deal for Yoox may change that. The stock’s 52-week trading range is $6.52 to $47.30. The company does not pay a dividend, and the total shareholder return for the past year was negative 80.8%.

Gap

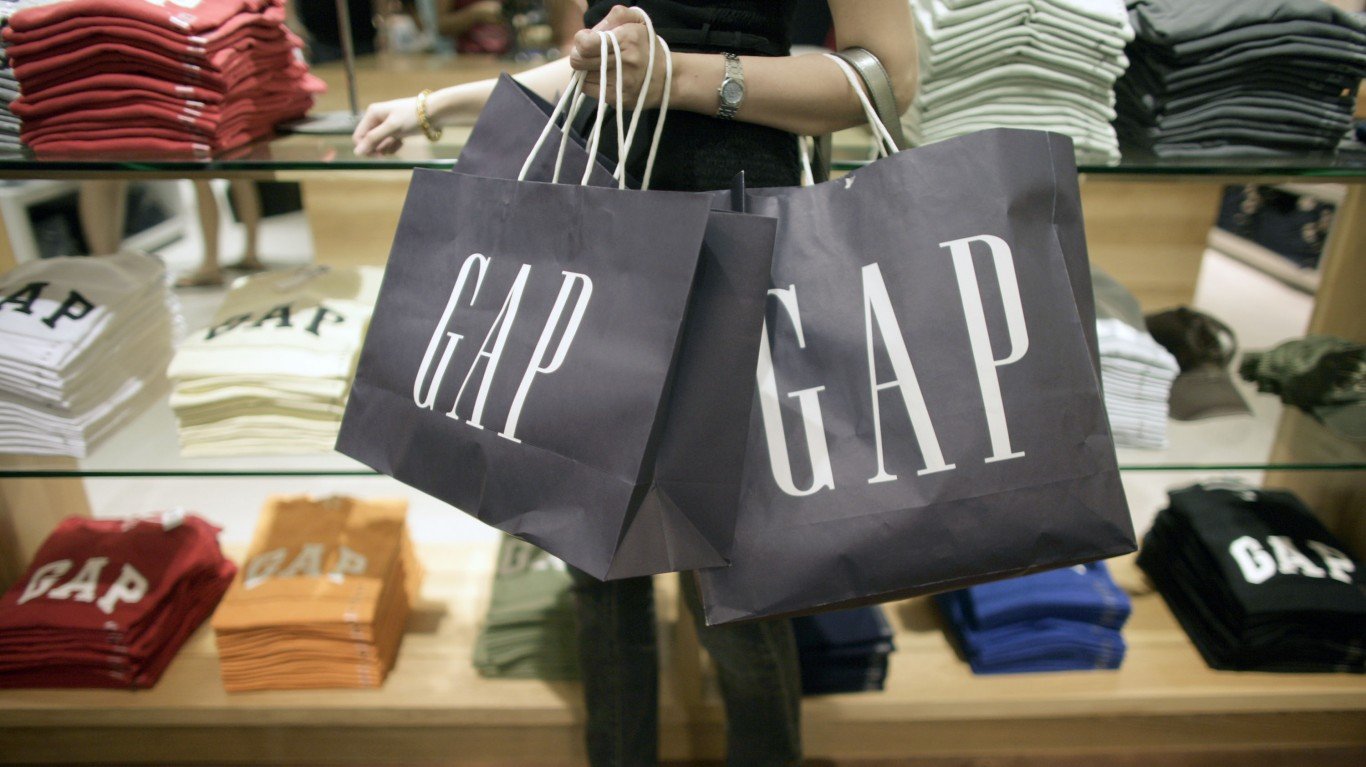
Apparel retailer Gap Inc. (NYSE: GPS) has seen its share price plummet by about 64% over the past 12 months. Inventory bloat has hurt gross margins, and the company said it expects sales to drop by the high-single digits in the quarter. In April, the head of Gap’s Old Navy stores resigned, and in July, CEO Sonia Syngal abruptly left. Gap has shown little to indicate that it can get back on track. If it has nothing to say about how it plans to get untangled, investors are likely to be quite unhappy.

Analysts continue to be cautious on the stock, with 14 of 22 having a Hold rating and just two others rating the stock at Buy. At a share price of around $10.10, the stock has outrun its median price target of $9.00. At the high target of $26.00, the implied gain is almost 157%.

Second-quarter fiscal 2023 revenue is forecast to come in at $3.82 billion, up 9.9% sequentially but down 9.3% year over year. Analysts are forecasting an adjusted loss per share of $0.02, compared to a prior quarter loss of $0.44 per share and EPS of $0.70 in the year-ago quarter. For the full fiscal year ending in January, analysts currently expect EPS of $0.02 down more than 98%, on sales of $15.68 billion, down 5.9%.

Gap stock trades at 421.5 times expected 2023 EPS, 11.7 times estimated 2024 earnings of $0.86 and 9.9 times estimated 2025 earnings of $1.02 per share. The stock’s 52-week range is $7.79 to $29.30. Gap pays an annual dividend of $0.60 (yield of 5.94%), and the total shareholder return for the past year was negative 62.9%. That rich dividend yield may be in jeopardy.

Workday

Cloud application software maker Workday Inc. (NASDAQ: WDAY) has seen its share price retreat by about 35% over the past 12 months. Since posting a 52-week high in mid-November, the shares are down nearly 48%. When Workday posted quarterly earnings in late May, shares fell more than 7% after the company guided subscription revenue up slightly and suggested that its backlog could grow by 20%. Investors don’t want to know how much you can’t sell; they want to know how much you will sell.

Analysts remain solidly bullish on the shares. Of 35 brokerages covering the stock, 30 rate the shares at Buy or Strong Buy, and four more have Hold ratings. At a share price of around $157.70, the upside potential based on a median price target of $220.00 is 39.5%. At the high target of $282.00, the upside potential is 78.8%.


Revenue for the company’s second quarter of fiscal 2023 is pegged at $1.52 billion, up 5.9% sequentially and by 20.6% year over year. Adjusted EPS are forecast at $0.91, down 3.1% sequentially and 17.3% lower year over year. For the fiscal year ending in January, analysts currently expect Workday to report EPS of $3.41, down 14.5%, on sales of $6.2 billion, up 20.6%.

The company’s stock trades at 46.2 for the 2023 fiscal year, 35.2 times estimated 2024 earnings of $4.48 and 26.4 times estimated 2025 earnings of $5.97 per share. The stock’s 52-week range is $134.10 to $307.81. Workday does not pay a dividend, and the total shareholder return for the past year is negative 35%.

ALERT: Take This Retirement Quiz Now  (Sponsored)

Take the quiz below to get matched with a financial advisor today.

Each advisor has been vetted by SmartAsset and is held to a fiduciary standard to act in your best interests.

Here’s how it works:
1. Answer SmartAsset advisor match quiz
2. Review your pre-screened matches at your leisure. Check out the advisors’ profiles.
3. Speak with advisors at no cost to you. Have an introductory call on the phone or introduction in person and choose whom to work with in the future

Take the retirement quiz right here.

Thank you for reading! Have some feedback for us?
Contact the 24/7 Wall St. editorial team.