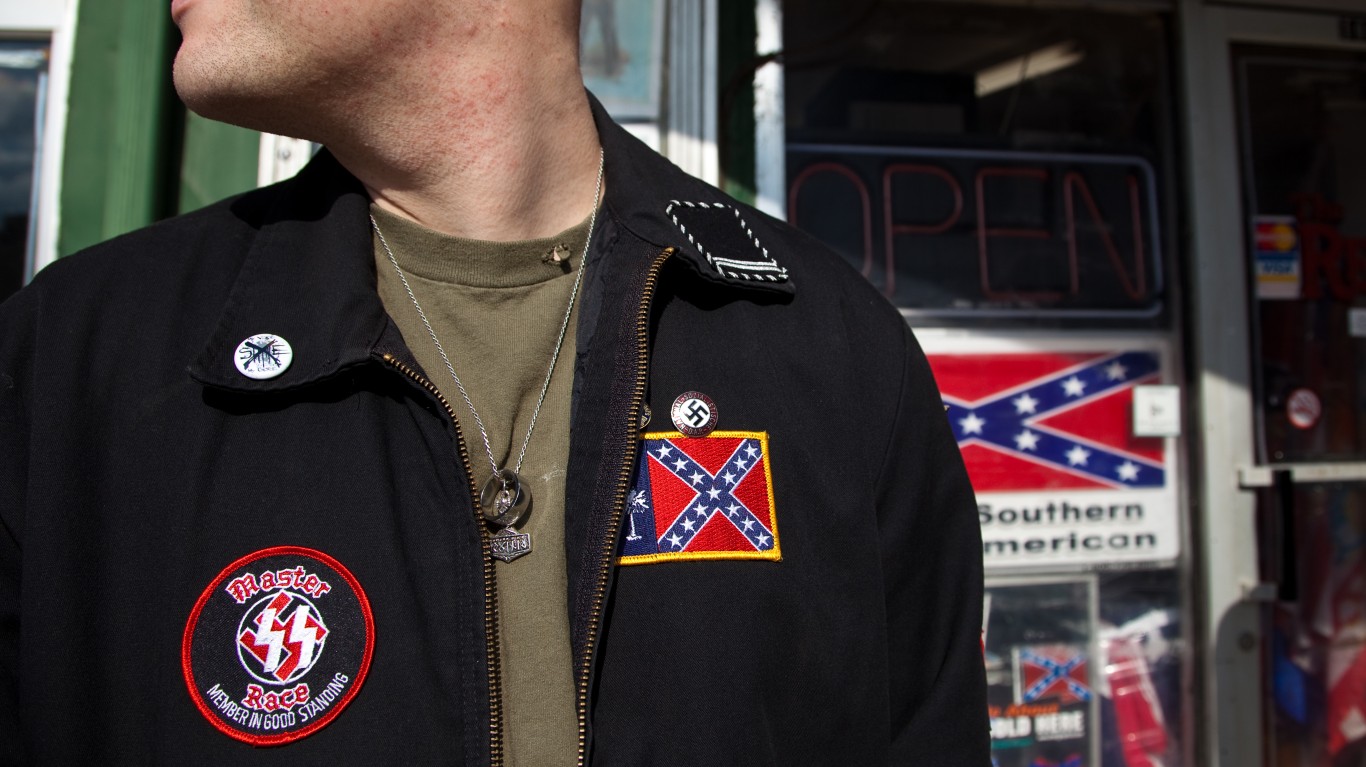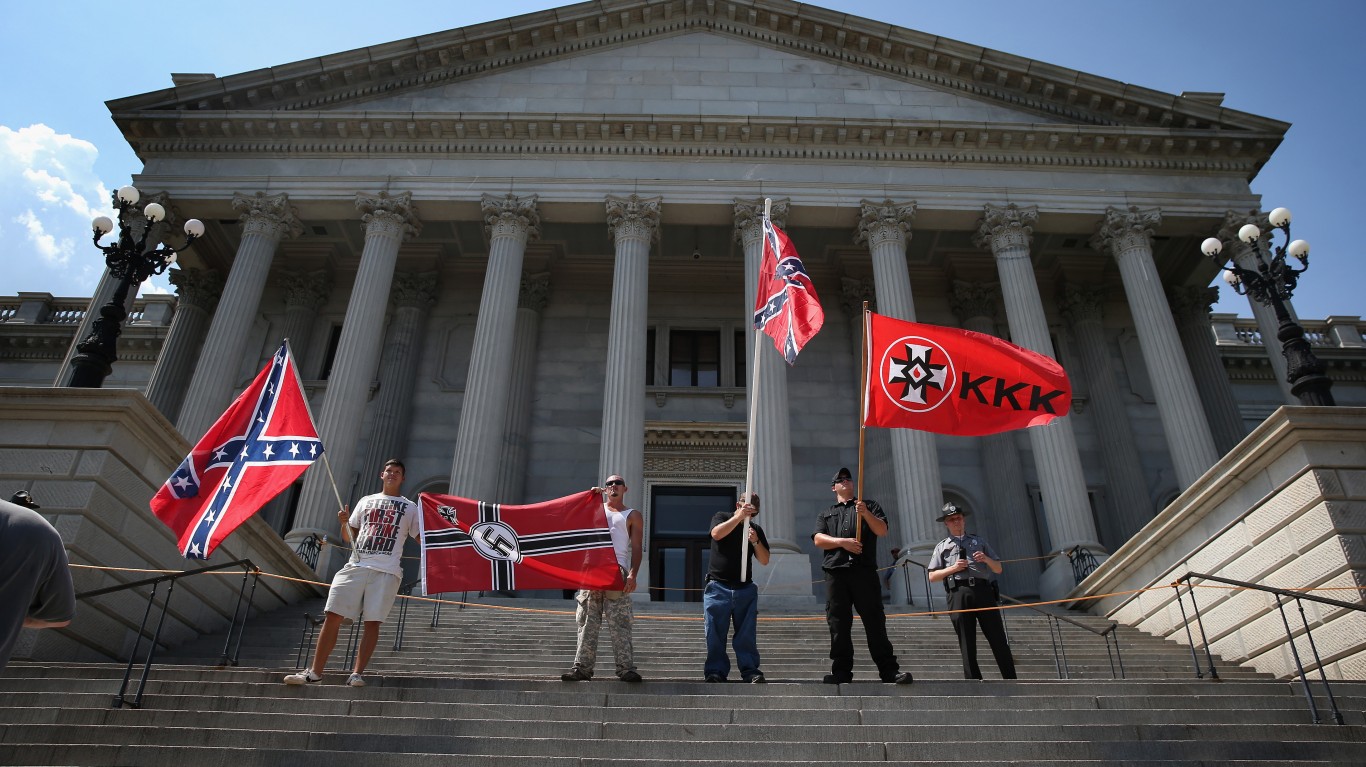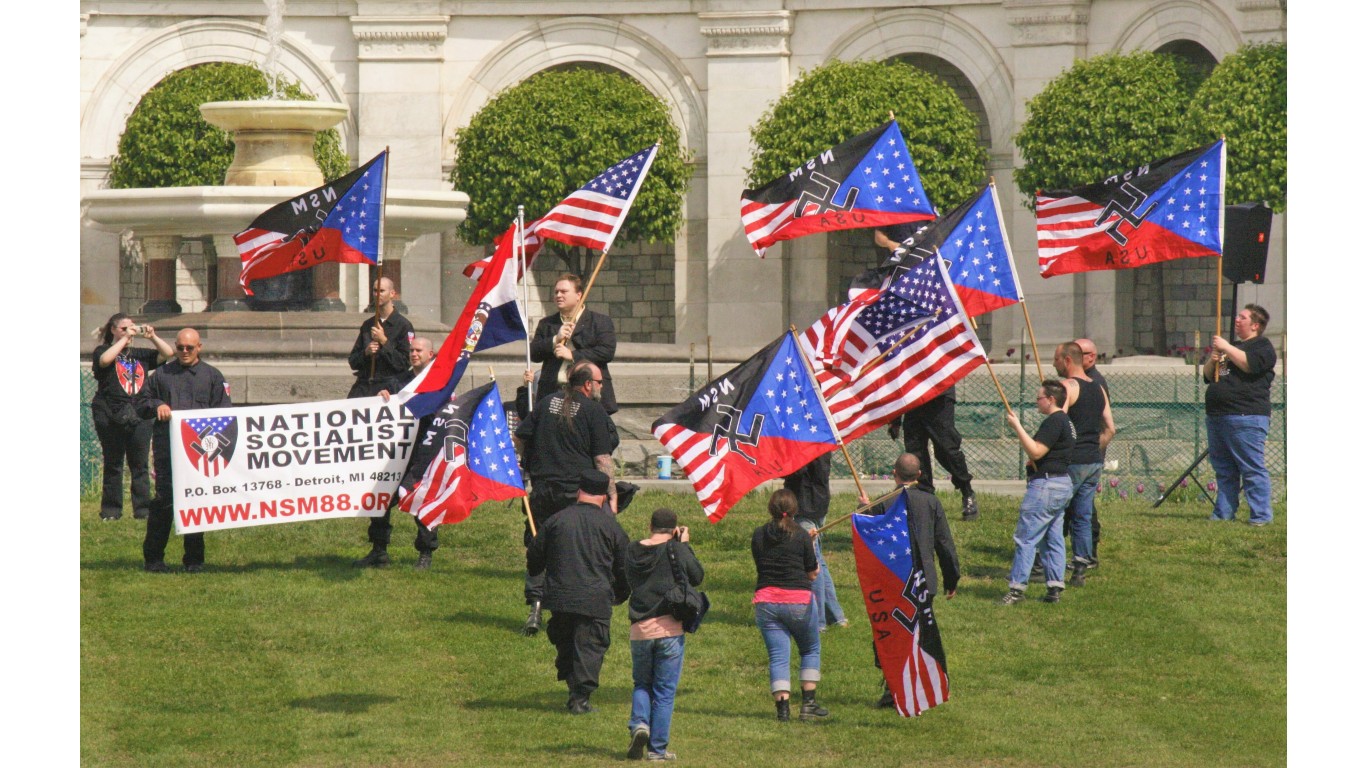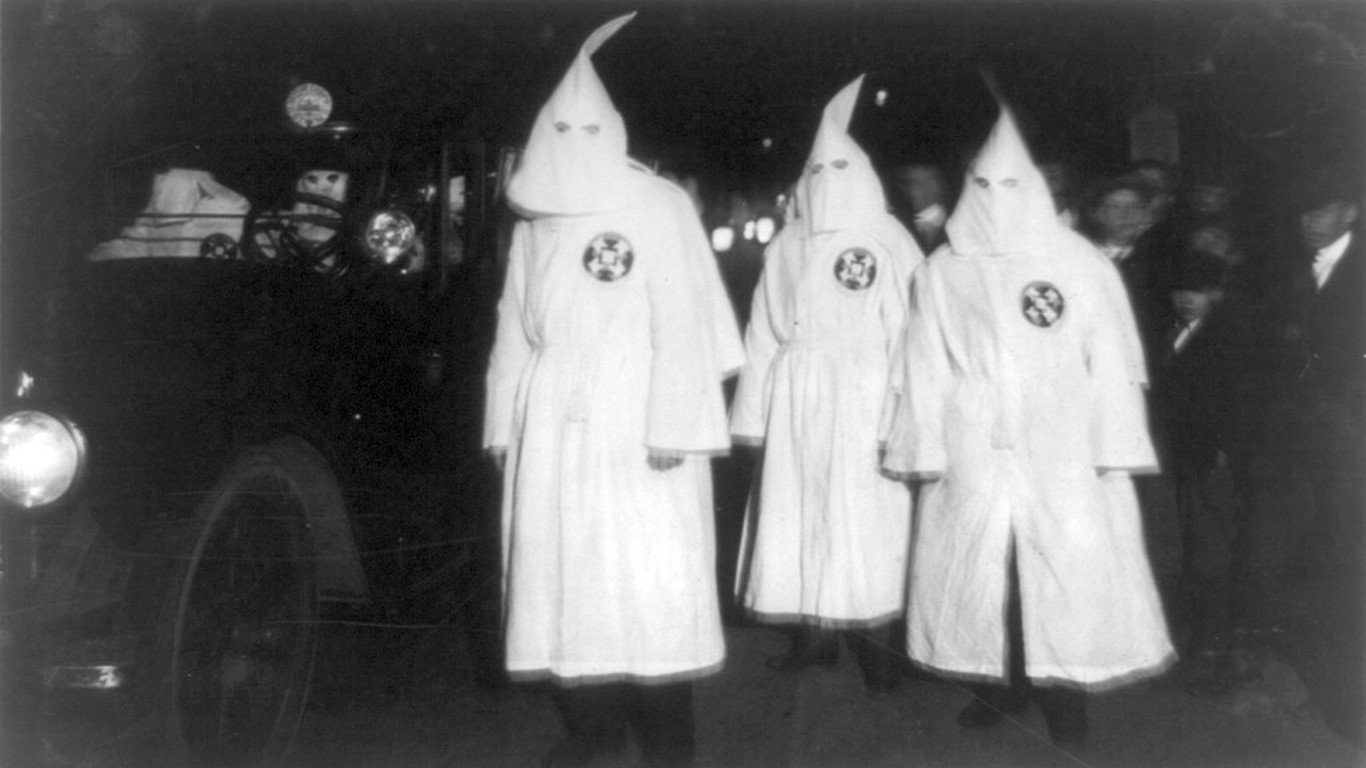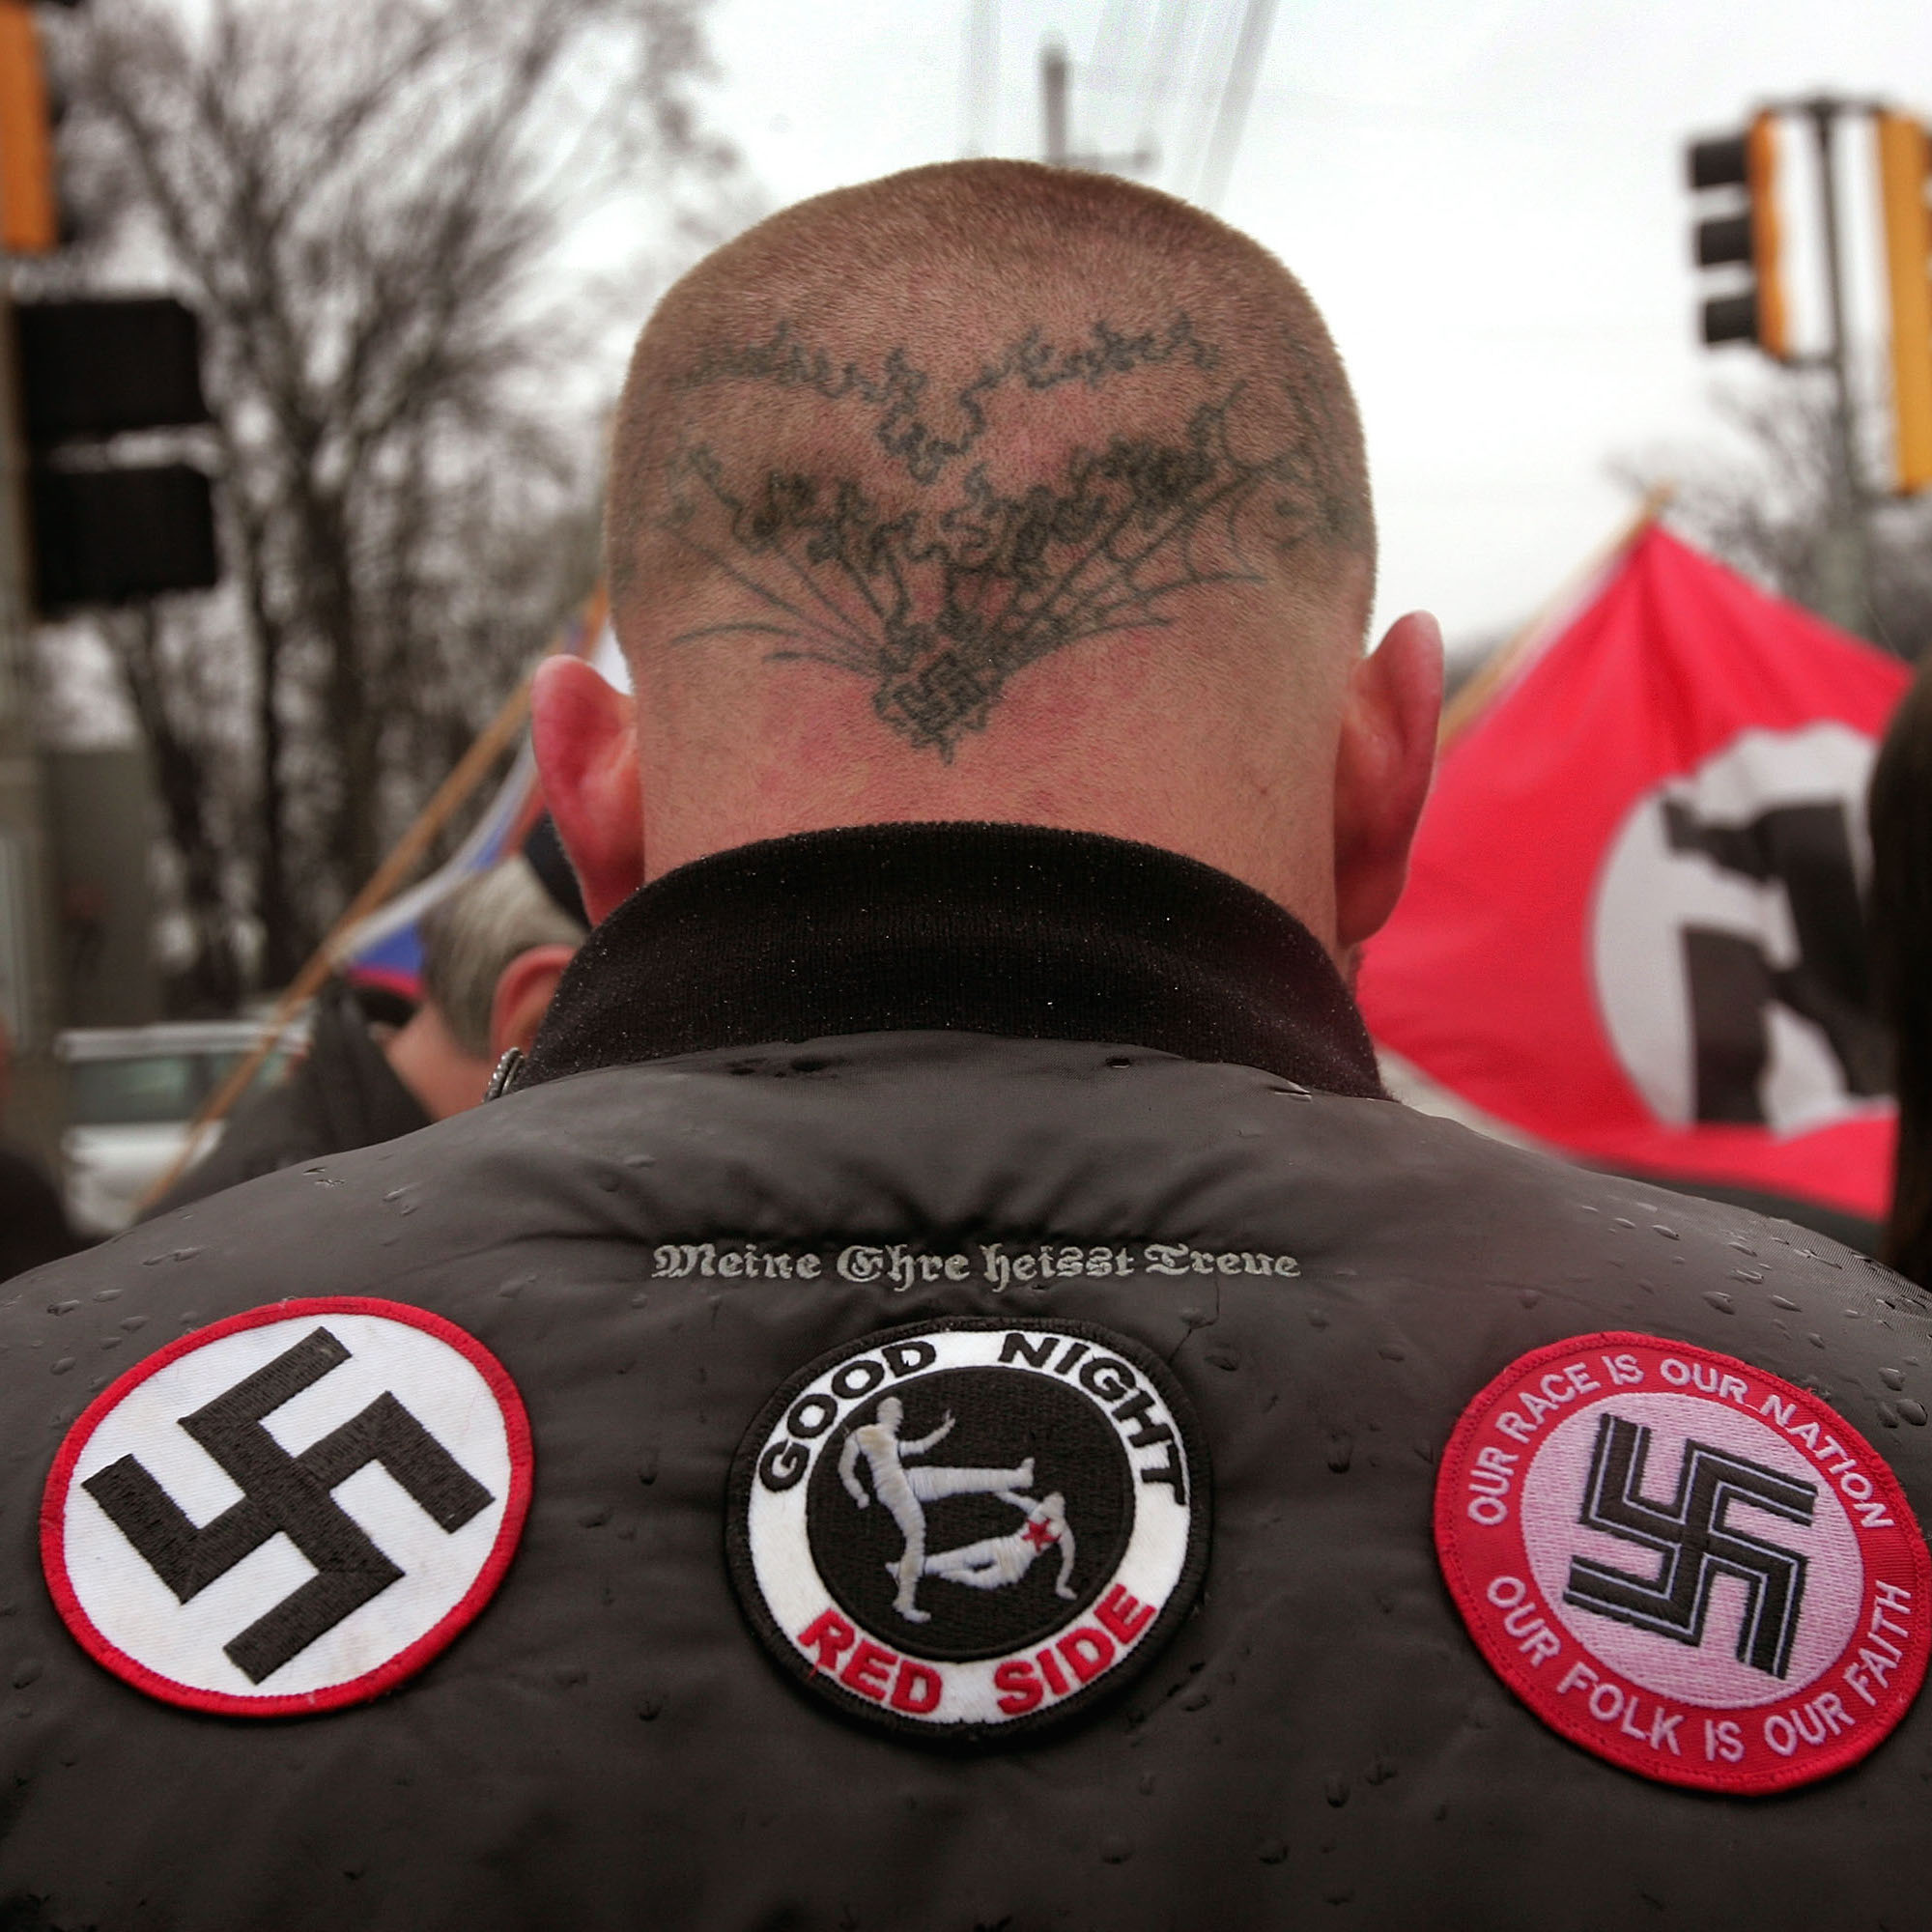
The first hate group to be formed in the United States was the Ku Klux Klan, which was formed in 1865. Since then hate groups have thrived with new groups being formed often. Hate groups in the US include far-right political parties, neo-Nazi movements, and apolitical protest groups.
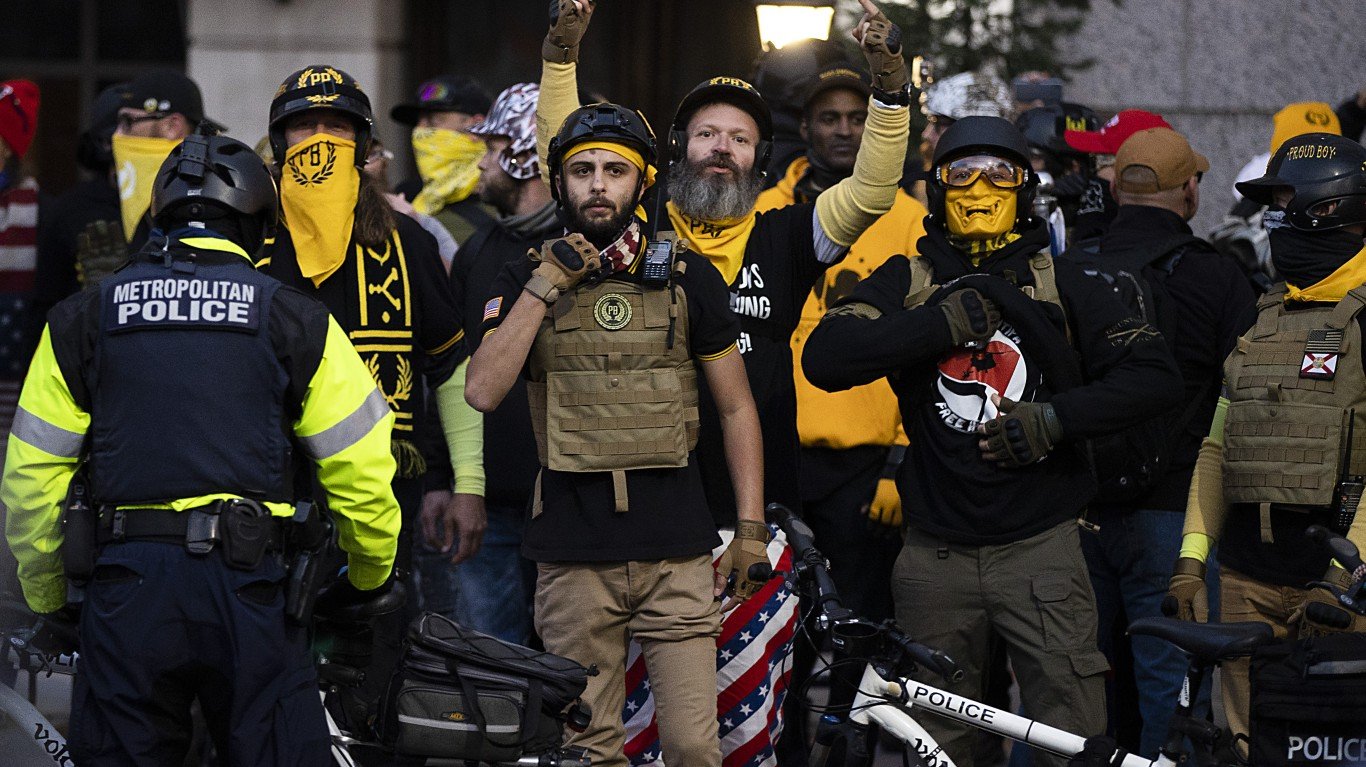
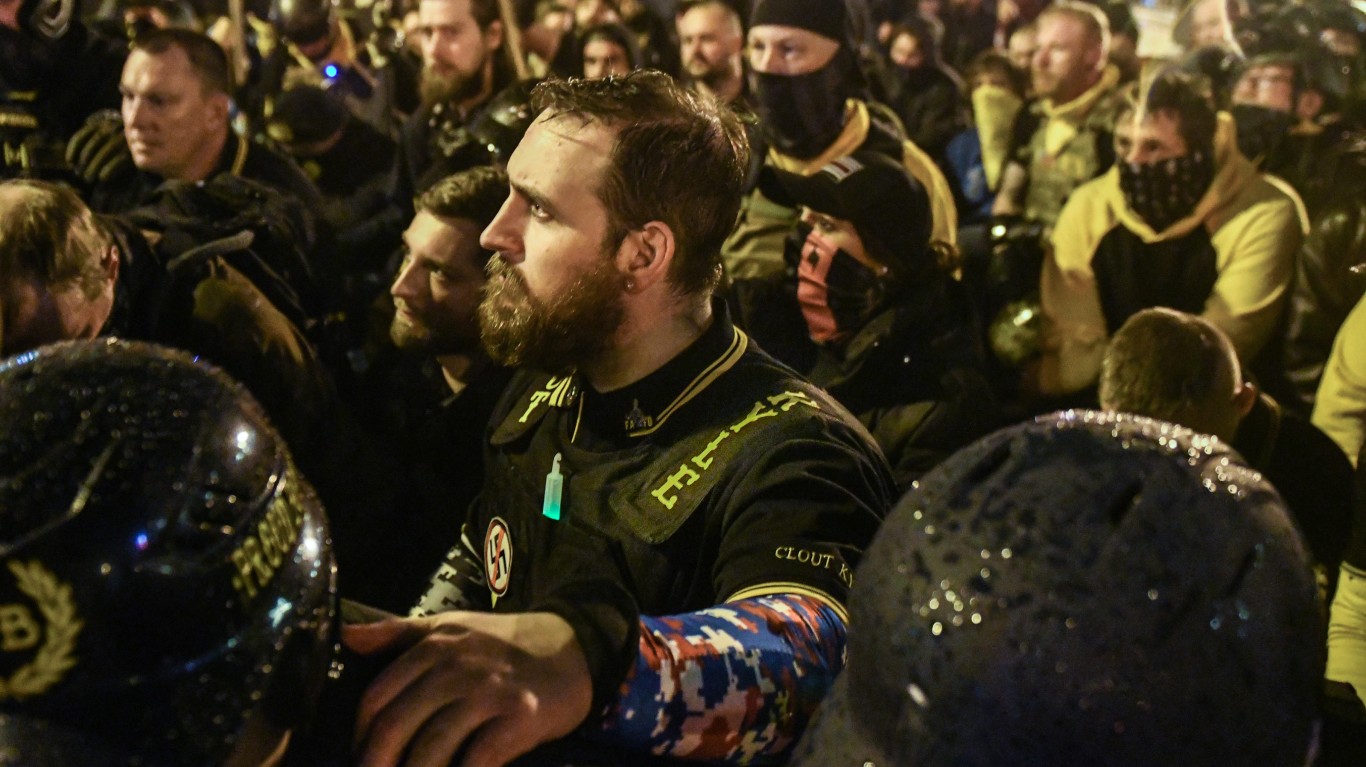
As of 2022, there are 1,225 hate groups in the United States, according to the non-profit legal group Southern Poverty Law Center (SLP). These hate groups include those with distinct chapters in cities across the country, such as the Proud Boys, the Oath Keepers, the Ku Klux Klan, and ACT for America. While specific views vary between these and other groups, they are generally all galvanized by curtailing government power or hatred toward individuals of certain races, religions, ethnicities, or sexual orientations. These groups are active in all 50 states, but in some parts of the country, they are far more common than in others.
24/7 Wall St. identified the states with the most hate groups by using data from the SPLC report The Year in Hate & Extremism 2022. States are ranked by the total number of extremist anti-government and hate groups for every million residents. Population figures used for our calculation are from the U.S. Census Bureau’s 2021 American Community Survey.
Why This Matters

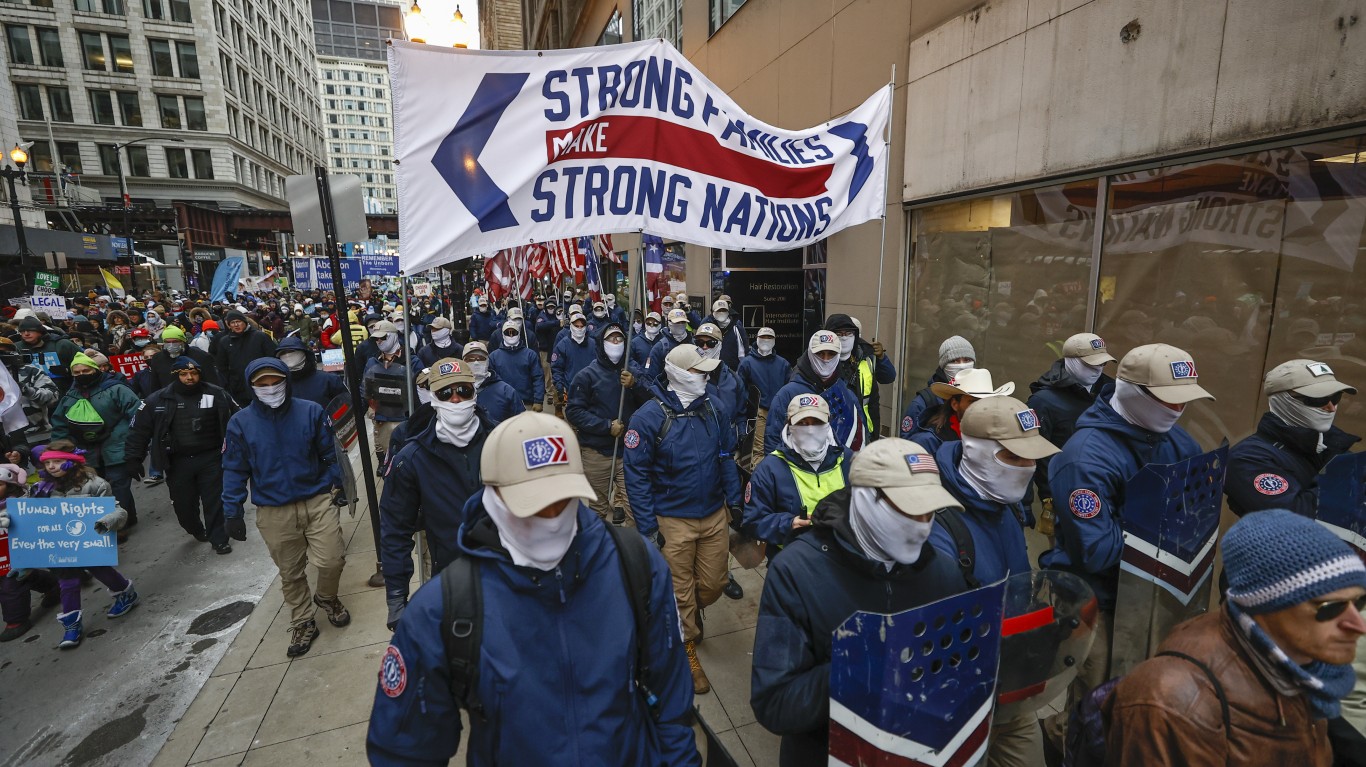
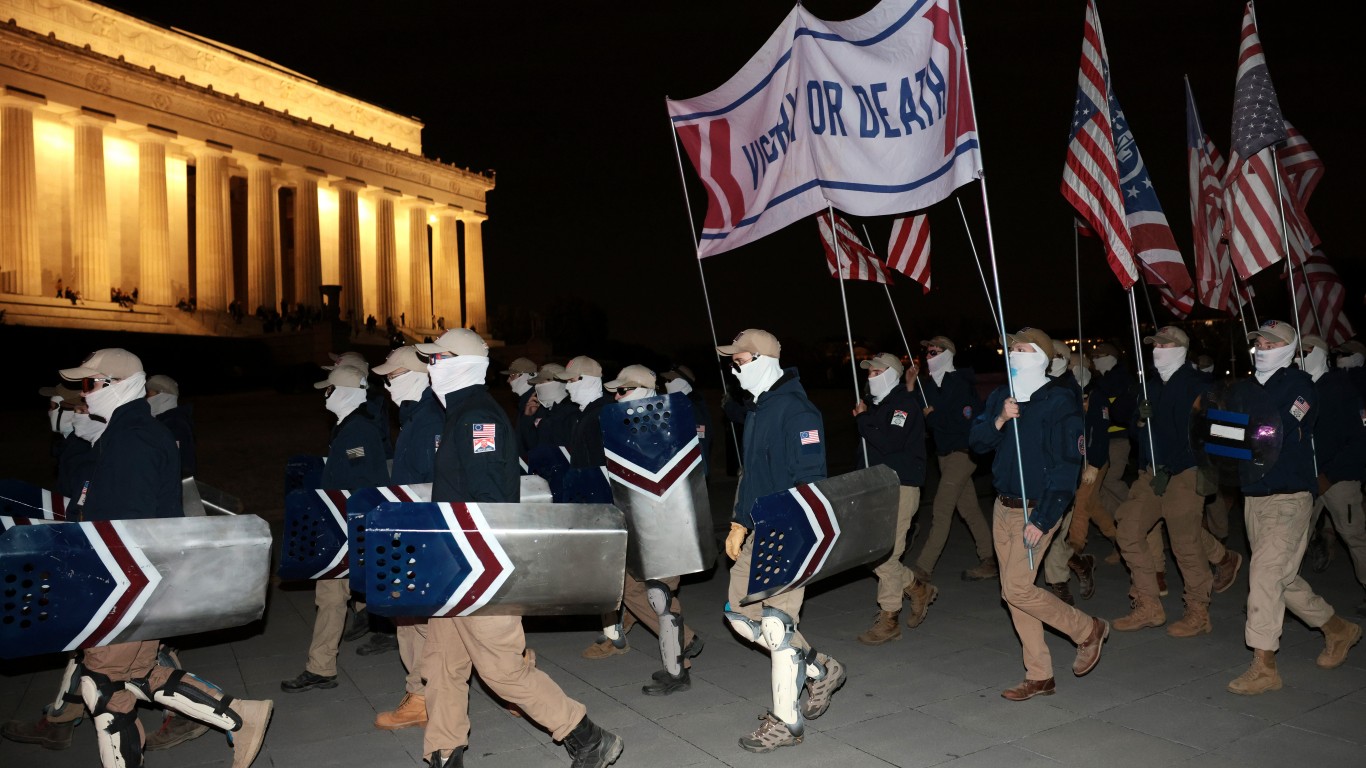
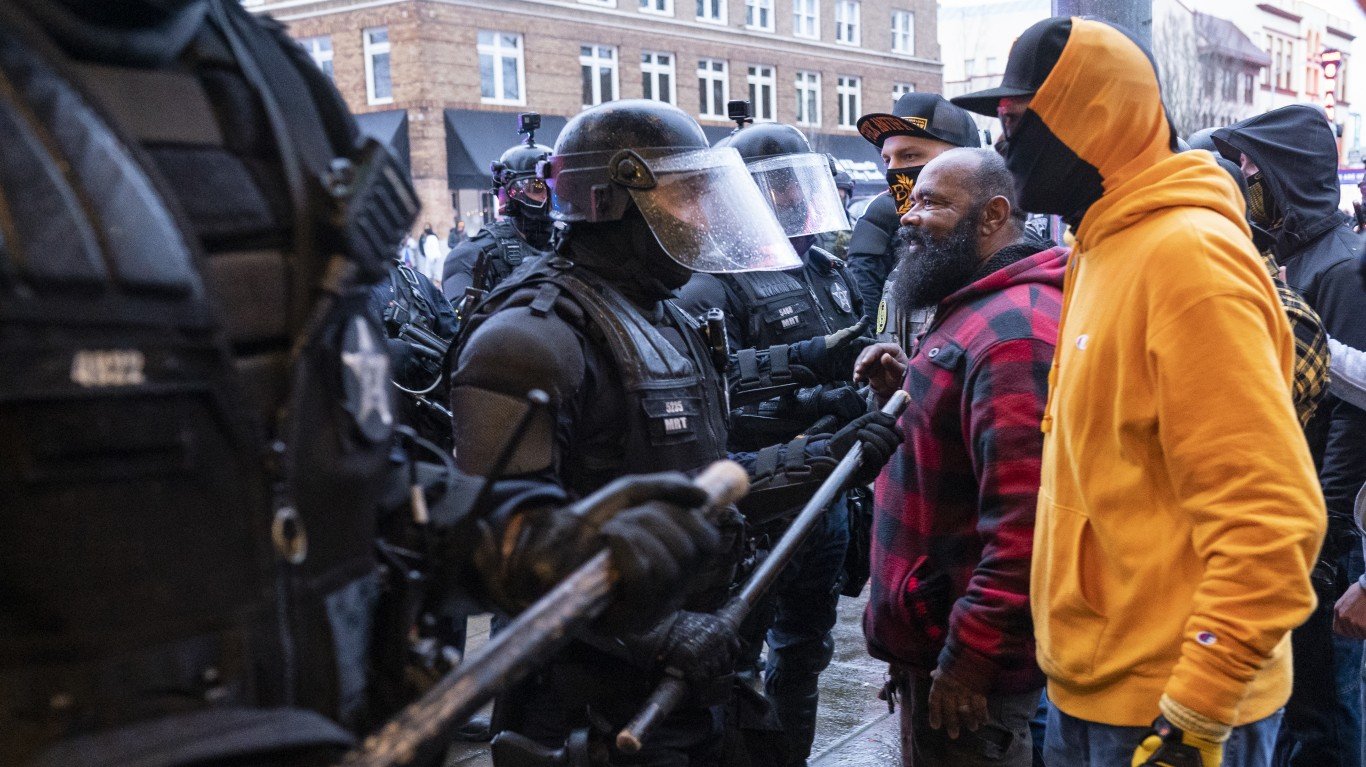
Violent extremism and domestic terrorism are on the rise, not just in the United States, but worldwide. From information released by the FBI, it is clear that domestic terrorism is a real problem. The number of open domestic terrorism cases has more than doubled since 2020. These violent acts are most often perpetrated by individuals who are members of hate groups. At least 67 hate organizations are active in the United States today, many of which are extremely violent. We’re writing this article to give our readers a sense of which places in America have a greater potential for civil unrest. Local racial or political violence has the potential for local economic instability, affecting business and property values. Perhaps even more damaging, if a particular racial, social, or political group sees an American city as unwelcome or even dangerous to them and avoids visiting, working, or moving there, that city’s local businesses, labor pool, and housing market all potentially suffer.
Here are the U.S. states with the highest concentration of hate groups.
50. Louisiana

In 2022 the state had 1.5 per million people (7 total) in hate groups, compared to #10 most, with 3.2 per million people (15 total) in 2021.
- Population: 4,624,047
- Topmost ideologies: Anti-Government Movement (3), Neo-Confederate (1)
- Demographics: 56.9% white; 31.0% Black; 4.3% foreign-born
49. Massachusetts

In 2022 the state had 1.6 per million people (11 total) in hate groups, compared to #34 most, with 2.0 per million people (14 total) in 2021.
- Population: 6,984,723
- Topmost ideologies: Anti-Government Movement (6), Anti-LGBTQ (2), White Nationalist (1)
- Demographics: 67.5% white; 6.3% Black; 17.6% foreign-born
48. Kansas

In 2022 the state had 2 per million people (6 total) in hate groups, compared to #46 most, with 1.4 per million people (4 total) in 2021.
- Population: 2,934,582
- Topmost ideologies: Anti-Government Movement (3), White Nationalist (1)
- Demographics: 73.4% white; 5.1% Black; 6.9% foreign-born
47. Kentucky
In 2022 the state had 2 per million people (9 total) in hate groups, compared to #35 most, with 2.0 per million people (9 total) in 2021.
- Population: 4,509,394
- Topmost ideologies: Anti-Government Movement (3), General Hate (2), Neo-Völkisch (1)
- Demographics: 82.7% white; 7.1% Black; 4.0% foreign-born
46. Georgia

In 2022 the state had 2.2 per million people (24 total) in hate groups, compared to #31 most, with 2.2 per million people (24 total) in 2021.
- Population: 10,799,566
- Topmost ideologies: Anti-Government Movement (13), White Nationalist (3), Anti-LGBTQ (2)
- Demographics: 50.2% white; 30.4% Black; 10.0% foreign-born
45. Texas

In 2022 the state had 2.4 per million people (72 total) in hate groups, compared to #41 most, with 1.8 per million people (52 total) in 2021.
- Population: 29,527,941
- Topmost ideologies: Anti-Government Movement (39), General Hate (10), Anti-LGBTQ (5)
- Demographics: 39.4% white; 11.6% Black; 17.2% foreign-born
44. Mississippi

In 2022 the state had 2.4 per million people (7 total) in hate groups, compared to #21 most, with 2.7 per million people (8 total) in 2021.
- Population: 2,949,965
- Topmost ideologies: Anti-Government Movement (4), White Nationalist (1)
- Demographics: 55.4% white; 36.0% Black; 2.1% foreign-born
43. New Jersey

In 2022 the state had 2.4 per million people (22 total) in hate groups, compared to #47 most, with 1.3 per million people (12 total) in 2021.
- Population: 9,267,130
- Topmost ideologies: Anti-Government Movement (16), White Nationalist (2), Anti-Immigrant (1)
- Demographics: 52.1% white; 12.3% Black; 23.0% foreign-born
42. New Mexico
In 2022 the state had 2.4 per million people (5 total) in hate groups, compared to #50 most, with 0.5 per million people (1 total) in 2021.
- Population: 2,115,877
- Topmost ideologies: Anti-Government Movement (4), White Nationalist (1)
- Demographics: 34.9% white; 1.7% Black; 9.1% foreign-born
41. California

In 2022 the state had 2.6 per million people (103 total) in hate groups, compared to #43 most, with 1.7 per million people (65 total) in 2021.
- Population: 39,237,836
- Topmost ideologies: Anti-Government Movement (57), General Hate (15), Anti-Muslim (8)
- Demographics: 34.3% white; 5.3% Black; 26.6% foreign-born
40. Alabama

In 2022 the state had 2.6 per million people (13 total) in hate groups, compared to #24 most, with 2.6 per million people (13 total) in 2021.
- Population: 5,039,877
- Topmost ideologies: Anti-Government Movement (8), Neo-Confederate (2)
- Demographics: 64.2% white; 25.8% Black; 3.5% foreign-born
39. New York

In 2022 the state had 2.7 per million people (53 total) in hate groups, compared to #40 most, with 1.8 per million people (35 total) in 2021.
- Population: 19,835,913
- Topmost ideologies: Anti-Government Movement (25), General Hate (12), White Nationalist (4)
- Demographics: 53.5% white; 13.4% Black; 22.3% foreign-born
38. Illinois
In 2022 the state had 2.8 per million people (35 total) in hate groups, compared to #37 most, with 1.8 per million people (23 total) in 2021.
- Population: 12,671,469
- Topmost ideologies: Anti-Government Movement (17), Anti-LGBTQ (4)
- Demographics: 58.9% white; 13.4% Black; 14.2% foreign-born
37. Michigan

In 2022 the state had 2.9 per million people (29 total) in hate groups, compared to #38 most, with 1.8 per million people (18 total) in 2021.
- Population: 10,050,811
- Topmost ideologies: Anti-Government Movement (19), White Nationalist (3)
- Demographics: 72.9% white; 13.2% Black; 6.8% foreign-born
36. Connecticut

In 2022 the state had 3.1 per million people (11 total) in hate groups, compared to #36 most, with 1.9 per million people (7 total) in 2021.
- Population: 3,605,597
- Topmost ideologies: Anti-Government Movement (7), White Nationalist (1)
- Demographics: 62.7% white; 9.9% Black; 15.2% foreign-born
35. Oklahoma

In 2022 the state had 3.3 per million people (13 total) in hate groups, compared to #30 most, with 2.3 per million people (9 total) in 2021.
- Population: 3,986,639
- Topmost ideologies: Anti-Government Movement (9), Neo-Völkisch (1)
- Demographics: 62.8% white; 6.7% Black; 5.8% foreign-born
34. Minnesota
In 2022 the state had 3.3 per million people (19 total) in hate groups, compared to #44 most, with 1.6 per million people (9 total) in 2021.
- Population: 5,707,390
- Topmost ideologies: Anti-Government Movement (11), Neo-Völkisch (2)
- Demographics: 76.9% white; 6.7% Black; 8.5% foreign-born
33. Wisconsin

In 2022 the state had 3.6 per million people (21 total) in hate groups, compared to #33 most, with 2.0 per million people (12 total) in 2021.
- Population: 5,895,908
- Topmost ideologies: Anti-Government Movement (13), Neo-Völkisch (2)
- Demographics: 79.0% white; 6.1% Black; 5.1% foreign-born
32. Missouri

In 2022 the state had 3.6 per million people (22 total) in hate groups, compared to #19 most, with 2.8 per million people (17 total) in 2021.
- Population: 6,168,187
- Topmost ideologies: Anti-Government Movement (12), General Hate (4), White Nationalist (2)
- Demographics: 76.6% white; 10.7% Black; 4.1% foreign-born
31. Washington

In 2022 the state had 3.7 per million people (29 total) in hate groups, compared to #25 most, with 2.5 per million people (19 total) in 2021.
- Population: 7,738,692
- Topmost ideologies: Anti-Government Movement (13), Anti-LGBTQ (3)
- Demographics: 64.3% white; 3.9% Black; 14.8% foreign-born
30. Nevada
In 2022 the state had 3.8 per million people (12 total) in hate groups, compared to #17 most, with 2.9 per million people (9 total) in 2021.
- Population: 3,143,991
- Topmost ideologies: Anti-Government Movement (6), General Hate (2), Neo-Völkisch (1)
- Demographics: 45.2% white; 8.7% Black; 18.4% foreign-born
29. Iowa

In 2022 the state had 3.8 per million people (12 total) in hate groups, compared to #48 most, with 0.6 per million people (2 total) in 2021.
- Population: 3,193,079
- Topmost ideologies: Anti-Government Movement (10), White Nationalist (1)
- Demographics: 83.0% white; 3.5% Black; 5.4% foreign-born
28. Florida

In 2022 the state had 4.1 per million people (89 total) in hate groups, compared to #26 most, with 2.4 per million people (53 total) in 2021.
- Population: 21,781,128
- Topmost ideologies: Anti-Government Movement (54), General Hate (11), Anti-LGBTQ (6)
- Demographics: 51.1% white; 14.6% Black; 21.2% foreign-born
27. North Carolina

In 2022 the state had 4.1 per million people (43 total) in hate groups, compared to #22 most, with 2.7 per million people (28 total) in 2021.
- Population: 10,551,162
- Topmost ideologies: Anti-Government Movement (27), General Hate (5), Neo-Confederate (3)
- Demographics: 60.9% white; 19.9% Black; 8.2% foreign-born
26. Maryland

In 2022 the state had 4.1 per million people (25 total)> in hate groups, compared to #39 most, with 1.8 per million people (11 total) in 2021.
- Population: 6,165,129
- Topmost ideologies: Anti Government Movement (15), General Hate (4), Neo-Confederate (1)
- Demographics: 47.8% white; 29.0% Black; 15.9% foreign-born
25. Indiana
In 2022 the state had 4.3 per million people (29 total) in hate groups, compared to #32 most, with 2.1 per million people (14 total) in 2021.
- Population: 6,805,985
- Topmost ideologies: Anti-Government Movement (16), White Nationalist (3), Neo-Völkisch (2)
- Demographics: 76.6% white; 8.7% Black; 5.6% foreign-born
24. 
In 2022 the state had 4.6 per million people (3 total) in hate groups, compared to #12 most, with 3.1 per million people (2 total) in 2021.
- Population: 645,570
- Topmost ideologies: Anti-Government Movement (2), White Nationalist (1), Neo-Völkisch(0)
- Demographics: 90.6% white; 1.0% Black; 4.2% foreign-born
23. Ohio
In 2022 the state had 4.7 per million people (55 total) in hate groups, compared to #42 most, with 1.7 per million people (20 total) in 2021.
- Population: 11,780,017
- Topmost ideologies: Anti-Government Movement (35), Anti-LGBTQ (4)
- Demographics: 76.6% white; 11.8% Black; 5.0% foreign-born
22. Tennessee

In 2022 the state had 4.7 per million people (33 total) in hate groups, compared to #4 most, with 4.0 per million people (28 total) in 2021.
- Population: 6,975,218
- Topmost ideologies: Anti-Government Movement (12), White Nationalist (4), Neo-Nazi (3)
- Demographics: 72.1% white; 15.4% Black; 5.3% foreign-born
21. Virginia

In 2022 the state had 5 per million people (43 total) in hate groups, compared to #28 most, with 2.3 per million people (20 total) in 2021.
- Population: 8,642,274
- Topmost ideologies: Anti-Government Movement (28), White Nationalist (5), General Hate (3)
- Demographics: 59.2% white; 18.0% Black; 12.4% foreign-born
20. West Virginia

In 2022 the state had 5 per million people (9 total) in hate groups, compared to #8 most, with 3.4 per million people (6 total) in 2021.
- Population: 1,782,959
- Topmost ideologies: Anti-Government Movement (3), Anti-Government Movement (3), Neo-Völkisch (1)
- Demographics: 90.4% white; 2.8% Black; 1.6% foreign-born
19. Colorado

In 2022 the state had 5.3 per million people (31 total) in hate groups, compared to #13 most, with 3.1 per million people (18 total) in 2021.
- Population: 5,812,069
- Topmost ideologies: Anti-Government Movement (17), Anti-LGBTQ (4)
- Demographics: 65.2% white; 3.7% Black; 9.8% foreign-born
18. Arkansas

In 2022 the state had 5.3 per million people (16 total) in hate groups, compared to #15 most, with 3.0 per million people (9 total) in 2021.
- Population: 3,025,891
- Topmost ideologies: Anti-Government Movement (9), White Nationalist (3), Neo-Völkisch (1)
- Demographics: 68.2% white; 14.7% Black; 4.7% foreign-born
17. Arizona

In 2022 the state had 5.4 per million people (39 total) in hate groups, compared to #14 most, with 3.0 per million people (22 total) in 2021.
- Population: 7,276,316
- Topmost ideologies: Anti-Government Movement (21), Anti-LGBTQ (5), White Nationalist (4)
- Demographics: 52.0% white; 4.3% Black; 12.6% foreign-born
16. Utah

In 2022 the state had 5.4 per million people (18 total) in hate groups, compared to #49 most, with 0.6 per million people (2 total) in 2021.
- Population: 3,337,975
- Topmost ideologies: Anti-Government Movement (16), White Nationalist (1)
- Demographics: 76.0% white; 1.0% Black; 8.3% foreign-born
15. Alaska

In 2022 the state had 5.5 per million people (4 total) in hate groups, compared to #45 most, with 1.4 per million people (1 total) in 2021.
- Population: 732,673
- Topmost ideologies: Anti-Government Movement (3), Neo-Völkisch (1)
- Demographics: 57.9% white; 2.9% Black; 8.1% foreign-born
14. Hawaii
In 2022 the state had 5.5 per million people (8 total) in hate groups, compared to #18 most, with 2.8 per million people (4 total) in 2021.
- Population: 1,441,553
- Topmost ideologies: Anti-Government Movement (6), Neo-Nazi (1),
- Demographics: 20.8% white; 1.8% Black; 18.8% foreign-born
13. Pennsylvania

In 2022 the state had 5.6 per million people (72 total) in hate groups, compared to #29 most, with 2.3 per million people (30 total) in 2021.
- Population: 12,964,056
- Topmost ideologies: Anti-Government Movement (51), White Nationalist (7), Neo-Nazi (3)
- Demographics: 73.6% white; 10.2% Black; 7.2% foreign-born
12. Oregon

In 2022 the state had 5.7 per million people (24 total) in hate groups, compared to #27 most, with 2.4 per million people (10 total) in 2021.
- Population: 4,246,155
- Topmost ideologies: Anti-Government Movement (14), General Hate (4), White Nationalist (3)
- Demographics: 72.0% white; 1.8% Black; 9.7% foreign-born
11. South Carolina
In 2022 the state had 5.8 per million people (30 total) in hate groups, compared to #9 most, with 3.3 per million people (17 total) in 2021.
- Population: 5,190,705
- Topmost ideologies: Anti-Government Movement (18), White Nationalist (5), Neo-Völkisch (2)
- Demographics: 62.6% white; 24.9% Black; 5.2% foreign-born
10. Nebraska
In 2022 the state had 6.1 per million people (12 total) in hate groups, compared to #1 most, with 4.6 per million people (9 total) in 2021.
- Population: 1,963,692
- Topmost ideologies: Anti-Government Movement (4), Neo-Nazi (3), White Nationalist (1)
- Demographics: 76.4% white; 4.6% Black; 7.4% foreign-born
9. Rhode Island

In 2022 the state had 6.4 per million people (7 total) in hate groups, compared to #20 most, with 2.7 per million people (3 total) in 2021.
- Population: 1,095,610
- Topmost ideologies: Anti-Government Movement (4), White Nationalist (1)
- Demographics: 68.9% white; 4.5% Black; 14.5% foreign-born
8. Maine

In 2022 the state had 6.6 per million people (9 total) in hate groups, compared to #16 most, with 2.9 per million people (4 total) in 2021.
- Population: 1,372,247
- Topmost ideologies: Anti-Government Movement (4), White Nationalist (2), Neo-Völkisch (1)
- Demographics: 90.0% white; 1.5% Black; 4.1% foreign-born
7. Delaware
In 2022 the state had 7 per million people (7 total) in hate groups, compared to #5 most, with 4.0 per million people (4 total) in 2021.
- Population: 1,003,384
- Topmost ideologies: Anti-Government Movement (5), White Nationalist (1)
- Demographics: 59.3% white; 20.5% Black; 10.1% foreign-born
6. South Dakota

In 2022 the state had 8.9 per million people (8 total) in hate groups, compared to #2 most, with 4.5 per million people (4 total) in 2021.
- Population: 895,376
- Topmost ideologies: Anti-Government Movement (4), White Nationalist (2), Neo-Nazi (1)
- Demographics: 80.0% white; 1.9% Black; 3.5% foreign-born
5. North Dakota

In 2022 the state had 10.3 per million people (8 total) in hate groups, compared to #23 most, with 2.6 per million people (2 total) in 2021.
- Population: 774,948
- Topmost ideologies: Anti-Government Movement (3), Neo-Völkisch (2), White Nationalist (1)
- Demographics: 82.3% white; 2.9% Black; 4.4% foreign-born
4. New Hampshire

In 2022 the state had 10.8 per million people (15 total) in hate groups, compared to #3 most, with 4.3 per million people (6 total) in 2021.
- Population: 1,388,992
- Topmost ideologies: Anti-Government Movement (8), White Nationalist (2)
- Demographics: 87.3% white; 1.3% Black; 5.9% foreign-born
3. Montana

In 2022 the state had 10.9 per million people (12 total) in hate groups, compared to #6 most, with 3.6 per million people (4 total) in 2021.
- Population: 1,104,271
- Topmost ideologies: Anti-Government Movement (6), White Nationalist (2)
- Demographics: 83.8% white; 0.5% Black; 2.2% foreign-born
2. Idaho

In 2022 the state had 11 per million people (21 total) in hate groups, compared to #11 most, with 3.2 per million people (6 total) in 2021.
- Population: 1,900,923
- Topmost ideologies: Anti-Government Movement (12), General Hate (2), Neo-Völkisch (1)
- Demographics: 78.7% white; 0.7% Black; 6.1% foreign-born
1. Wyoming
In 2022 the state had 15.5 per million people (9 total) in hate groups, compared to #7 most, with 3.5 per million people (2 total) in 2021.
- Population: 578,803
- Topmost ideologies: Anti-Government Movement (6), White Nationalist (1)
- Demographics: 81.5% white; 1.0% Black; 3.4% foreign-born
Contact [email protected] for any questions or corrections.