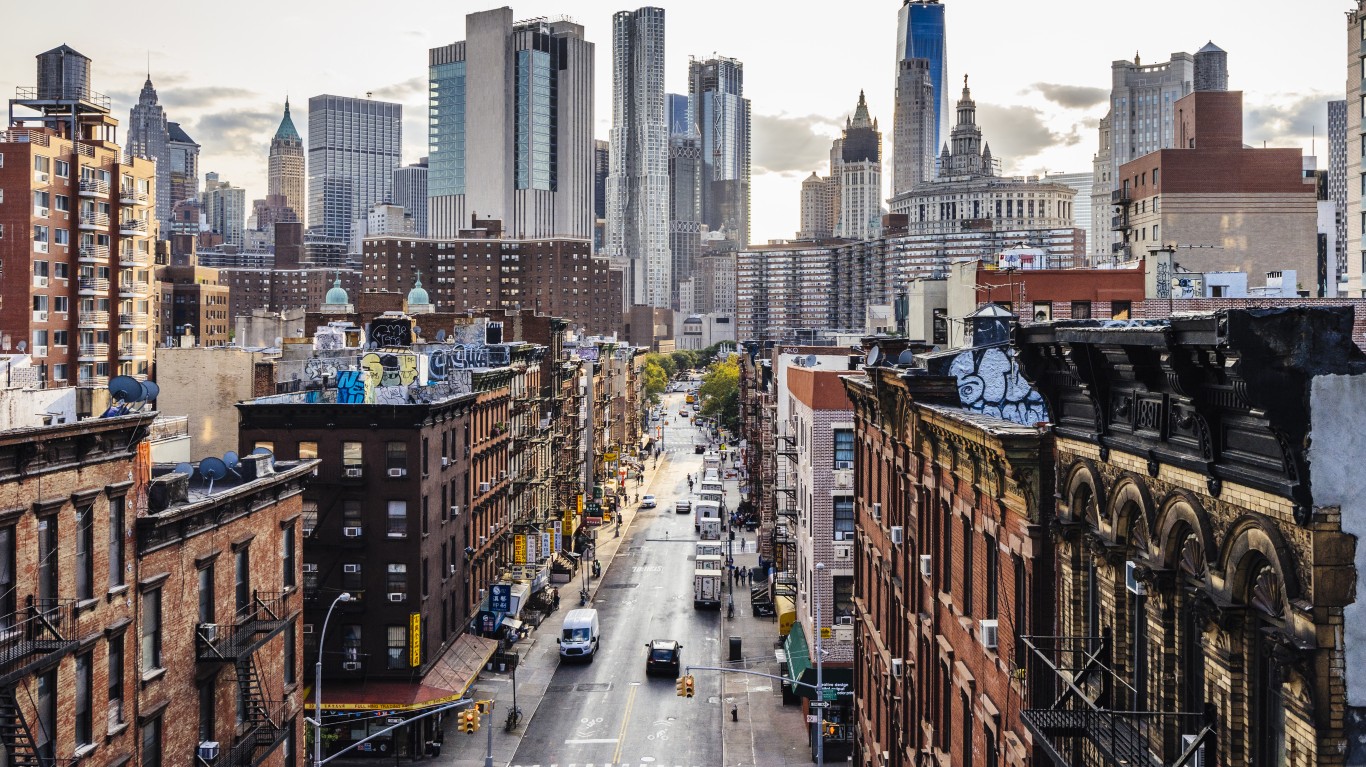
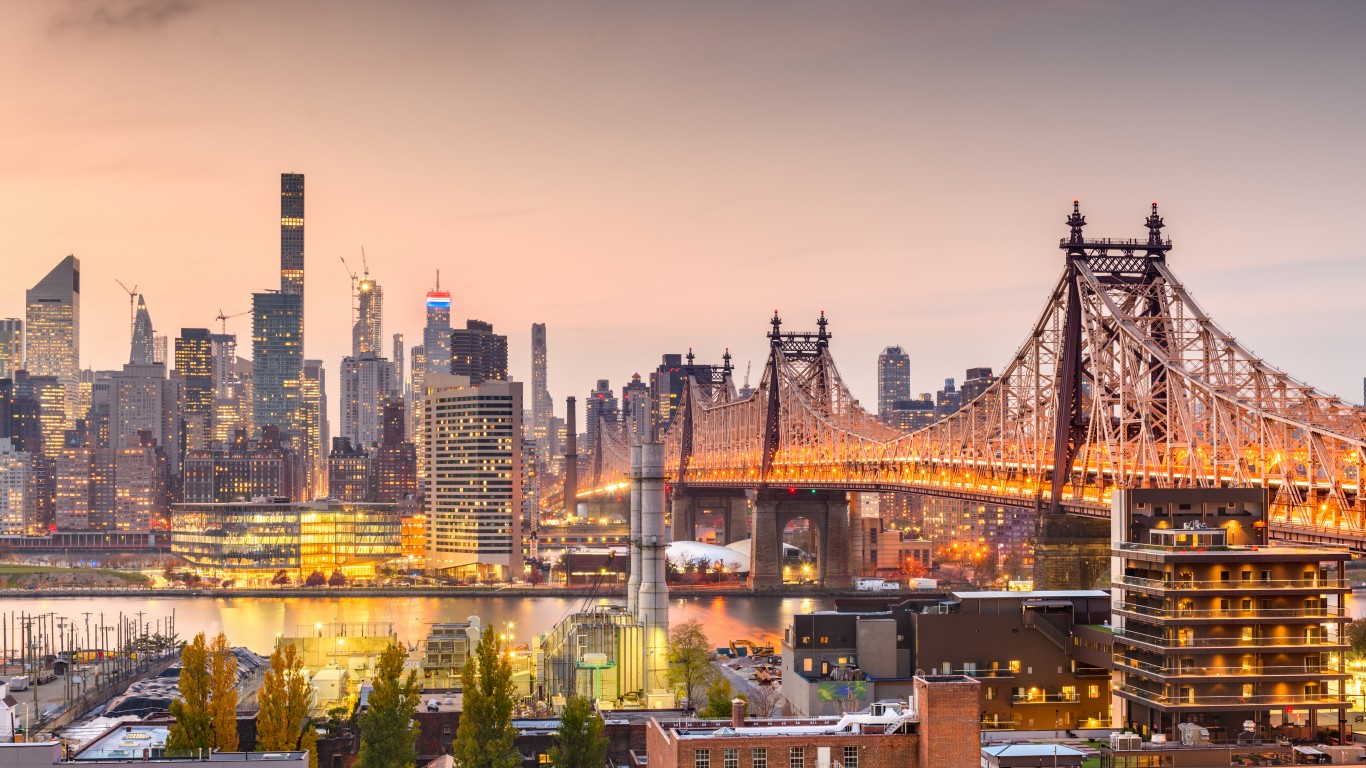
The metropolitan city of New York is known for being the world’s financial capital, a global center for art, fashion, music, and much more, and it is where the United Nations resides. So while the United States’ overall racial and ethnic diversity has increased since 2010, according to 2020 Census analyses, New York’s has already been one of the most diverse cities.
In the late 19th and early 20th centuries, millions of immigrants, mainly from European countries, who sailed to the United States came through New York Harbor and were processed at Ellis Island. Many also chose to stay in New York. In fact, it is estimated that close to 40% of all current U.S. citizens can trace at least one of their ancestors to Ellis Island.
Another contributing factor to the city’s diversity was the Great Migration of 1910 to 1970. At the time, Black Americans moved in droves from the South to Northern, Midwestern, and Western states, pursuing economic and educational opportunities, and fleeing oppression of Jim Crow. It is considered one of the largest movements of people in United States history. In the First Great Migration (1910-1940) particularly, Black Americans moved to Midwest and Northern cities, including New York.
To better understand diversity within New York City, 24/7 Wall St. calculated an index similar to that the Census Bureau developed that measures the chance that two people chosen at random will be from different race and ethnicity groups.
Reviewing five-year data on race and ethnicity from the U.S. Census Bureau’s 2022 American Community Survey, neighborhoods in New York City were ranked based on that probability. Racial and ethnic groups include white, Black or African American, American Indian and Alaska Native, Asian, Native Hawaiian and other Pacific Islander, Hispanic or Latino, some other race alone, and two or more races.
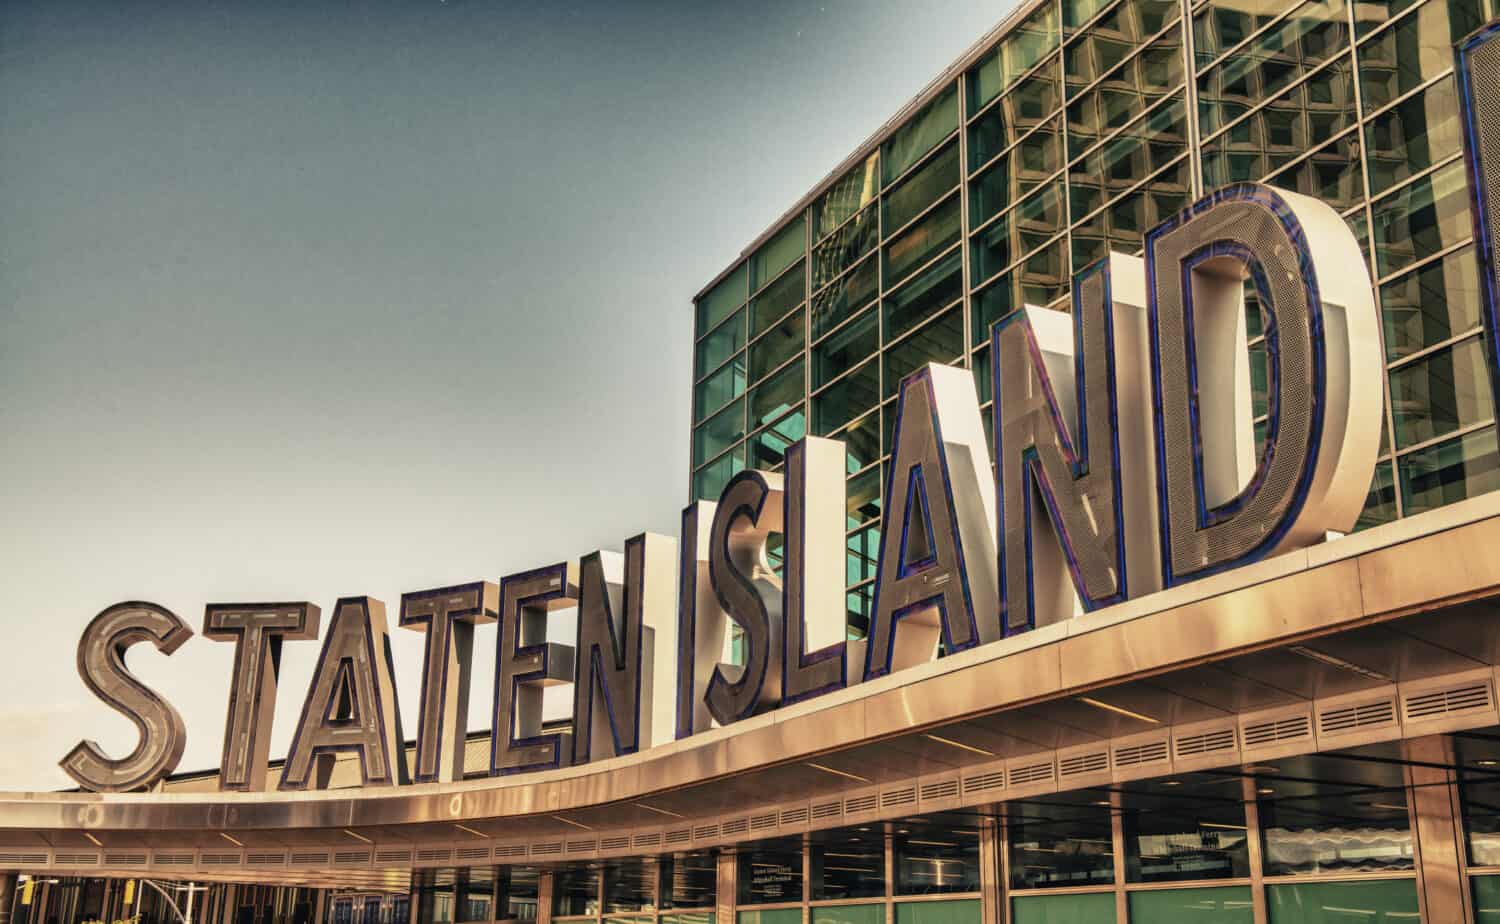
By far, Queens has the most neighborhoods on the list, at 22, followed by Staten Island at 12, Brooklyn at eight, Manhattan at five, and Bronx at three. (Also see: Most Diverse Neighborhoods On the West Coast.)
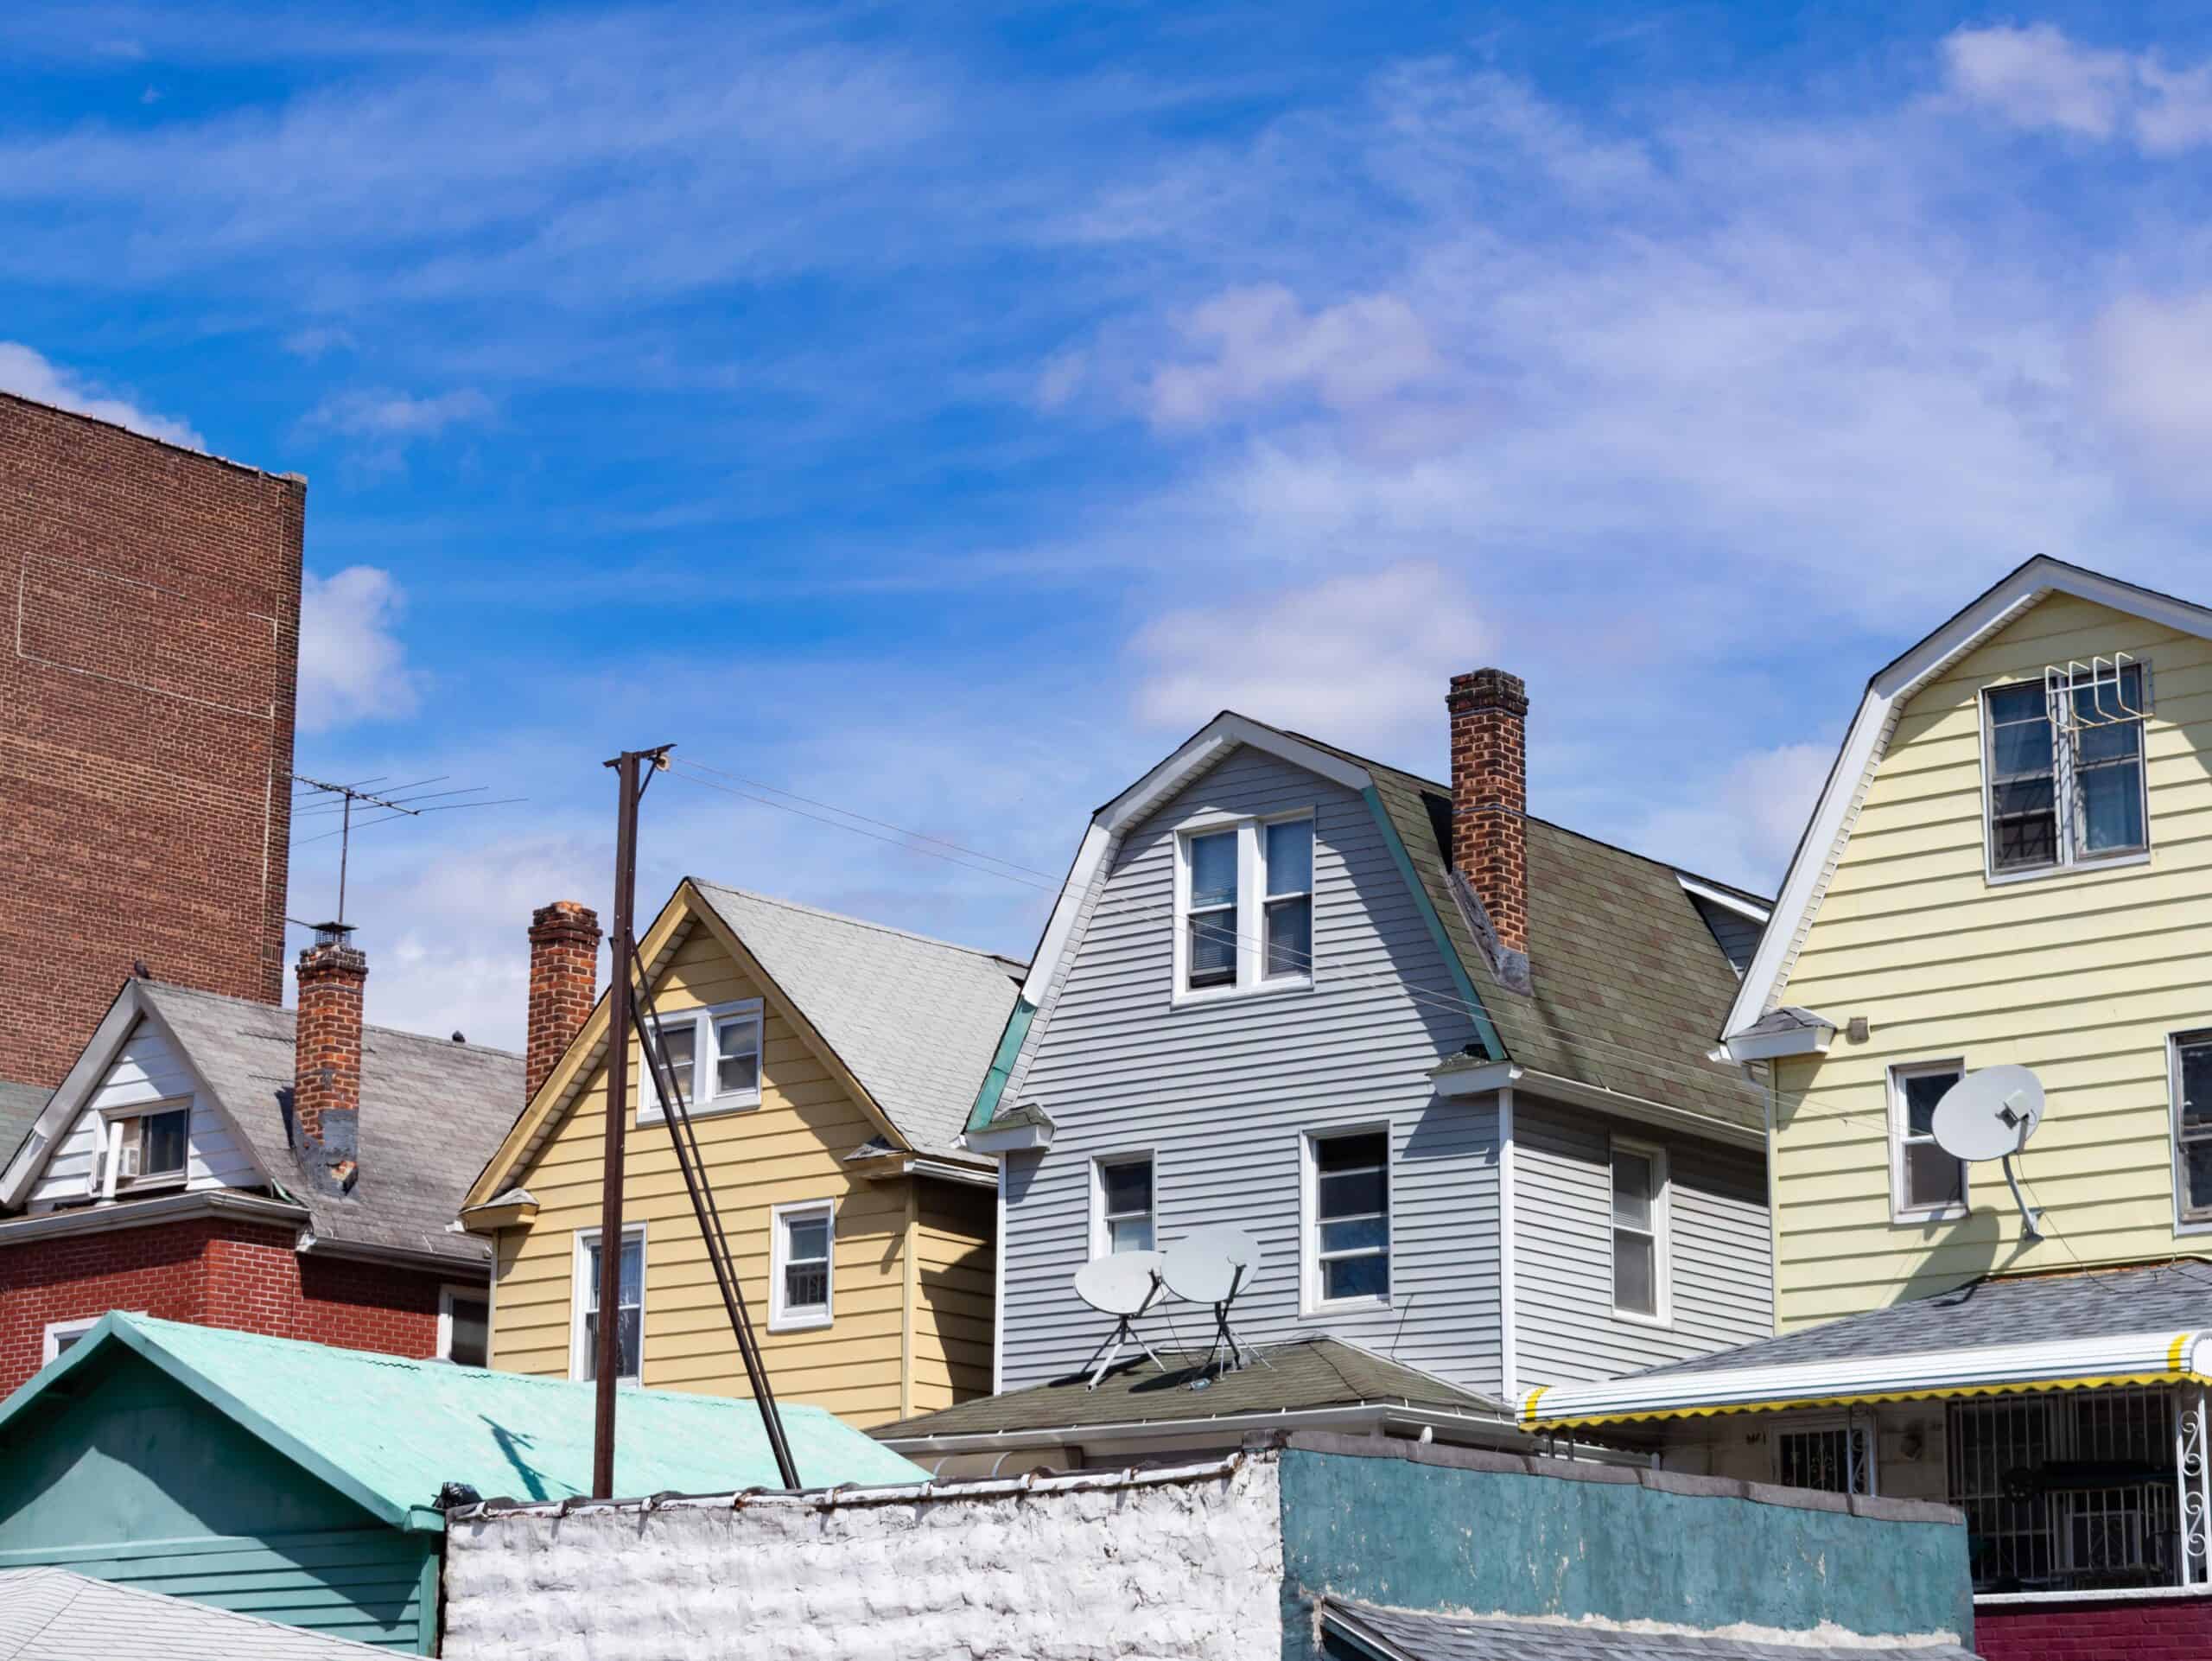
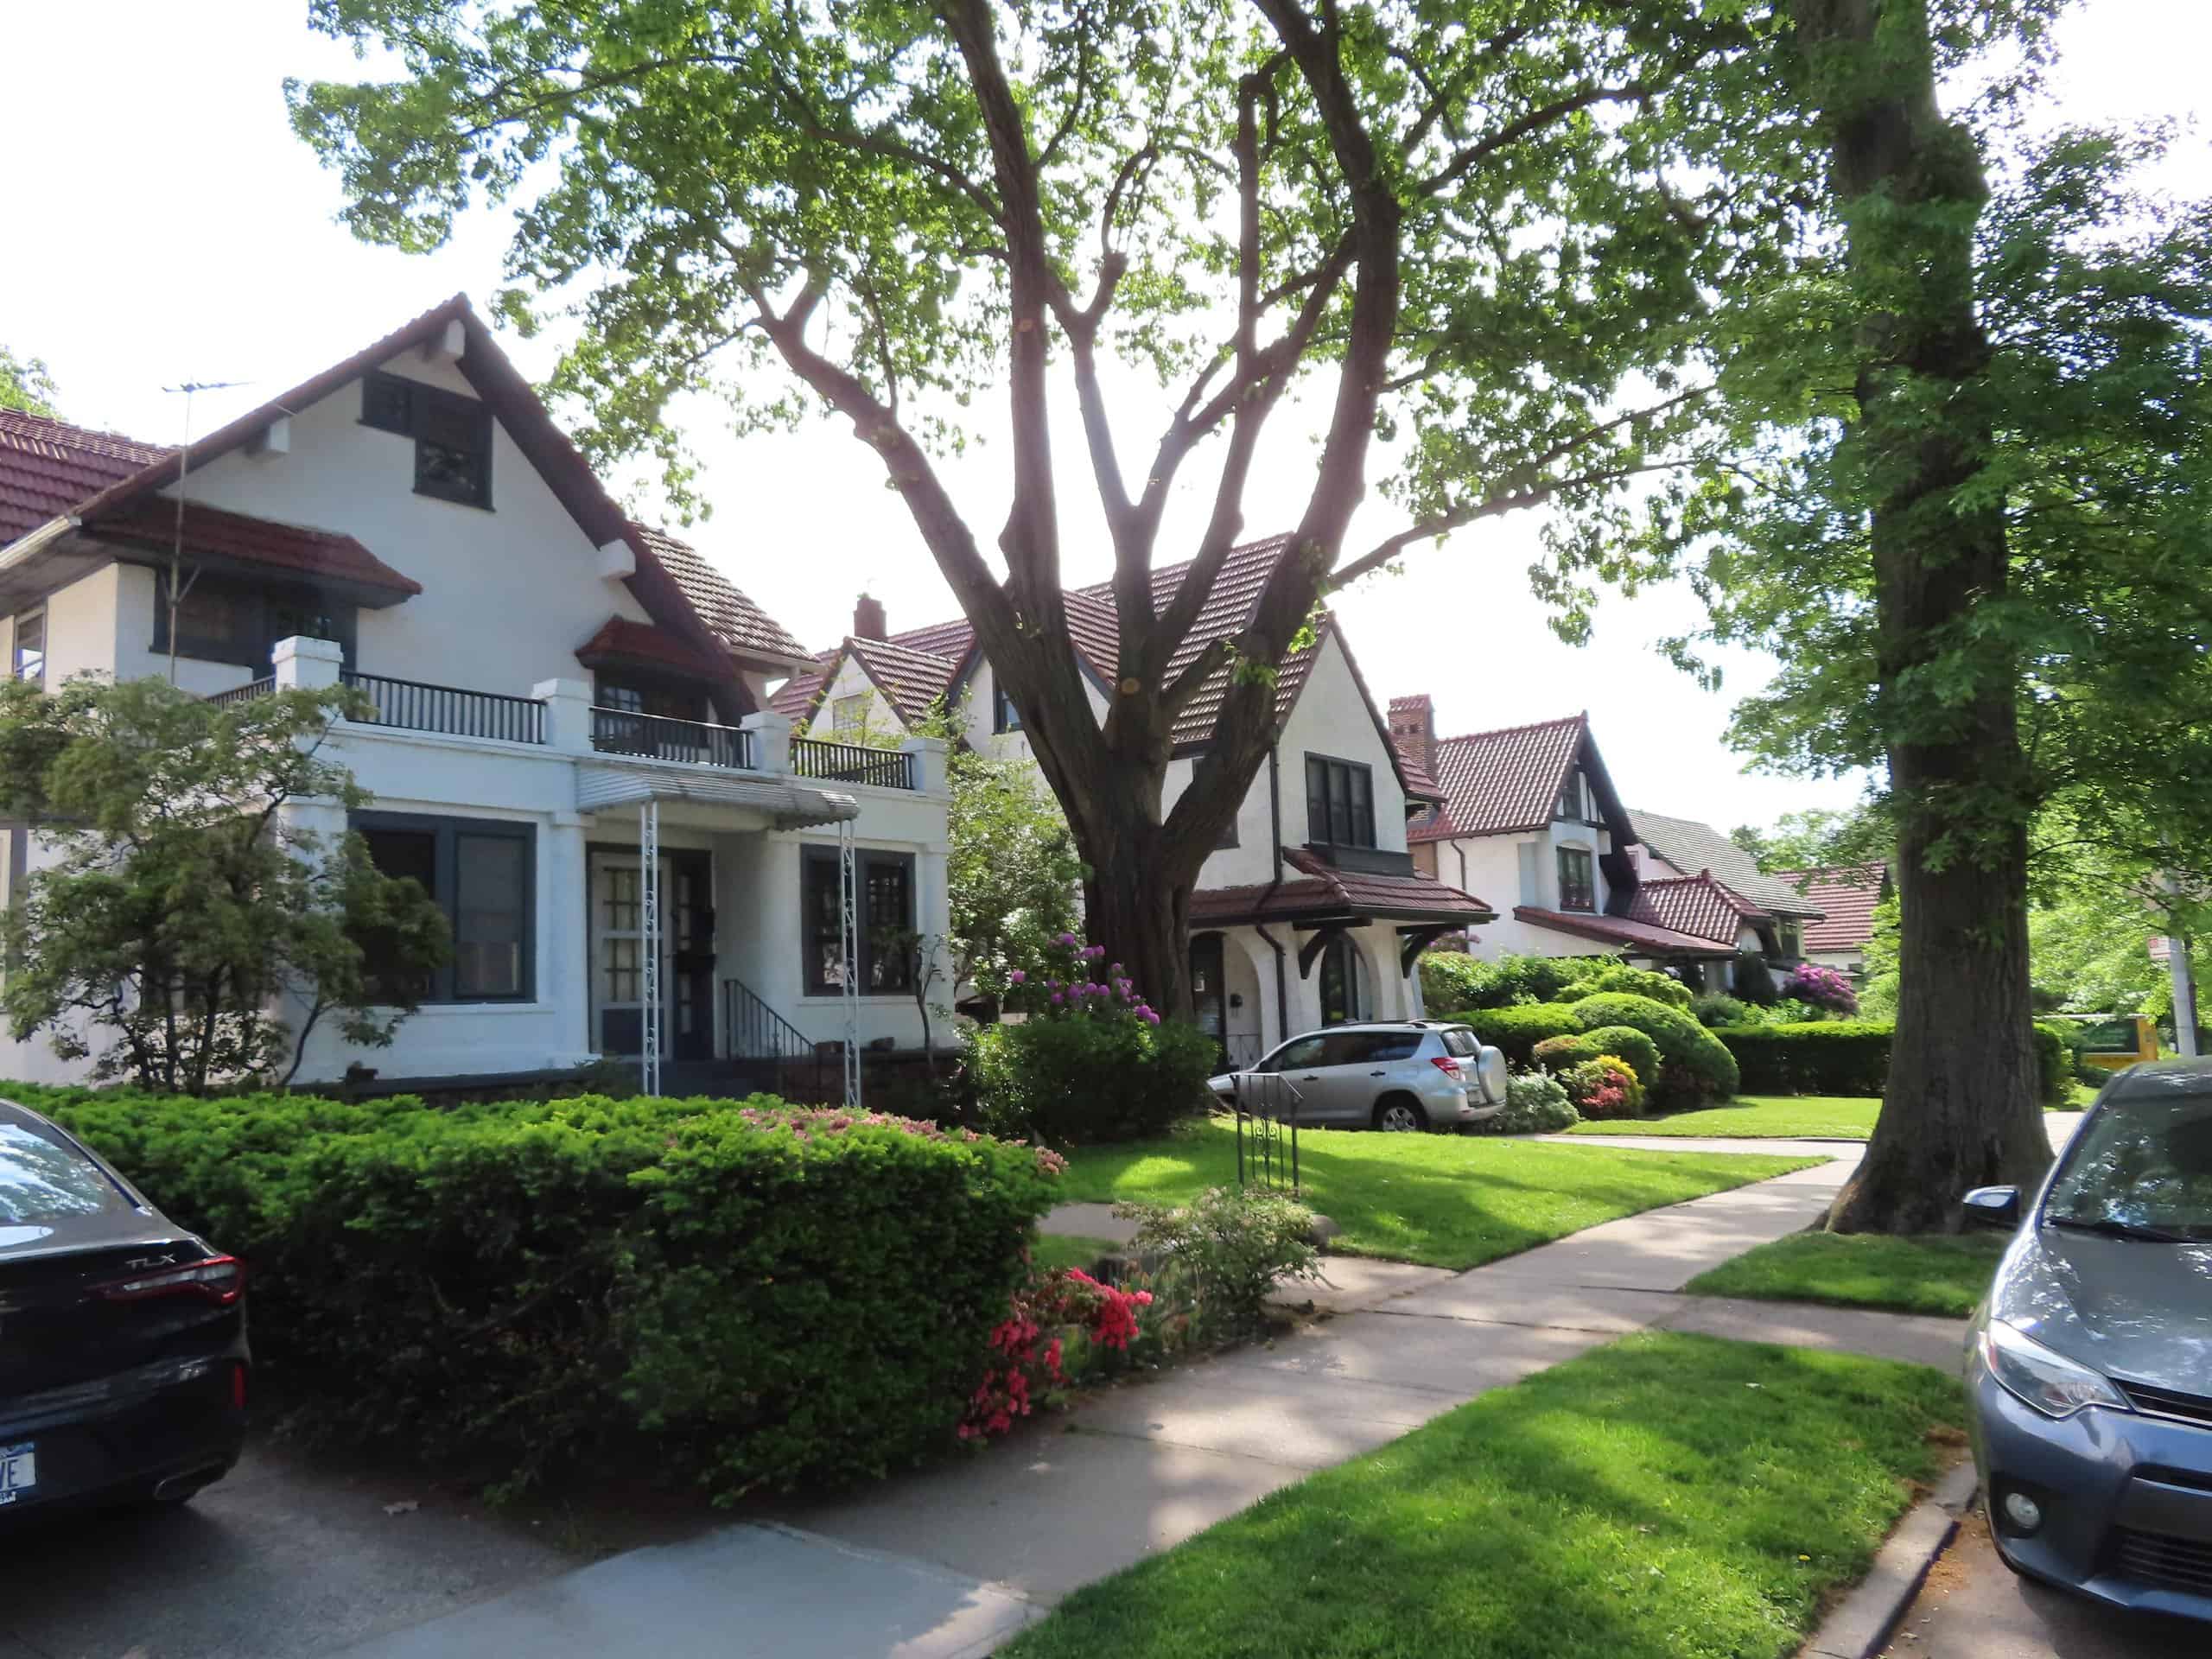
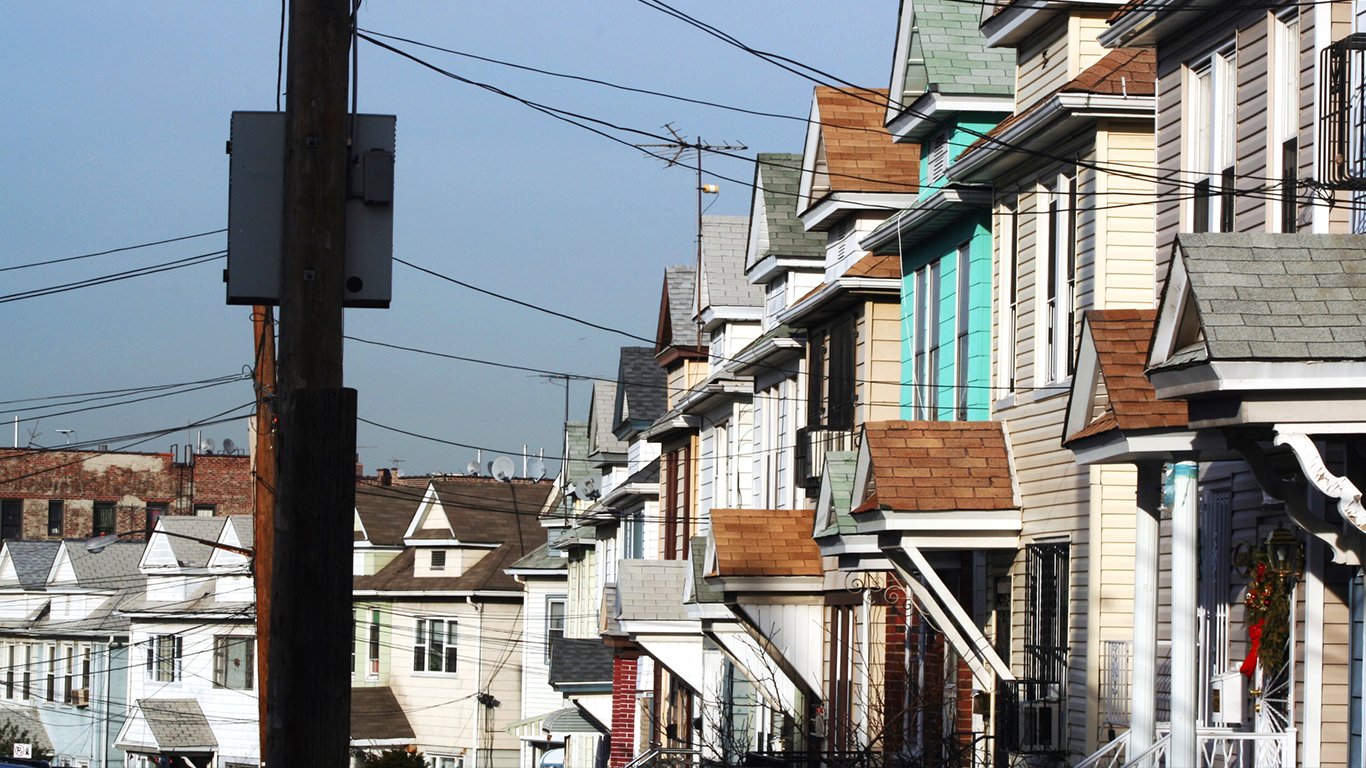
Housing is very expensive in New York, including in the most diverse neighborhood listed here. None of the 50 neighborhoods has a typical home value that is lower than the U.S. typical home value in November 2023 of $342,099. In fact, 41 of the 50 neighborhoods have a typical housing value above half a million dollars.
Full Methodology
To determine the most diverse neighborhoods, 24/7 Tempo reviewed five-year data on race and ethnicity from the U.S. Census Bureau’s 2022 American Community Survey. Neighborhoods were ranked based on the probability that two residents picked at random will be of different race or ethnicity. Racial and ethnic groups include white, Black or African American, American Indian and Alaska Native, Asian, Native Hawaiian and other Pacific Islander, Hispanic or Latino, some other race alone, and two or more races. The probability that any two residents picked at random will belong to a different racial or ethnic category is equivalent to the sum of the squares of each group’s share of the population, subtracted from 1. The same method is used in the USA Today Diversity Index as well as the racial and ethnic diversity index of the Disseminating Diversity Working Group of the Census Bureau.
Data on population by race and ethnicity were aggregated from the census tract level to the neighborhood level using 2022 census tract boundary definitions from the U.S. Census Bureau and 2017 neighborhood boundary definitions from Zillow. Census tracts with at least 50% spatial overlap within the neighborhood boundary were included in population aggregation. Data on estimated median home value is the November 2023 Zillow Home Value Index, a measure of typical home values for homes in the 35th to 65th percentile range.
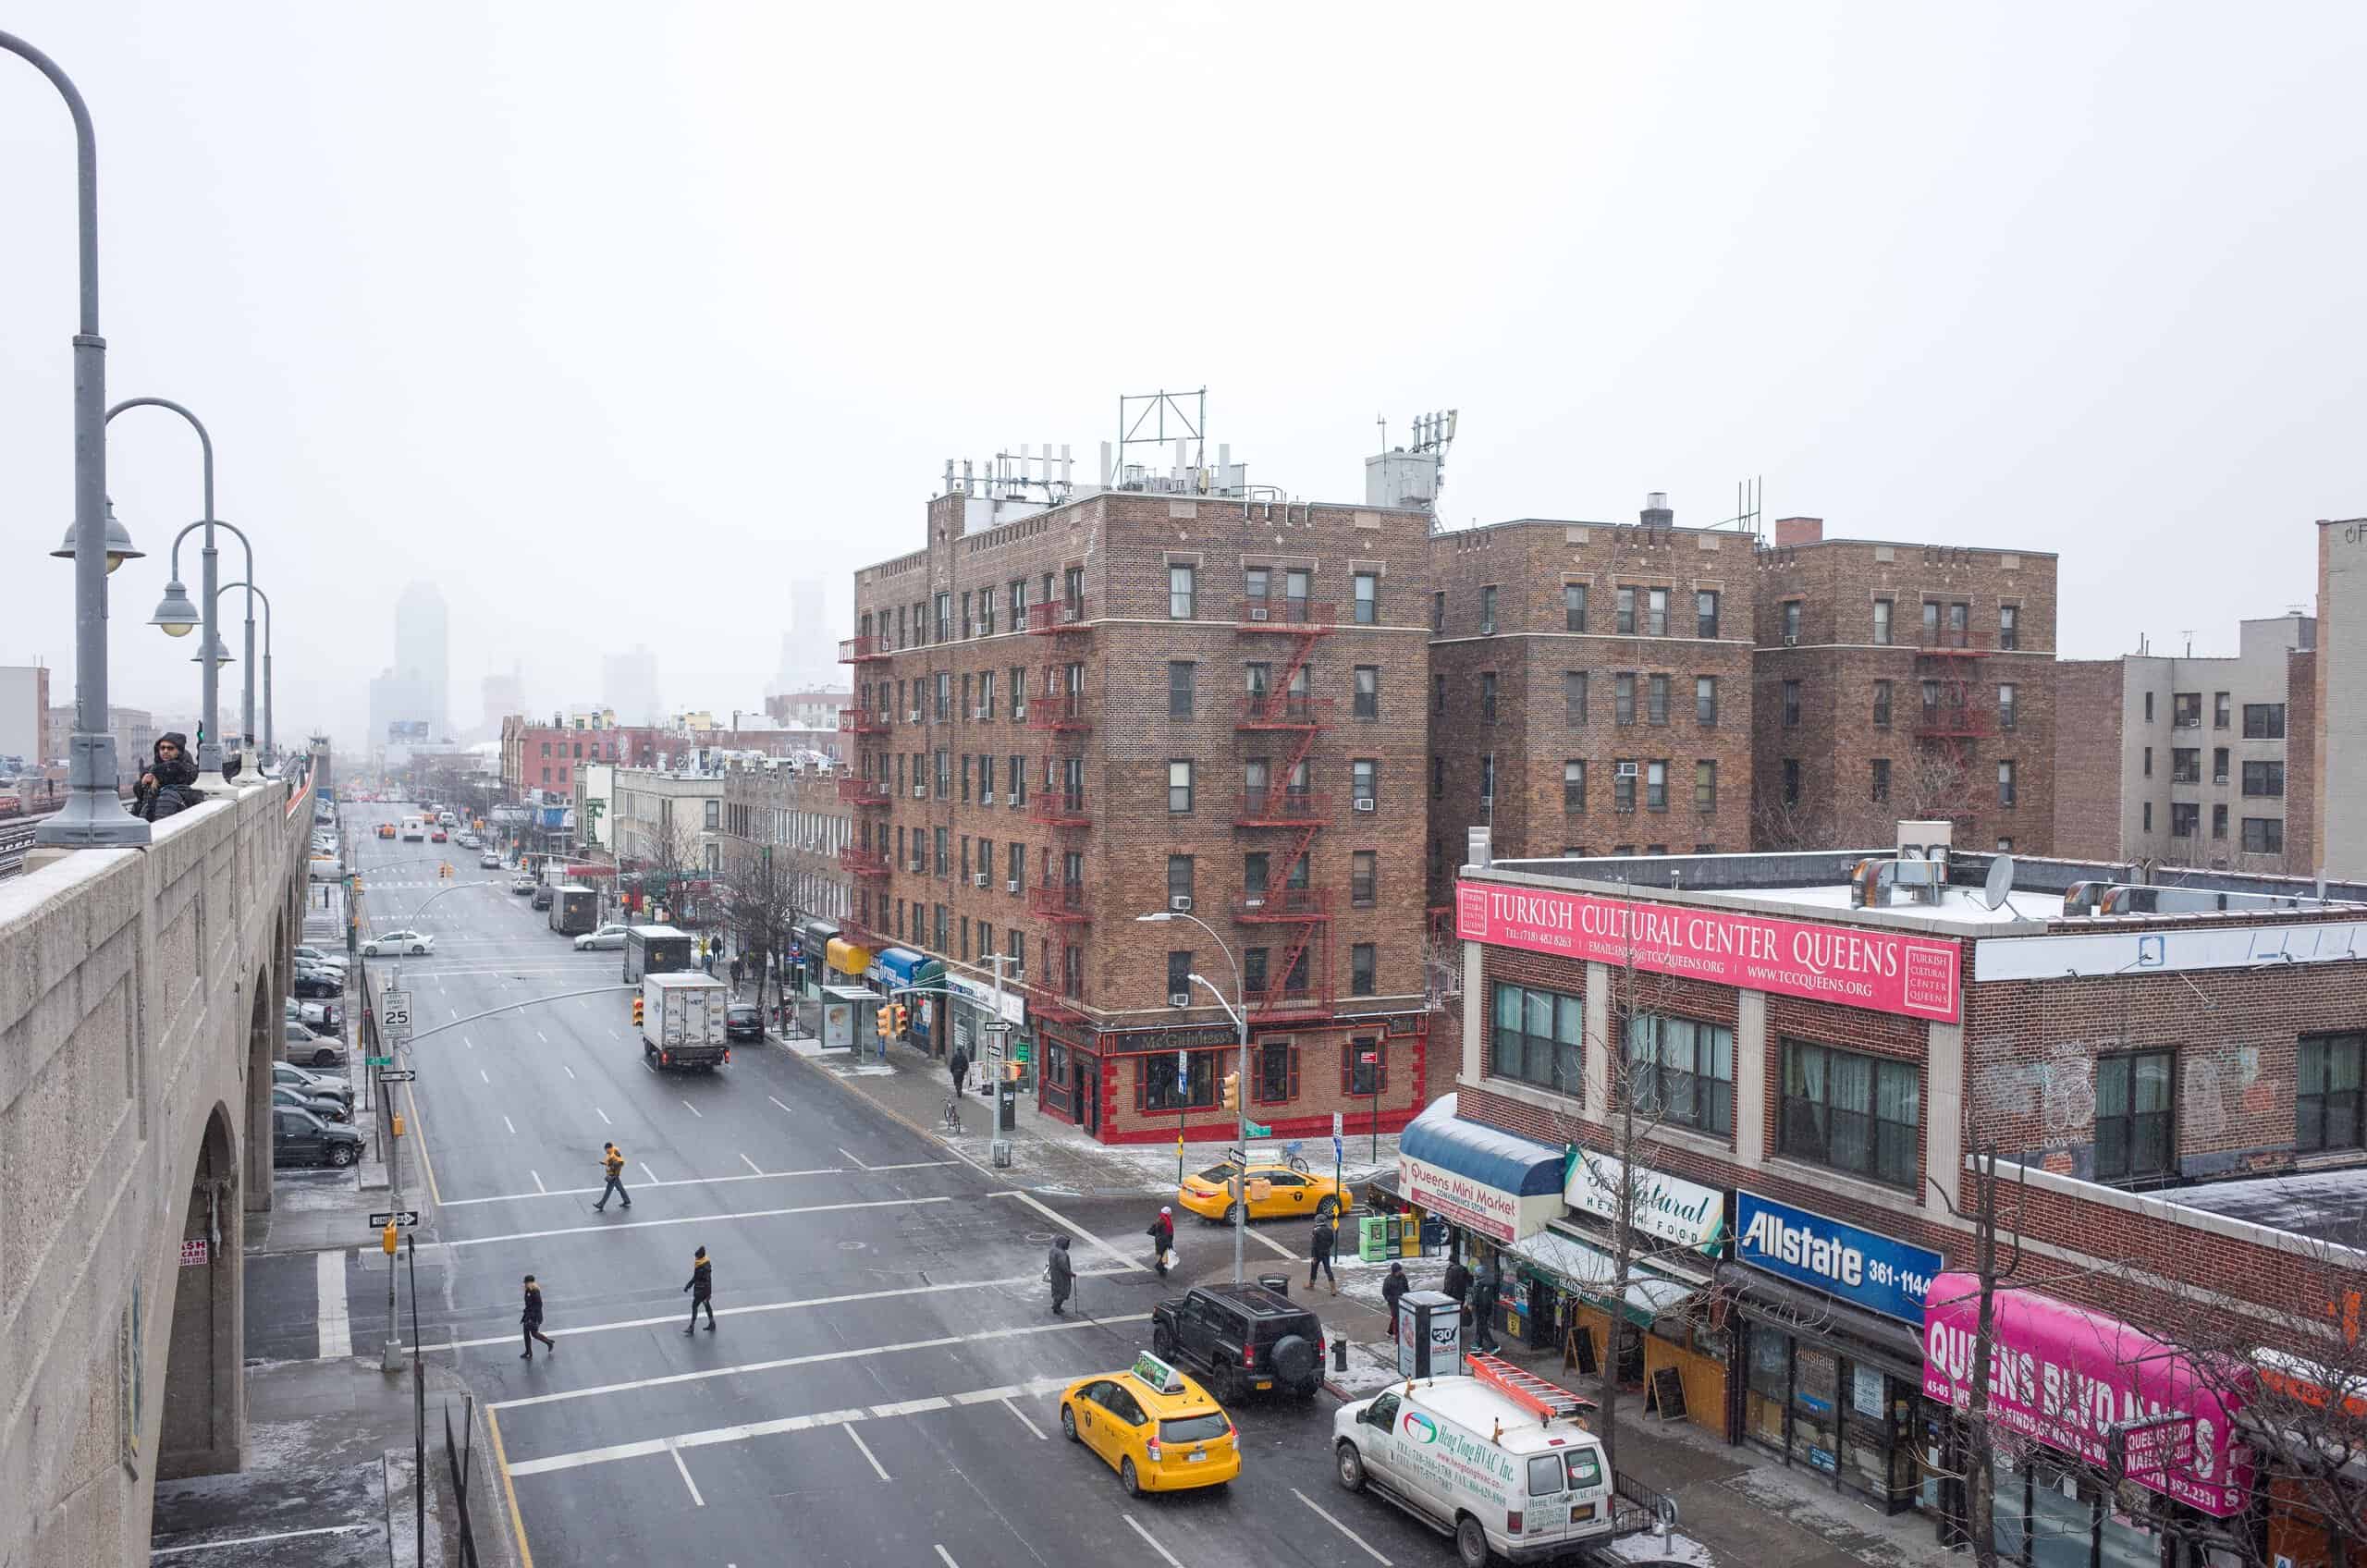
50. Woodside (Queens)
Source: James Andrews / iStock via Getty Images
- Likelihood that two random residents are different race or ethnicity: 67.1%
- Most prevalent race or ethnicity group: Asian (38.7%)
- Est. typical home value in Nov 2023: $437,772
- Est. population in 2022: 46,138
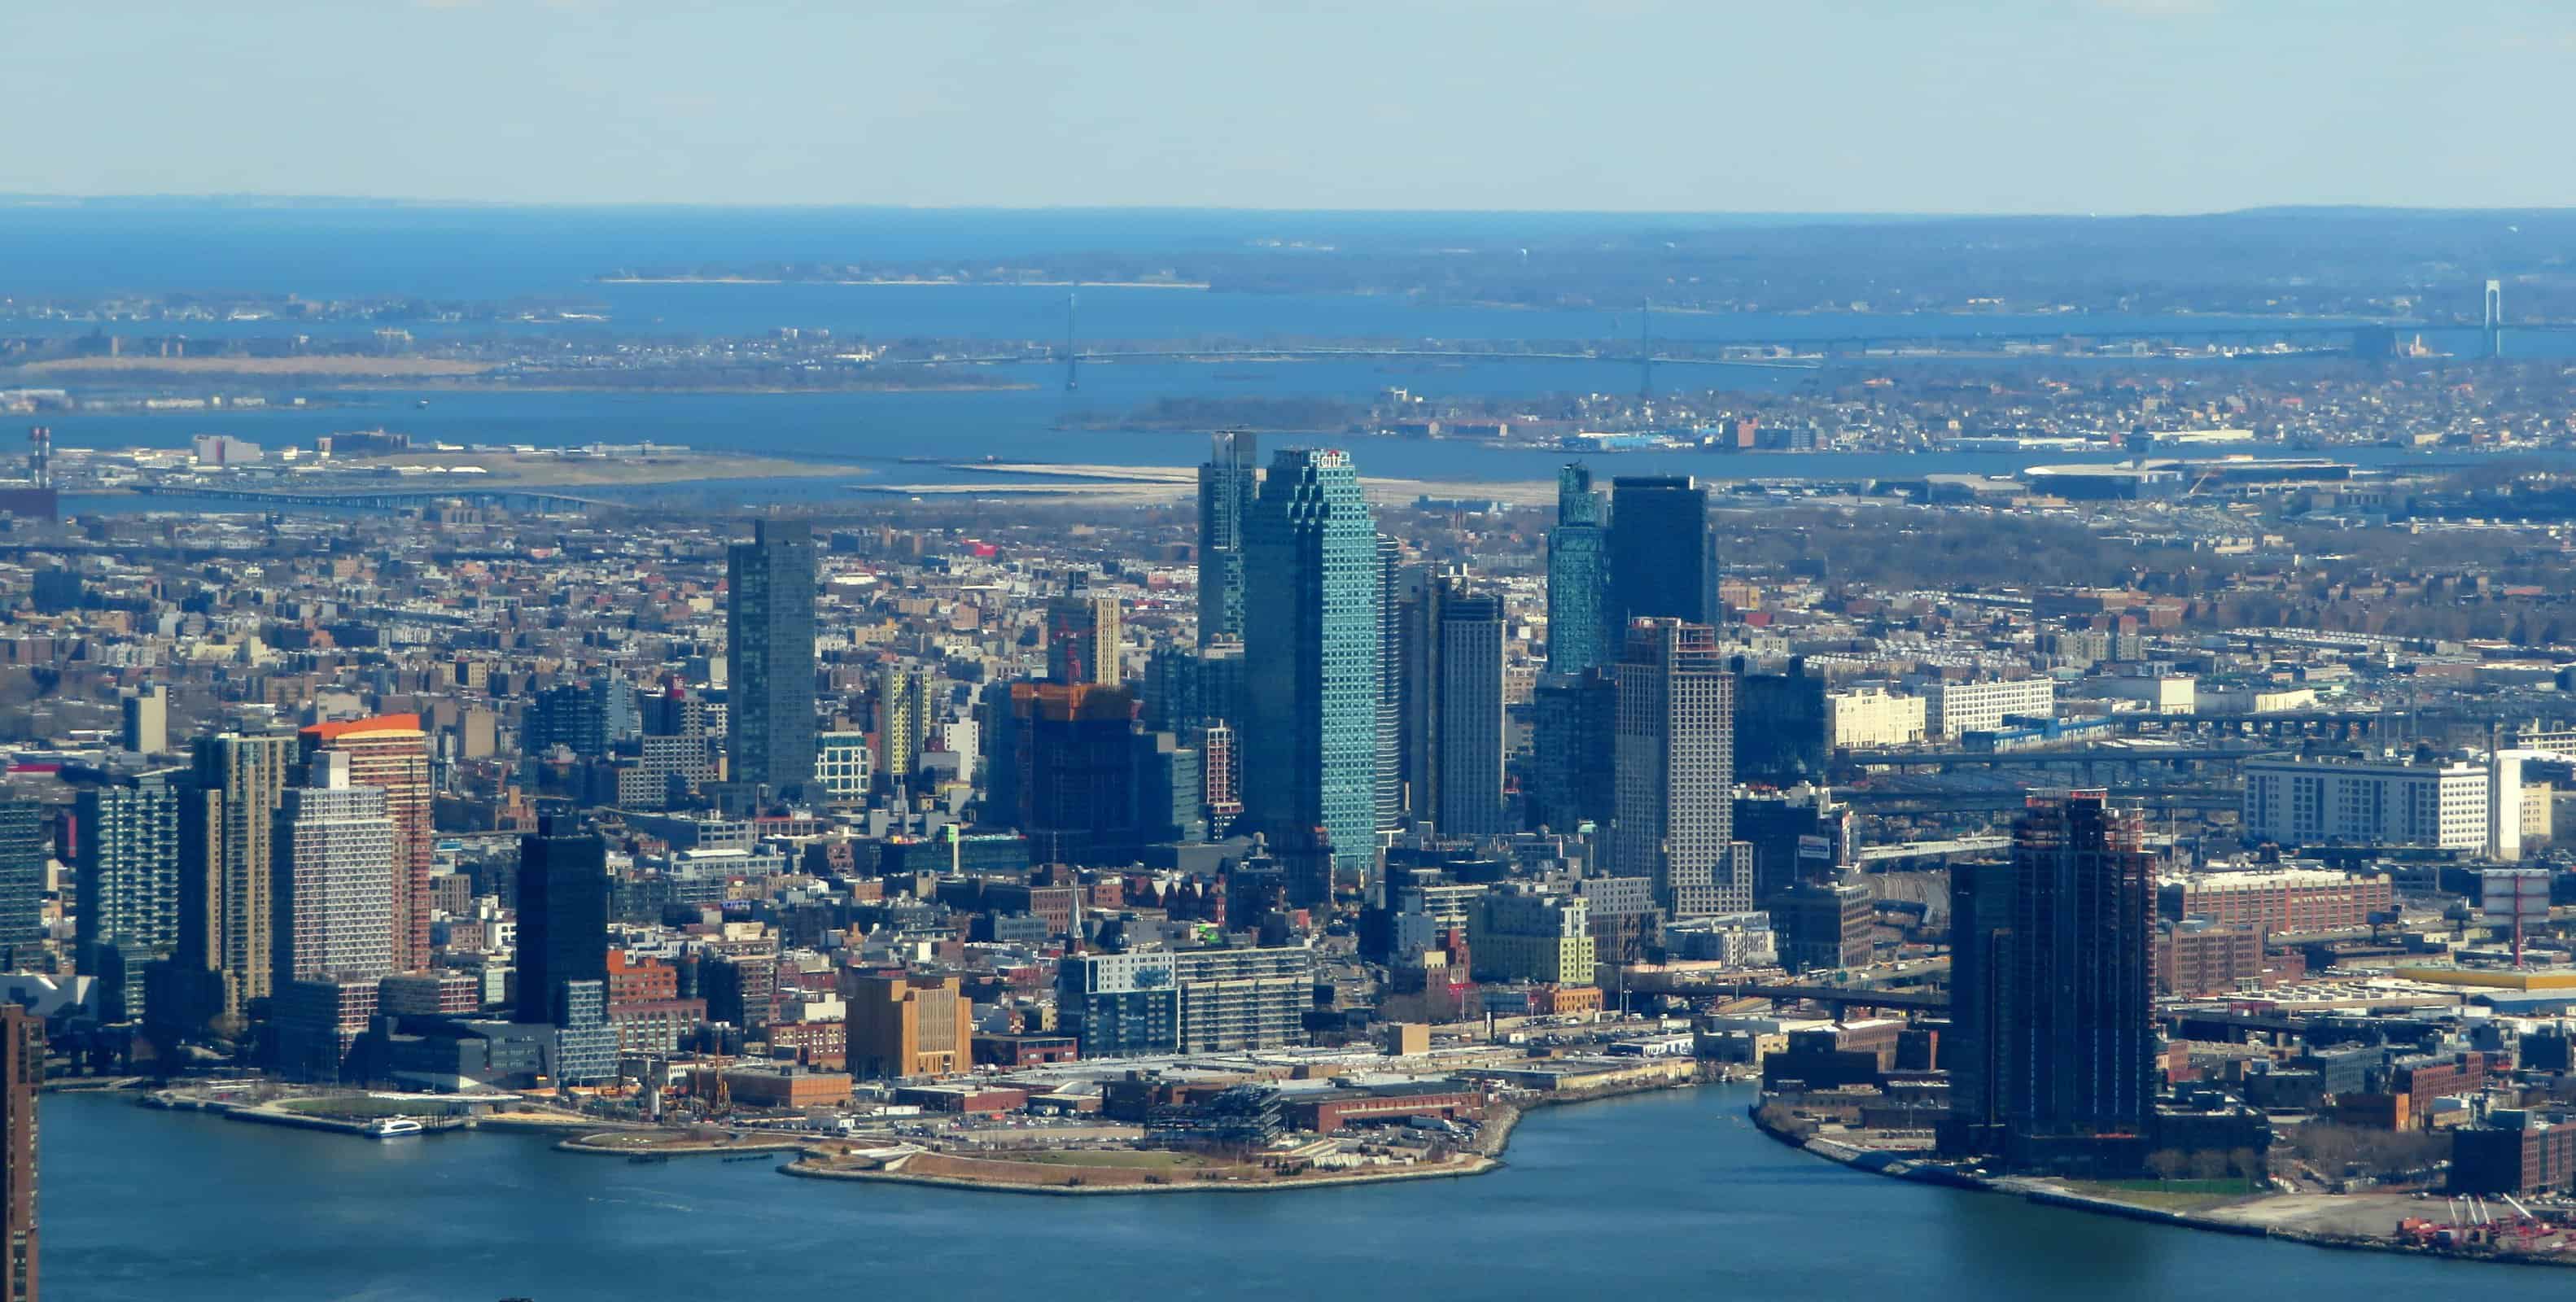
49. Hunters Point (Queens)
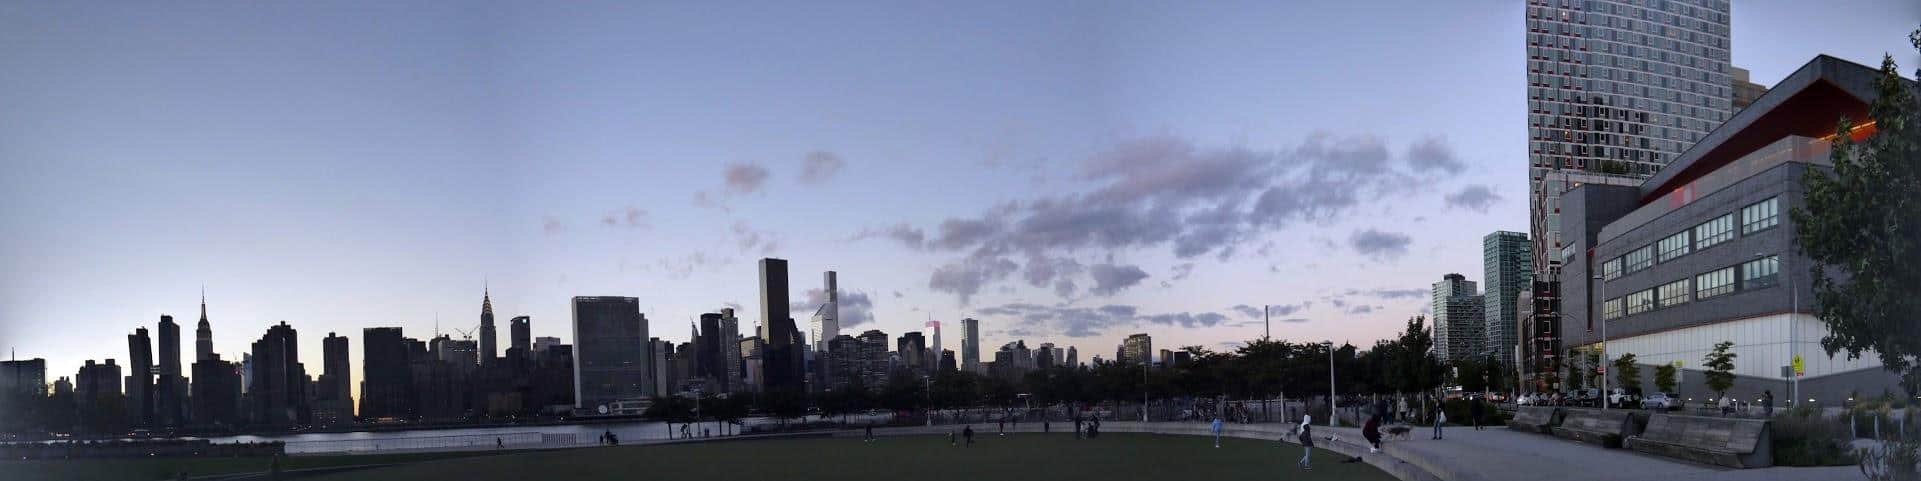
Source: edenpictures / Flickr
- Likelihood that two random residents are different race or ethnicity: 67.2%
- Most prevalent race or ethnicity group: White (45.6%)
- Est. typical home value in Nov 2023: N/A
- Est. population in 2022: 25,531
48. College Point (Queens)

Source: 30484128@N03 / Flickr
- Likelihood that two random residents are different race or ethnicity: 67.2%
- Most prevalent race or ethnicity group: Hispanic or Latino (39.5%)
- Est. typical home value in Nov 2023: $782,125
- Est. population in 2022: 18,600
46. Bath Beach (Brooklyn)
Source: RomanBabakin / iStock via Getty Images
- Likelihood that two random residents are different race or ethnicity: 67.5%
- Most prevalent race or ethnicity group: White (41.8%)
- Est. typical home value in Nov 2023: $740,843
- Est. population in 2022: 47,624
45. Astoria (Queens)
Source: Boogich / E+ via Getty Images
- Likelihood that two random residents are different race or ethnicity: 67.8%
- Most prevalent race or ethnicity group: White (47.2%)
- Est. typical home value in Nov 2023: $664,069
- Est. population in 2022: 158,380
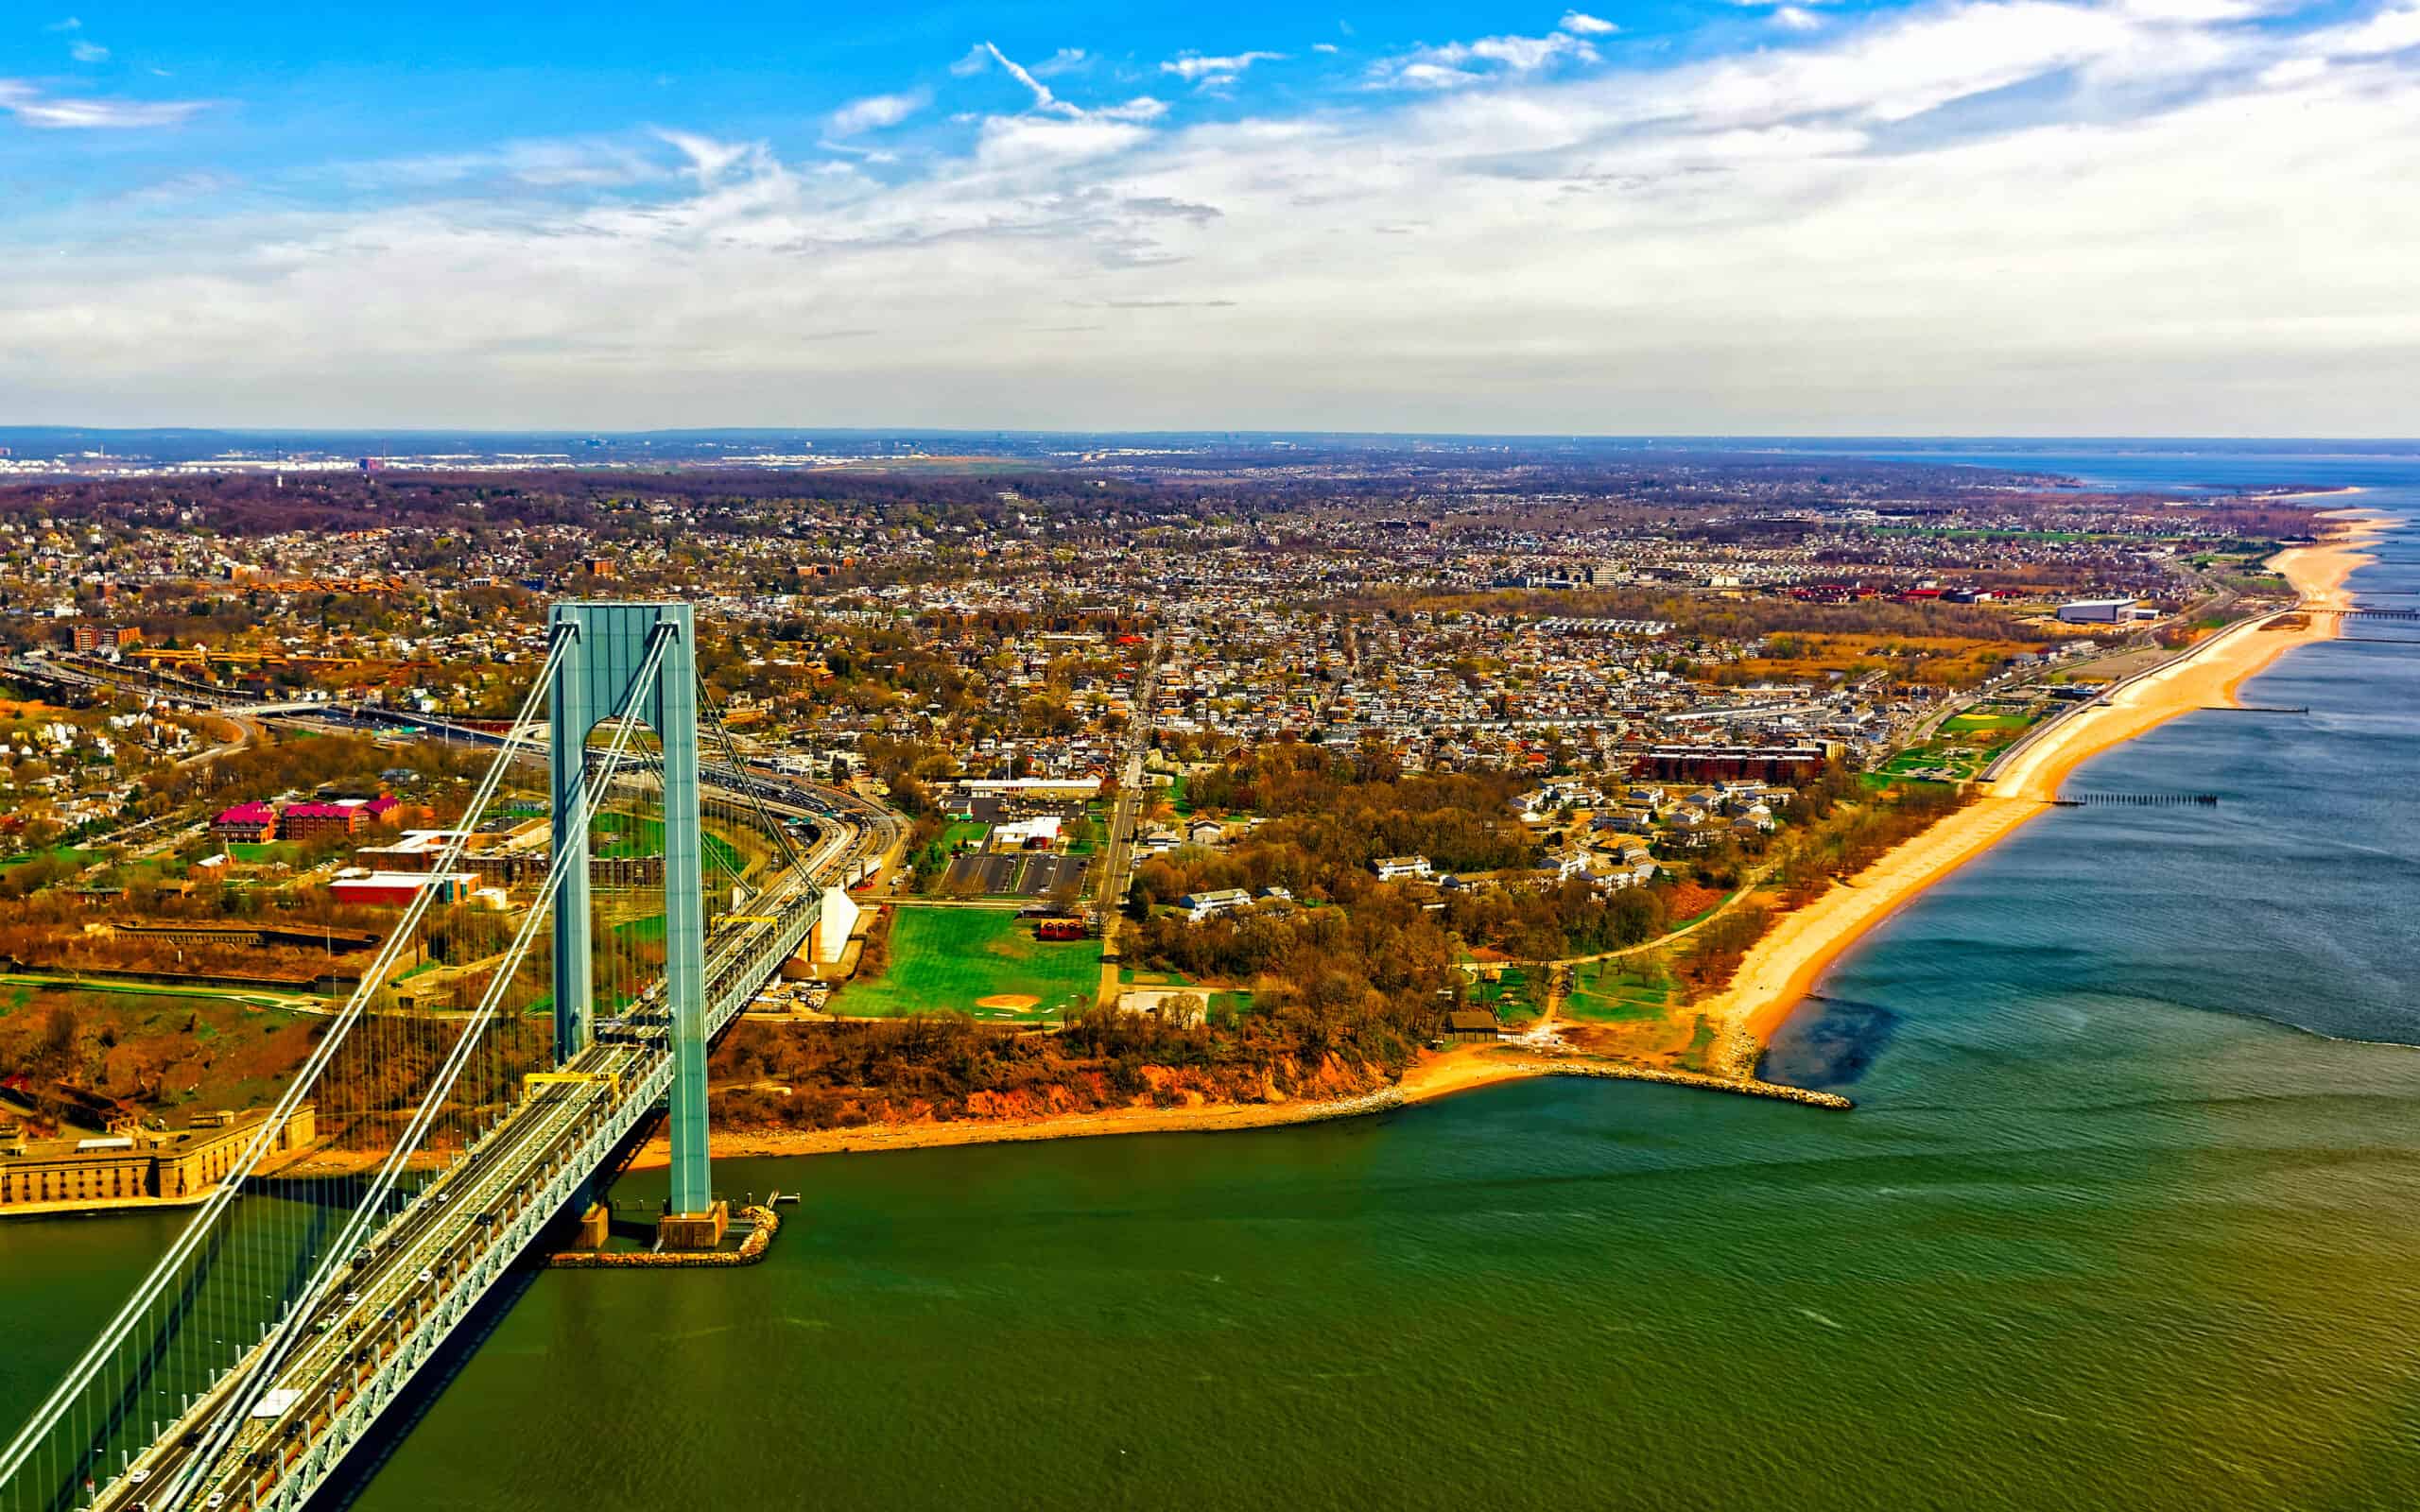
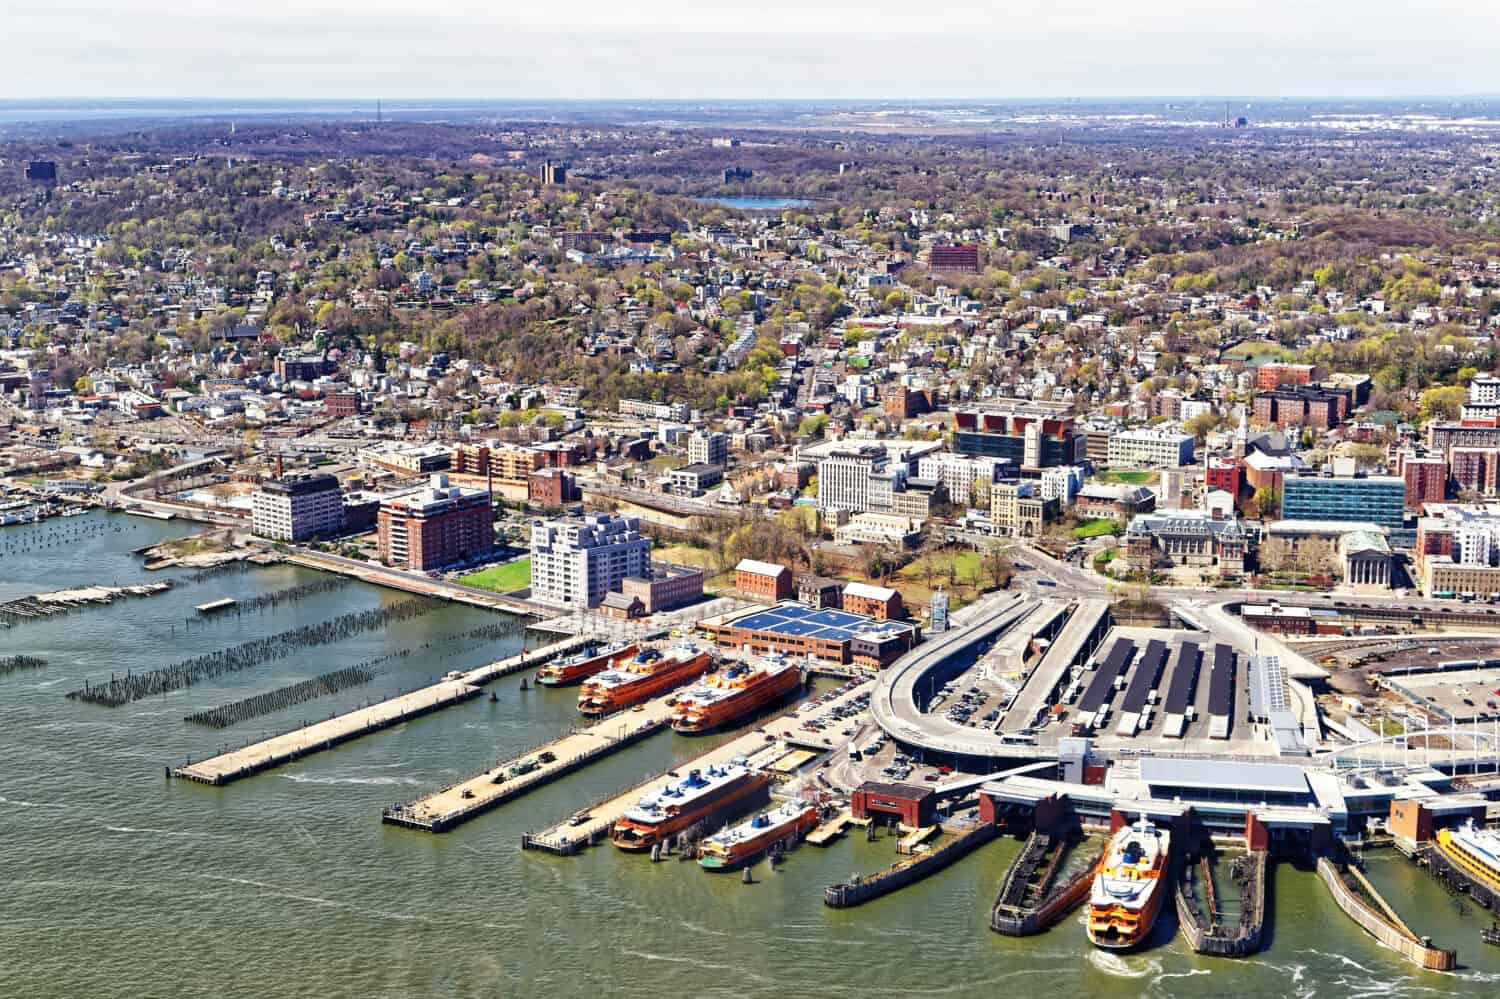
44. Mariner’s Harbor (Staten Island)
Source: pisaphotography / Shutterstock.com
- Likelihood that two random residents are different race or ethnicity: 67.8%
- Most prevalent race or ethnicity group: Hispanic or Latino (41.7%)
- Est. typical home value in Nov 2023: $499,284
- Est. population in 2022: 13,565
43. Red Hook (Brooklyn)
Source: stevenpisano / Flickr
- Likelihood that two random residents are different race or ethnicity: 67.9%
- Most prevalent race or ethnicity group: Black or African American (42.0%)
- Est. typical home value in Nov 2023: $1,720,589
- Est. population in 2022: 9,295
42. Bedford Stuyvesant (Brooklyn)
Source: Photo by Andrew Lichtenstein / Corbis via Getty Images
- Likelihood that two random residents are different race or ethnicity: 68.0%
- Most prevalent race or ethnicity group: Black or African American (45.7%)
- Est. typical home value in Nov 2023: $924,648
- Est. population in 2022: 180,911
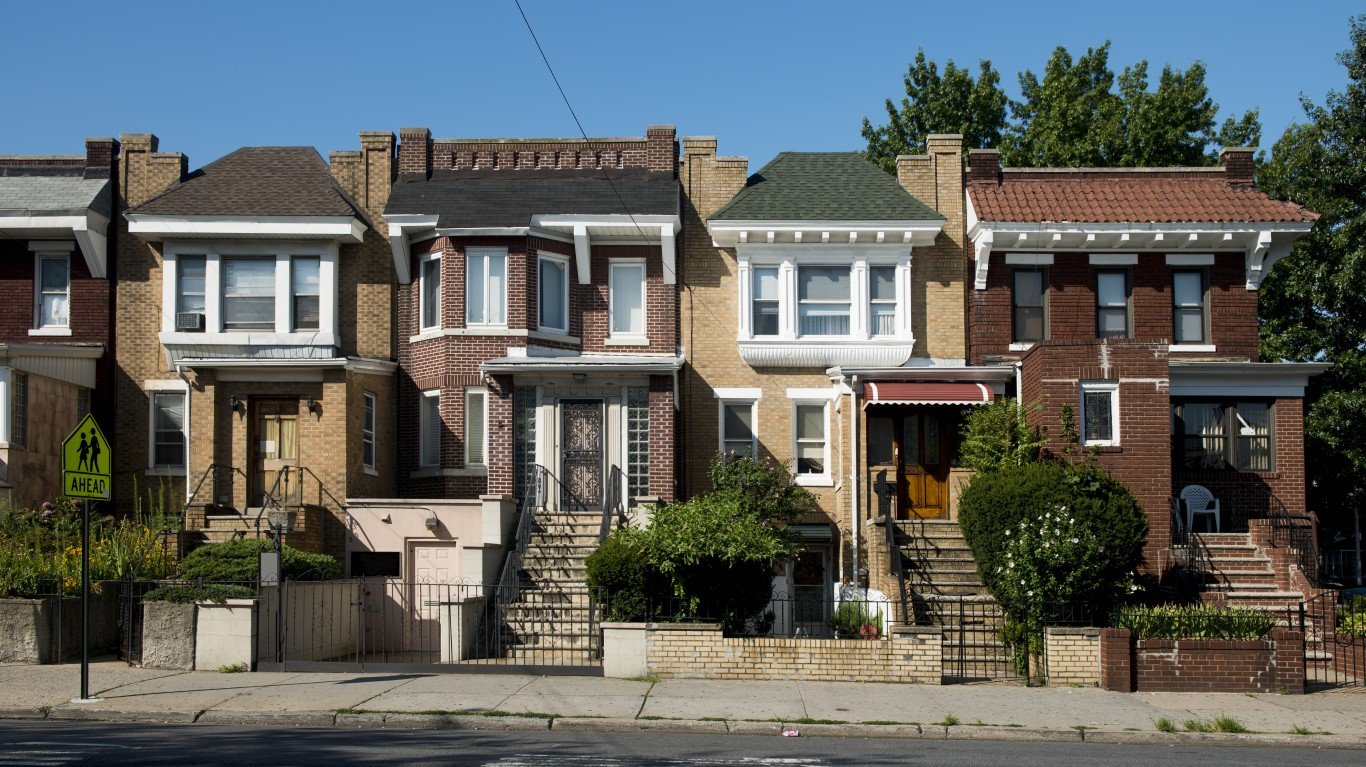
41. Queens Village (Queens)

- Likelihood that two random residents are different race or ethnicity: 68.0%
- Most prevalent race or ethnicity group: Black or African American (49.7%)
- Est. typical home value in Nov 2023: $681,609
- Est. population in 2022: 55,911
40. Downtown (Brooklyn)
Source: jjbers / Flickr
- Likelihood that two random residents are different race or ethnicity: 68.5%
- Most prevalent race or ethnicity group: White (47.2%)
- Est. typical home value in Nov 2023: $942,463
- Est. population in 2022: 12,343
39. Coney Island (Brooklyn)
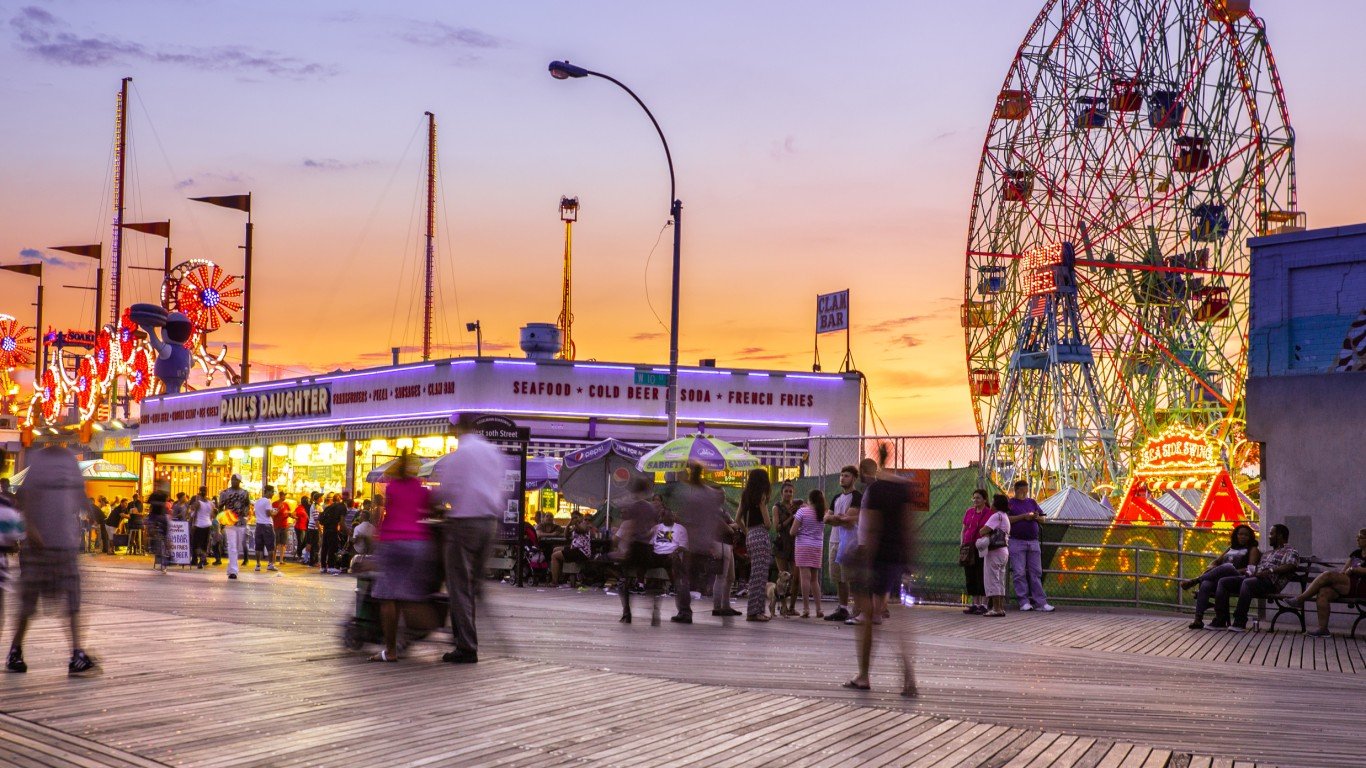
Source: littleny / iStock Editorial via Getty Images
- Likelihood that two random residents are different race or ethnicity: 68.6%
- Most prevalent race or ethnicity group: White (47.2%)
- Est. typical home value in Nov 2023: $501,281
- Est. population in 2022: 46,030
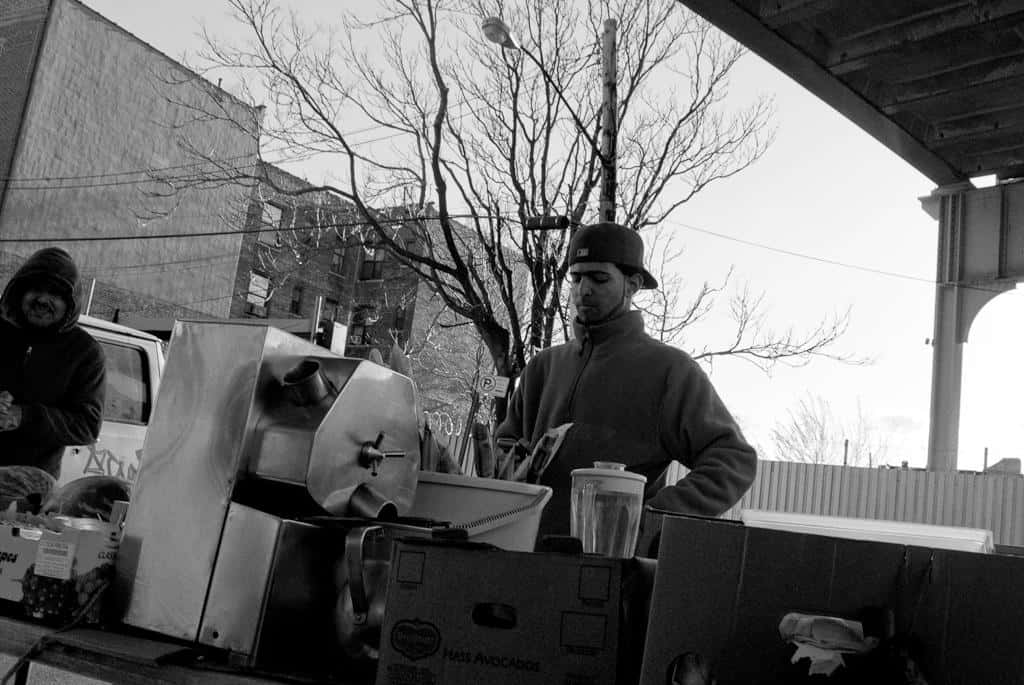
38. East Harlem (Manhattan)
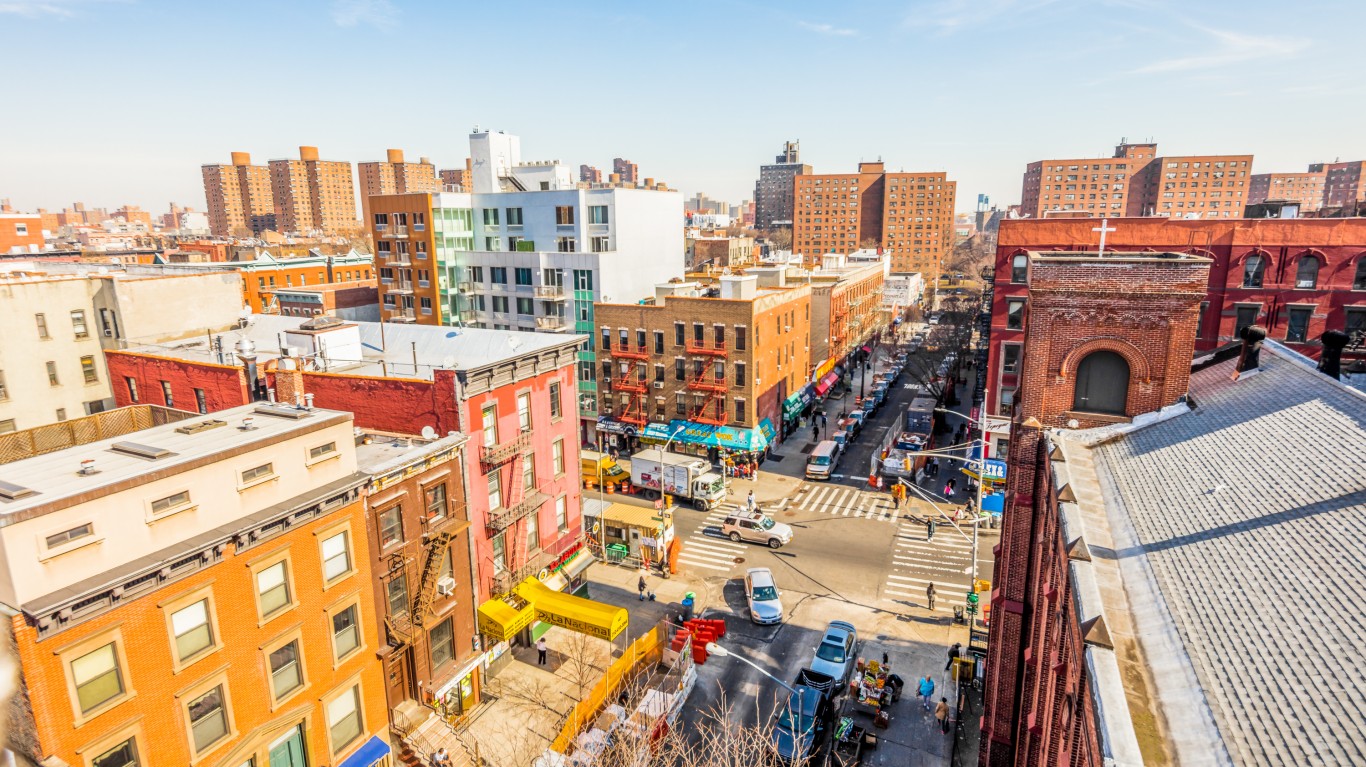
Source: tatarac / Getty Images
- Likelihood that two random residents are different race or ethnicity: 68.7%
- Most prevalent race or ethnicity group: Hispanic or Latino (43.8%)
- Est. typical home value in Nov 2023: $626,584
- Est. population in 2022: 111,071
37. Elm Park (Staten Island)
Source: Roman Babakin / Getty Images
- Likelihood that two random residents are different race or ethnicity: 68.7%
- Most prevalent race or ethnicity group: Hispanic or Latino (47.7%)
- Est. typical home value in Nov 2023: $530,308
- Est. population in 2022: 2,173
36. Clinton Hill (Brooklyn)
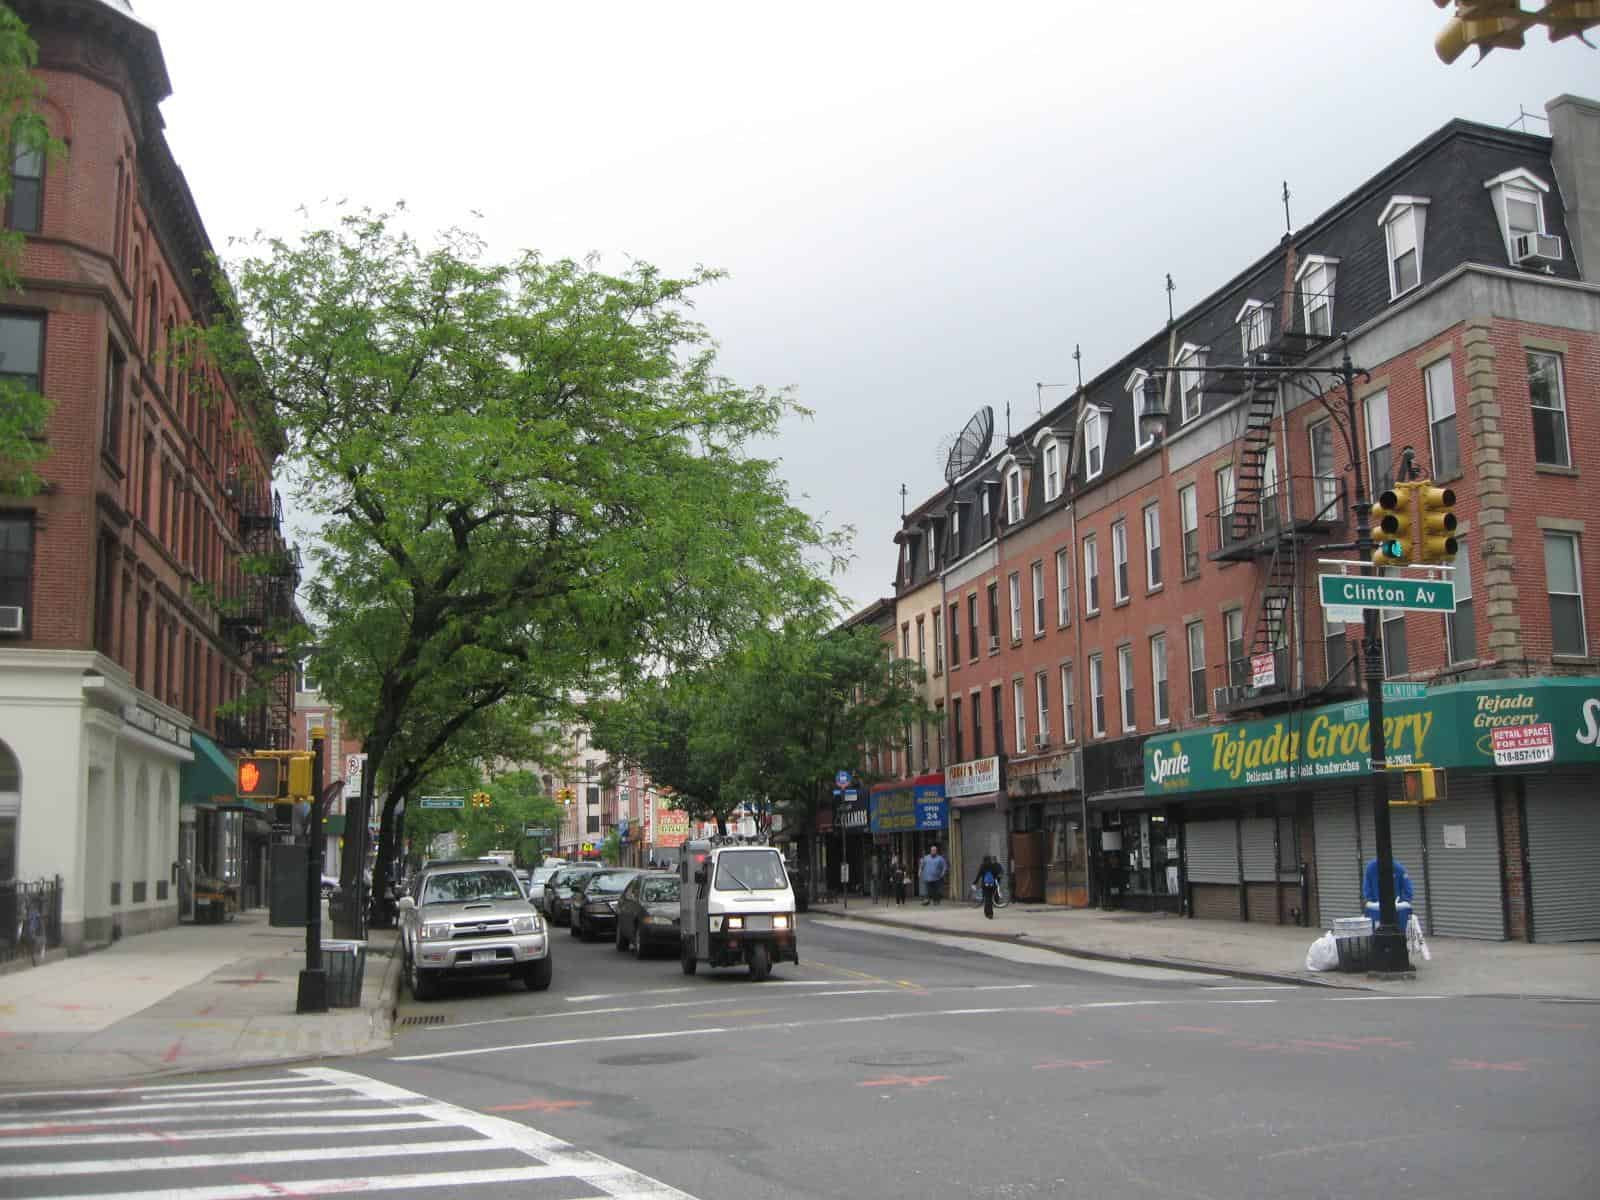
Source: basic_sounds / Flickr
- Likelihood that two random residents are different race or ethnicity: 68.8%
- Most prevalent race or ethnicity group: White (47.4%)
- Est. typical home value in Nov 2023: $937,882
- Est. population in 2022: 24,403
35. Morris Park (Bronx)
Source: kenlund / Flickr
- Likelihood that two random residents are different race or ethnicity: 68.9%
- Most prevalent race or ethnicity group: Hispanic or Latino (45.3%)
- Est. typical home value in Nov 2023: $675,674
- Est. population in 2022: 34,673
34. Park Hill (Staten Island)
Source: Jayne Lipkovich / Shutterstock.com
- Likelihood that two random residents are different race or ethnicity: 69.3%
- Most prevalent race or ethnicity group: Black or African American (43.0%)
- Est. typical home value in Nov 2023: $499,419
- Est. population in 2022: 9,231
33. Kensington (Brooklyn)
Source: nickgulotta / Flickr
- Likelihood that two random residents are different race or ethnicity: 69.3%
- Most prevalent race or ethnicity group: White (46.7%)
- Est. typical home value in Nov 2023: $654,074
- Est. population in 2022: 47,352
32. Port Morris (Bronx)
Source: dandeluca / Flickr
- Likelihood that two random residents are different race or ethnicity: 69.5%
- Most prevalent race or ethnicity group: Hispanic or Latino (42.3%)
- Est. typical home value in Nov 2023: N/A
- Est. population in 2022: 3,775
30. Port Richmond (Staten Island)
Source: jag9889 / Flickr
- Likelihood that two random residents are different race or ethnicity: 69.8%
- Most prevalent race or ethnicity group: Hispanic or Latino (41.3%)
- Est. typical home value in Nov 2023: $554,158
- Est. population in 2022: 14,236
29. Clifton (Staten Island)

Source: kenlund / Flickr
- Likelihood that two random residents are different race or ethnicity: 69.9%
- Most prevalent race or ethnicity group: Black or African American (40.2%)
- Est. typical home value in Nov 2023: $533,473
- Est. population in 2022: 3,399
28. West Brighton (Staten Island)
Source: shan213 / Flickr
- Likelihood that two random residents are different race or ethnicity: 69.9%
- Most prevalent race or ethnicity group: White (37.3%)
- Est. typical home value in Nov 2023: $634,512
- Est. population in 2022: 18,195
26. Bellerose (Queens)
Source: TierneyMJ / Shutterstock.com
- Likelihood that two random residents are different race or ethnicity: 70.1%
- Most prevalent race or ethnicity group: Asian (46.2%)
- Est. typical home value in Nov 2023: $734,385
- Est. population in 2022: 31,470
25. Rego Park (Queens)
Source: Bim / iStock via Getty Images
- Likelihood that two random residents are different race or ethnicity: 70.3%
- Most prevalent race or ethnicity group: White (39.0%)
- Est. typical home value in Nov 2023: $409,330
- Est. population in 2022: 44,200
24. Port Ivory (Staten Island)
Source: docsearls / Flickr
- Likelihood that two random residents are different race or ethnicity: 70.4%
- Most prevalent race or ethnicity group: Black or African American (37.2%)
- Est. typical home value in Nov 2023: N/A
- Est. population in 2022: 1,061
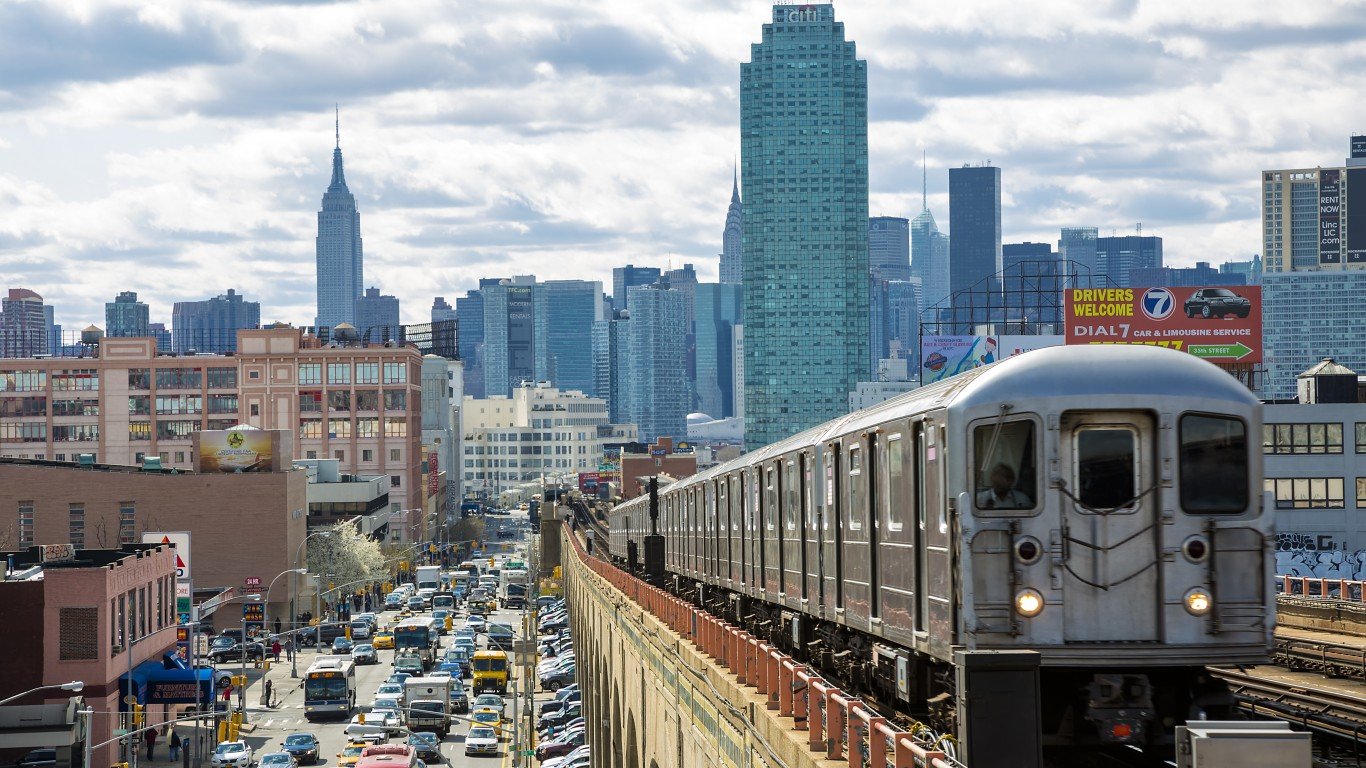
23. Sunnyside (Queens)
Source: charleylhasa / Flickr
- Likelihood that two random residents are different race or ethnicity: 70.5%
- Most prevalent race or ethnicity group: White (32.5%)
- Est. typical home value in Nov 2023: $474,518
- Est. population in 2022: 42,321
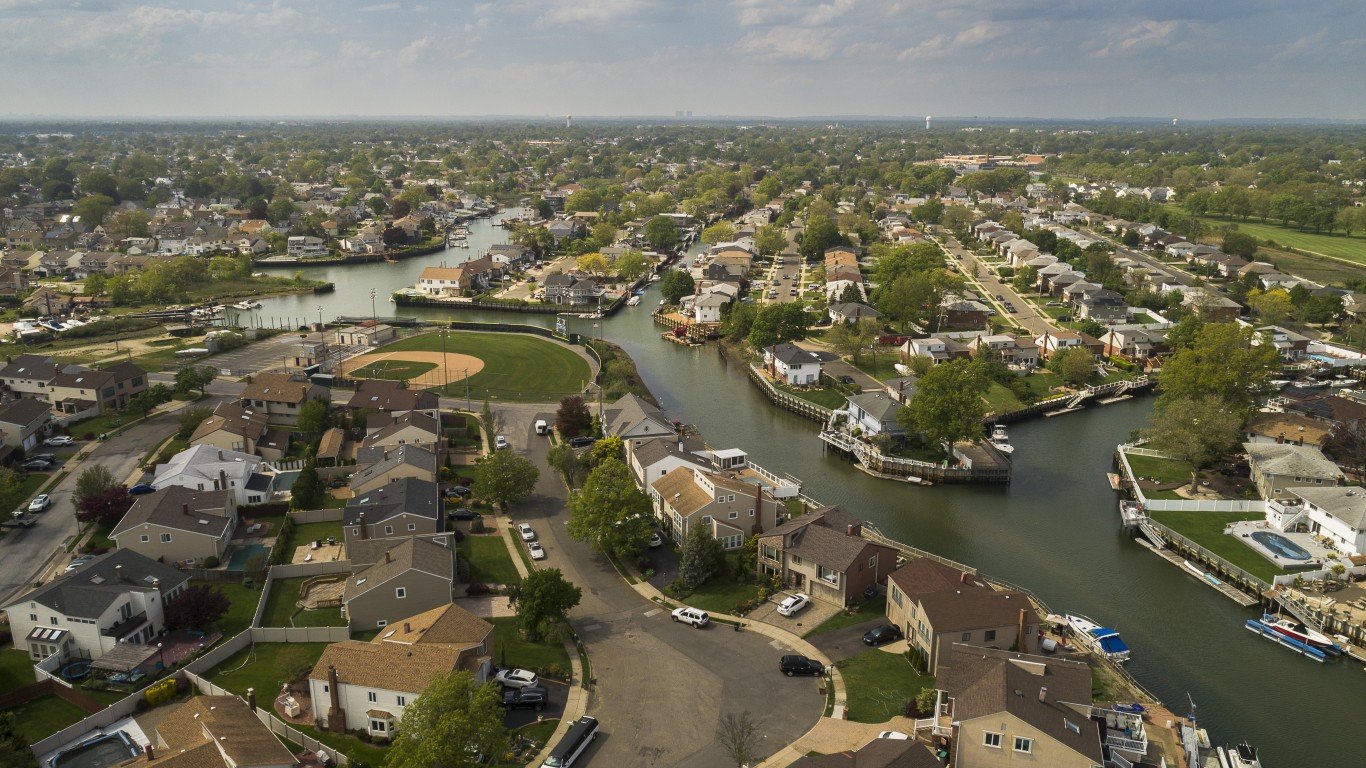
22. Ozone Park (Queens)
Source: kenlund / Flickr
- Likelihood that two random residents are different race or ethnicity: 70.5%
- Most prevalent race or ethnicity group: Hispanic or Latino (41.8%)
- Est. typical home value in Nov 2023: $681,815
- Est. population in 2022: 57,574
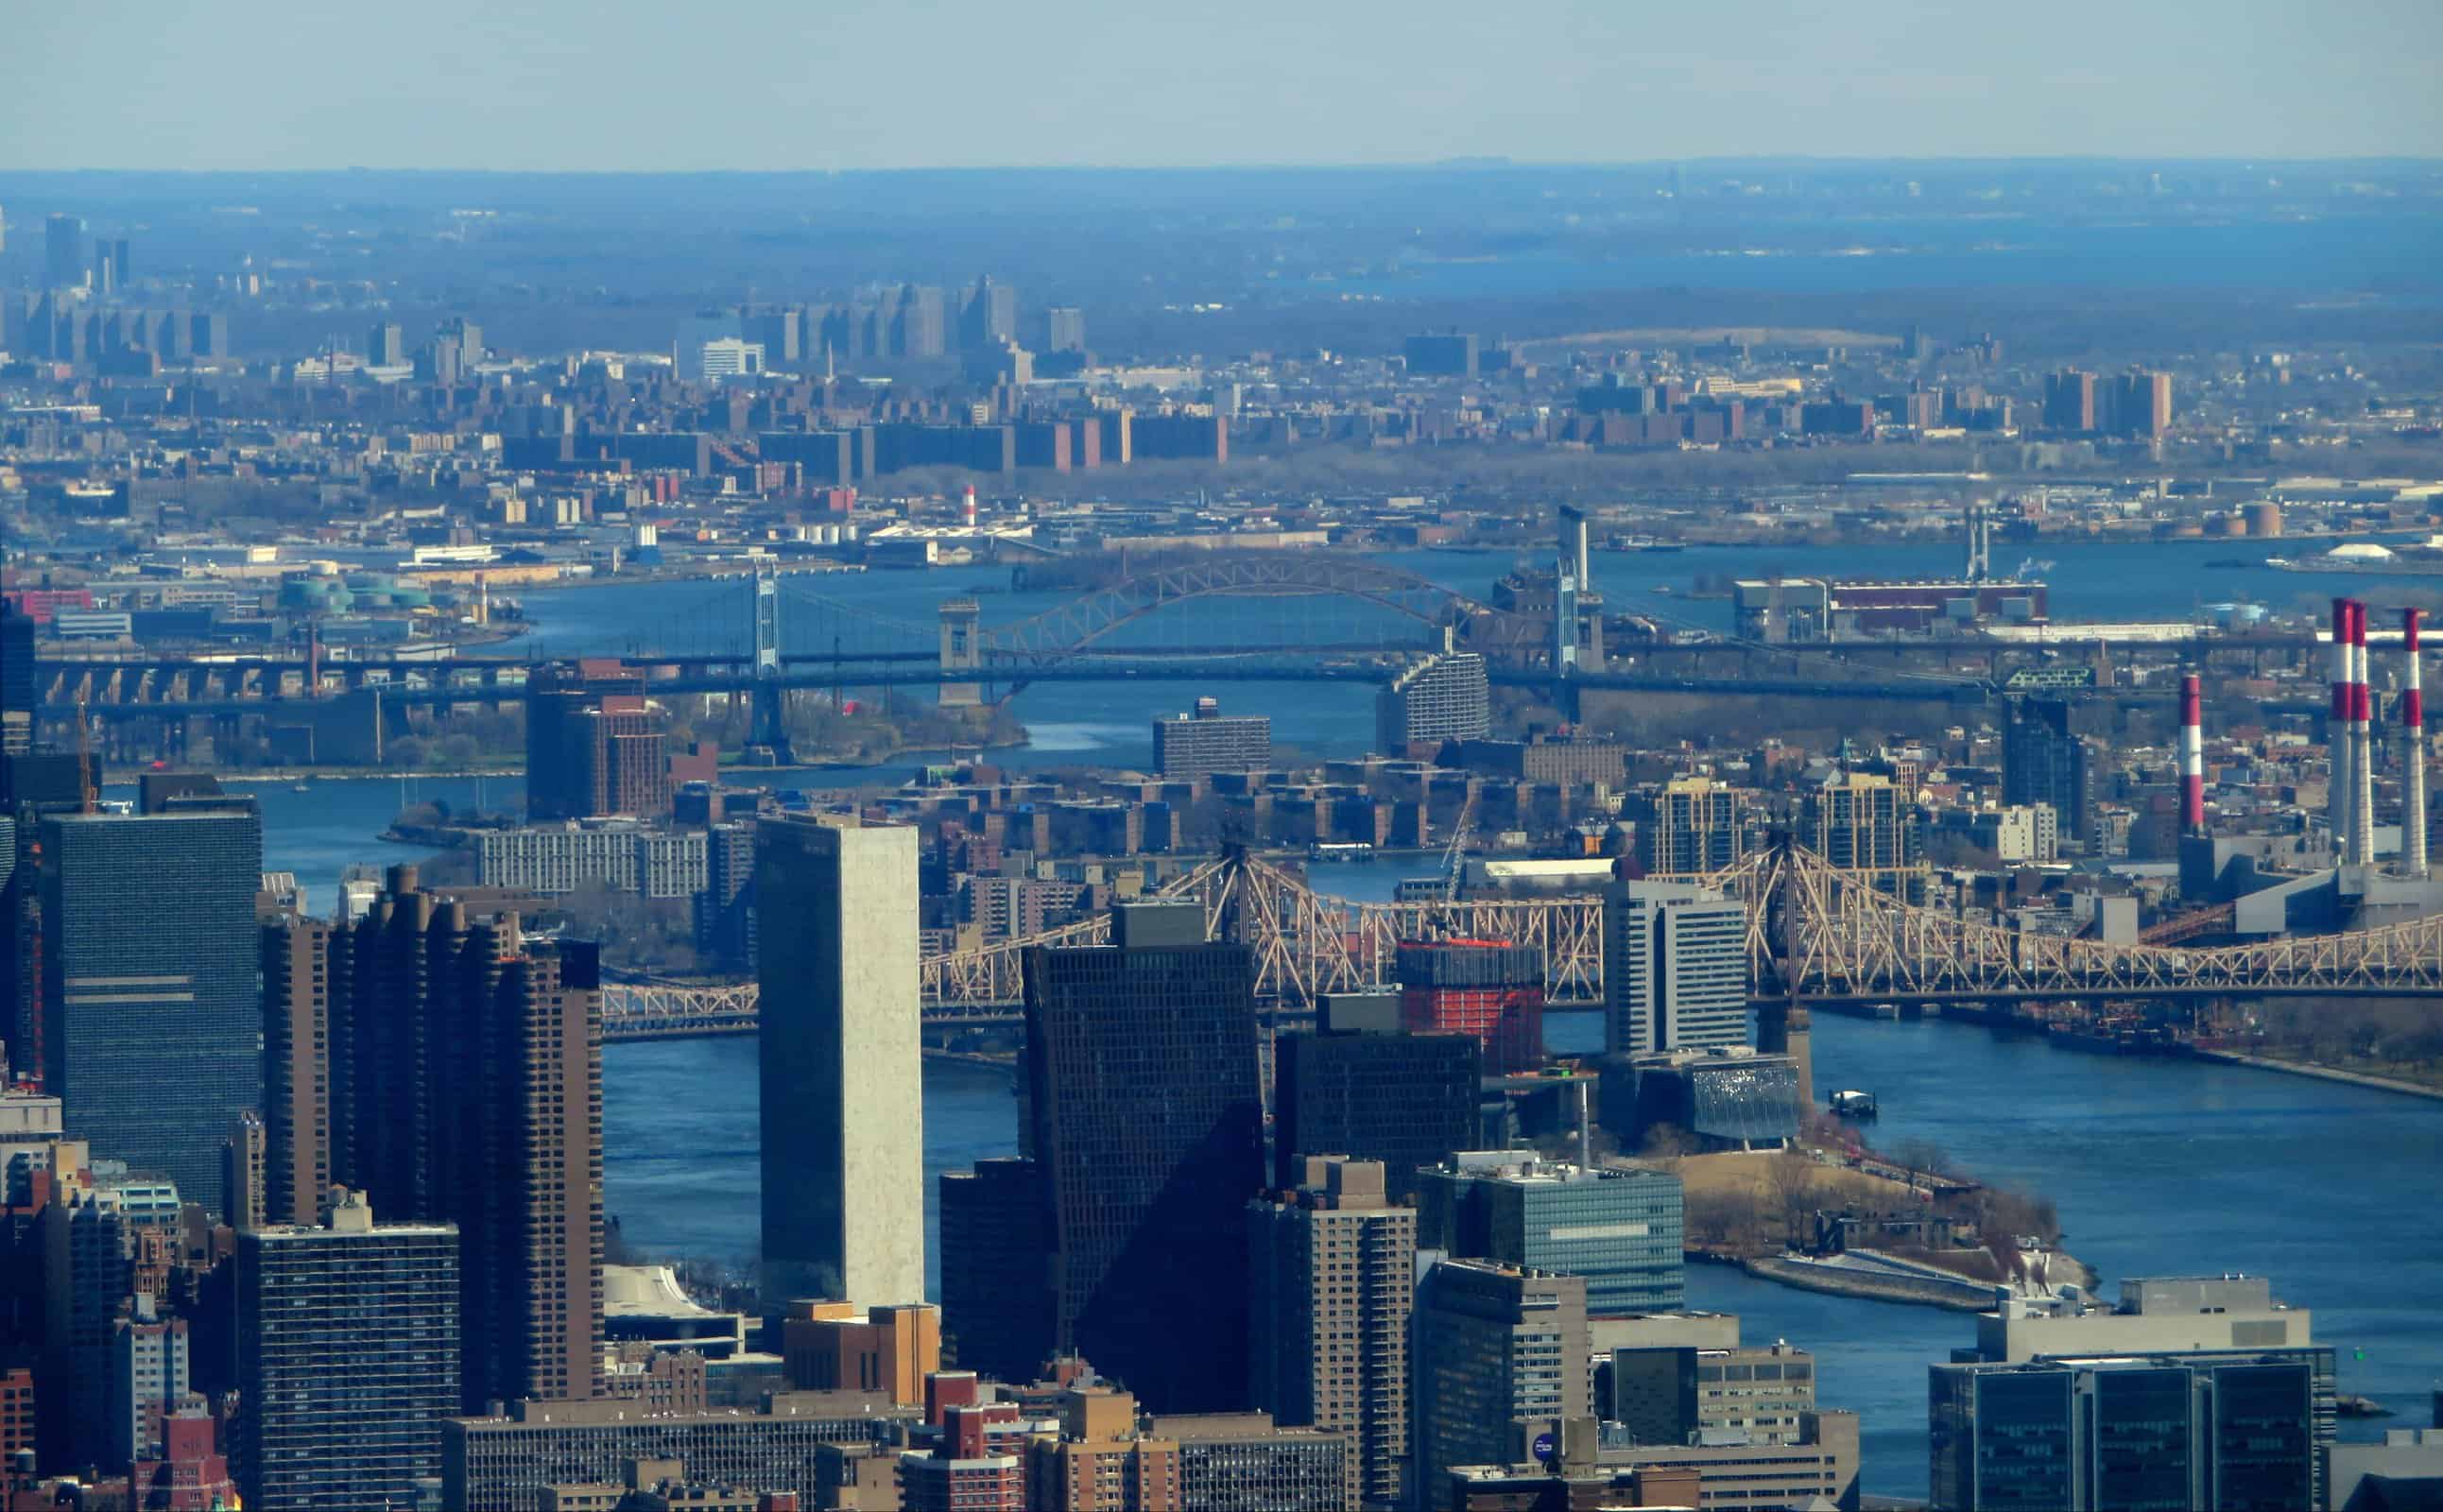
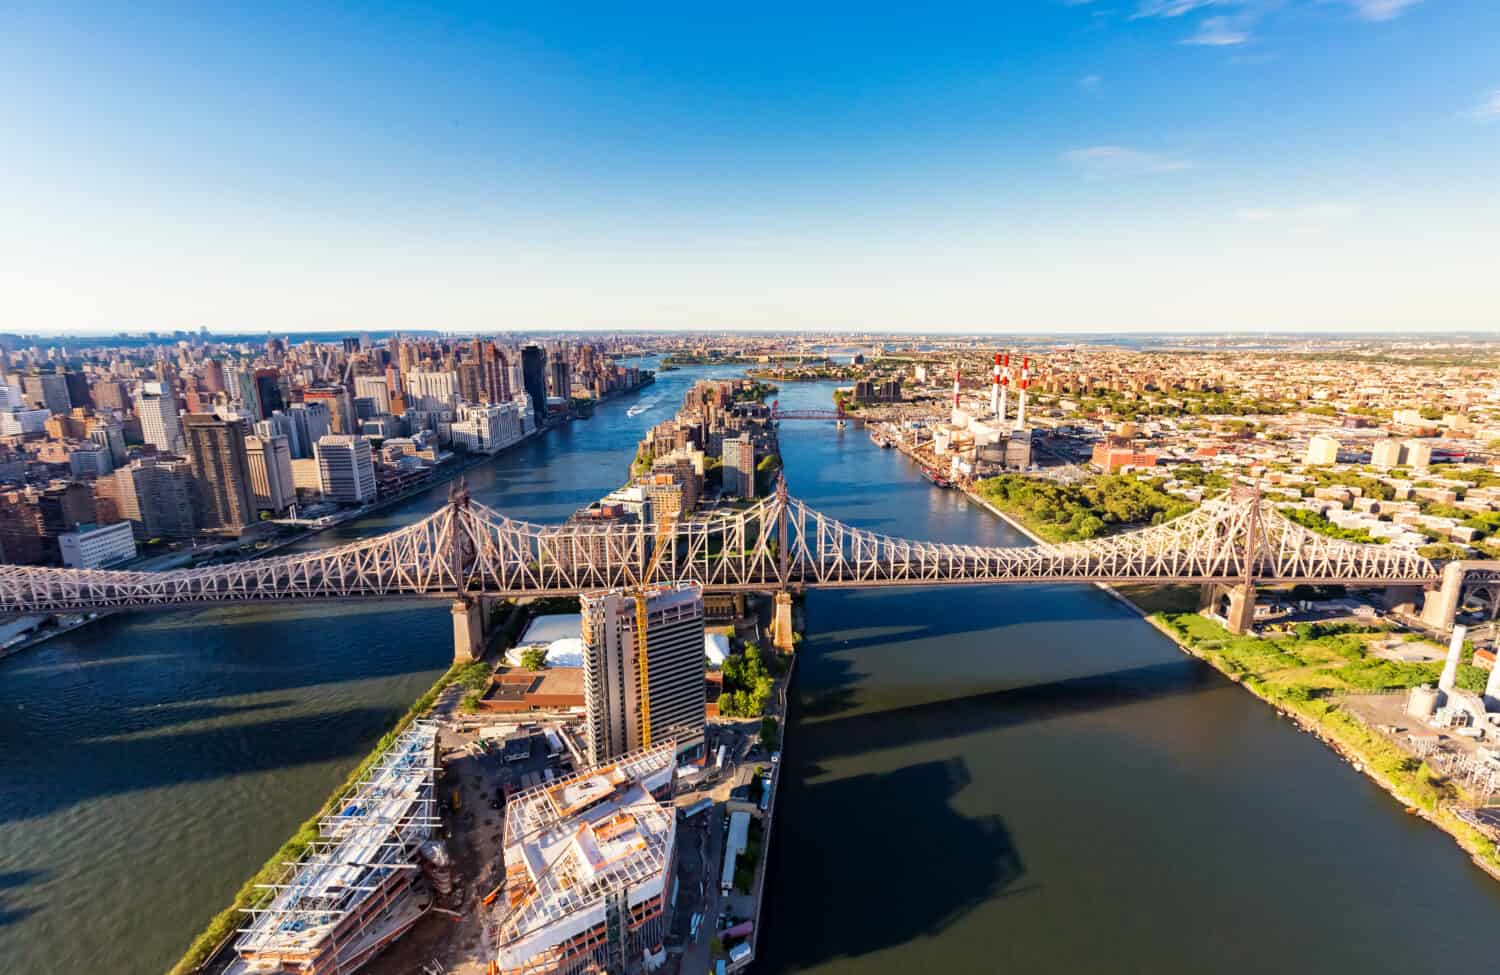
21. Roosevelt Island (Manhattan)
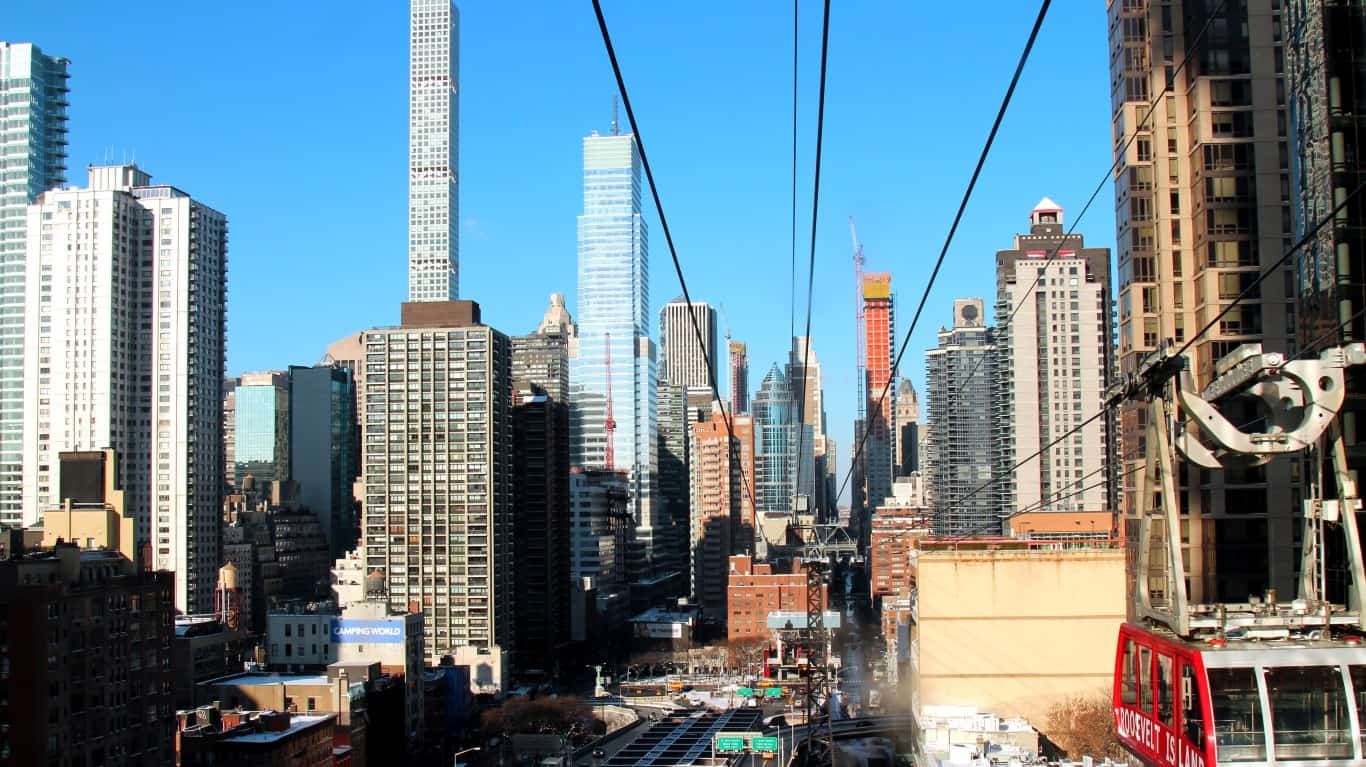
Source: prayitnophotography / Flickr
- Likelihood that two random residents are different race or ethnicity: 70.6%
- Most prevalent race or ethnicity group: White (42.6%)
- Est. typical home value in Nov 2023: $874,677
- Est. population in 2022: 7,605
20. Dongan Hills (Staten Island)
Source: Jayne Lipkovich / Shutterstock.com
- Likelihood that two random residents are different race or ethnicity: 70.6%
- Most prevalent race or ethnicity group: White (43.0%)
- Est. typical home value in Nov 2023: $687,675
- Est. population in 2022: 3,476
19. Pomonok (Queens)
Source: Sean Pavone / iStock via Getty Images
- Likelihood that two random residents are different race or ethnicity: 70.9%
- Most prevalent race or ethnicity group: Hispanic or Latino (43.9%)
- Est. typical home value in Nov 2023: N/A
- Est. population in 2022: 10,023
18. Kew Gardens (Queens)
Source: davidwilson1949 / Flickr
- Likelihood that two random residents are different race or ethnicity: 70.9%
- Most prevalent race or ethnicity group: White (43.1%)
- Est. typical home value in Nov 2023: $363,658
- Est. population in 2022: 22,104
17. Morningside Heights (Manhattan)
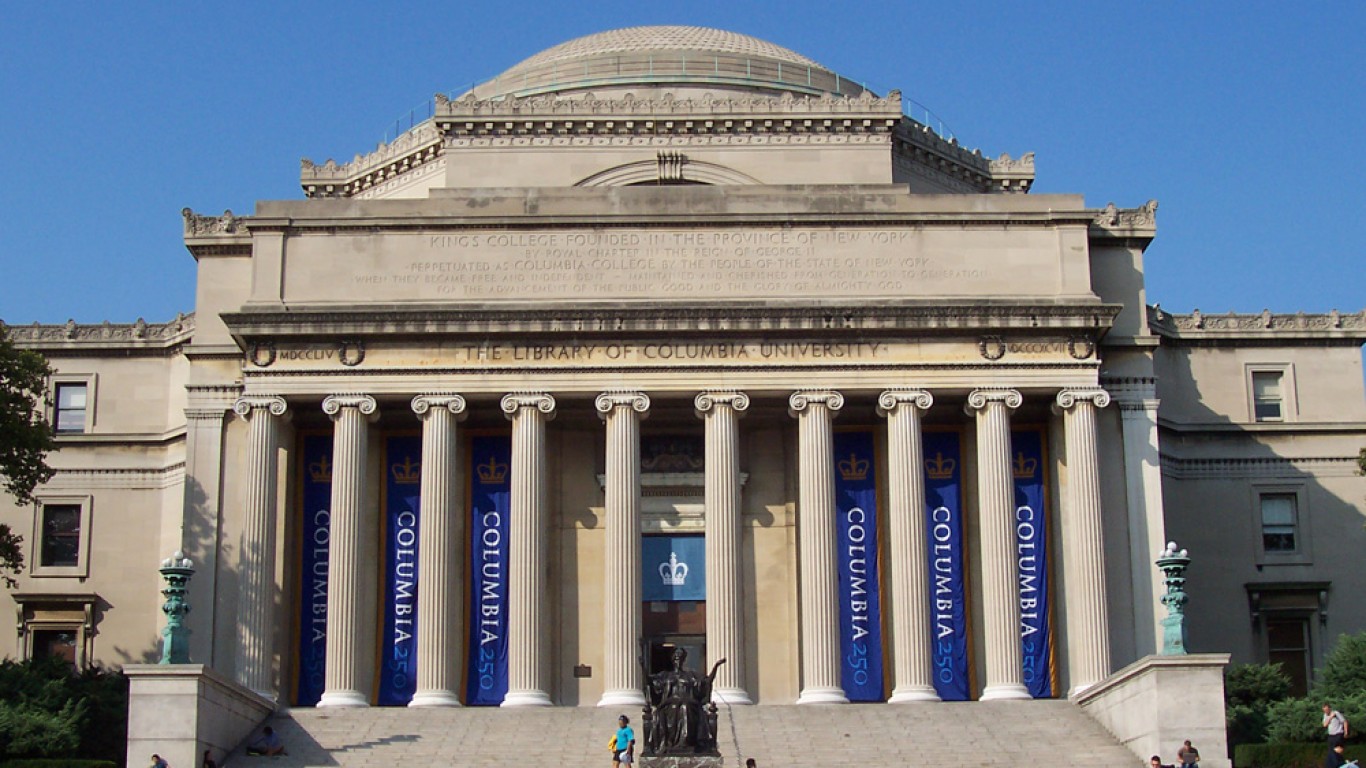
Source: InSapphoWeTrust from Los Angeles, California, USA / Wikimedia Commons
- Likelihood that two random residents are different race or ethnicity: 71.0%
- Most prevalent race or ethnicity group: White (44.6%)
- Est. typical home value in Nov 2023: $731,296
- Est. population in 2022: 26,228
16. Pelham Gardens (Bronx)
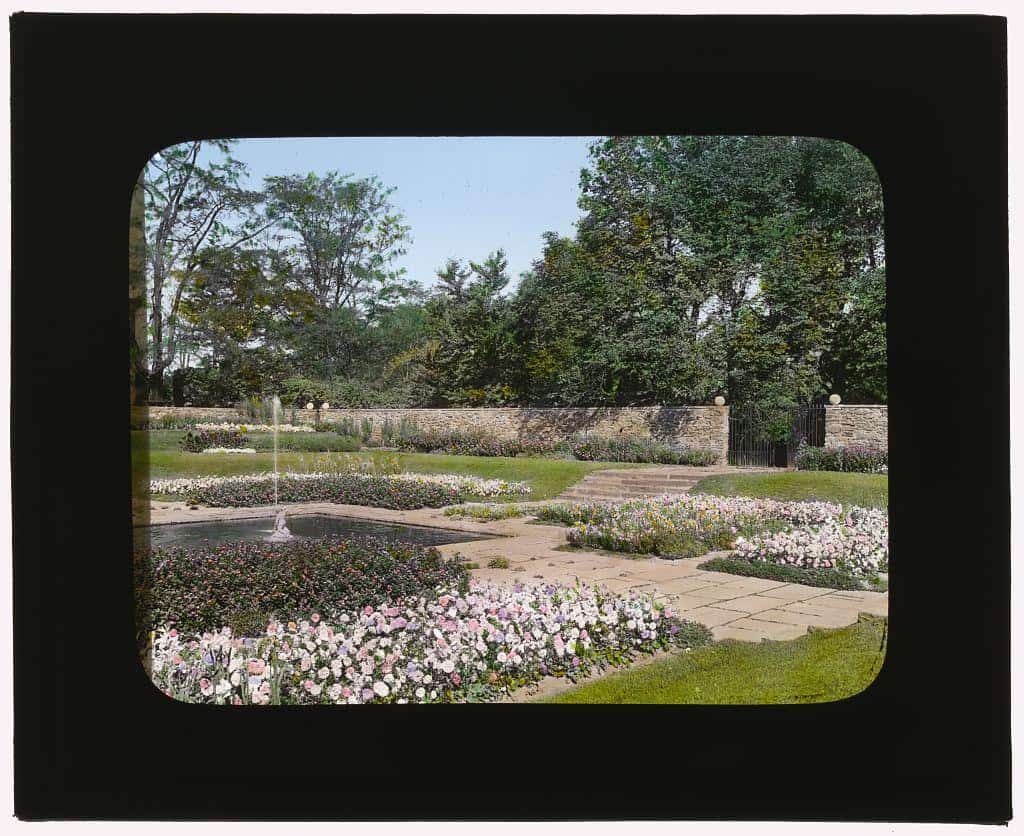
Source: library_of_congress / Flickr
- Likelihood that two random residents are different race or ethnicity: 71.4%
- Most prevalent race or ethnicity group: Hispanic or Latino (37.8%)
- Est. typical home value in Nov 2023: $672,219
- Est. population in 2022: 24,723
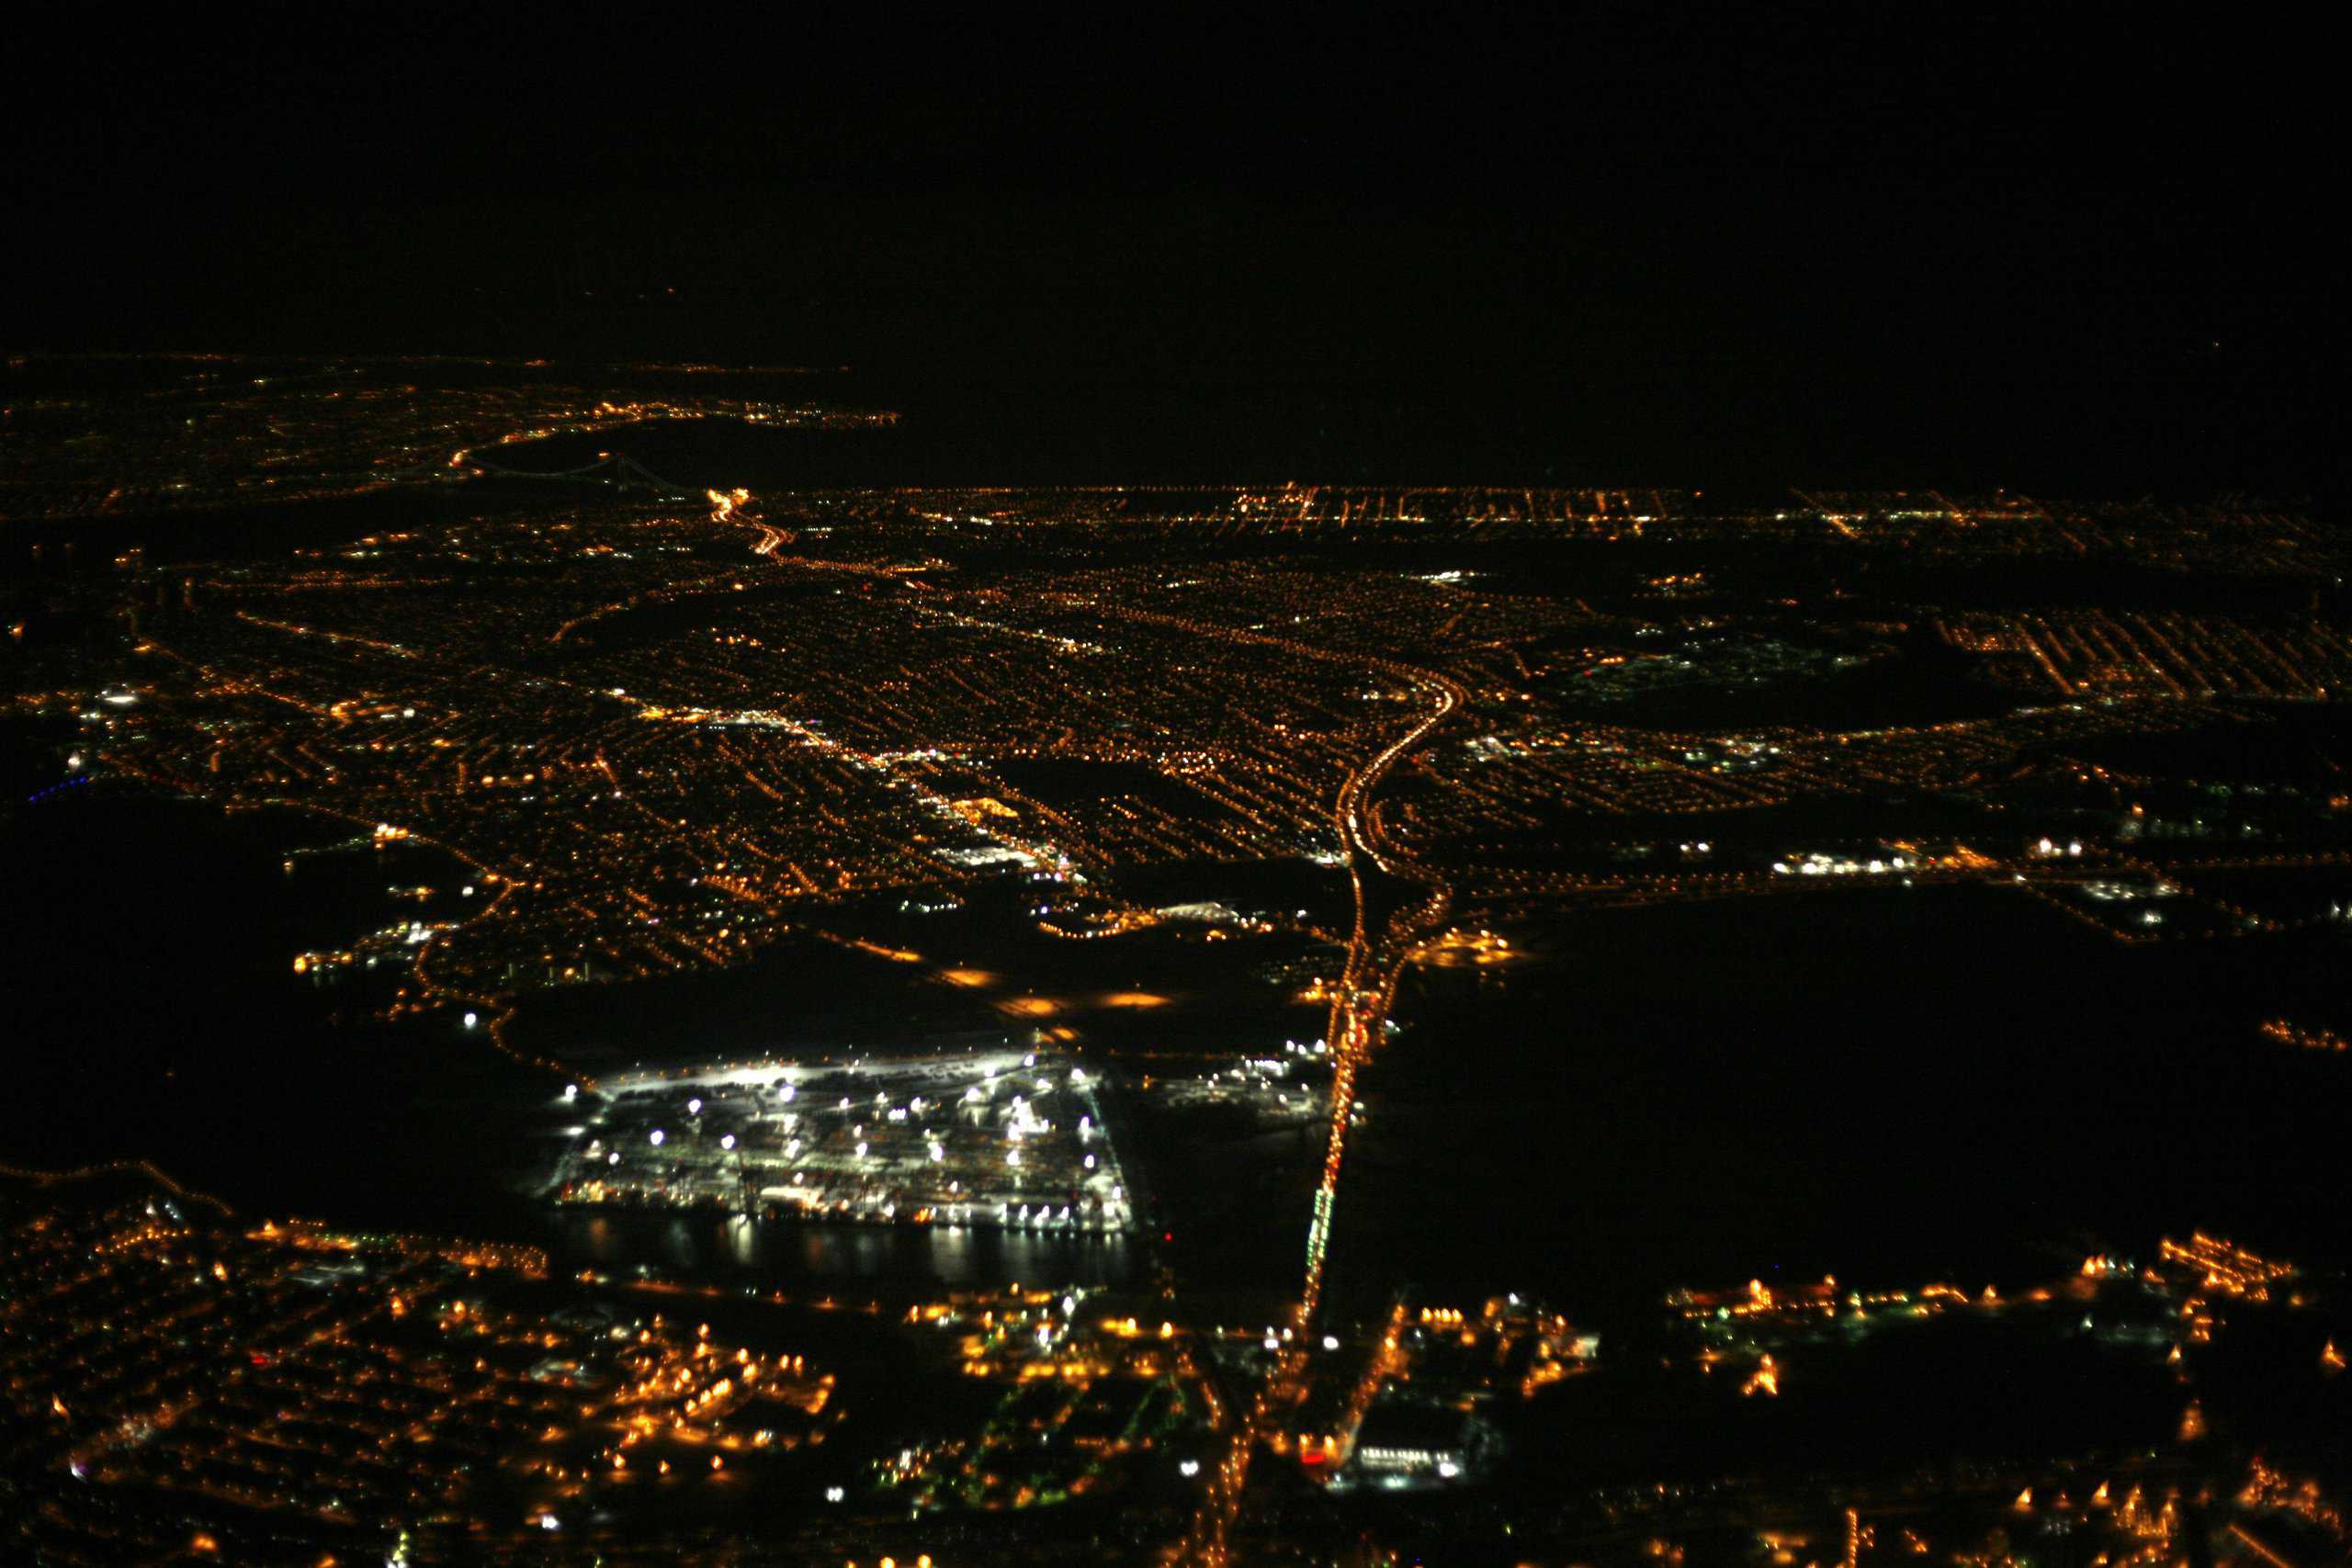
15. Rockaway Beach (Queens)
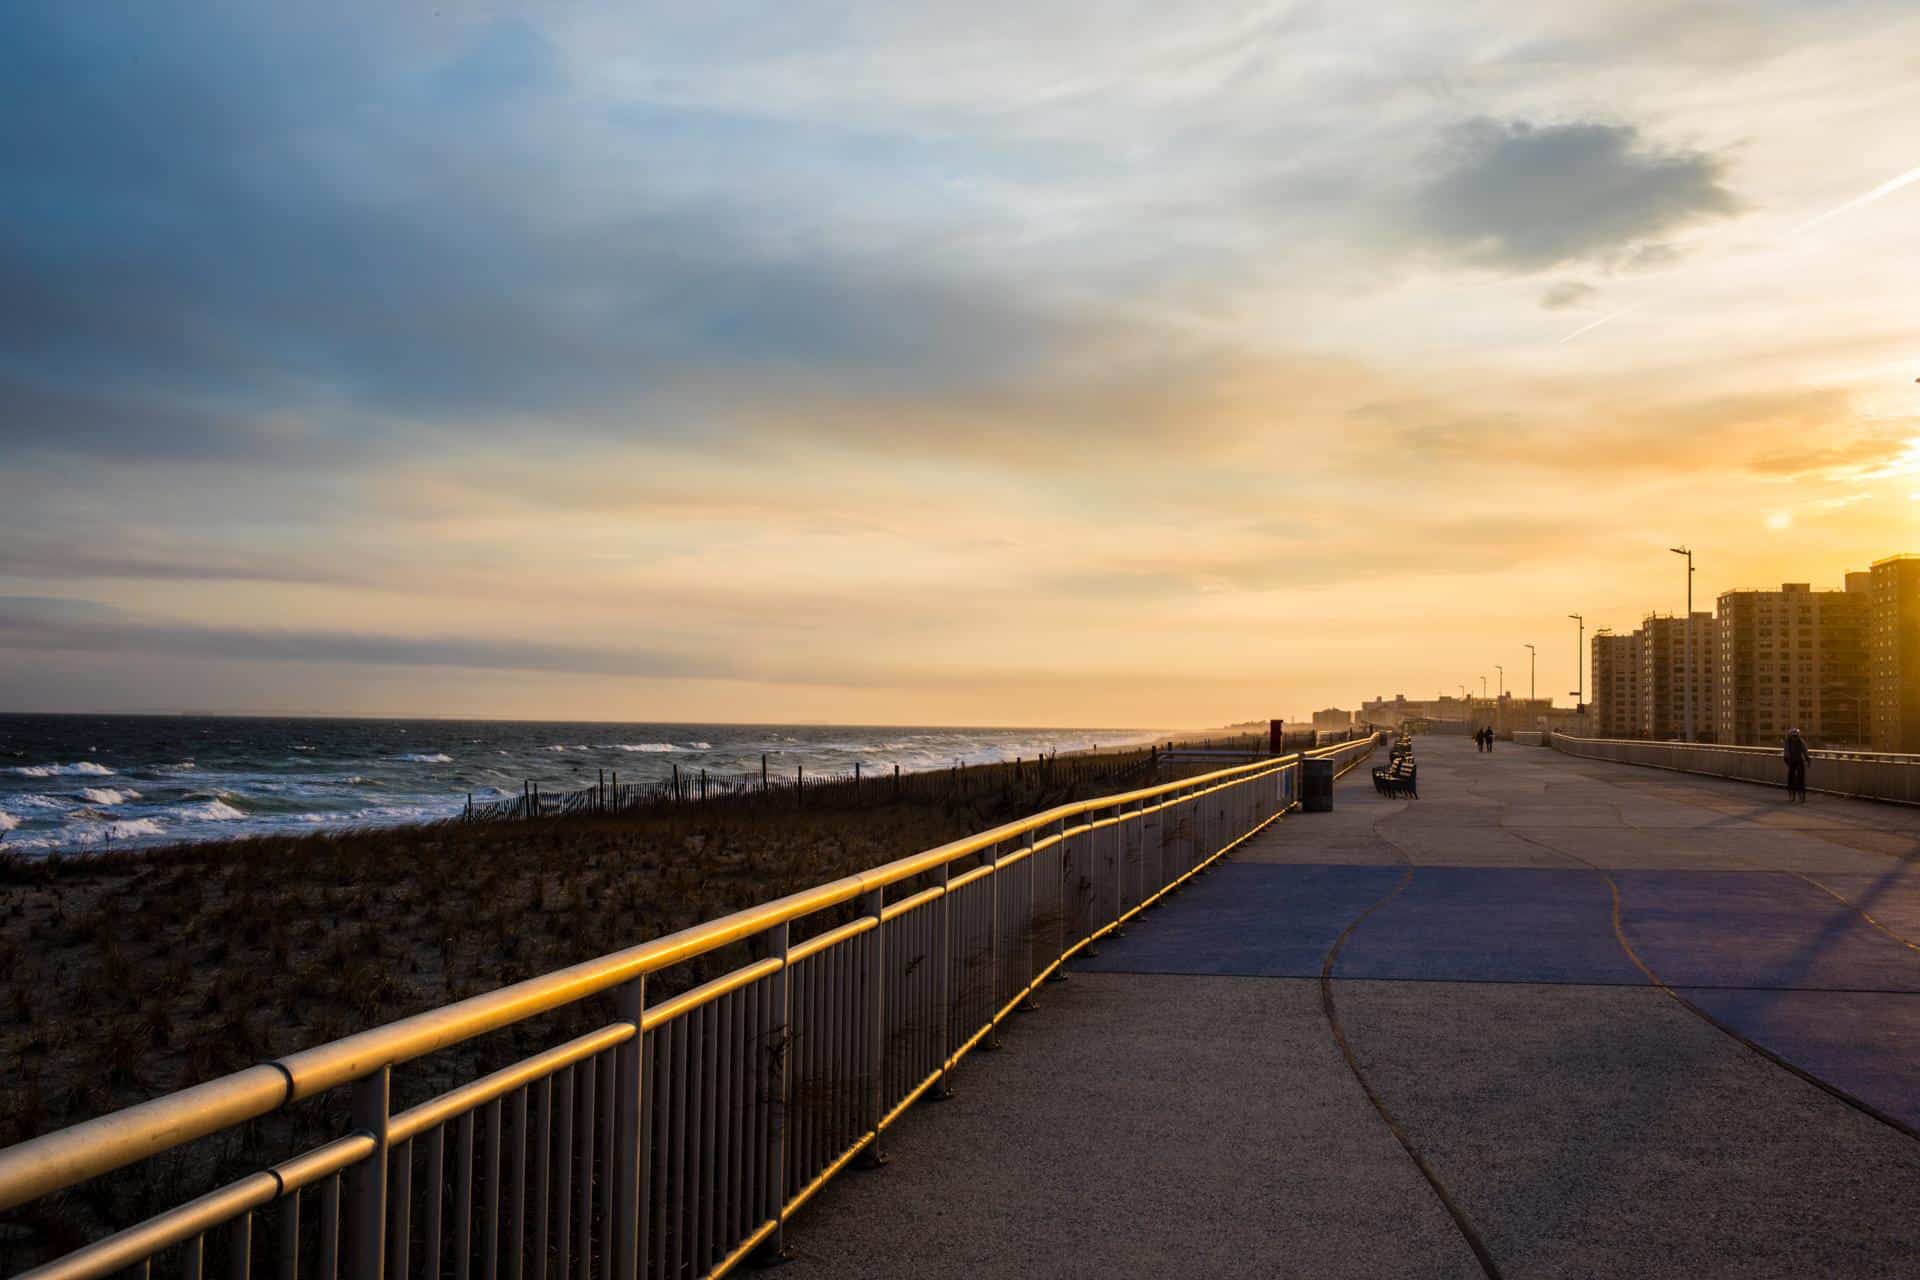
Source: spurekar / Flickr
- Likelihood that two random residents are different race or ethnicity: 71.5%
- Most prevalent race or ethnicity group: Black or African American (34.9%)
- Est. typical home value in Nov 2023: N/A
- Est. population in 2022: 5,255
14. Kew Gardens Hills (Queens)

- Likelihood that two random residents are different race or ethnicity: 71.7%
- Most prevalent race or ethnicity group: White (41.8%)
- Est. typical home value in Nov 2023: $462,538
- Est. population in 2022: 43,873
13. Jamaica (Queens)
Source: liljango / Flickr
- Likelihood that two random residents are different race or ethnicity: 71.7%
- Most prevalent race or ethnicity group: Black or African American (43.0%)
- Est. typical home value in Nov 2023: $620,919
- Est. population in 2022: 130,844
12. Hillcrest (Queens)
Source: Alex Potemkin / Getty Images
- Likelihood that two random residents are different race or ethnicity: 71.9%
- Most prevalent race or ethnicity group: Asian (39.6%)
- Est. typical home value in Nov 2023: N/A
- Est. population in 2022: 14,726
10. Lower East Side (Manhattan)
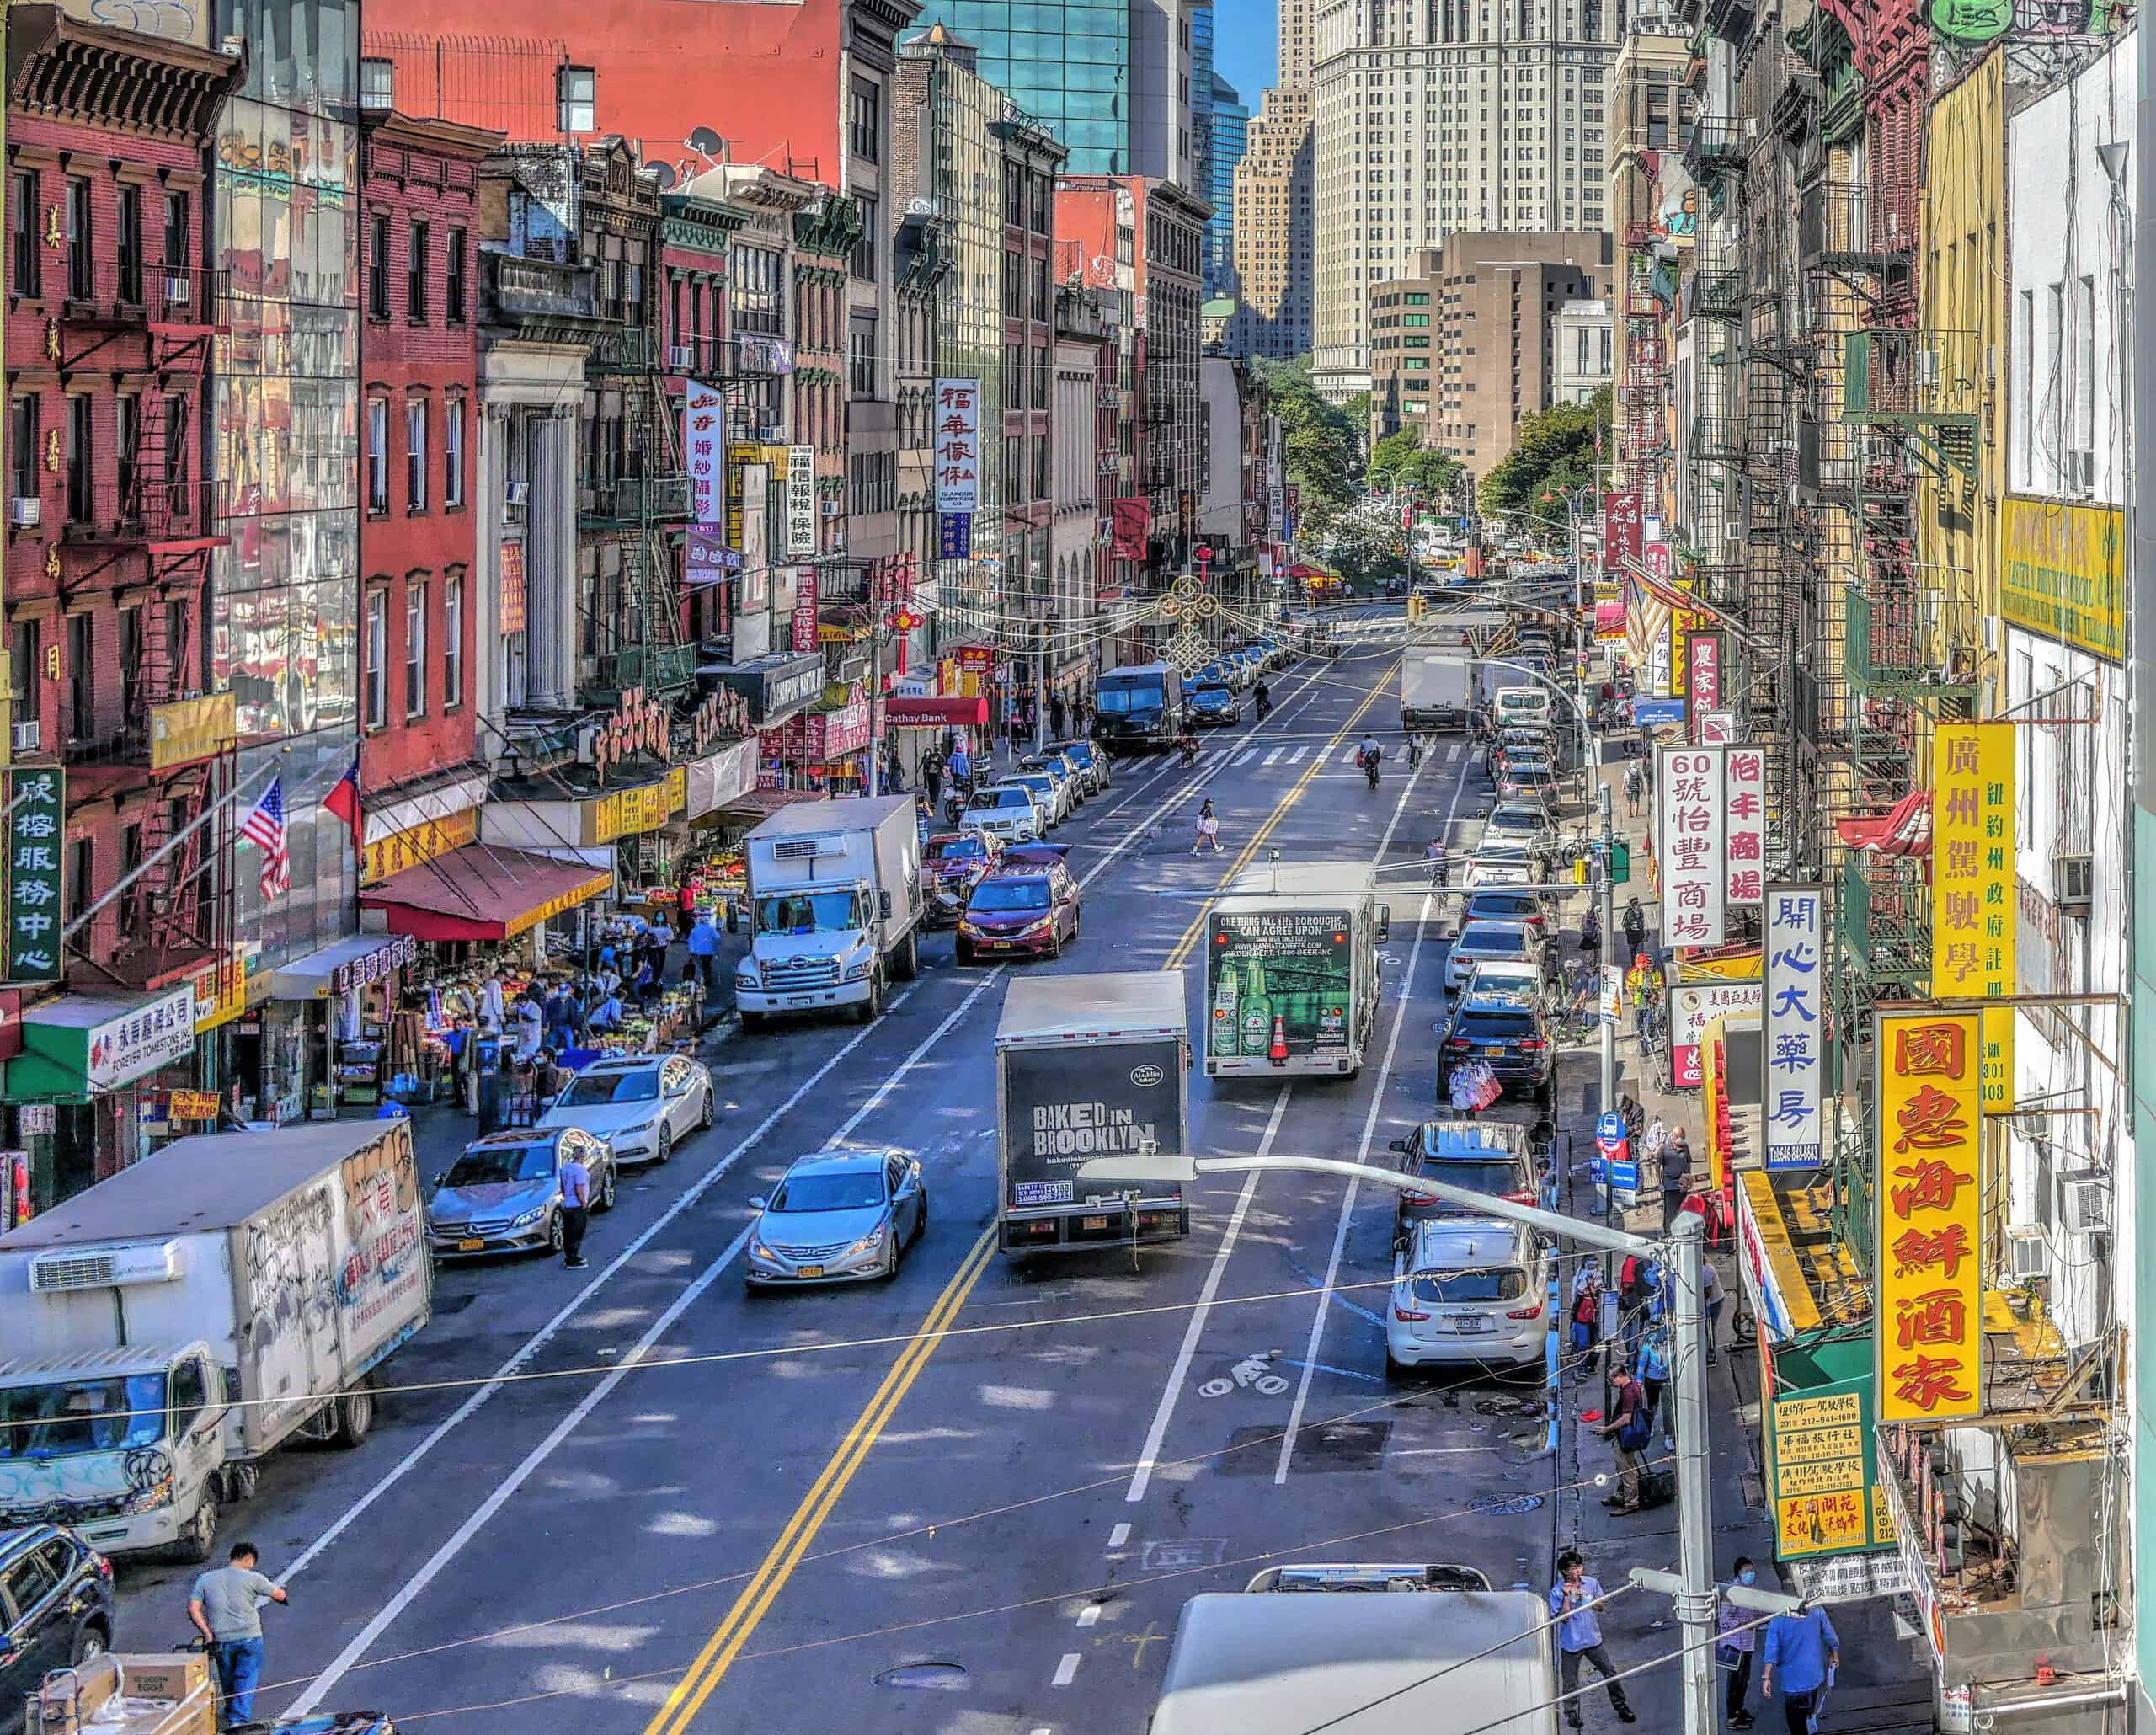
Source: joiseyshowaa / Flickr
- Likelihood that two random residents are different race or ethnicity: 73.5%
- Most prevalent race or ethnicity group: Asian (34.4%)
- Est. typical home value in Nov 2023: $945,725
- Est. population in 2022: 58,967
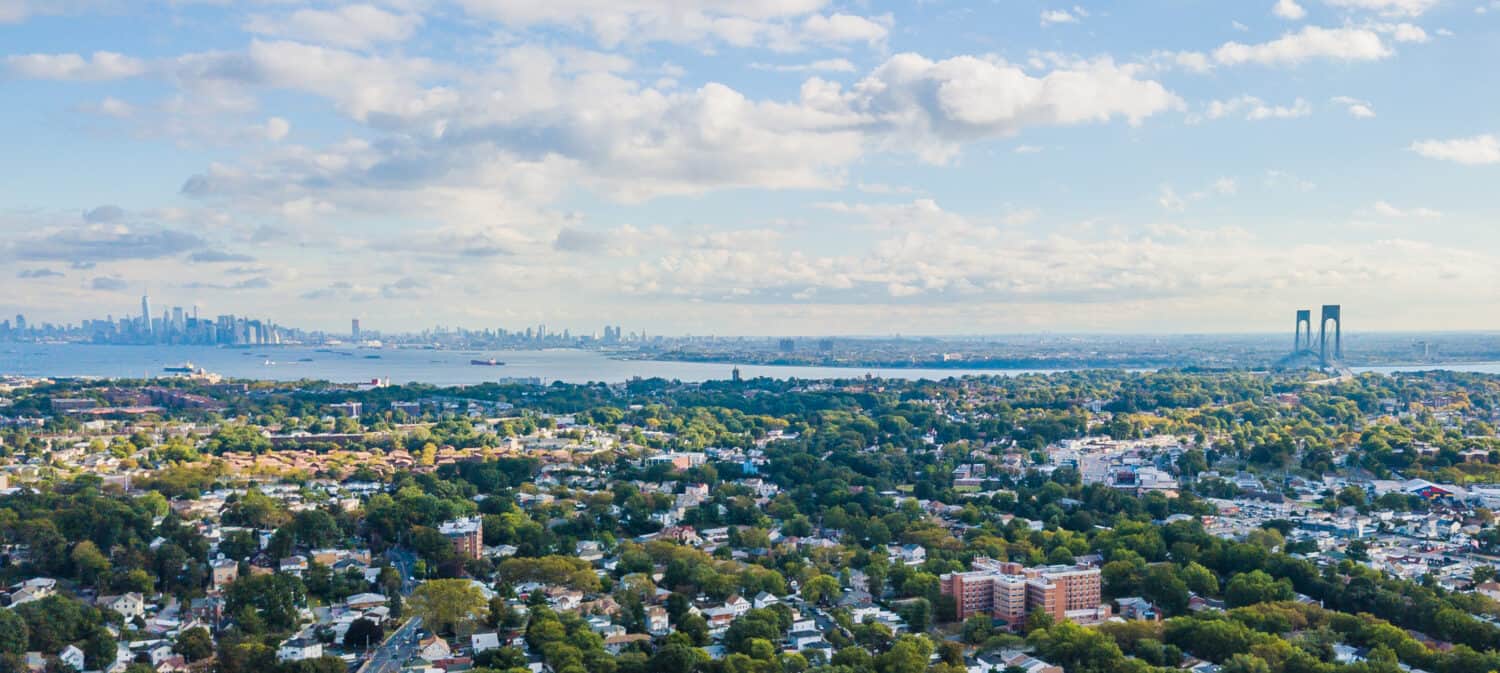
9. Holliswood (Queens)
Source: sx70 / Getty Images
- Likelihood that two random residents are different race or ethnicity: 73.5%
- Most prevalent race or ethnicity group: White (34.6%)
- Est. typical home value in Nov 2023: N/A
- Est. population in 2022: 4,746
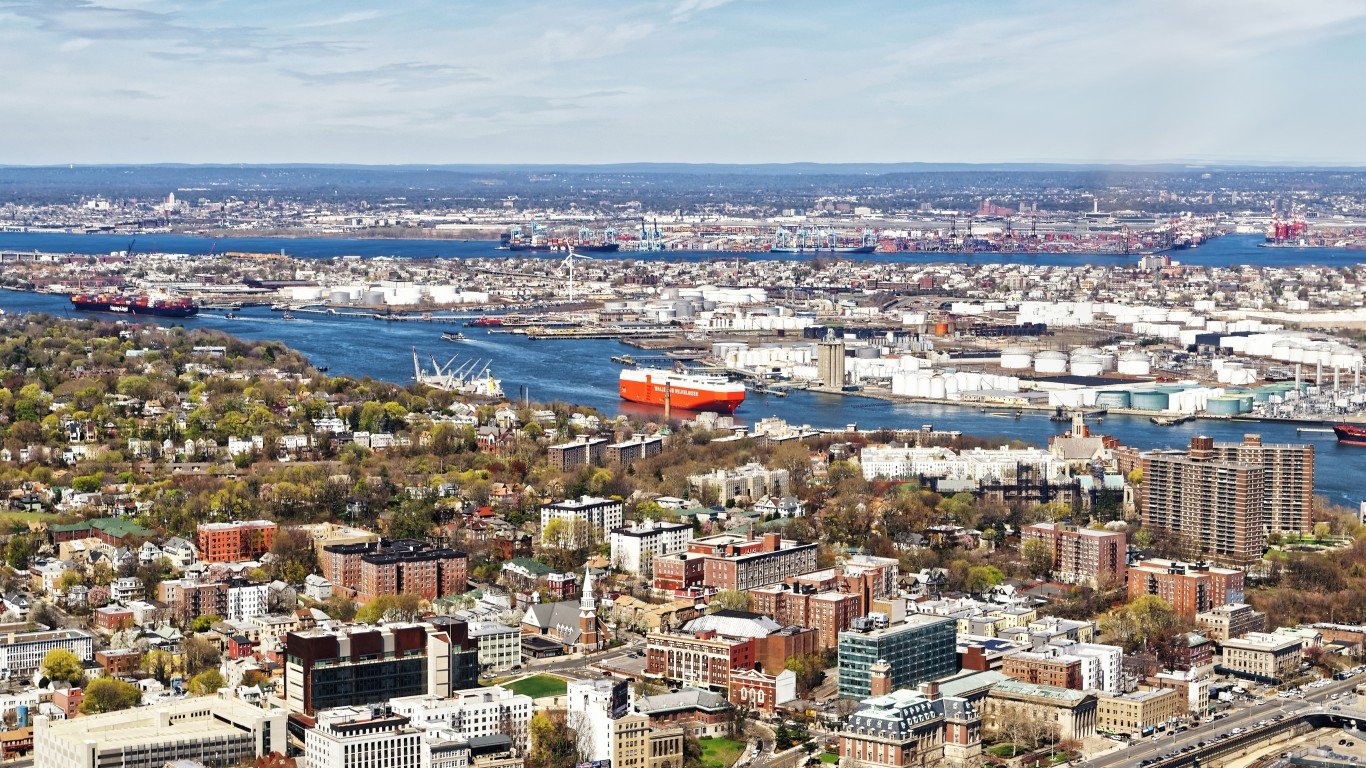
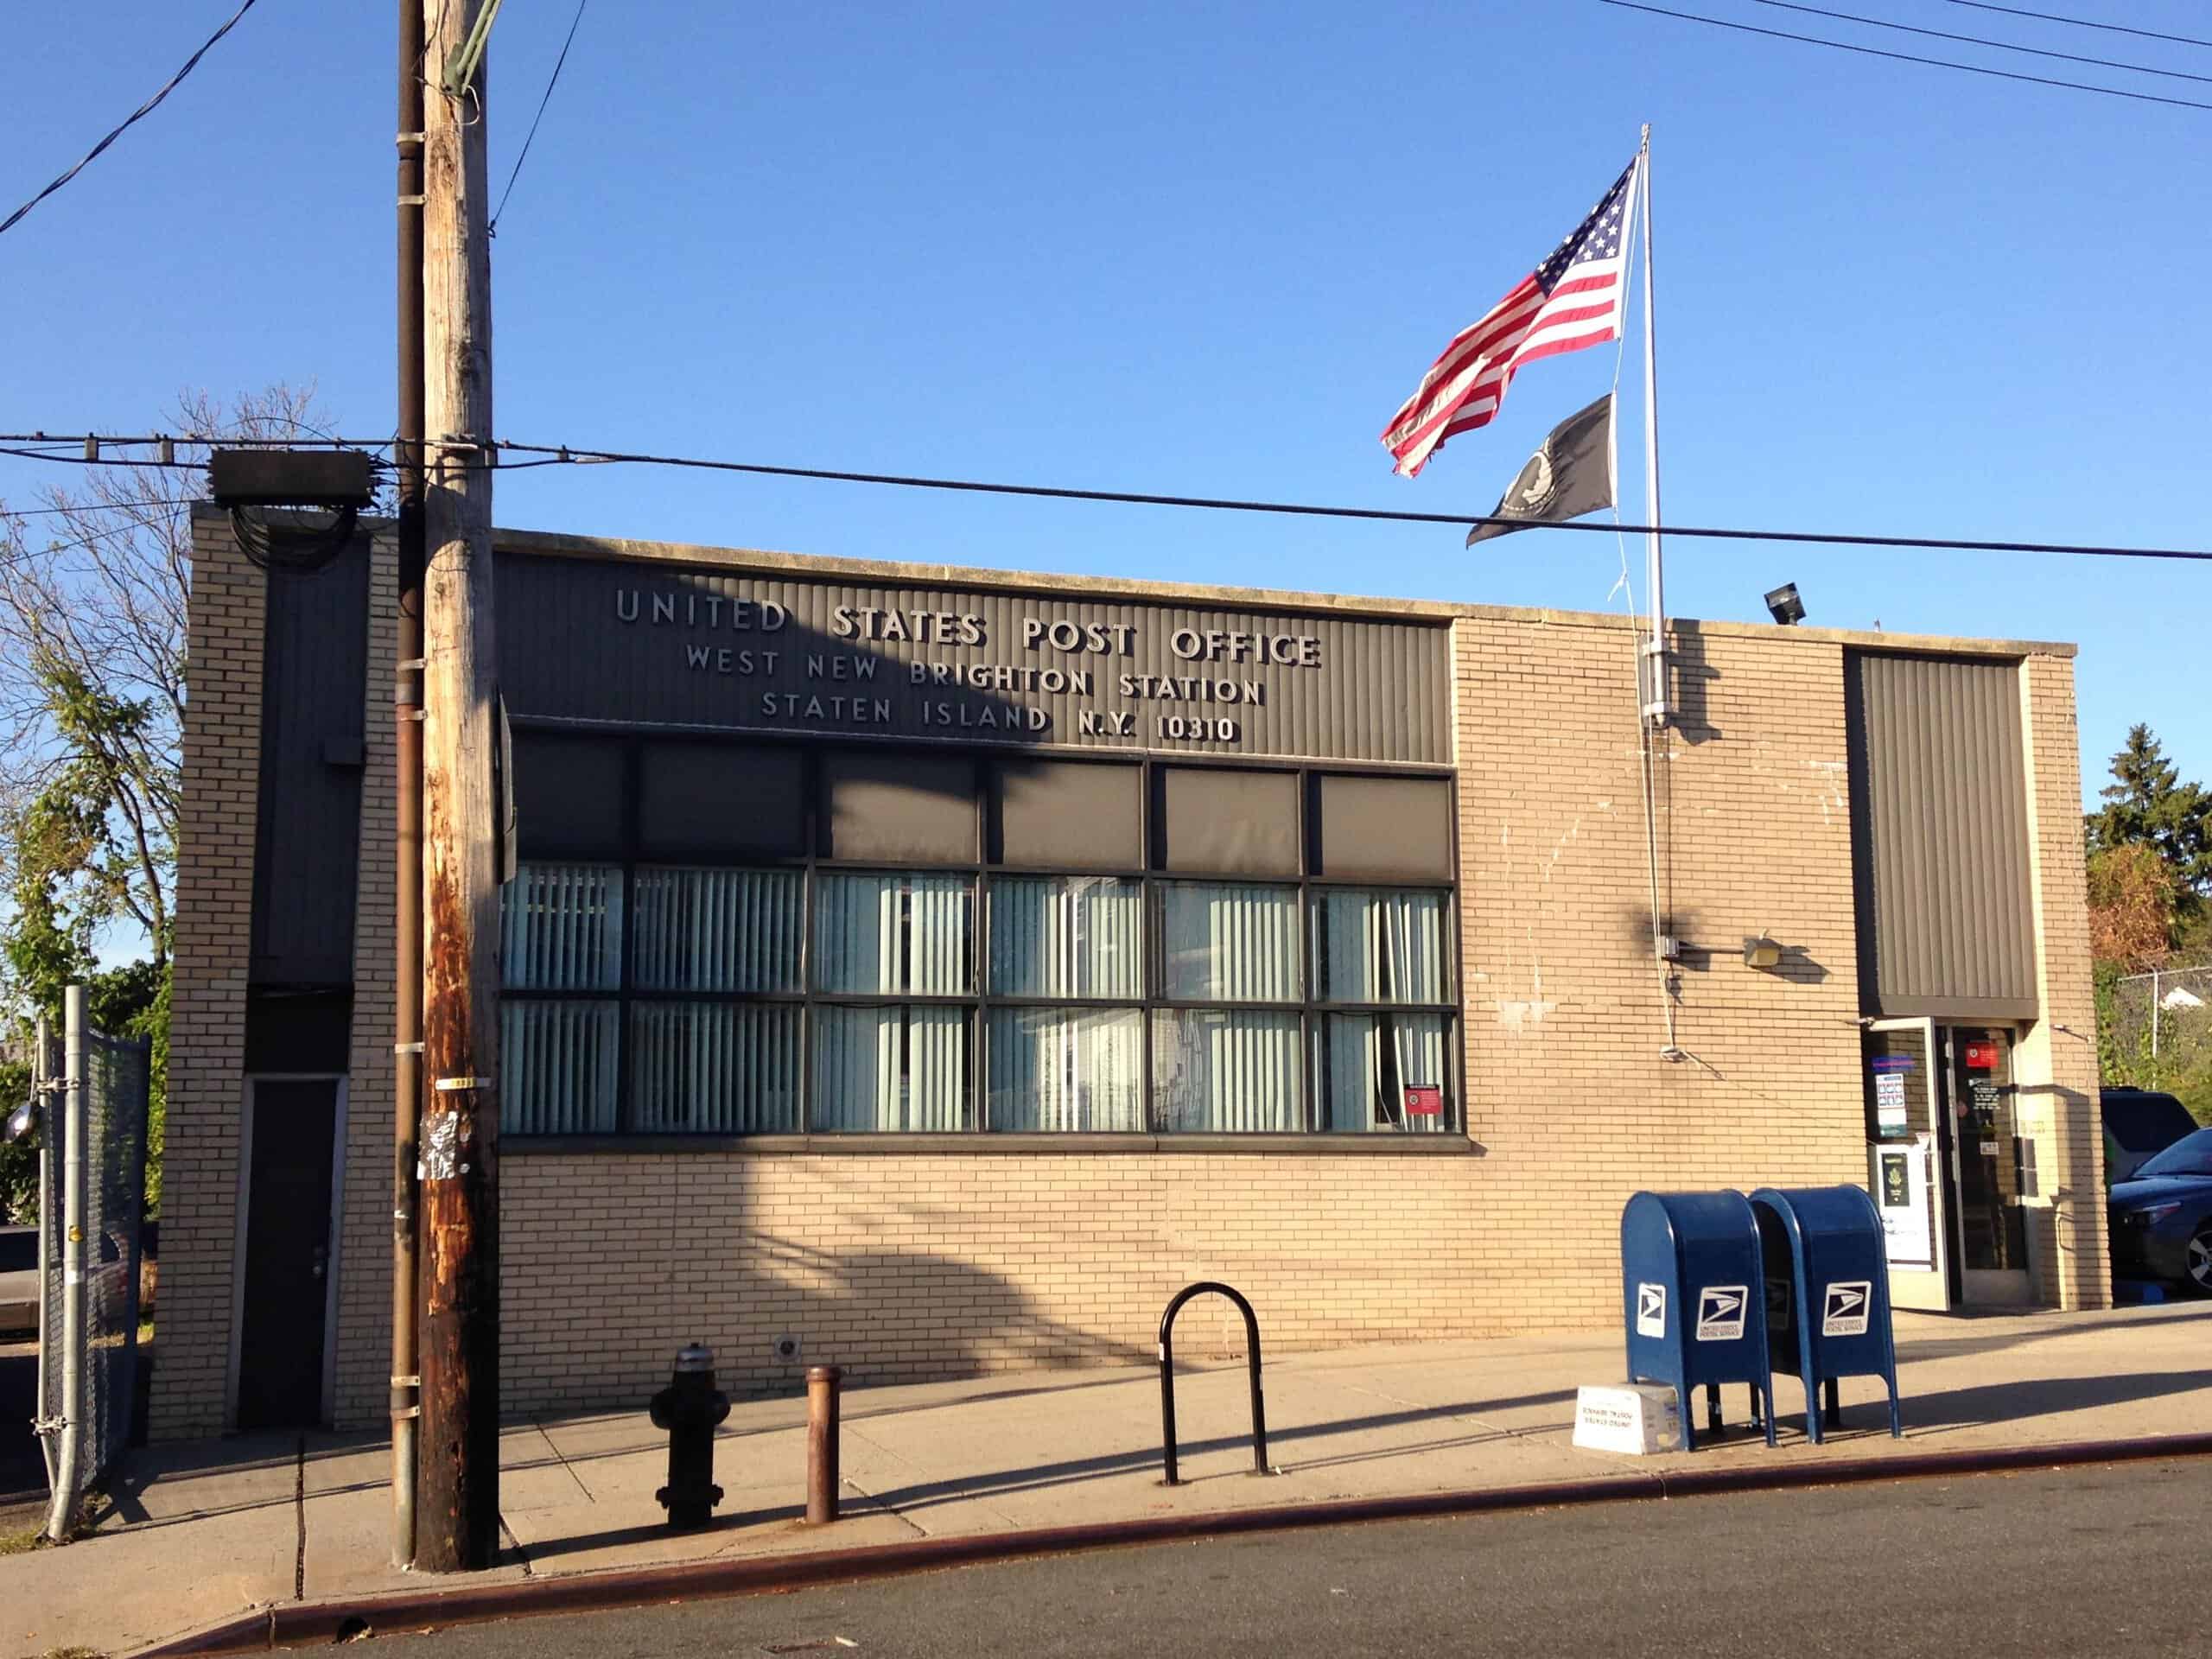
8. New Brighton (Staten Island)
Source: Roman Babakin / Shutterstock.com
- Likelihood that two random residents are different race or ethnicity: 73.7%
- Most prevalent race or ethnicity group: Hispanic or Latino (30.9%)
- Est. typical home value in Nov 2023: $573,883
- Est. population in 2022: 6,654
7. Tompkinsville (Staten Island)
Source: kenlund / Flickr
- Likelihood that two random residents are different race or ethnicity: 73.8%
- Most prevalent race or ethnicity group: White (40.3%)
- Est. typical home value in Nov 2023: $570,707
- Est. population in 2022: 1,656
6. Graniteville (Staten Island)
Source: Roman Babakin / Shutterstock.com
- Likelihood that two random residents are different race or ethnicity: 73.9%
- Most prevalent race or ethnicity group: White (36.6%)
- Est. typical home value in Nov 2023: $621,094
- Est. population in 2022: 12,167
5. Jamaica Estates (Queens)
Source: littlenySTOCK / Shutterstock.com
- Likelihood that two random residents are different race or ethnicity: 75.4%
- Most prevalent race or ethnicity group: Asian (34.7%)
- Est. typical home value in Nov 2023: $1,033,199
- Est. population in 2022: 15,947
4. Richmond Hill (Queens)
Source: MABONY / Shutterstock.com
- Likelihood that two random residents are different race or ethnicity: 75.7%
- Most prevalent race or ethnicity group: Hispanic or Latino (35.2%)
- Est. typical home value in Nov 2023: $705,915
- Est. population in 2022: 53,221
2. Briarwood (Queens)
Source: johnji / Flickr
- Likelihood that two random residents are different race or ethnicity: 76.9%
- Most prevalent race or ethnicity group: Asian (28.1%)
- Est. typical home value in Nov 2023: $386,213
- Est. population in 2022: 29,795
1. South Ozone Park (Queens)
Source: Roman Babakin / Shutterstock.com
- Likelihood that two random residents are different race or ethnicity: 79.3%
- Most prevalent race or ethnicity group: Asian (30.7%)
- Est. typical home value in Nov 2023: $671,736
- Est. population in 2022: 80,076
Essential Tips for Investing: Sponsored
A financial advisor can help you understand the advantages and disadvantages of investment properties. Finding a qualified financial advisor doesn’t have to be hard. SmartAsset’s free tool matches you with up to three financial advisors who serve your area, and you can interview your advisor matches at no cost to decide which one is right for you. If you’re ready to find an advisor who can help you achieve your financial goals, get started now.
Investing in real estate can diversify your portfolio. But expanding your horizons may add additional costs. If you’re an investor looking to minimize expenses, consider checking out online brokerages. They often offer low investment fees, helping you maximize your profit.
Thank you for reading! Have some feedback for us?
Contact the 24/7 Wall St. editorial team.
Editors' Picks