The U.S. unemployment rate hit 4.8% in December, down from 5.4% the year before. Job market improvements across the country point to a broad recovery from the Great Recession. The recovery, however, is anything but uniform. While unemployment rates in 23 metro areas are lower than 3%, they are greater than 10% in 12 metro areas.
24/7 Wall St. examined the U.S. metropolitan areas with the lowest and highest jobless rates from the Bureau of Labor Statistics (BLS). Ames, Iowa leads the nation with an unemployment rate of 2.2% as of December of 2015, while the weakest job market among the nation’s metros is El Centro, California, which reported a jobless rate of 19.6%.
Job markets in the vast majority of the 381 U.S. metro areas — 291 urban regions — recorded job market improvements compared to December 2014. While the unemployment declines are a positive sign for the nation’s economy, full recovery from job losses during the Great Recession is a long way off in far more areas. In fewer than half of all U.S. metro areas — 156 — the December unemployment rate remains higher than the area’s jobless rate 10 years ago.
Click here to see the cities with the highest unemployment rates.
Click here to see the cities with the lowest unemployment rates.
The Great Recession did not just bruise the job market, but it also crippled the housing market. According to Martin Kohli, chief regional economist at the BLS, the two are interlinked. The best job markets weathered the housing crisis relatively well, while areas with the highest jobless rates were among the hardest hit by the housing crisis.
When a labor market is weak and the housing market is failing, numerous trickle-down factors take effect. While out-of-job workers would frequently relocate, they may not be able to if a mortgage ties them down and they cannot sell their house. This, in turn, puts further strain on an already depressed housing market. Further, unemployed consumers spend less, which increases the likelihood of more job cuts at local businesses who cannot stay afloat. For these reasons, Kohli said, an area’s job market tends to be very closely tied to its housing market.
Indeed, in 14 of the 23 weakest metro area job markets, home prices fell by more than 20% from the fourth quarter of 2005 through the same period in 2015. By contrast, home prices in all but three of the 23 best job markets increased over that time.
A delayed recovery from the housing crisis is only one of the problems afflicting the nation’s struggling local economies. Kohli noted the ongoing drought in California and parts of the Midwest as a major driver of unemployment in those areas. The state is in its fifth year of drought, and this year’s El Nino storms have not come close to meeting the hopes of businesses and residents.
A majority of the regions with the highest unemployment rates are located in California, away from the coast or in neighboring states. Inland California is home to some of the country’s most concentrated agricultural industries. In El Centro, for example, the concentration of farm workers is 21 times greater than the national average.
Compared with the nation’s weakest job markets, the metro areas with the lowest jobless rates are far more likely to have a major university. Ames, Iowa; Burlington, Vermont; Provo, Utah; Ann Arbor, Michigan; and Iowa City, Iowa all have some of the strongest job markets and are also home to at least one major university system. Kohli explained that a university is often a very economically healthy addition to an area’s community as companies interested in attracting skilled workforces frequently locate there. “[Universities] create environments that other types of companies seem to want to be in.”
To identify the best and worst job markets in the United States, 24/7 Wall St. reviewed the metropolitan statistical areas (MSA) with the highest and lowest unemployment rates as of December 2015 from the Bureau of Labor Statistics (BLS). Only the 381 metro areas reviewed by both the BLS and the U.S. Census were considered. Labor force changes also came from the BLS. Median household incomes, poverty rates, educational attainment rates, the percentage of households receiving SNAP benefits (food stamps), and the proportions of households earning less than $10,000 and more than $200,000 annually all came from the Census Bureau’s 2015 American Community Survey (ACS), the latest period available. Workforce composition also came from the ACS. Quarterly median home prices since 2005 came from the Federal Housing Finance Agency (FHFA).
These are the cities with the highest (and lowest) unemployment rates.
The Cities With the Highest Unemployment Rates

21. Danville, IL
> December 2015 unemployment rate: 7.4%
> Unemployment rate, December 2014: 7.0%
> Unemployment rate, December 2005: 5.9%
> Median household income: $41,690
> Poverty rate: 18.7%
> Pct. of adults with a bachelor’s degree: 13.8%
Danville is home to a larger share of unemployed workers than the vast majority of American cities. While unemployment in most cities has dropped in the last 12 months, in Danville, the rate has climbed from 7.0% to 7.4% in the last year.
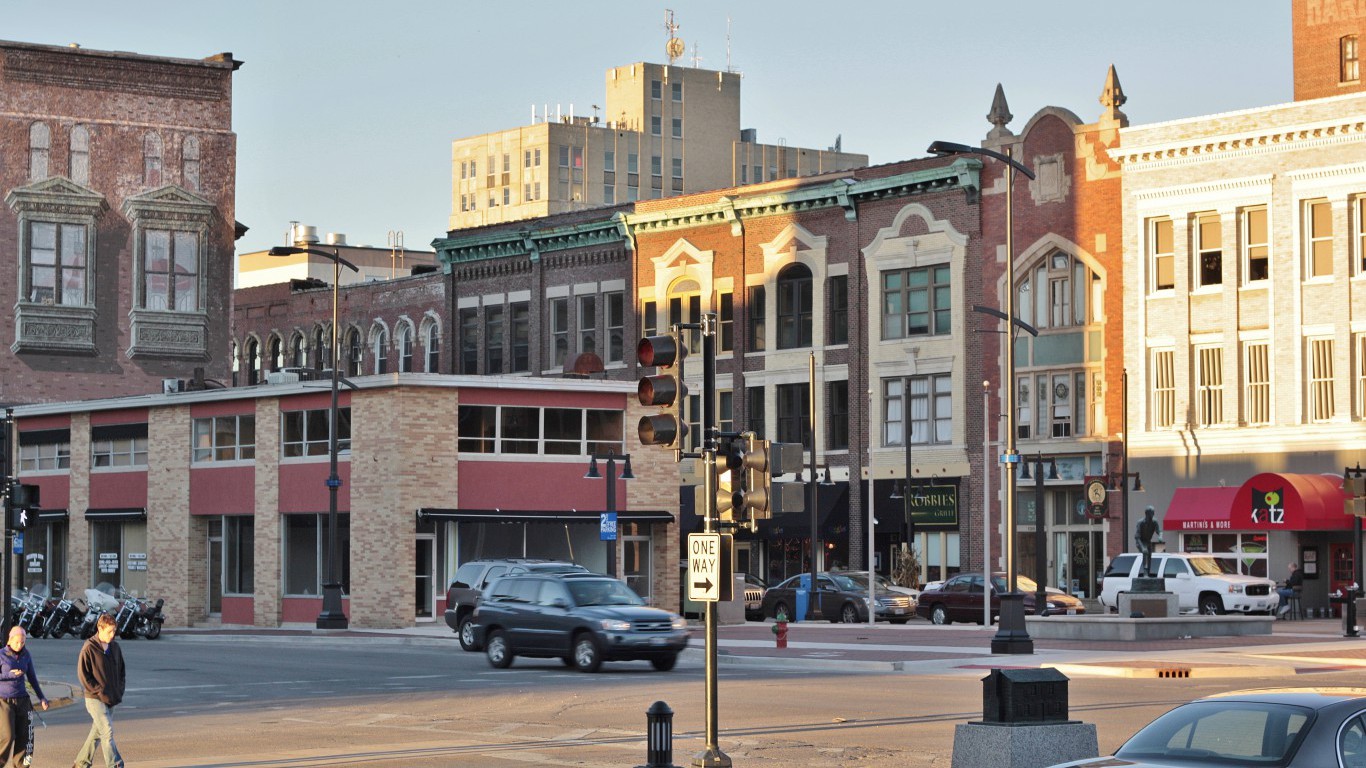
21. Decatur, IL
> December 2015 unemployment rate: 7.4%
> Unemployment rate, December 2014: 7.0%
> Unemployment rate, December 2005: 6.2%
> Median household income: $47,574
> Poverty rate: 15.4%
> Pct. of adults with a bachelor’s degree: 24.2%
Though Decatur’s labor market has shown some signs of improvement since December 2009 when the unemployment rate was 12.4%, it still lags behind the rest of the country. Roughly 7.4% of Decatur’s 50,000 strong labor force is out of work and looking for a job, one of the highest jobless rates in the country.
[nativounit]
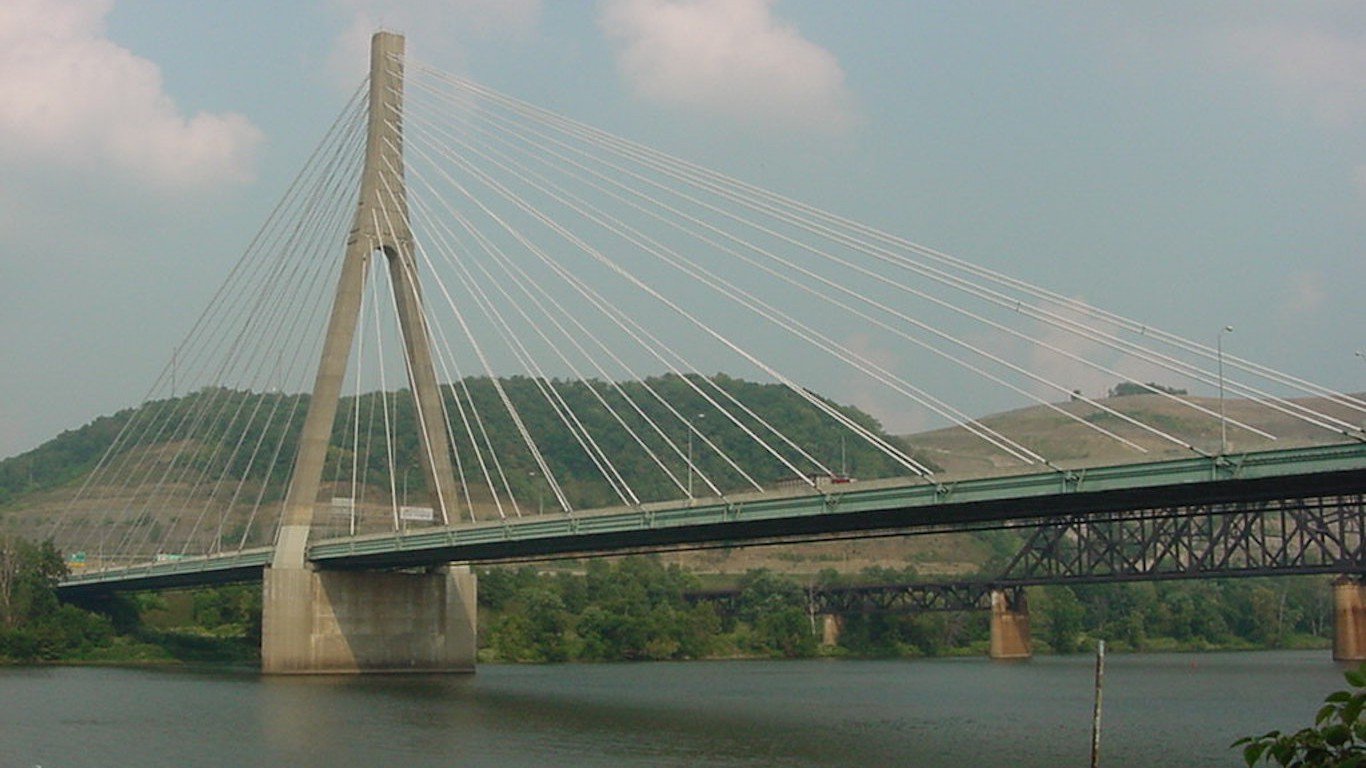
21. Weirton-Steubenville, WV
> December 2015 unemployment rate: 7.4%
> Unemployment rate, December 2014: 6.7%
> Unemployment rate, December 2005: 7.0%
> Median household income: $44,582
> Poverty rate: 16.9%
> Pct. of adults with a bachelor’s degree: 17.1%
Of the 23 U.S. metro areas with the highest unemployment rates, the Weirton-Steubenville area had the worst short term change. In the last 12 months, the unemployment rate in the metro area has jumped from 6.7% to 7.4%.

19. Redding, CA
> December 2015 unemployment rate: 7.5%
> Unemployment rate, December 2014: 8.8%
> Unemployment rate, December 2005: 6.7%
> Median household income: $43,706
> Poverty rate: 13.8%
> Pct. of adults with a bachelor’s degree: 20.8%
Housing markets are often closely tied with labor markets. Since 2005, home prices in Redding have declined by 22%. Over the same time period, unemployment has climbed from 6.7% to 7.5%.
[recirclink id=316031]

19. Longview, WA
> December 2015 unemployment rate: 7.5%
> Unemployment rate, December 2014: 8.5%
> Unemployment rate, December 2005: 7.0%
> Median household income: $42,223
> Poverty rate: 22.5%
> Pct. of adults with a bachelor’s degree: 14.7%
Only a handful of U.S. cities have a smaller share of adults with a college education. Only 14.7% of adults in Longview have a bachelor’s degree, less than half the 30.1% national college attainment rate.

18. Lake Havasu City-Kingman, AZ
> December 2015 unemployment rate: 7.6%
> Unemployment rate, December 2014: 8.4%
> Unemployment rate, December 2005: 4.0%
> Median household income: $37,674
> Poverty rate: 20.6%
> Pct. of adults with a bachelor’s degree: 12.9%
Over the past 10 years, the unemployment rate in Lake Havasu has spiked dramatically. Despite the troubling long-term trend, the past 12 months were better as the area’s unemployment rate has declined by nearly a full percentage point.
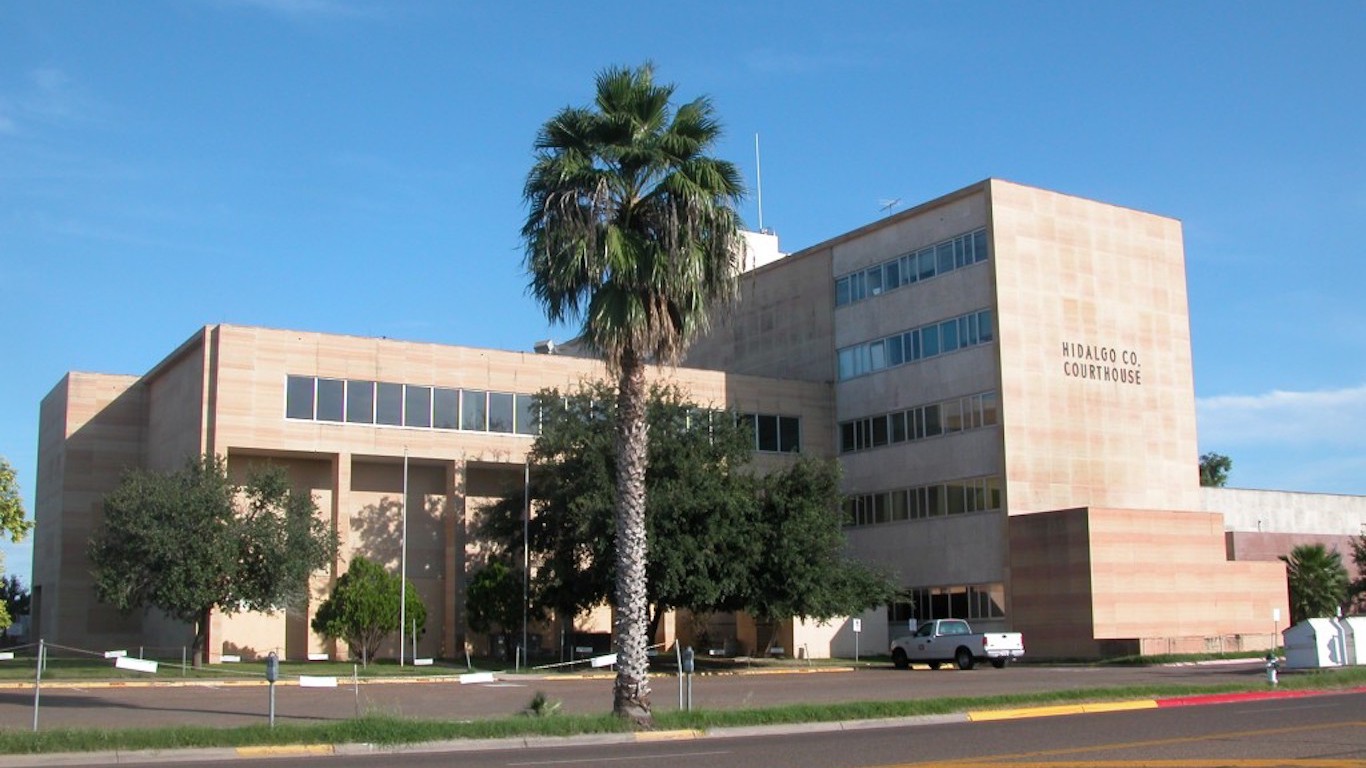
16. McAllen-Edinburg-Mission, TX
> December 2015 unemployment rate: 7.8%
> Unemployment rate, December 2014: 7.6%
> Unemployment rate, December 2005: 7.4%
> Median household income: $34,801
> Poverty rate: 34.0%
> Pct. of adults with a bachelor’s degree: 17.9%
With a high unemployment rate, it may not be surprising that McAllen-Edinburg-Mission metro area is home to very few high earners. Less than 2% of area households earn more than $200,000 annually, one of the smallest such shares in the country.
[nativounit]

16. Kennewick-Richland, WA
> December 2015 unemployment rate: 7.8%
> Unemployment rate, December 2014: 9.2%
> Unemployment rate, December 2005: 7.8%
> Median household income: $58,020
> Poverty rate: 16.3%
> Pct. of adults with a bachelor’s degree: 25.1%
Housing markets and labor markets are often closely tied. However, unlike most cities with high unemployment, Kennewick-Richland’s housing market is doing relatively well. As unemployment in the city is unchanged from 10 years ago, home prices have climbed by 22%.

15. Santa Cruz-Watsonville, CA
> December 2015 unemployment rate: 8.5%
> Unemployment rate, December 2014: 9.2%
> Unemployment rate, December 2005: 6.6%
> Median household income: $65,368
> Poverty rate: 16.8%
> Pct. of adults with a bachelor’s degree: 39.5%
Like most California cities with high unemployment, Santa Cruz-Watsonville also suffers from drought. With the agriculture industry suffering, many agricultural workers find themselves out of work. Unlike most cities with high unemployment, the metro area’s population is relatively well educated. Nearly 40% of adults in the city have a bachelor’s degree, a much larger share than is typical in most U.S. cities.
[recirclink id=315710]

14. Stockton-Lodi, CA
> December 2015 unemployment rate: 8.8%
> Unemployment rate, December 2014: 10.0%
> Unemployment rate, December 2005: 7.5%
> Median household income: $51,659
> Poverty rate: 20.9%
> Pct. of adults with a bachelor’s degree: 18.3%
While Stockton-Lodi’s unemployment rate has climbed from 7.5% a decade ago to 8.8% this past December, the area’s housing market has taken an even larger hit. Metro area home prices have plunged 33.6% in the past decade, one of the largest declines of any American city.
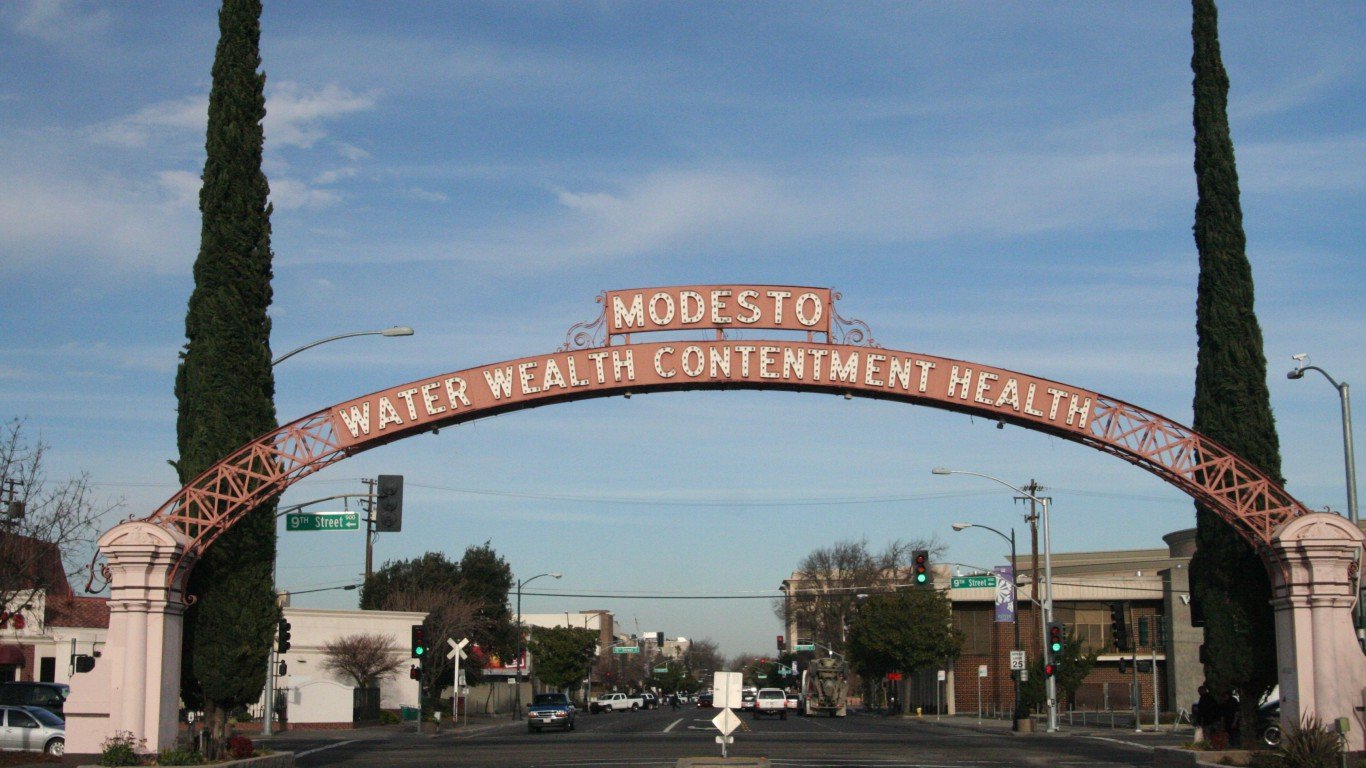
13. Modesto, CA
> December 2015 unemployment rate: 9.1%
> Unemployment rate, December 2014: 10.4%
> Unemployment rate, December 2005: 7.8%
> Median household income: $51,084
> Poverty rate: 18.0%
> Pct. of adults with a bachelor’s degree: 17.0%
As in most metro areas with the highest unemployment rates, Modesto’s weak housing market recovery largely explains the poor job market. Metro home prices are 33.1% lower than they were in 2005, nearly the worst decline of any U.S. metro area over that period.
12. Madera, CA
> December 2015 unemployment rate: 10.1%
> Unemployment rate, December 2014: 11.4%
> Unemployment rate, December 2005: 7.6%
> Median household income: $42,433
> Poverty rate: 22.2%
> Pct. of adults with a bachelor’s degree: 12.2%
As in many cities with high unemployment, the housing market in Madera is hurting. Home prices have fallen by nearly a third since 2005.
[recirclink id=316766]
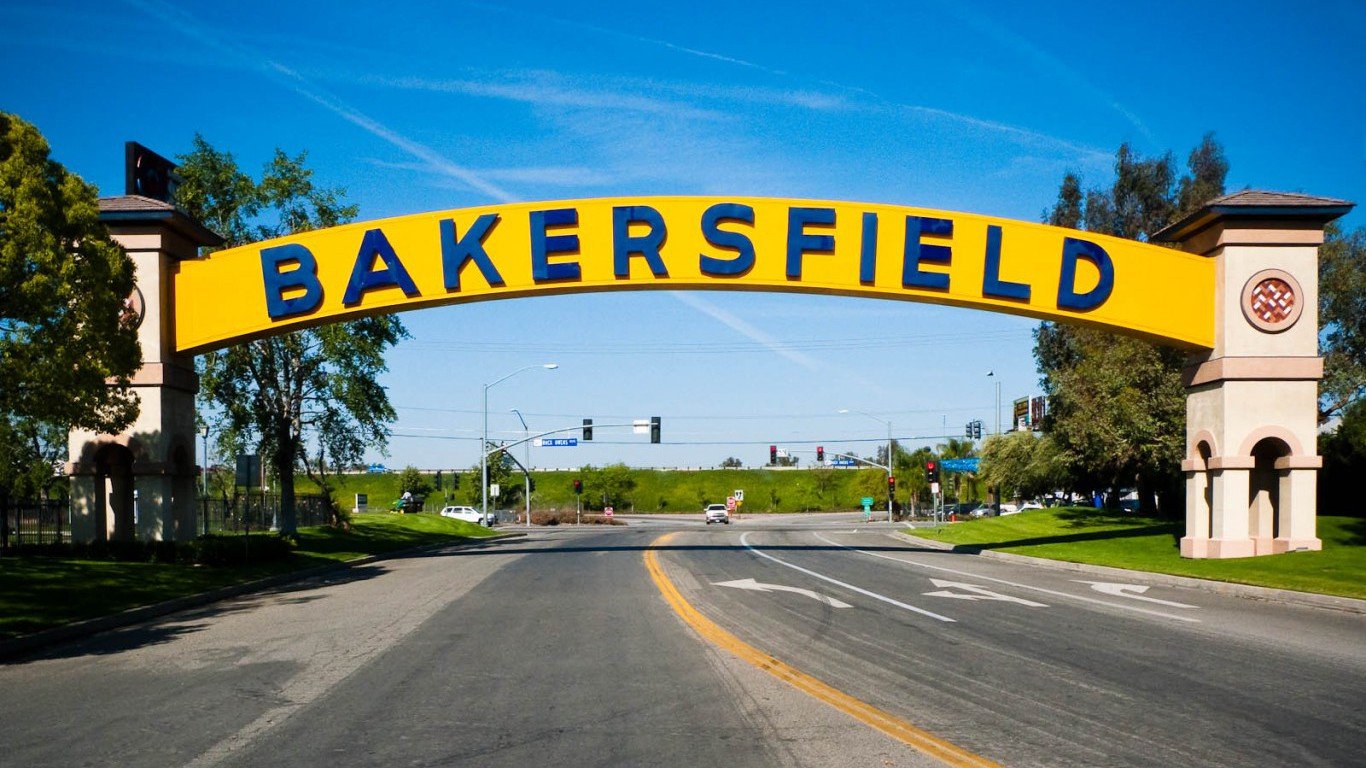
10. Bakersfield, CA
> December 2015 unemployment rate: 10.2%
> Unemployment rate, December 2014: 10.0%
> Unemployment rate, December 2005: 8.0%
> Median household income: $47,644
> Poverty rate: 24.8%
> Pct. of adults with a bachelor’s degree: 15.4%
Bakersfield is one of only a dozen U.S. cities with a double digit unemployment rate. More than 10% of the city’s workforce of roughly 400,000 are in need of a job.

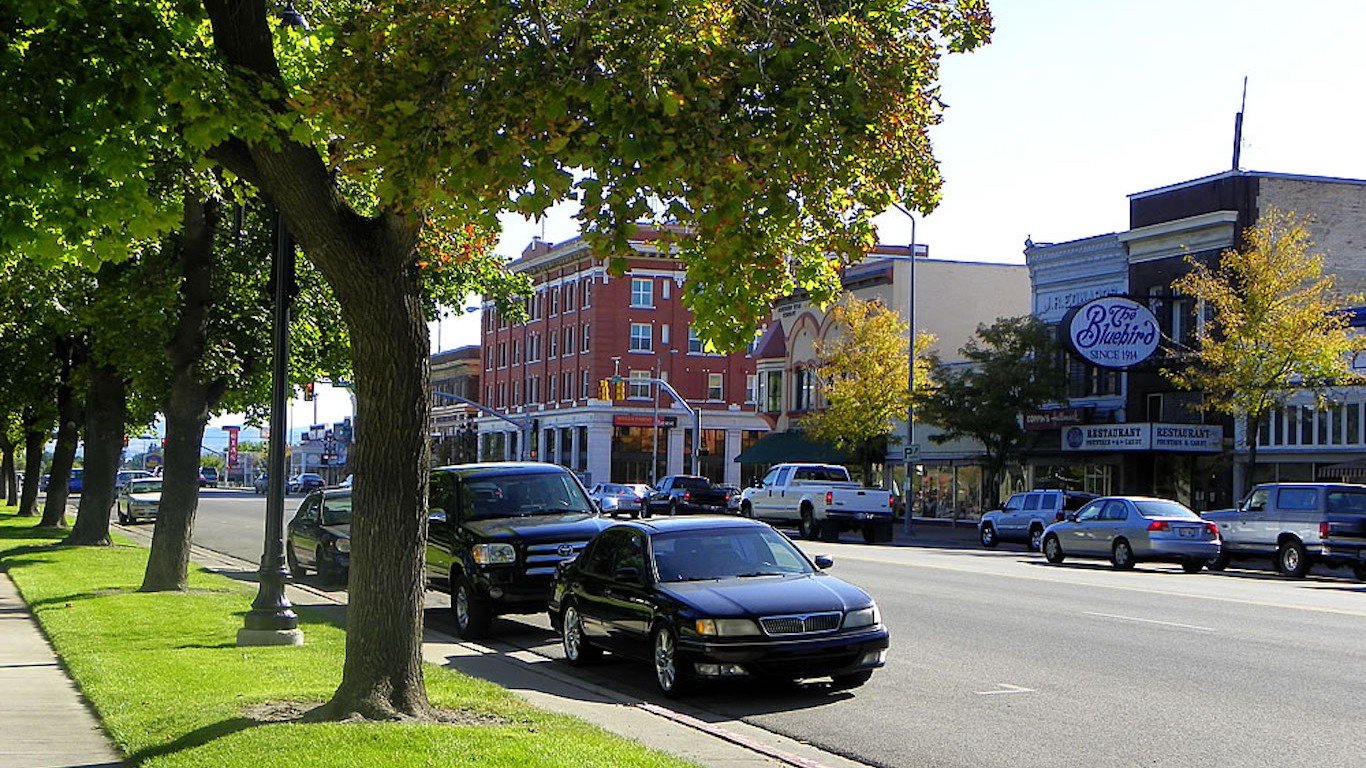
10. Yakima, WA
> December 2015 unemployment rate: 10.2%
> Unemployment rate, December 2014: 11.6%
> Unemployment rate, December 2005: 9.9%
> Median household income: $44,648
> Poverty rate: 20.3%
> Pct. of adults with a bachelor’s degree: 14.5%
As is the case with every city in Washington with an exceptionally high unemployment rate, Yakima’s housing market is relatively resilient. Despite climbing long-term unemployment, home prices in the area have increased by more than 19% over the past 10 years.
[nativounit]
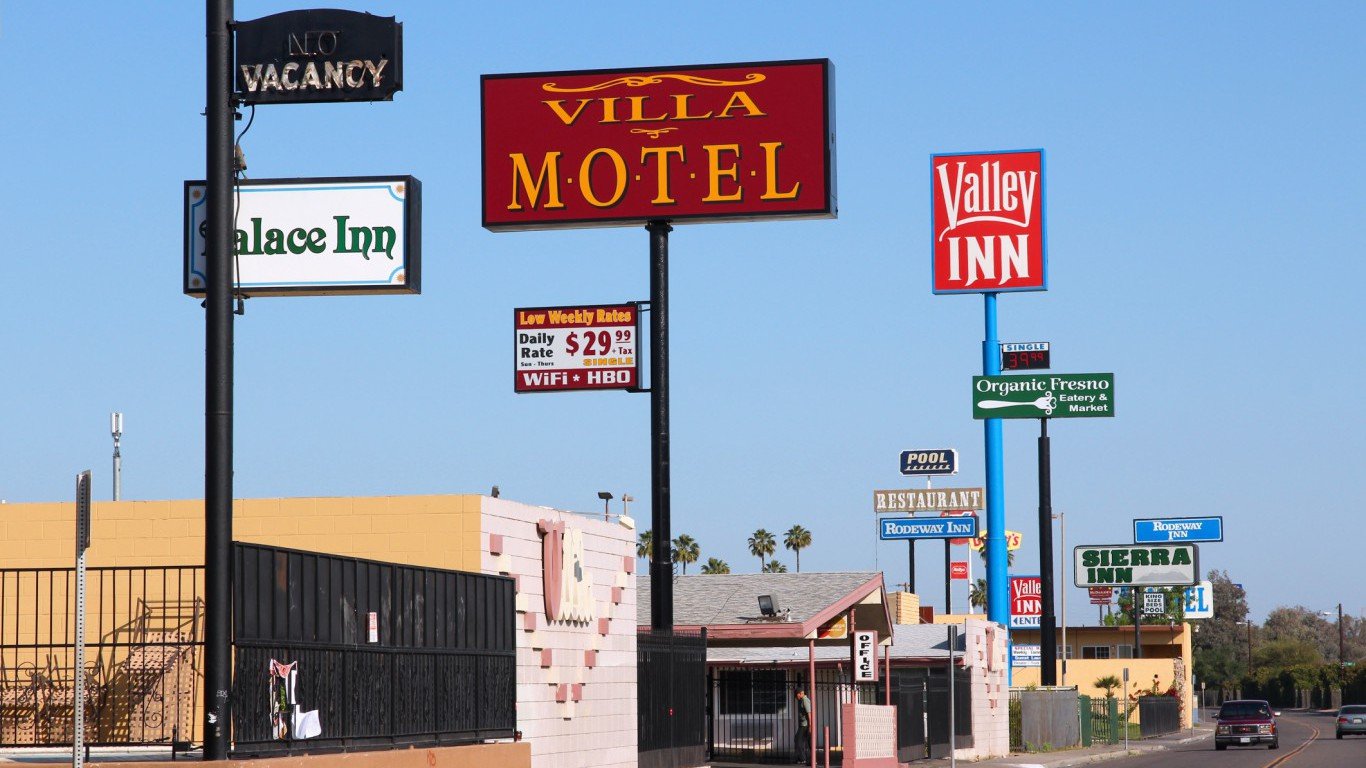
9. Fresno, CA
> December 2015 unemployment rate: 10.3%
> Unemployment rate, December 2014: 11.2%
> Unemployment rate, December 2005: 8.5%
> Median household income: $43,423
> Poverty rate: 27.7%
> Pct. of adults with a bachelor’s degree: 19.7%
As unemployment in Fresno has climbed from 8.5% to 10.3% in the past decade, the housing market has also suffered. Home prices have fallen by more than 28% in the same period, one of the sharpest declines in the country.

8. Salinas, CA
> December 2015 unemployment rate: 10.4%
> Unemployment rate, December 2014: 11.2%
> Unemployment rate, December 2005: 9.6%
> Median household income: $57,864
> Poverty rate: 17.2%
> Pct. of adults with a bachelor’s degree: 23.1%
The economy of Salinas, located near California’s coast, is primarily driven by the region’s agriculture. Of workers in the state, 18.8% are employed in the sector, one of the highest percentages in the country. The metro area has suffered immensely from the state’s ongoing drought — now in its fifth year.

7. Yuba City, CA
> December 2015 unemployment rate: 10.6%
> Unemployment rate, December 2014: 11.5%
> Unemployment rate, December 2005: 9.3%
> Median household income: $48,115
> Poverty rate: 17.8%
> Pct. of adults with a bachelor’s degree: 16.7%
Yuba City’s relatively weak housing market and the low levels of education among workers help explain the region’s struggling job market. These factors will also make a recovery far more challenging. While fourth quarter home prices in 2015 are up 6.6% from the same time the year before, they are down 31.6% compared to the end of 2005. Of adults in the city, 16.7% have a bachelor’s degree, one of the lowest college attainment rates nationwide.
[recirclink id=316969]
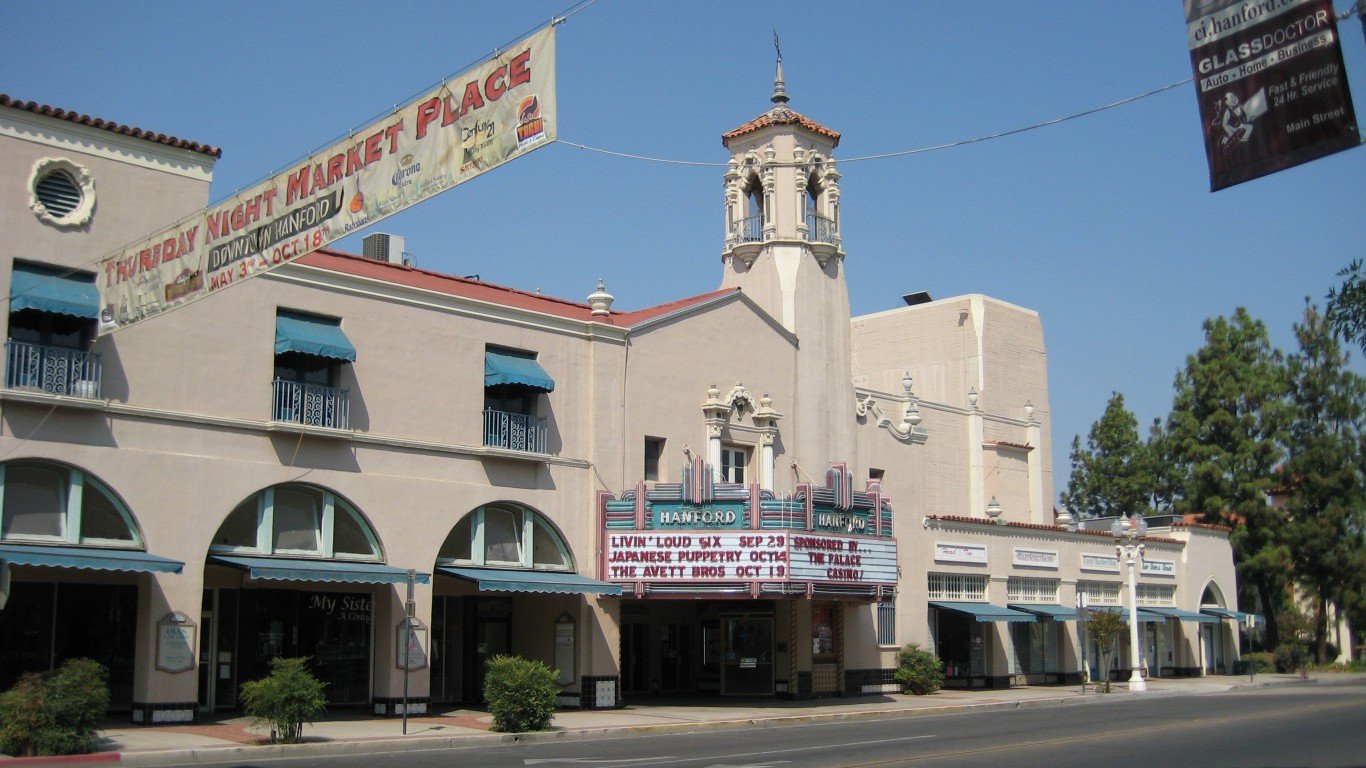
6. Hanford-Corcoran, CA
> December 2015 unemployment rate: 10.9%
> Unemployment rate, December 2014: 11.7%
> Unemployment rate, December 2005: 8.8%
> Median household income: $42,784
> Poverty rate: 26.6%
> Pct. of adults with a bachelor’s degree: 11.5%
Higher educational attainment typically leads to more job opportunities. In Hanford-Corcoran, only 11.5% of adults have a bachelor’s degree, the smallest share of any metro area in the country. With a low educational attainment rate, the city has one of the highest unemployment rates in the United States.

5. Merced, CA
> December 2015 unemployment rate: 11.9%
> Unemployment rate, December 2014: 12.8%
> Unemployment rate, December 2005: 10.0%
> Median household income: $44,084
> Poverty rate: 25.2%
> Pct. of adults with a bachelor’s degree: 13.9%
Merced has one of the highest unemployment rates in the country as well as a struggling housing market. Metro home prices dropped nearly 40% from pre-recession levels, one of the worst declines in the country.
[nativounit]
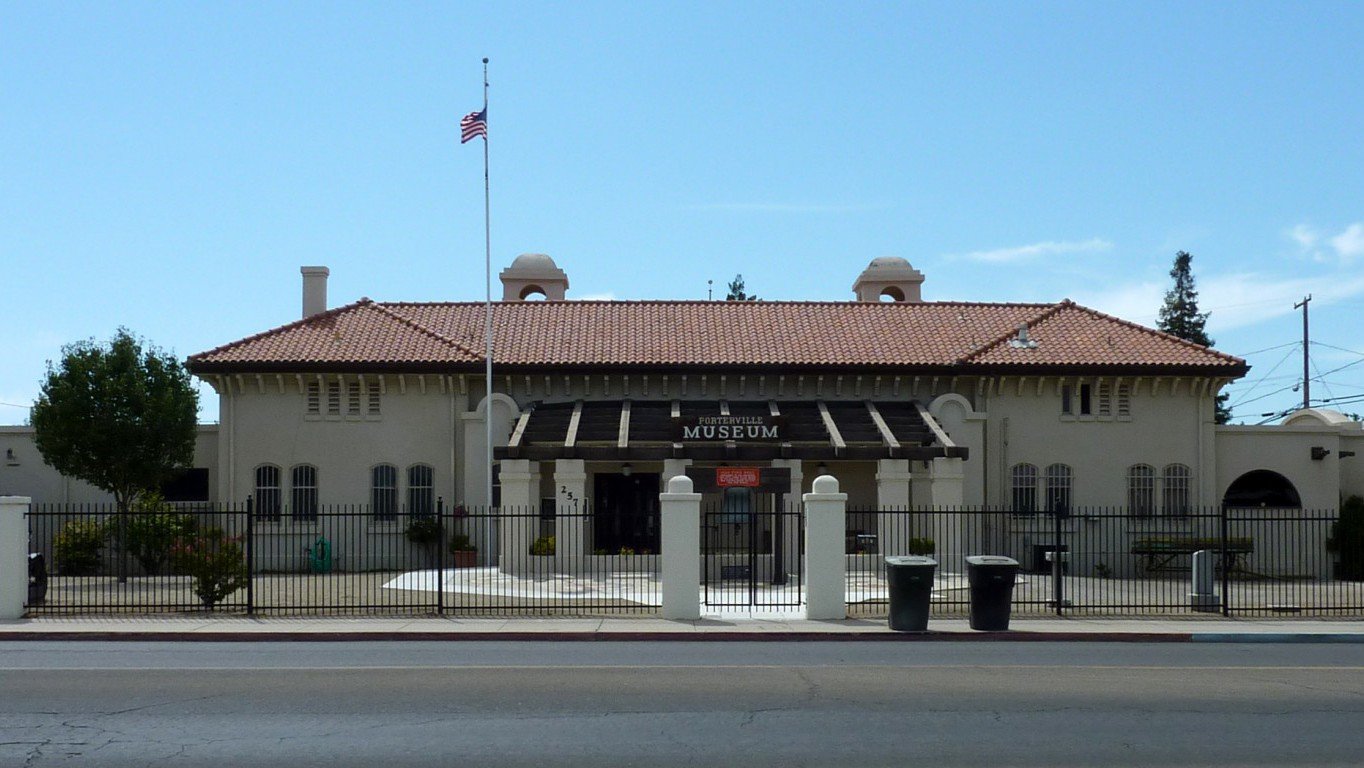
4. Visalia-Porterville, CA
> December 2015 unemployment rate: 12.2%
> Unemployment rate, December 2014: 13.0%
> Unemployment rate, December 2005: 9.5%
> Median household income: $42,611
> Poverty rate: 28.6%
> Pct. of adults with a bachelor’s degree: 12.3%
Visalia’s unemployment rate of 12.2% has improved measurably each year since 2010, when the jobless rate peaked at 18.3%. Still, the job market remains weaker compared to December 2005, when less than 10% of the area’s workforce was unemployed.

3. Ocean City, NJ
> December 2015 unemployment rate: 12.3%
> Unemployment rate, December 2014: 14.6%
> Unemployment rate, December 2005: 9.2%
> Median household income: $56,899
> Poverty rate: 13.5%
> Pct. of adults with a bachelor’s degree: 26.3%
The only East Coast city to make the list, Ocean City’s unemployment rate of 12.3% is higher than nearly every other city in the country.

2. Yuma, AZ
> December 2015 unemployment rate: 18.0%
> Unemployment rate, December 2014: 20.1%
> Unemployment rate, December 2005: 12.1%
> Median household income: $40,008
> Poverty rate: 22.4%
> Pct. of adults with a bachelor’s degree: 13.5%
Roughly 18% of Yuma’s workforce is unemployed. Though the area’s unemployment rate is one of the worst in the country, it is improving. Unemployment has declined every year since 2013, when the city’s unemployment rate hit 23.5%.
[nativounit]
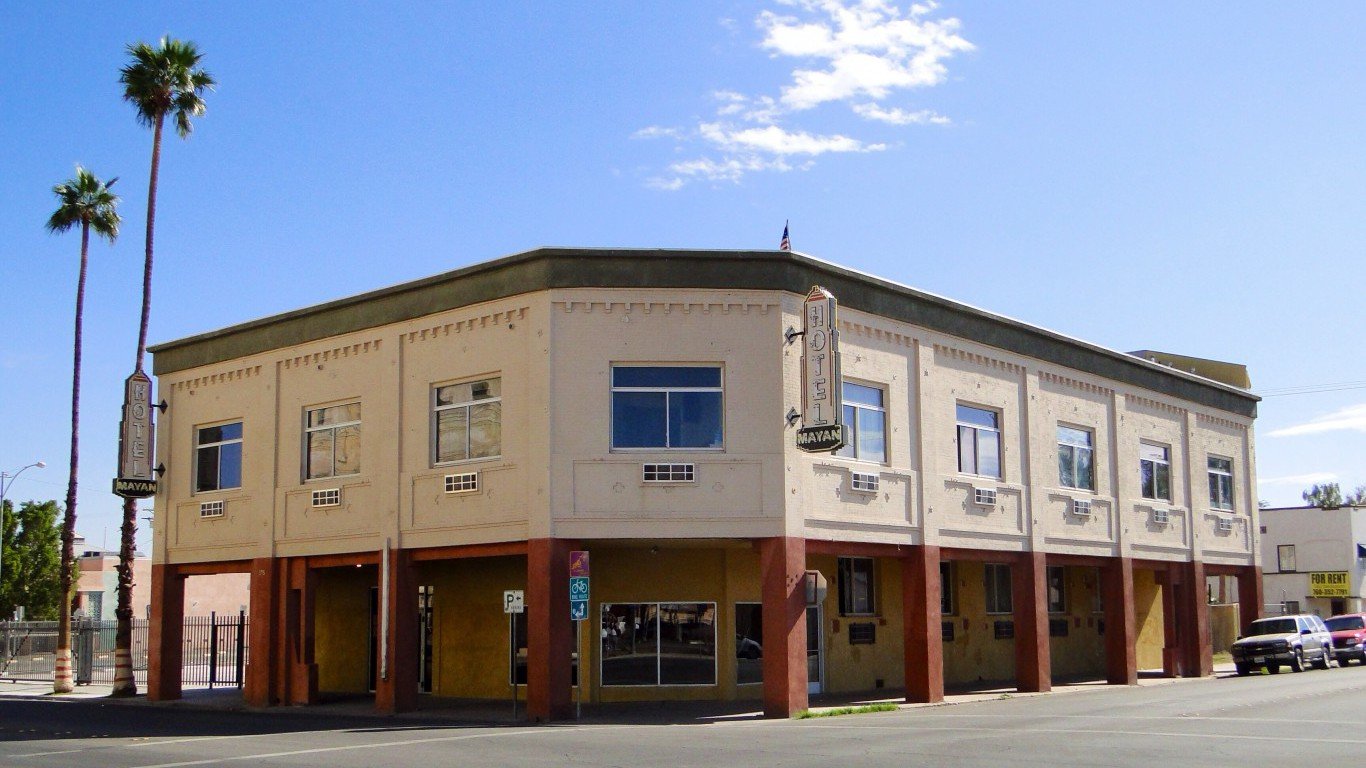
1. El Centro, CA
> December 2015 unemployment rate: 19.6%
> Unemployment rate, December 2014: 22.6%
> Unemployment rate, December 2005: 13.8%
> Median household income: $39,290
> Poverty rate: 23.7%
> Pct. of adults with a bachelor’s degree: 14.8%
Close to one in five members of El Centro’s workforce was unemployed in December, the highest unemployment rate of any metro area in the United States. The area’s economy is highly dependent on its agricultural sector, which has suffered immensely due to California’s five consecutive years of severe drought conditions.
The Cities With the Lowest Unemployment Rates

22. Rochester, MN
> December 2015 unemployment rate: 2.9%
> Unemployment rate, December 2014: 3.1%
> Unemployment rate, December 2005: 3.5%
> Median household income: $66,214
> Poverty rate: 9.5%
> Pct. of adults with a bachelor’s degree: 35.9%
Rochester, Minnesota’s unemployment rate is lower than 3%, as is the case in just 22 other U.S. metro areas. Like most relatively healthy job markets, Rochester’s population is highly educated. Of adults in the area, 36% have at least a bachelor’s degree, one of the highest rates nationwide.
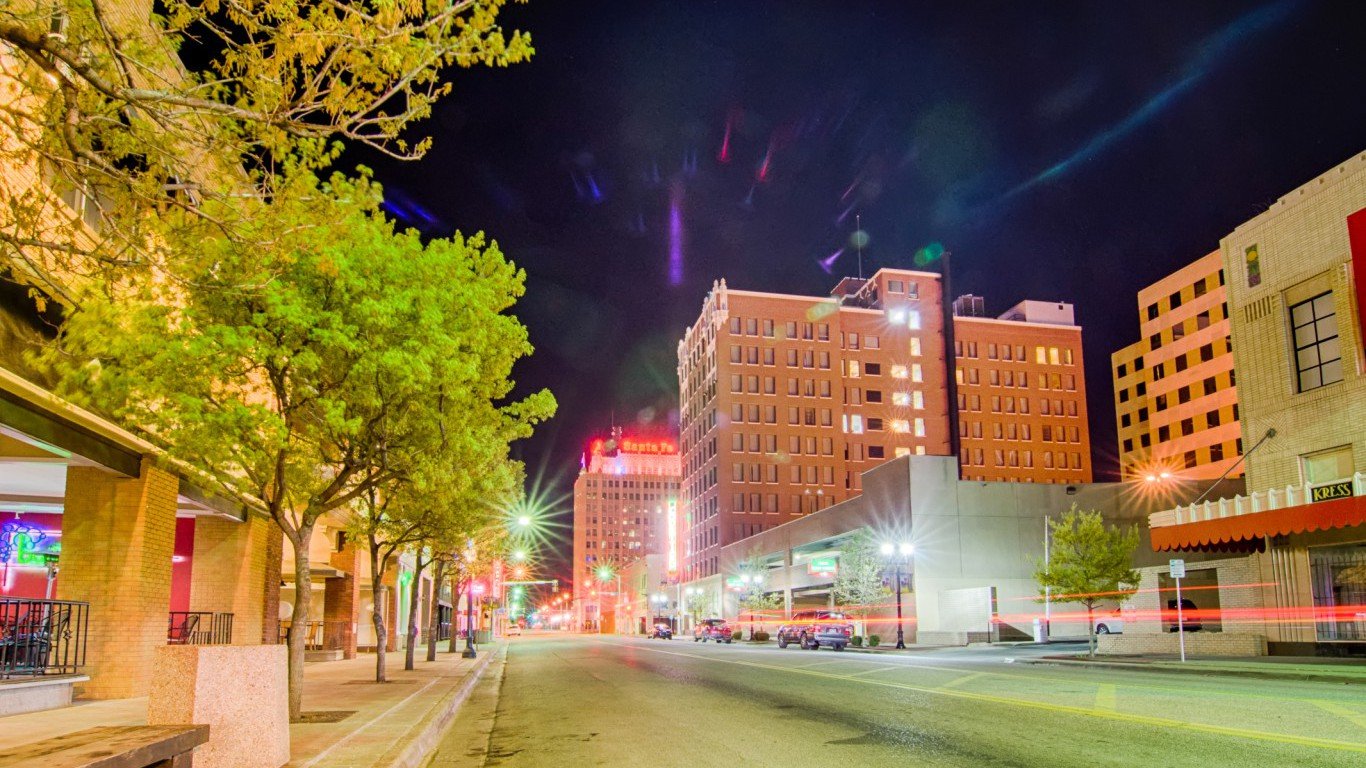
22. Amarillo, TX
> December 2015 unemployment rate: 2.9%
> Unemployment rate, December 2014: 2.9%
> Unemployment rate, December 2005: 3.5%
> Median household income: $51,280
> Poverty rate: 14.8%
> Pct. of adults with a bachelor’s degree: 22.7%
Amarillo is one of only a few metro areas where the unemployment rate remained unchanged and did not improve from December 2014. The area’s economy, however, is by no means unhealthy. Amarillo’s housing market, for example, which is closely tied to the job market, is doing very well. Home prices soared 22.5% from the fourth quarter of 2005 to the same time in 2015, one of the larger improvements of any area.
[nativounit]

16. Fort Collins, CO
> December 2015 unemployment rate: 2.8%
> Unemployment rate, December 2014: 3.5%
> Unemployment rate, December 2005: 4.3%
> Median household income: $56,575
> Poverty rate: 13.2%
> Pct. of adults with a bachelor’s degree: 42.7%
At 2.8%, the unemployment rate in Fort Collins is tied with five other metro areas and is one of the lowest in the country. Like many of the nation’s strongest metro job markets, Fort Collins is home to a major university. Colorado State College, based in the city, likely helps attracts new employers looking for educated workers and partially explains the low jobless rate.
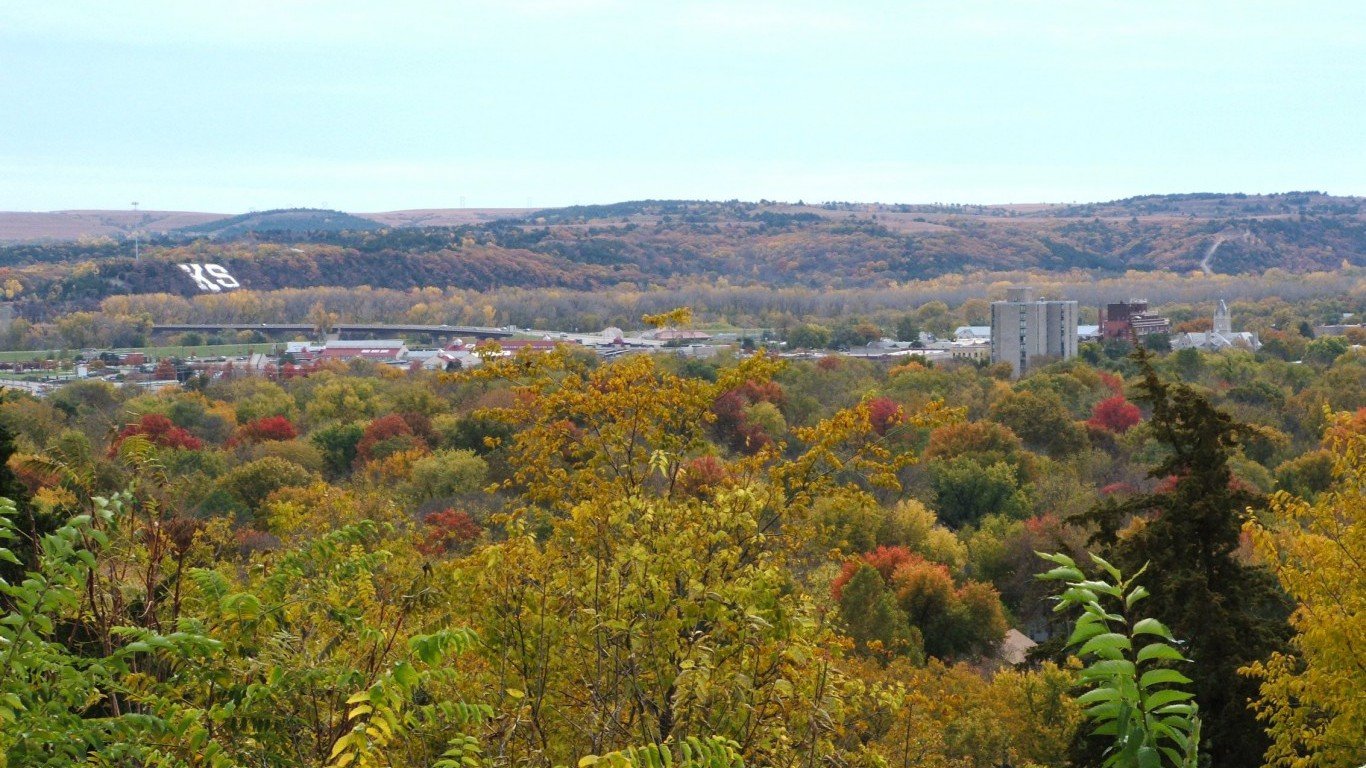
16. Manhattan, KS
> December 2015 unemployment rate: 2.8%
> Unemployment rate, December 2014: 3.0%
> Unemployment rate, December 2005: 3.3%
> Median household income: $50,323
> Poverty rate: 19.6%
> Pct. of adults with a bachelor’s degree: 45.8%
Nearly 46% of adults in Manhattan, Kansas have at least a bachelor’s degree, well above the national average rate of 30.1% and one of the highest shares in the country. Well-educated workers not only tend to have more job opportunities, but they also tend to populate areas with healthy job markets. The area’s job market weathered the financial crisis especially well — Manhattan’s unemployment rate of 2.8% is lower even than it was 10 years ago, before the financial crisis.
[recirclink id=317024]

16. Portland-South Portland, ME
> December 2015 unemployment rate: 2.8%
> Unemployment rate, December 2014: 4.0%
> Unemployment rate, December 2005: 3.2%
> Median household income: $59,573
> Poverty rate: 11.0%
> Pct. of adults with a bachelor’s degree: 38.6%
Compared to most healthy job markets, the housing market in the Portland, Maine area is not doing especially well. Home prices in the fourth quarter of 2015 were 1.6% lower than what they were in the same period 10 years prior. Still, back then as now, the area’s unemployment rate was well below the national rate and one of the lowest in the country.

16. Grand Rapids-Wyoming, MI
> December 2015 unemployment rate: 2.8%
> Unemployment rate, December 2014: 3.7%
> Unemployment rate, December 2005: 5.7%
> Median household income: $54,372
> Poverty rate: 13.8%
> Pct. of adults with a bachelor’s degree: 31.1%
Many of the top metro area job markets got through the financial crisis without major economic declines and have remained robust economies for some time. Despite its current relative economic strength, Grand Rapids’ unemployment rate peaked at 11.4% in December 2009, when it was well above the national rate and higher than in any other area on this list.
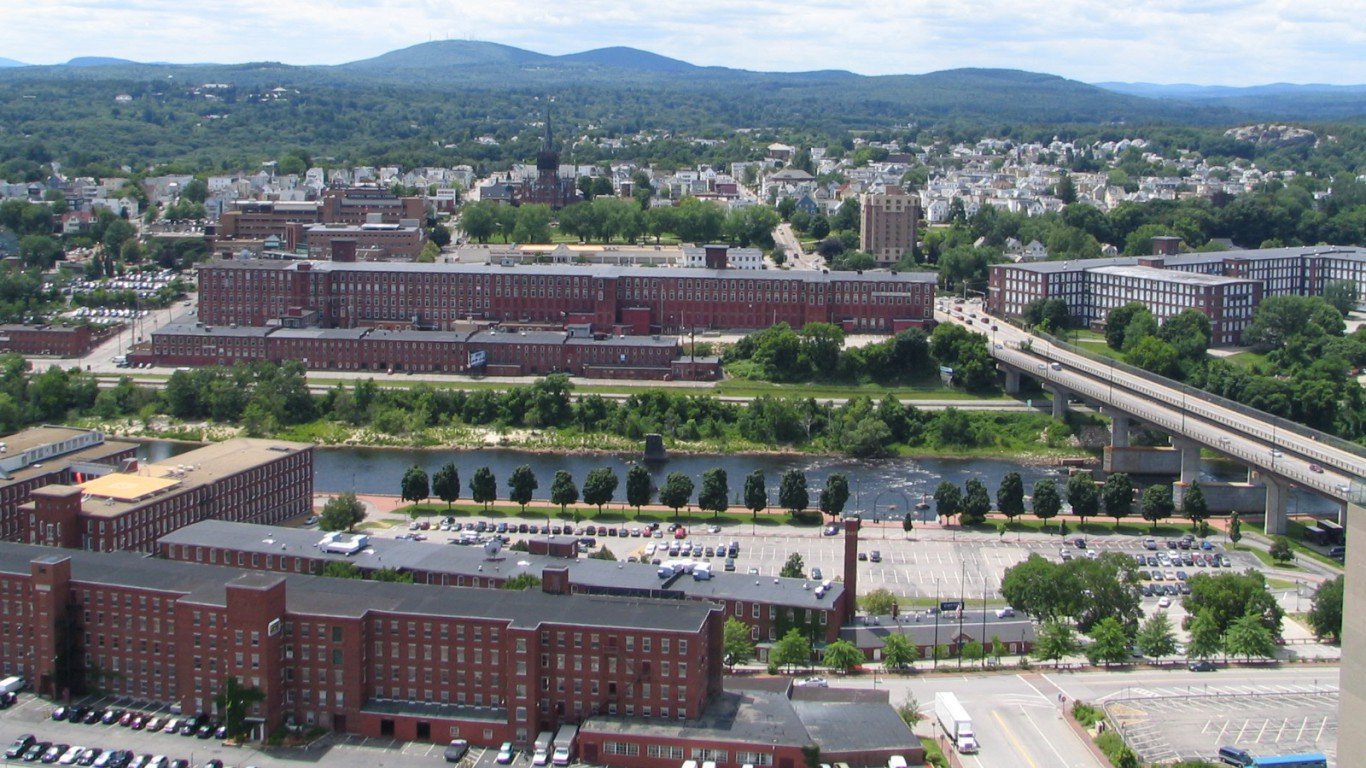
16. Manchester-Nashua, NH
> December 2015 unemployment rate: 2.8%
> Unemployment rate, December 2014: 3.6%
> Unemployment rate, December 2005: 3.2%
> Median household income: $71,422
> Poverty rate: 8.7%
> Pct. of adults with a bachelor’s degree: 35.1%
While home prices in the Manchester area are some of the highest in the country, they are down 12.4% compared to the end of 2005. This is one of the larger drops of any area and exceptionally poor compared with other metros with the lowest unemployment rates.
[nativounit]

16. Salt Lake City, UT
> December 2015 unemployment rate: 2.8%
> Unemployment rate, December 2014: 3.1%
> Unemployment rate, December 2005: 3.3%
> Median household income: $62,642
> Poverty rate: 11.4%
> Pct. of adults with a bachelor’s degree: 31.3%
There are several universities in Salt Lake City, including the University of Utah. The presence of such institutions is not only an attraction to young workers and companies looking to relocate, but also tends to coincide with lower unemployment.

13. Urban Honolulu, HI
> December 2015 unemployment rate: 2.7%
> Unemployment rate, December 2014: 3.5%
> Unemployment rate, December 2005: 2.2%
> Median household income: $74,634
> Poverty rate: 9.7%
> Pct. of adults with a bachelor’s degree: 32.6%
In December of 2005, Urban Honolulu had the lowest unemployment rate in the nation at 2.2%. While the rate is slightly higher a decade later, the Honolulu area job market is still among the healthiest in the United States.
[recirclink id=317601]
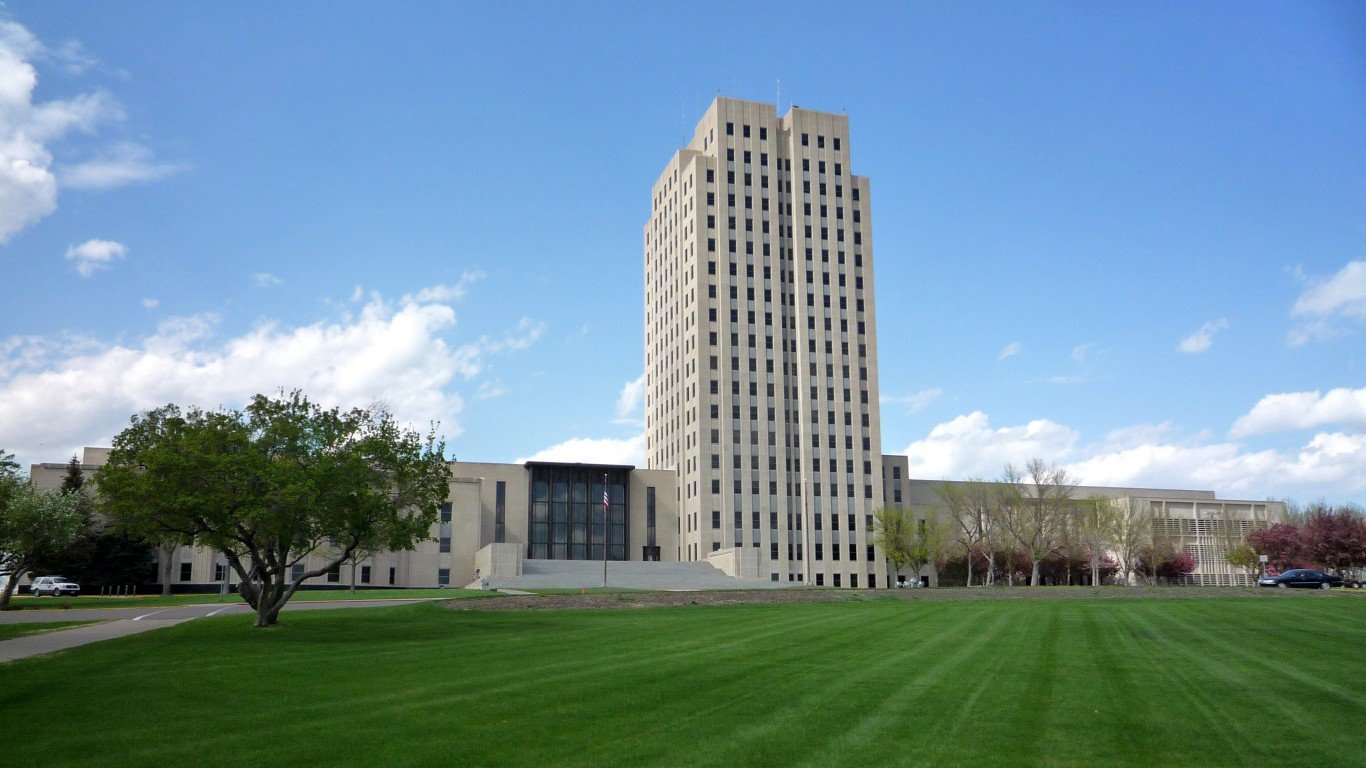
13. Bismarck, ND
> December 2015 unemployment rate: 2.7%
> Unemployment rate, December 2014: 3.1%
> Unemployment rate, December 2005: 3.1%
> Median household income: $63,356
> Poverty rate: 9.8%
> Pct. of adults with a bachelor’s degree: 32.2%
North Dakota is among several Midwestern states with especially low unemployment rates. These states also weathered the financial crisis relatively well, Kohli explained. Not only has Bismarck benefited from its general geographic location, but also from North Dakota’s energy boom, which has dramatically increased job opportunities in recent years.
13. Grand Forks, ND-MN
> December 2015 unemployment rate: 2.7%
> Unemployment rate, December 2014: 3.1%
> Unemployment rate, December 2005: 3.4%
> Median household income: $49,691
> Poverty rate: 18.9%
> Pct. of adults with a bachelor’s degree: 28.0%
As in a number of other healthy job markets, Grand Forks residents are more likely to have a job than most Americans but do not necessarily live above the poverty line. The area’s poverty rate of 18.9% is far higher than the national rate of 15.5%.
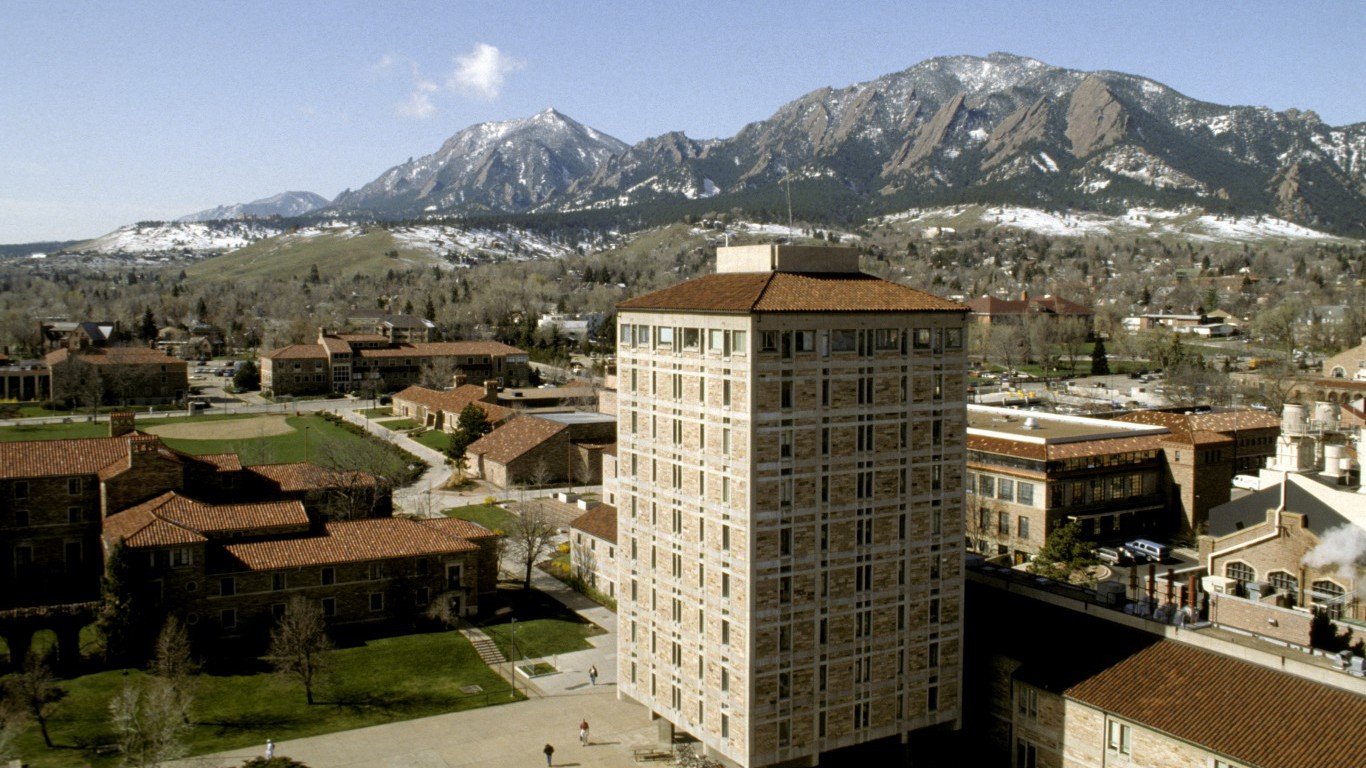
8. Boulder, CO
> December 2015 unemployment rate: 2.6%
> Unemployment rate, December 2014: 3.3%
> Unemployment rate, December 2005: 4.0%
> Median household income: $71,540
> Poverty rate: 14.1%
> Pct. of adults with a bachelor’s degree: 58.0%
An extraordinary 58% of Boulder, Colorado adults have at least a bachelor’s degree. Educated adults have greater access to employment opportunities and this largely explains the area’s low unemployment rate of just 2.6%. In addition, as Boulder is home to a number of major universities, the city likely also attracts major companies in search of high-skilled employees.
[recirclink id=317970]

8. Ann Arbor, MI
> December 2015 unemployment rate: 2.6%
> Unemployment rate, December 2014: 3.3%
> Unemployment rate, December 2005: 4.2%
> Median household income: $62,845
> Poverty rate: 14.5%
> Pct. of adults with a bachelor’s degree: 53.0%
Economic factors in Ann Arbor are in many ways ideal for a healthy job market. Residents are well educated, report high incomes, and the city is home to several large and profitable education institutions. The University of Michigan, for example, is based in the area. More than half of area adults have a bachelor’s degree, and a typical household earns over $62,000 annually, each some of the highest figures in the country.

8. Columbia, MO
> December 2015 unemployment rate: 2.6%
> Unemployment rate, December 2014: 3.2%
> Unemployment rate, December 2005: 2.9%
> Median household income: $50,085
> Poverty rate: 20.7%
> Pct. of adults with a bachelor’s degree: 44.7%
Columbia’s unemployment rate improved from last year and from 10 years ago. With a jobless rate of 2.6%, one of the lowest in the country, the area’s job market is one of the healthiest in the nation. This does not necessarily mean individuals in the area are well-off financially. Unlike nearly every other low-unemployment area, more than one in five residents live in poverty, one of the highest rates in the country.
[nativounit]

8. Sioux Falls, SD
> December 2015 unemployment rate: 2.6%
> Unemployment rate, December 2014: 2.9%
> Unemployment rate, December 2005: 2.9%
> Median household income: $58,849
> Poverty rate: 9.7%
> Pct. of adults with a bachelor’s degree: 32.6%
Most often, areas with a struggling housing market also have a weak labor market. Conversely, the best job markets frequently have especially strong housing markets. In Sioux Falls, where just 2.6% of the workforce is unemployed, homes prices are not especially high compared to the nation. However, prices rose by 22.9% over the 10 years through the fourth quarter of 2015, one of the largest improvements nationwide.
8. Logan, UT-ID
> December 2015 unemployment rate: 2.6%
> Unemployment rate, December 2014: 2.6%
> Unemployment rate, December 2005: 2.5%
> Median household income: $51,497
> Poverty rate: 14.5%
> Pct. of adults with a bachelor’s degree: 32.6%
Relatively few households in Logan earn less than $10,000 or more than $200,000, each among the smallest shares of all metro areas. So while the median household income of $51,497 annually is slightly lower than the national median, income is relatively well distributed. The area’s healthy job market may be partly the reason for this. With a jobless rate of just 2.6%, the Logan area job market is healthier than just a handful of local job markets.

5. Iowa City, IA
> December 2015 unemployment rate: 2.5%
> Unemployment rate, December 2014: 3.0%
> Unemployment rate, December 2005: 3.1%
> Median household income: $59,791
> Poverty rate: 16.0%
> Pct. of adults with a bachelor’s degree: 48.8%
Nearly half of adults in Iowa City have at least a bachelor’s degree, one of the highest college attainment rates in the country. Iowa City is home to the University of Iowa, one of the oldest and largest universities in the nation. The presence of a major university helps explain the high education attainment rate and also the low unemployment rate, which at 2.5% is lower than in the vast majority of areas. Further, the area’s jobless rate improved from the year before and from a decade ago.
[recirclink id=316000]
5. Mankato-North Mankato, MN
> December 2015 unemployment rate: 2.5%
> Unemployment rate, December 2014: 2.6%
> Unemployment rate, December 2005: 3.2%
> Median household income: $54,055
> Poverty rate: 16.3%
> Pct. of adults with a bachelor’s degree: 31.0%
Minnesota is one of several geographically contiguous states in the Midwest that weathered the financial crisis especially well and continue to have some of the nation’s lowest unemployment rates. The Mankato area’s unemployment rate of 2.5% is one of the lowest in the country and the second lowest in Minnesota after Fargo.

5. Provo-Orem, UT
> December 2015 unemployment rate: 2.5%
> Unemployment rate, December 2014: 2.7%
> Unemployment rate, December 2005: 3.1%
> Median household income: $60,890
> Poverty rate: 12.5%
> Pct. of adults with a bachelor’s degree: 37.1%
As in a number of other areas with healthy job markets, Provo-Orem workers are relatively well educated — 37.1% of adults have a bachelor’s degree versus 30.1% of adults nationwide. Of the area’s labor force, 3% are employed in the information sector, and 14% are employed in professional, scientific, and managements positions. These professions tend to pay higher wages.
[nativounit]
3. Fargo, ND-MN
> December 2015 unemployment rate: 2.4%
> Unemployment rate, December 2014: 2.7%
> Unemployment rate, December 2005: 2.8%
> Median household income: $53,867
> Poverty rate: 12.5%
> Pct. of adults with a bachelor’s degree: 36.7%
Tied with Burlington, the Fargo metro area’s unemployment rate of 2.4% trails only two other U.S. metros. Compared with other urban areas, home prices in Fargo are among the highest. Since 2005, home prices soared 35.1%, one of the largest increases nationwide and an indication of relative economic health. The rise could also help explain the low unemployment rate.

3. Burlington-South Burlington, VT
> December 2015 unemployment rate: 2.4%
> Unemployment rate, December 2014: 3.2%
> Unemployment rate, December 2005: 3.0%
> Median household income: $61,947
> Poverty rate: 10.4%
> Pct. of adults with a bachelor’s degree: 41.7%
Burlington is the largest city in Vermont and home to the University of Vermont as well as several other educational institutions. This partially explains the area’s particularly high college attainment rate. More than two in every five adults have at least a college degree. This also helps explain the low unemployment rate, which at 2.4% trails only Lincoln and Ames. The Burlington area also benefits from a low poverty rate. Just 10.4% of people live in poverty, one of the lowest rates in the nation.

2. Lincoln, NE
> December 2015 unemployment rate: 2.3%
> Unemployment rate, December 2014: 2.6%
> Unemployment rate, December 2005: 3.2%
> Median household income: $52,046
> Poverty rate: 14.0%
> Pct. of adults with a bachelor’s degree: 35.6%
Like nearly every other low-unemployment area, Lincoln’s jobless rate of 2.3% is down from a year ago as well as from 2005. The area’s economy weathered the financial crisis extremely well, with the unemployment rate peaking at 4.2% in 2009, a time considered to be the depths of the downturn.
[nativounit]

1. Ames, IA
> December 2015 unemployment rate: 2.2%
> Unemployment rate, December 2014: 2.6%
> Unemployment rate, December 2005: 2.8%
> Median household income: $46,091
> Poverty rate: 22.5%
> Pct. of adults with a bachelor’s degree: 47.9%
No metro area has a lower unemployment rate than Ames, Iowa, where just 2.2% of the workforce is out of a job and looking for work, down from the year before and from 2005. Even in those years, the December jobless rates were among the lowest in the country. The area is home to numerous universities and educational institutions as well as major employers. This may partially explain the high educational attainment levels and low jobless rate. More than two in every five members of the labor force are employed in educational services and health care and social assistance. Of adults living in the area, nearly half have a bachelor’s degree.
Contact [email protected] for any questions or corrections.