[cnxvideo id=”508516″ placement=”ros”]The U.S. economy grew at an annualized rate of 2.6% in the fourth quarter, capping 15 straight quarters of economic growth. The economy has added jobs for more than seven years. The Dow Jones industrial average has now climbed above 25,000 points, a level many would have deemed unreachable half a decade ago.
The United States is in the midst of a period of economic prosperity. This period of ongoing prosperity — to the alarm of many economists — has come with a widening gap between the rich and poor. As corporations and wealthy Americans are getting an increasingly larger piece of the pie, the middle class is dwindling and many of the nation’s poor are finding it increasingly difficult to earn a living wage and find steady employment.
Uneven prosperity in the United States is evident not just across its classes, but also geographically. In Camden, New Jersey, over 35% of the population lives in poverty, while in Clifton, also in New Jersey, the poverty rate is just 8.6%. Clifton is just one example of the cities where living conditions tend to vastly exceed the typical city nationwide. In each state, at least one city fares, if not better the nation as a whole, then better than the rest of the state.
24/7 Wall St. created an index of over three dozen socioeconomic measures to identify the best American city to live in each state.
Click here to see the best city to live in each state.
Click here to read our detailed findings and methodology.
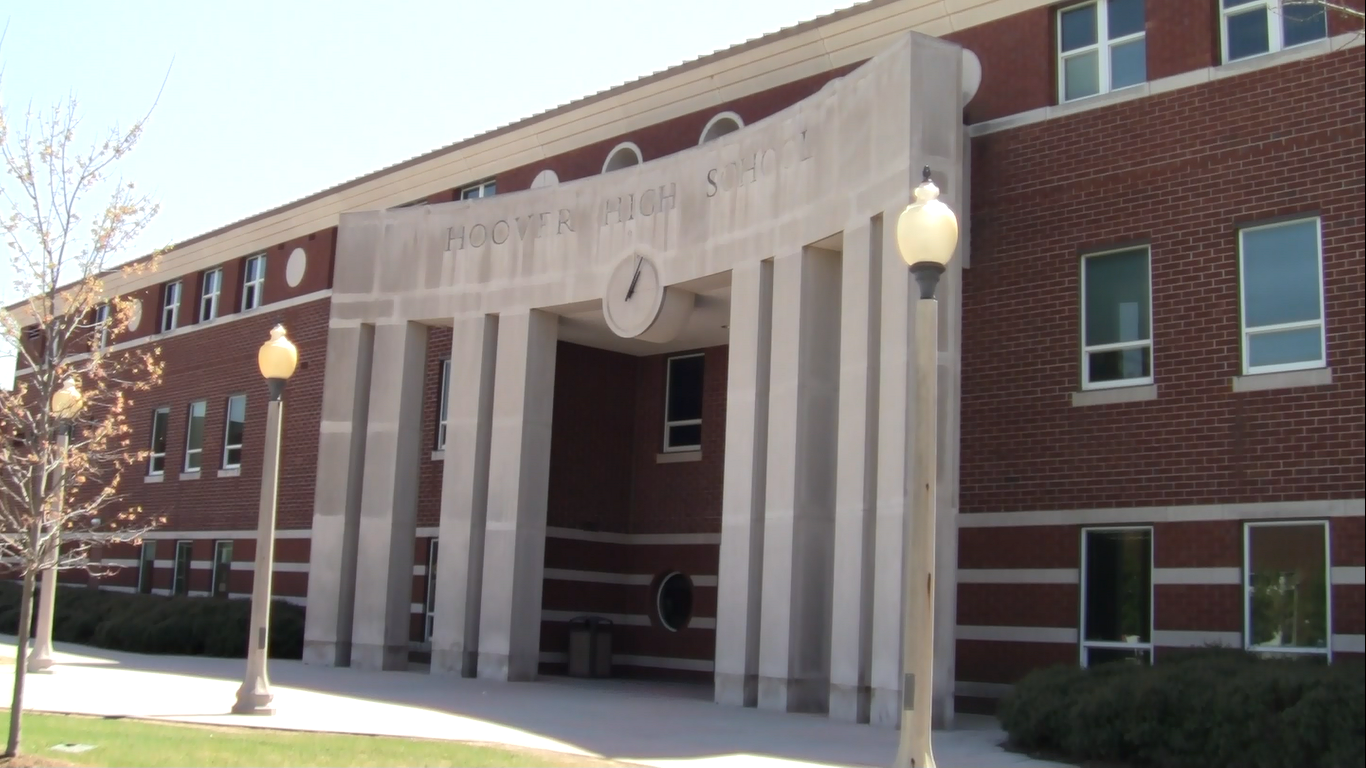
1. Alabama
> Best city to live: Hoover
> Population: 84,943
> Median home value: $278,600
> Poverty rate: 5.4% (lowest 10%)
> Adults with at least a bachelor’s degree: 57.7%
Hoover is not only one of the best places to live in Alabama, but also one of the best in the United States. A typical household in Hoover, the wealthiest city in Alabama, earns $79,004 a year, far more than the $57,617 a year the typical American household earns. Adjusted for the area’s low cost of living — goods and services cost 9 cents less on the dollar in the Hoover area than they do nationwide — the median household income in Hoover is higher than in all but 51 other cities. Just 5.4% of Hoover residents live in poverty, compared to 14.0% of Americans nationwide.
While population growth in nearby Birmingham has lagged far behind the national growth rate over the past decade, Hoover’s population growth has been much faster. At 17.0%, Hoover’s population growth rate between 2007 and 2016 was more than double the 7.1% national rate.
[in-text-ad]

2. Alaska
> Best city to live: Anchorage
> Population: 298,192
> Median home value: $320,800
> Poverty rate: 6.3% (lowest 25%)
> Adults with at least a bachelor’s degree: 36.5%
Anchorage is technically Alaska’s best city to live, but it is also the only city large enough to make our population cutoff. Still, Anchorage is by some measures one of the better places to live in the country. The city’s median household income of $85,634 is about $28,000 higher than the national median household income. Also, just 6.3% of city residents live in poverty, less than half the national poverty rate of 14.0%.
Still Anchorage is not without serious flaws. Notably, the city’s violent crime rate of 1,148 incidents per 100,000 residents, which is many times the national violent crime rate of 386 per 100,000 residents, is one of the higher rates of any city in the country.
[recirclink id=434202]

3. Arizona
> Best city to live: Gilbert
> Population: 237,120
> Median home value: $307,000
> Poverty rate: 5.0% (lowest 10%)
> Adults with at least a bachelor’s degree: 45.4% (highest 25%)
Gilbert is a town about 20 miles southeast of Phoenix, the largest city in Arizona. Many Gilbert residents hold advanced, high-paying jobs in Phoenix. The typical household in the town earns $91,576 a year, far more than the national median household income of $57,617. Commuters living in northern Gilbert might have access to additional transit options as soon as 2019, when the Valley Metro Rail completes the extension of its light rail service to an intersection just north of the city.
Like many of the best cities to live in, Gilbert’s population has grown at a rapid pace in recent years. The population has increased 11.9% since 2011, more than three times the nationwide population growth rate of 3.7%.
4. Arkansas
> Best city to live: Springdale
> Population: 81,799
> Median home value: $160,300
> Poverty rate: 15.6% (lowest 25%)
> Adults with at least a bachelor’s degree: 23.0%
Many of the most desirable communities in the United States are growing rapidly, and Springdale, Arkansas is no different. The city’s population expanded by 25.5% over the last decade, more than three times the comparable U.S. population growth.
A healthy economy may partially explain Springdale’s rapid growth. The city’s 2.7% annual unemployment rate is lower than both the U.S. unemployment rate of 4.9% and the statewide rate of 4.0%. For those employed in Springdale, incomes are about 7% higher than incomes across the state as a whole. A dollar also goes farther in Springdale than nationwide. Goods and services cost about 17% less in the city than they do across the United States as a whole.
[in-text-ad-2]
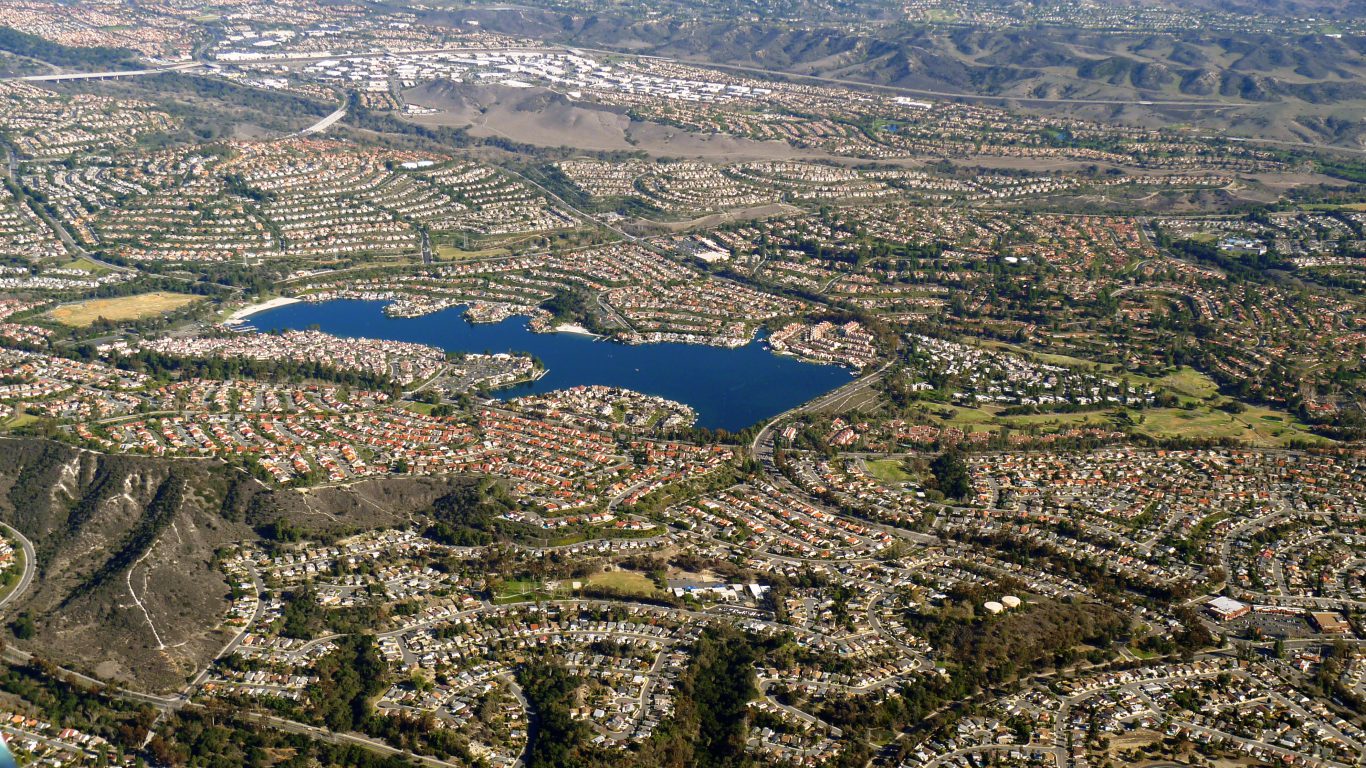
5. California
> Best city to live: Mission Viejo
> Population: 96,386
> Median home value: $667,100 (highest 25%)
> Poverty rate: 4.7% (lowest 10%)
> Adults with at least a bachelor’s degree: 49.7%
Mission Viejo, a major planned community in southern California’s Orange County, is the best city to live in the state and among the best cities to live nationwide. Area residents are largely untouched by crime. There were 78 violent crimes in the city for every 100,000 residents in 2016, far fewer than the 386 incidents per 100,000 Americans nationwide.
Living in Mission Viejo is not cheap, however. Goods and services in the area are on average 29.3% more expensive than they are nationwide. Still, the typical area household earns about $111,500 a year, more than enough to compensate for the higher living expenses.
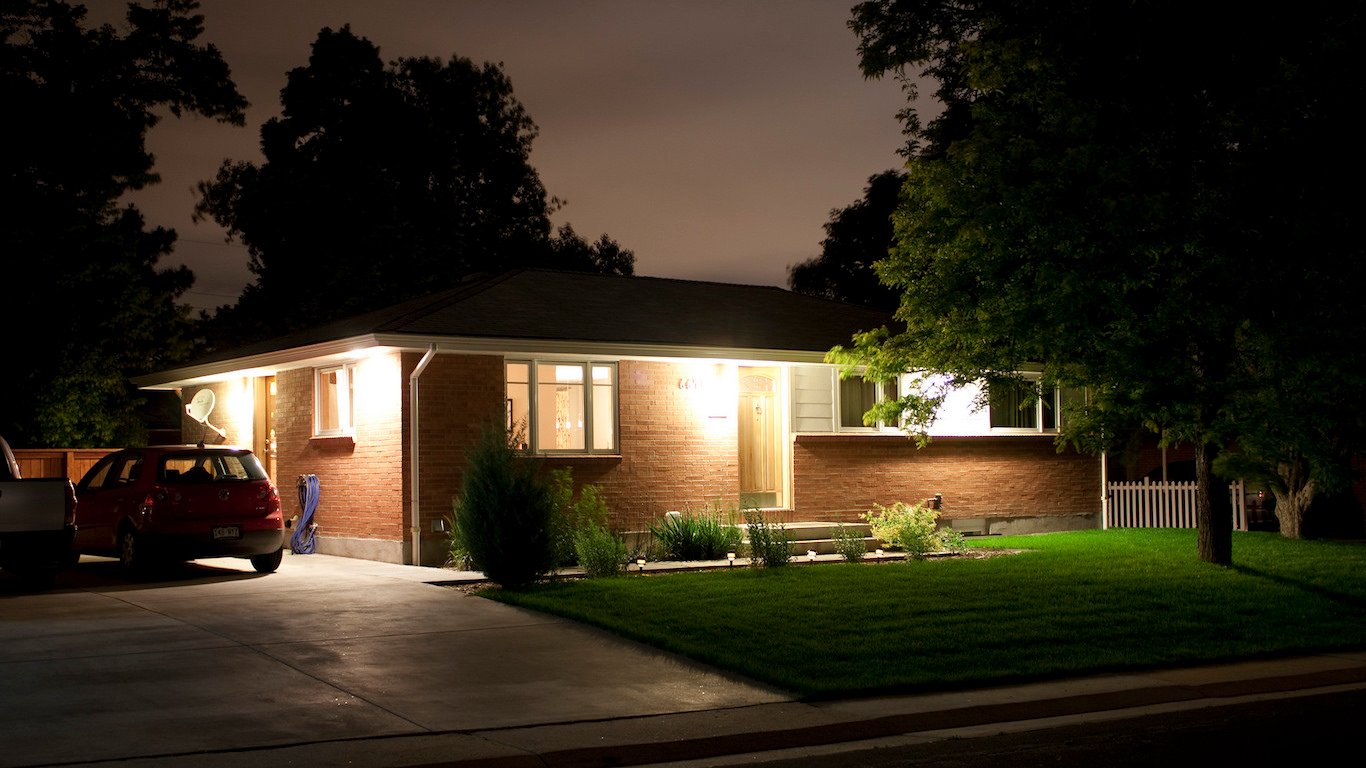
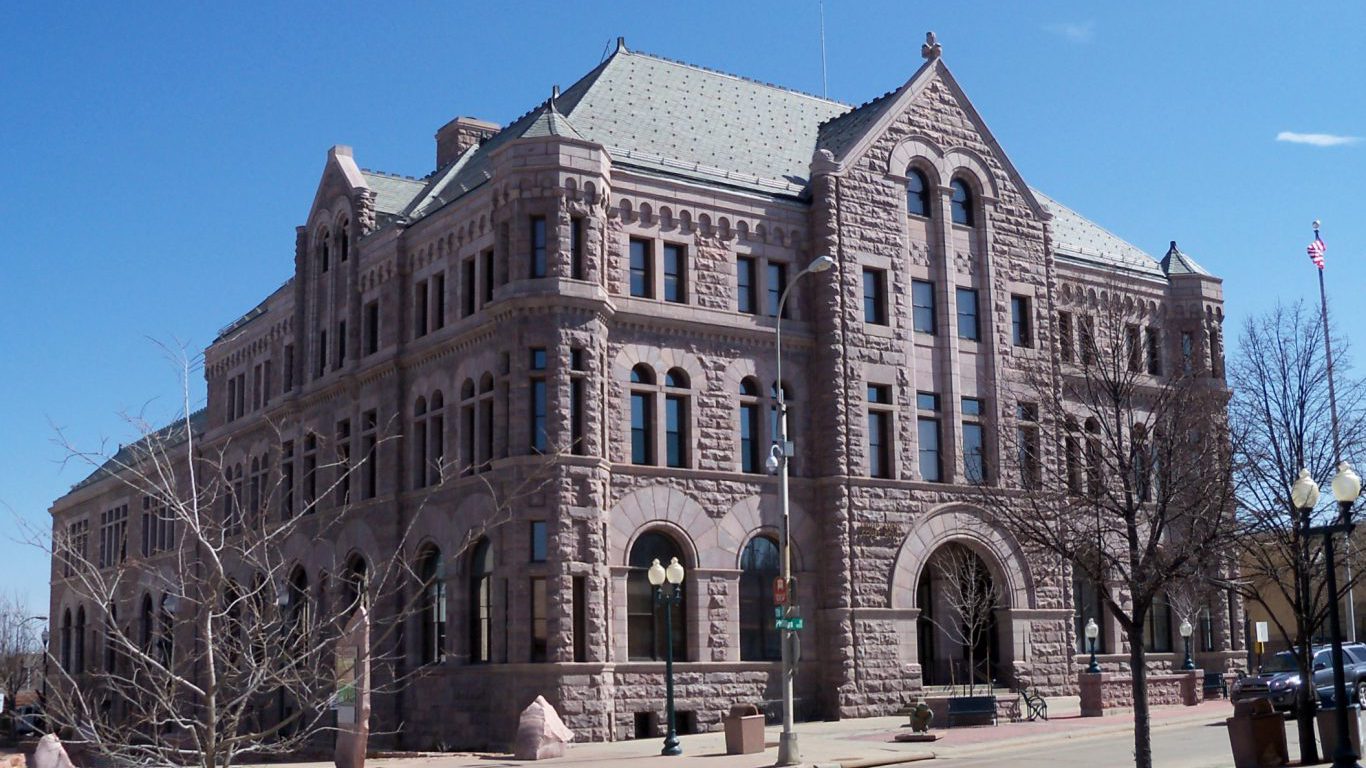
6. Colorado
> Best city to live: Centennial
> Population: 109,935
> Median home value: $393,200
> Poverty rate: 2.7% (lowest 10%)
> Adults with at least a bachelor’s degree: 55.3% (highest 25%)
Based on a range of socioeconomic measures, Centennial is the most livable city in Colorado and the second most livable in the country behind only Carmel, Indiana. The city is relatively new, only incorporating in 2001, and it has been growing at a healthy rate. The city’s population has increased by 7.1% in the last five years, nearly double the U.S. population growth rate over that time. A low cost of living and high incomes contribute to widespread prosperity in the area. The typical Centennial household earns $102,237 a year, and only 2.7% of the population lives in poverty. In comparison, the typical American household earns only $57,617 a year, and 14.0% of Americans live in poverty.
Centennial is also one of the safest cities in the United States. There were only 22 violent crimes for every 100,000 people in the city in 2016, a fraction of the U.S. violent crime rate of 386 incidents per 100,000 Americans.
[in-text-ad]

7. Connecticut
> Best city to live: Danbury
> Population: 85,008
> Median home value: $297,600
> Poverty rate: 8.9% (lowest 25%)
> Adults with at least a bachelor’s degree: 31.3%
Located in Fairfield County, Connecticut, Danbury is one of the most expensive places in the United States. Goods and services cost an average of 30.8% more in the area than they do nationwide. Though the median household income in Danbury is nearly $13,000 higher than it is nationwide, the bigger paychecks are not enough to offset the area’s high cost of living.
Despite the high cost of living, based on a range of socioeconomic measures, Danbury is the most livable city in Connecticut and one of the most livable in the United States. Danbury boasts a higher concentration of restaurants, sports teams, and theater companies than is typical nationwide. For physically active residents, the city also has a relatively high concentration of recreation centers, golf courses, and nature parks.
[recirclink id=434095]

8. Delaware
> Best city to live: Wilmington
> Population: 71,455
> Median home value: $145,600
> Poverty rate: 27.7% (highest 10%)
> Adults with at least a bachelor’s degree: 25.6%
As the only large city in Delaware, Wilmington technically ranks as the best city to live in the state. Based on most major socioeconomic measures, Wilmington is a less-than-ideal place to live, comparing poorly with the typical American city. For example, the city’s poverty rate of 27.7% is nearly double the national rate of 14%. Unemployment, often a major factor in poverty, is also a relatively high 6.4%, compared to the national annual unemployment rate of 4.9%.
Crime can have an impact not just on the direct victims, but also on entire neighborhoods by deterring business and contributing to greater stress among residents. Wilmington’s violent crime rate of 1,798 incidents per 100,000 residents is the fifth highest violent crime rate of any major city in the country.
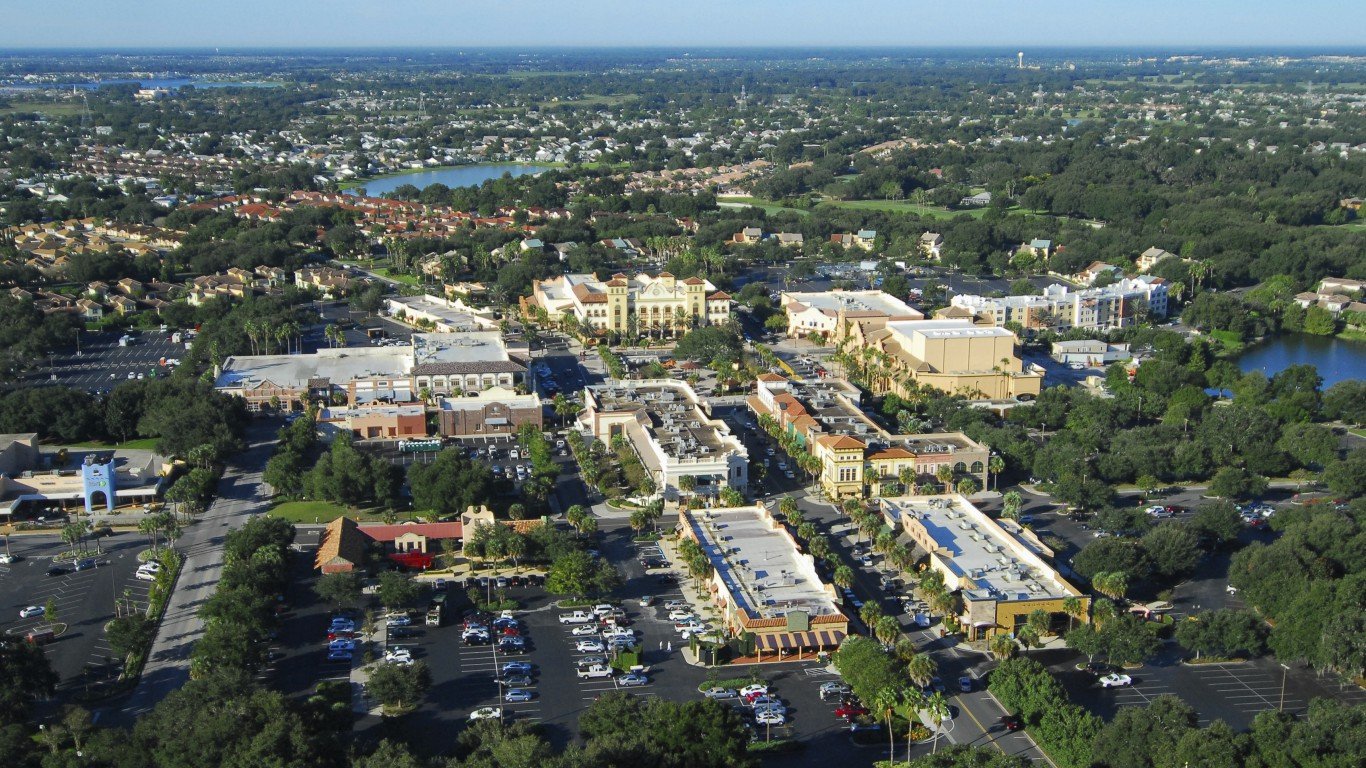
9. Florida
> Best city to live: The Villages
> Population: 71,350
> Median home value: $274,600
> Poverty rate: 5.8% (lowest 10%)
> Adults with at least a bachelor’s degree: 40.4% (highest 10%)
Several of the cities to make this list are planned communities. The Villages largely consists of the master-planned, age-restricted community by the same name. An estimated 91% of The Villages population is 60 years and older, The Villages’ elderly population enjoys nearly the highest quality of life of any city. Although more than half of households subsist on retirement income, the typical household earns $61,220 a year, or nearly $4,000 more than the national median household income. The community is also home to numerous amenities. It has more than twice as many nature parks per capita as the country as a whole and among the most golf courses per person of any city.
[in-text-ad-2]

10. Georgia
> Best city to live: Johns Creek
> Population: 83,884
> Median home value: $372,000
> Poverty rate: 4.9% (lowest 10%)
> Adults with at least a bachelor’s degree: 63.3% (highest 25%)
Education can have wide-reaching effects on the lives of individuals both in terms of financial prosperity and personal well-being. Johns Creek has one of the best-educated populations in the country. While 31% of U.S. adults have a bachelor’s degree, well over 60% of Johns Creek adults do. High schoolers in the city also have the highest average test scores of any city in Georgia.
Johns Creek residents also have access to a large number of amenities. The city has one of the highest concentrations of restaurants, recreational centers, and movie theaters in both Georgia and the United States as a whole.
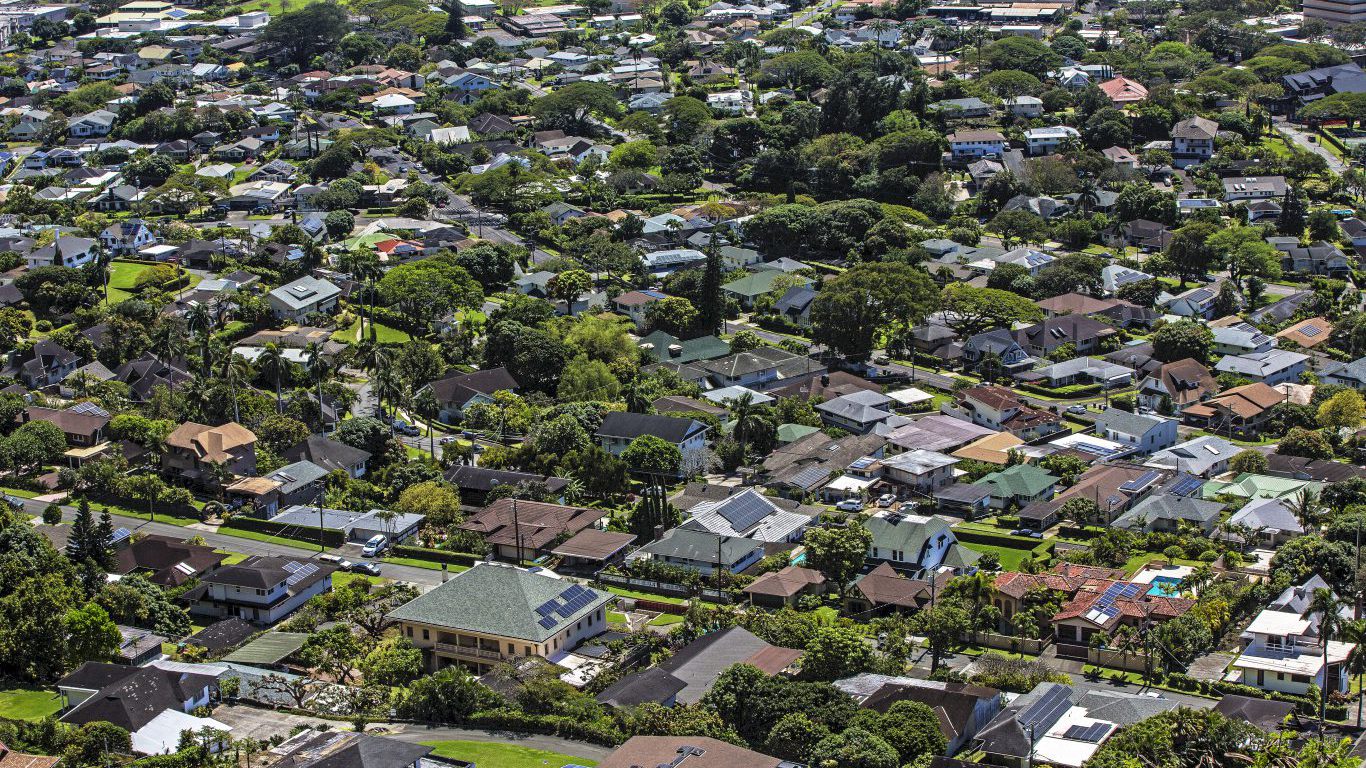
11. Hawaii
> Best city to live: East Honolulu
> Population: 47,957
> Median home value: $859,000
> Poverty rate: 3.7% (lowest 10%)
> Adults with at least a bachelor’s degree: 56.1% (highest 25%)
Hawaii residents enjoy a higher quality of life than a majority of states. Hawaii has the second lowest poverty rate among U.S. states at just 9.3% of residents, compared to the national poverty rate of 14.0%, and the state’s median household income of $74,511 a year is the fifth highest in the country. In East Honolulu, Hawaii’s best city to live in, conditions are even more favorable. The city’s poverty rate is just 3.7%, and the median household income is $114,122.
In addition to earning higher incomes, adults with a college degree are more likely to make healthy choices, have improved self-esteem, and report an overall higher quality of life. East Honolulu’s residents are among the most likely in the country to benefit from a college education, as 56.1% of adults have a bachelor’s degree, compared to the national bachelor’s attainment rate of 31.3%.
[in-text-ad]
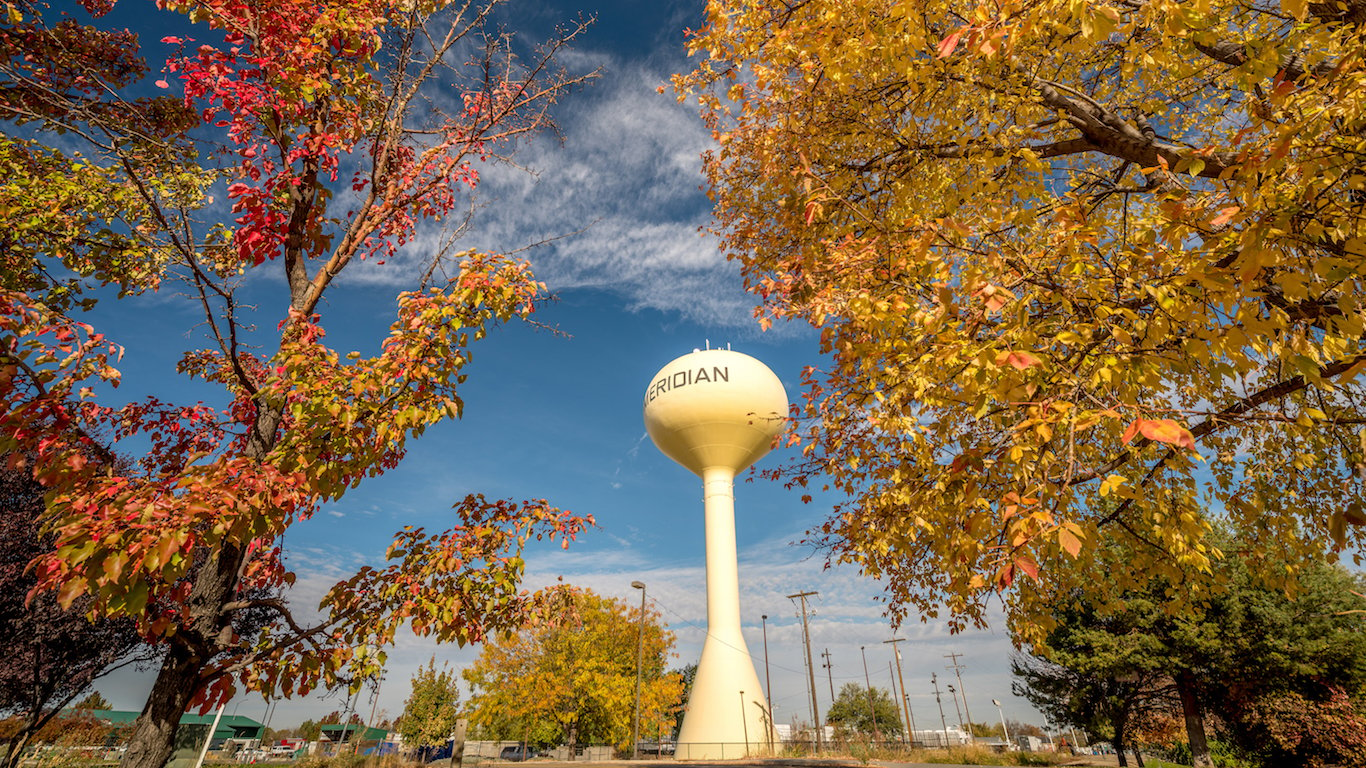
12. Idaho
> Best city to live: Meridian
> Population: 95,627
> Median home value: $236,200
> Poverty rate: 6.2% (lowest 10%)
> Adults with at least a bachelor’s degree: 36.7%
The population of Meridian, Idaho increased by 24.6% over the last five years — faster than in all but a handful of U.S. cities and many times faster than the U.S. population growth rate of 3.7% over the same period. Many new Meridian residents likely moved to the city for economic opportunities. Total employment in Meridian climbed 8.7% from 2014 through 2016, more than twice the comparable job growth rate nationwide. Also, only 3.3% of Meridian’s workers were out of a job as of 2016, compared to the 3.8% state and 4.9% national unemployment rates.
Rapid job growth and low unemployment are often characteristics of relatively safe places, and Meridian is no exception. The city’s violent crime rate of 110 incidents per 100,000 people is less than half the statewide rate and less than one third the U.S. violent crime rate.
[recirclink id=433891]

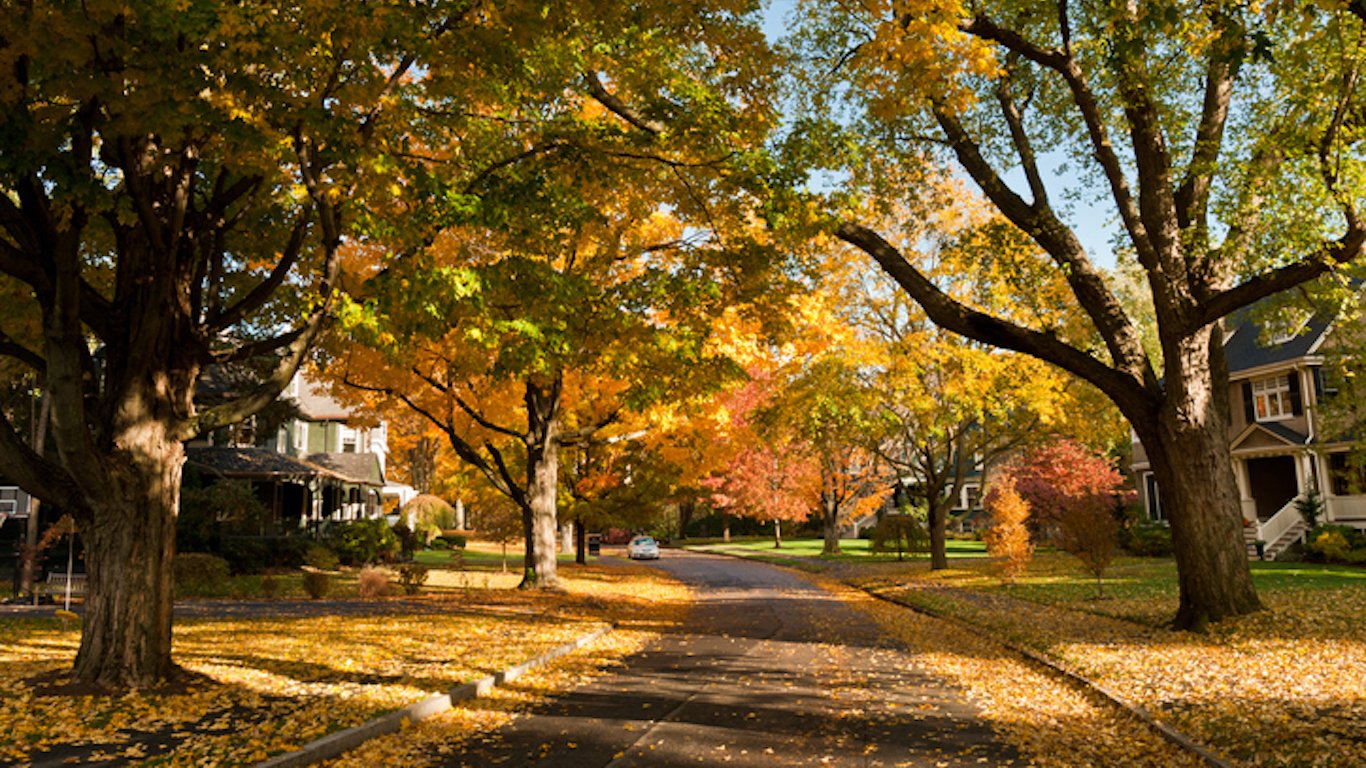
13. Illinois
> Best city to live: Naperville
> Population: 148,063
> Median home value: $421,400
> Poverty rate: 4.1% (lowest 10%)
> Adults with at least a bachelor’s degree: 69.2%
Naperville’s population is one of the most well educated of any U.S. city. Naperville high schoolers test better than students in any city in Illinois other than Arlington Heights, and 69.2% of adults have at least a bachelor’s degree — more than twice the 31.3% of adults nationwide with similar education. Many of the city’s most educated residents likely commute to high-paying jobs in neighboring Chicago. The typical Naperville household earns $116,482 a year, nearly the most of any city nationwide.
Naperville is largely free of the violent crime that plagues much of the Chicago metro area. There were just 62 violent crimes reported per 100,000 residents in Naperville in 2016, far less than the national rate of 386 incidents per 100,000 Americans and among the least of any U.S. city.
14. Indiana
> Best city to live: Carmel
> Population: 90,533
> Median home value: $315,200 (highest 25%)
> Poverty rate: 3.9% (lowest 10%)
> Adults with at least a bachelor’s degree: 69.7% (highest 25%)
According to 24/7 Wall St.’s analysis, there is no better city to live in the United States than Carmel, Indiana. People who live there are healthy, wealthy, and well educated — almost 70% of the adult population has a bachelor’s degree. Carmel is also one of the safest places in the country. Nationally, there are 386 violent crimes and 2,451 property crimes reported for every 100,000 Americans annually. In Carmel, there are just 28 violent crimes and 887 property crimes per 100,000 people.
Carmel is also relatively inexpensive, making the already high incomes of its residents go even further. The typical household earns $113,194 per year, and because goods and services cost only about 90 cents on the dollar in Carmel compared to the national average, the effective median household income is equivalent to more than $125,000 when adjusted for cost of living.
[in-text-ad-2]
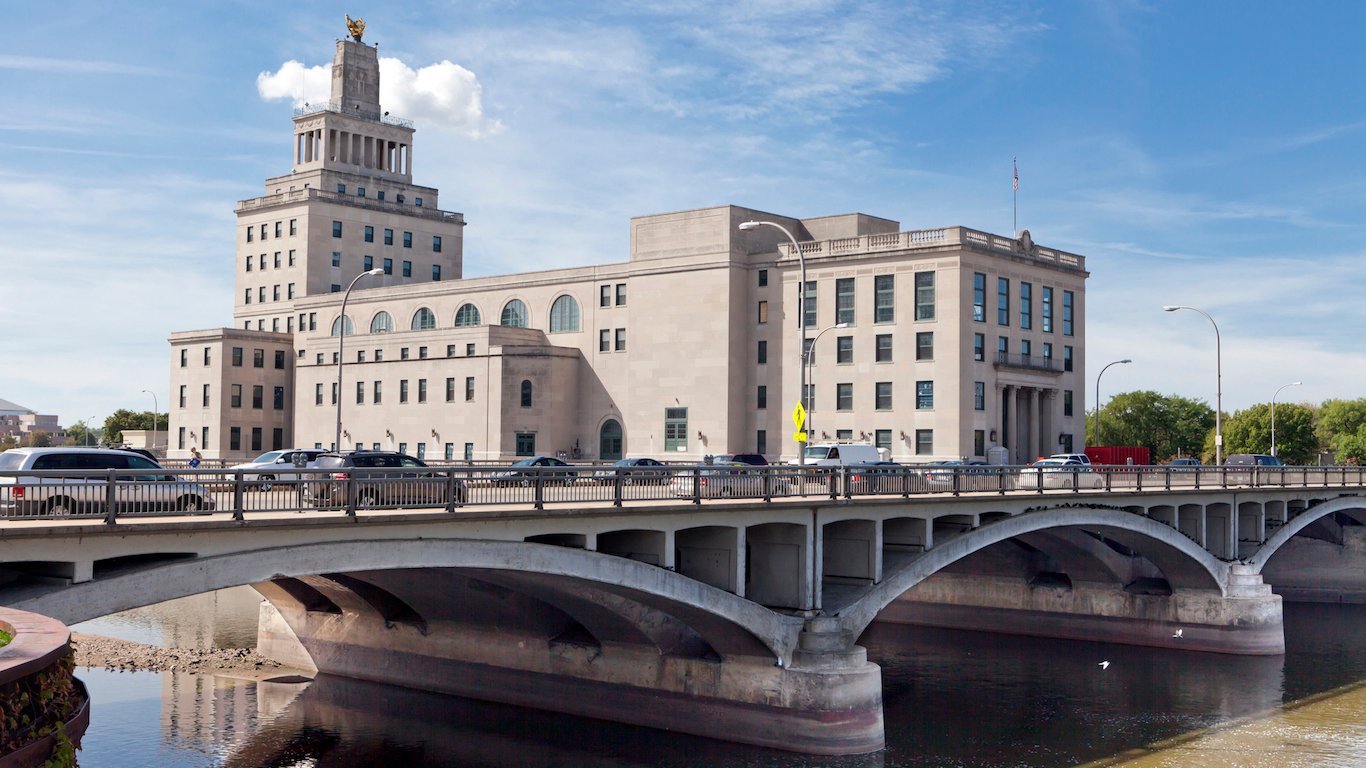
15. Iowa
> Best city to live: Cedar Rapids
> Population: 131,118
> Median home value: $137,900
> Poverty rate: 11.9%
> Adults with at least a bachelor’s degree: 35.5%
One major reason that Cedar Rapids ranks as the best place to live in Iowa is the large incomes of area residents. At $57,135 a year, the median household income in Cedar Rapids is at least $7,500 more than any other major city in Iowa. The city’s poverty rate of 11.9% is also the lowest in the state.
Not only does the Cedar Rapids population make more money residents of any other city in the state, but they also get more bang for their buck, as the cost of living as a whole is well below that of the nation. The cost of transportation and utilities in Cedar Rapids is less than anywhere else in Iowa and ranks near the bottom of all U.S. cities.

16. Kansas
> Best city to live: Olathe
> Population: 135,474
> Median home value: $217,300
> Poverty rate: 5.6% (lowest 10%)
> Adults with at least a bachelor’s degree: 49.6%
Poverty is relatively uncommon in Olathe, Kansas. Only 5.6% of city residents live below the poverty line — less than half the statewide poverty rate of 12.1%. The area’s relative financial security is likely due in part to a strong job market. Only 3.2% of the Olathe workforce is out of a job, well below the 4.2% state unemployment rate and the 4.9% national rate.
The city is also far more affordable than most. The value of the typical home in Olathe is only 2.6 times as high as the area’s median household income. Nationwide, the typical home is worth 3.6 times the typical income.
[in-text-ad]
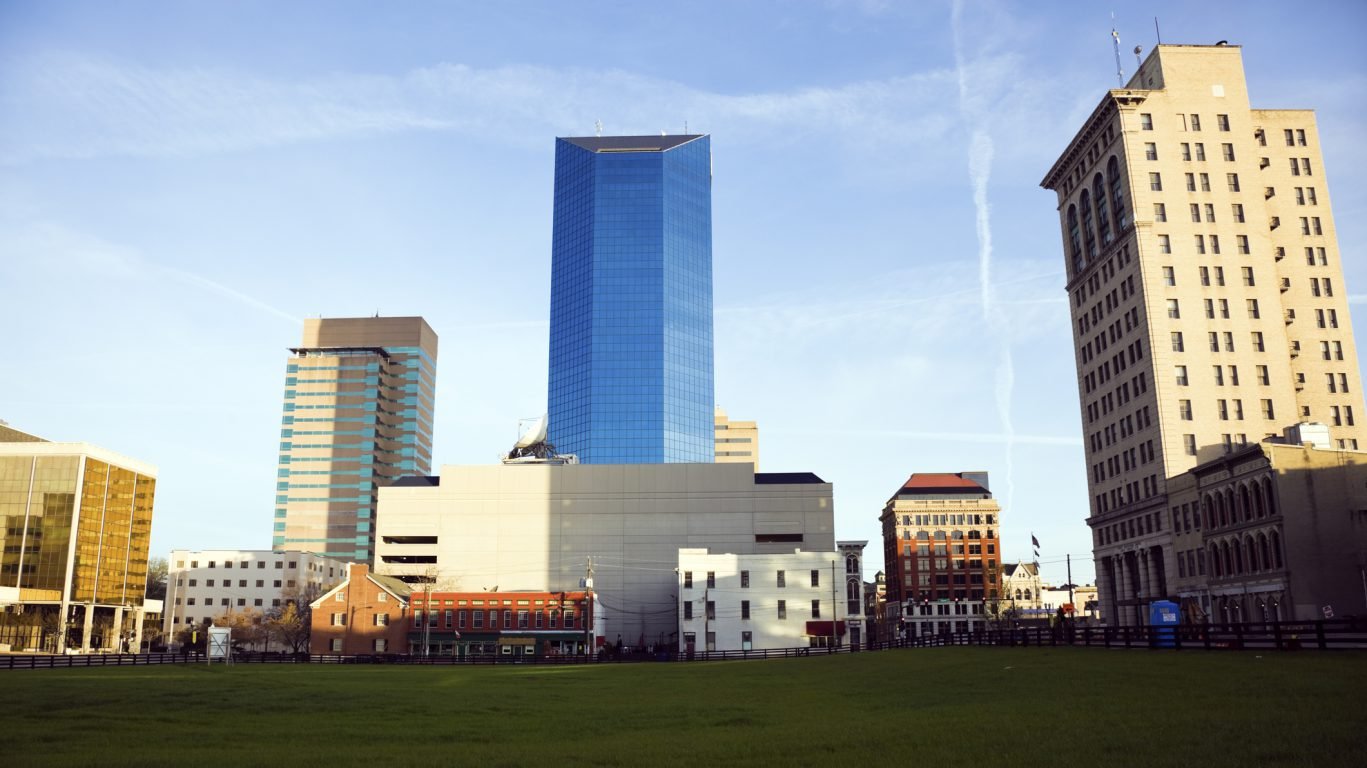
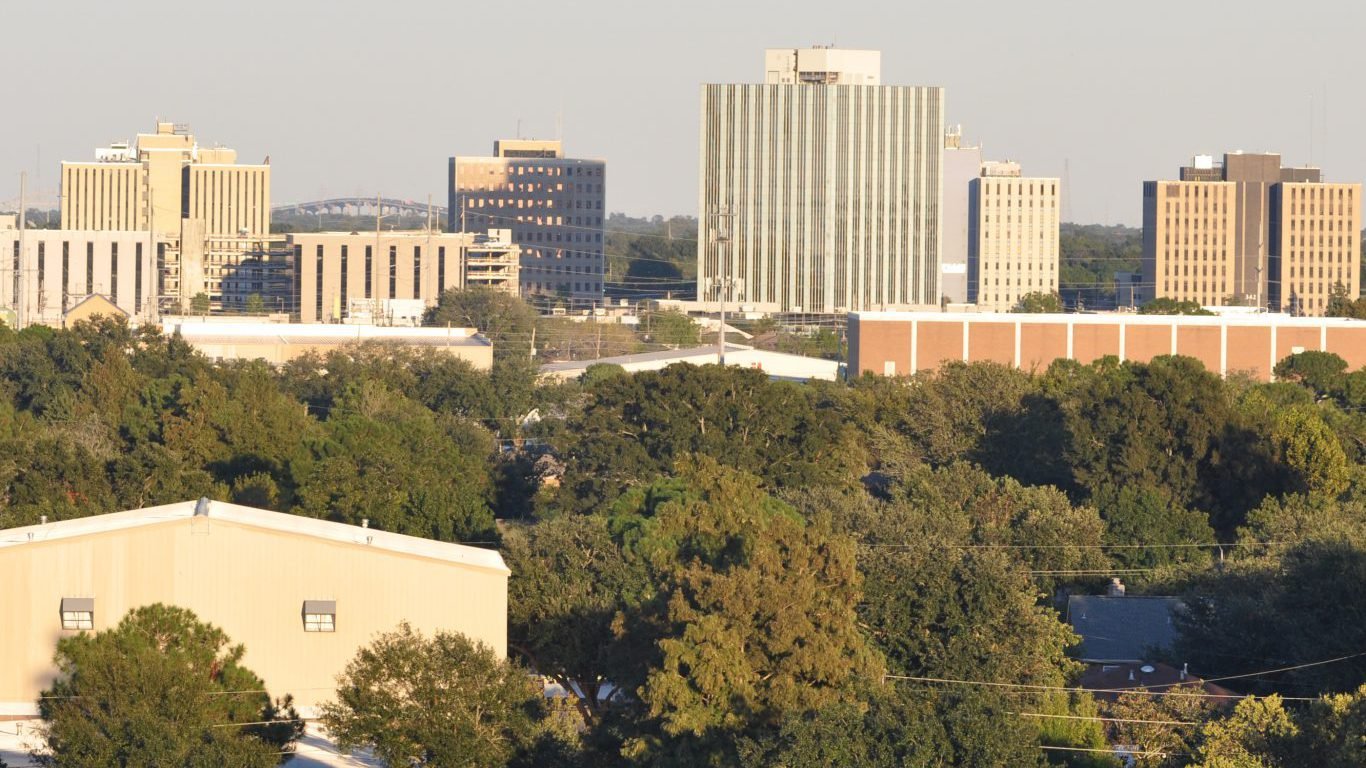
17. Kentucky
> Best city to live: Lexington-Fayette
> Population: 318,449
> Median home value: $181,200 (lowest 25%)
> Poverty rate: 17.7%
> Adults with at least a bachelor’s degree: 43.7% (lowest 25%)
Many of the best cities to live in are college towns. Lexington is home to the University of Kentucky, the largest postsecondary institution in the state.
In 1958, the City of Lexington instituted the first urban growth boundary in the United States in order to limit sprawl development and preserve the city’s outlying farmland. The boundary has helped preserve the area’s numerous thoroughbred horse farms and create a culture of horse racing and equestrian events. Today, Lexington is home to two horse racing tracks, and economic activities related to horses generate approximately $4 billion in the area annually. The city’s median household income of $53,178 per year is below the national median of $57,617, yet is the highest of any major city in Kentucky.
[recirclink id=433818]
18. Louisiana
> Best city to live: Metairie
> Population: 143,475
> Median home value: $231,100
> Poverty rate: 9.6%
> Adults with at least a bachelor’s degree: 37.1%
One of the poorest states in the country, Louisiana’s poverty rate of 20.2% is the highest of any state other than Mississippi. However, serious financial hardship is far less common in some parts of the state. In Metairie, the most liveable city in the state and one of the most liveable cities in the United States, the 9.6% poverty rate is less than half the statewide rate and far below the 14.0% national figure.
For those with disposable income in Metairie, the city boasts a dense concentration of cultural amenities and entertainment venues. There is a greater concentration of restaurants, bars, fitness centers, and sports teams in Metairie than is typical nationwide.

19. Maine
> Best city to live: Portland
> Population: 66,945
> Median home value: $280,600
> Poverty rate: 18.9%
> Adults with at least a bachelor’s degree: 49.6%
Portland is the only city in Maine with a population large enough to be considered, so it ranks as the best city to live in the state by default. The city still has a lot going for it. A estimated 49.6% of adults in the city hold at least a bachelor’s degree, a much higher rate than the comparable national attainment rate of 31.3% — Portland ranks in the top 100 most educated U.S. cities.
The area is also one of the safest in the United States in terms of natural disasters. Portland’s county, Cumberland, is one of the least likely in the country to be hit by a natural disaster like an earthquake, tornado, or hurricane. The county also has some of the best air quality in the nation with fewer than 3% of days considered to have hazardous air.
[in-text-ad-2]

20. Maryland
> Best city to live: Columbia
> Population: 107,308
> Median home value: $371,400 (highest 25%)
> Poverty rate: 6.5% (lowest 10%)
> Adults with at least a bachelor’s degree: 63.2% (highest 10%)
Cities like Columbia are largely the reason Maryland is the wealthiest state in the country. The typical Columbia household earns $107,164 a year — well above the median income nationwide of $57,617. As is the case in many of the best cities in the country, goods and services are considerably more expensive in Columbia than they are on average nationwide. Still, even adjusted for the area’s high cost of living, incomes in Columbia are higher than national cost of living-adjusted incomes.
Columbia residents have access to plenty of cultural amenities and entertainment venues. The city has a higher concentration of restaurants, theater companies, and movie theaters than is typical nationwide. Like many cities on this list, Columbia’s population is growing rapidly. The city’s population climbed by about 15% in the last 10 years, more than double the U.S. population growth rate over the same period.
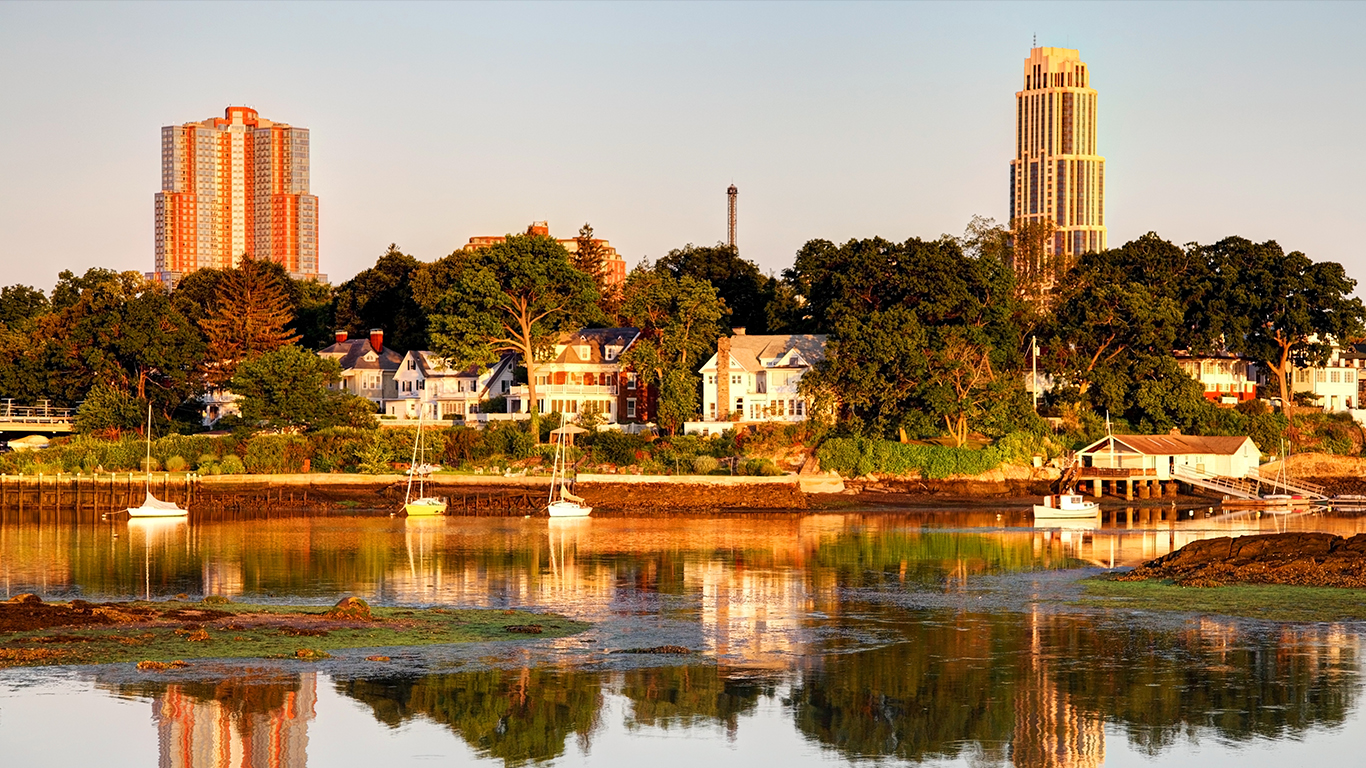
21. Massachusetts
> Best city to live: Newton
> Population: 89,041
> Median home value: $884,000
> Poverty rate: 4.1% (lowest 10%)
> Adults with at least a bachelor’s degree: 76.6% (highest 10%)
Newton, Massachusetts is not just the wealthiest city in the state, but also it is one of the richest in the nation. The median household income in Newton of $135,646 a year is third highest of U.S. cities and more than $40,000 higher than in Somerville, the next most affluent city in Massachusetts. Only 4.1% of Newton residents live in poverty, well below the state’s 10.4% poverty rate.
Newton is also one of the safest cities in the country. There were just 52 violent crimes per 100,000 residents in 2016, which is a fraction of the national rate of 386 violent crimes per 100,000 people. The city also has nearly the lowest property crime rate in the nation.
[in-text-ad]
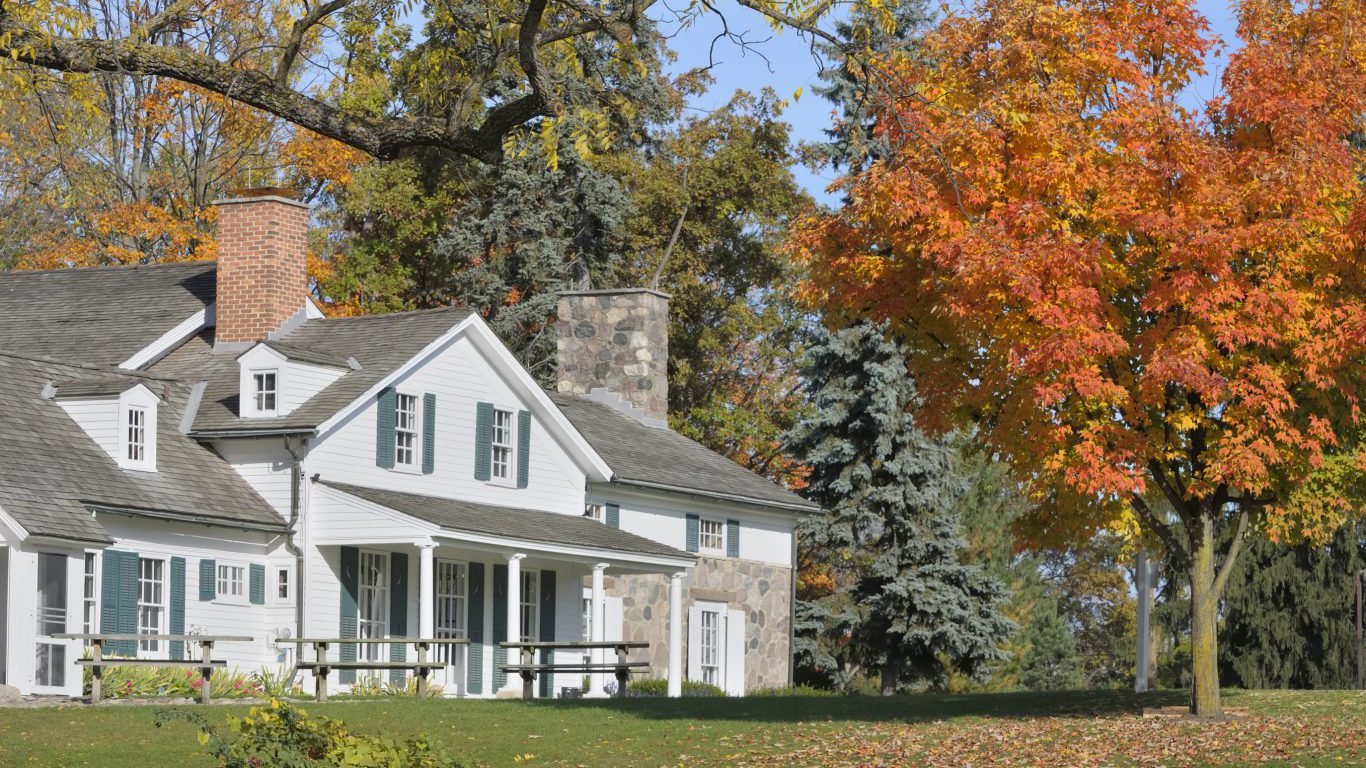
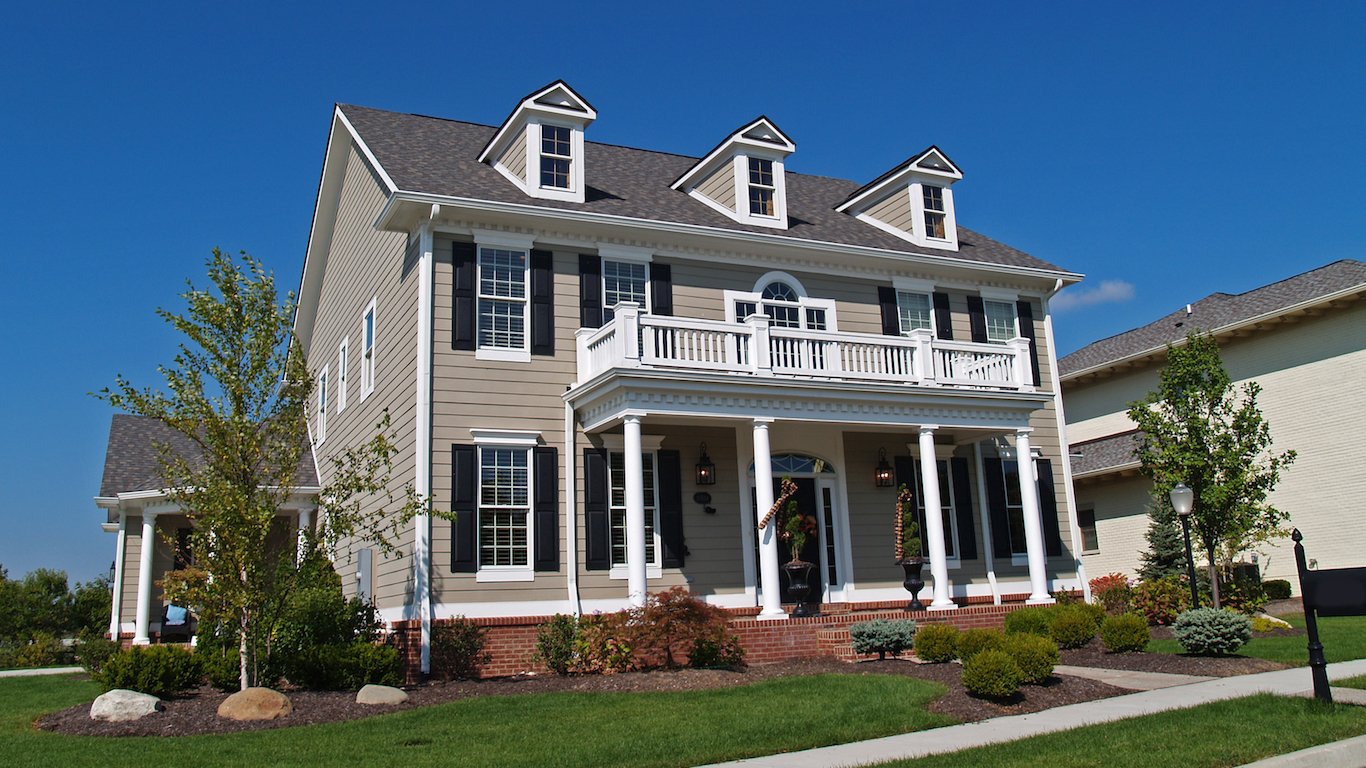
22. Michigan
> Best city to live: Rochester Hills
> Population: 73,418
> Median home value: $294,200 (highest 25%)
> Poverty rate: 6.0% (lowest 10%)
> Adults with at least a bachelor’s degree: 57.3%
One of the best indicators of quality of life is education. High school students in Rochester Hills test better than students in any city in Michigan other than Troy and Ann Arbor, and 57.3% of adults have at least a bachelor’s degree — far more than the 31.3% of adults nationwide.
Rochester HIlls is also largely free of the violent crime that plagues much of the Detroit metro area. There were 72 violent crimes reported per 100,000 residents in 2016, a fraction of the national violent crime rate of 386 incidents reported per 100,000 Americans. While in neighboring Detroit crime and economic decline have reduced the value of a typical home from $91,700 in 2006 to $43,500 today, homes in Rochester Hills have continued to appreciate. The typical home in the city is worth $294,200 today, an increase of $15,000 from 10 years ago and nearly $90,000 more than the U.S. median home value.
[recirclink id=433549]
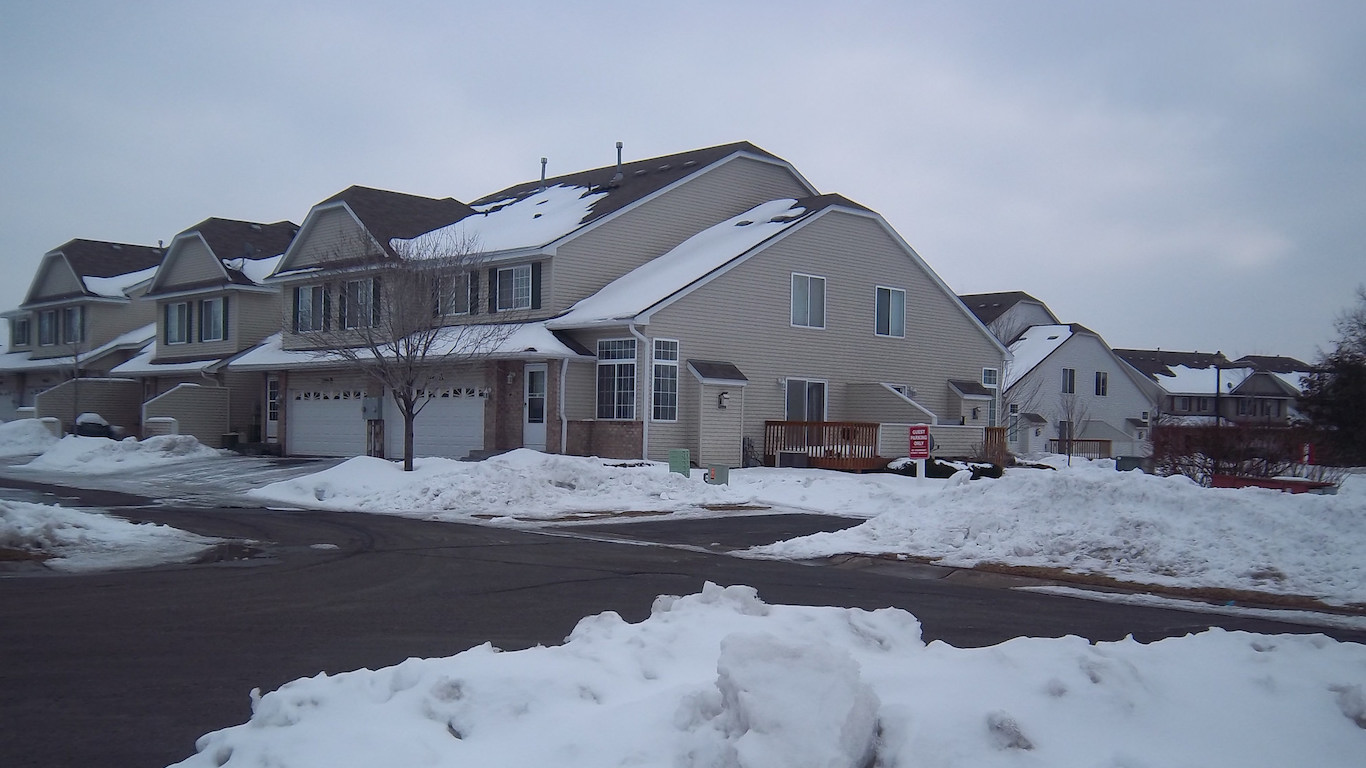
23. Minnesota
> Best city to live: Woodbury
> Population: 66,699
> Median home value: $314,700
> Poverty rate: 2.3% (lowest 10%)
> Adults with at least a bachelor’s degree: 57.6% (highest 25%)
Woodbury has less poverty and unemployment than nearly any other large U.S. city. Just 2.3% of city residents live in poverty, the second smallest share in the United States. The typical household in the city earns $103,902 a year, the second highest median income in the state — behind Maple Grove — and one of the highest in the country.
The Woodbury unemployment rate of 3.0% is far lower than the national jobless rate of 4.9%. Woodbury also has one of the best educated populations of U.S. cities. High schoolers in Woodbury test better than students in any other city in Minnesota, and 57.6% of adults have at least a bachelor’s degree — far more than the 31.3% national rate.
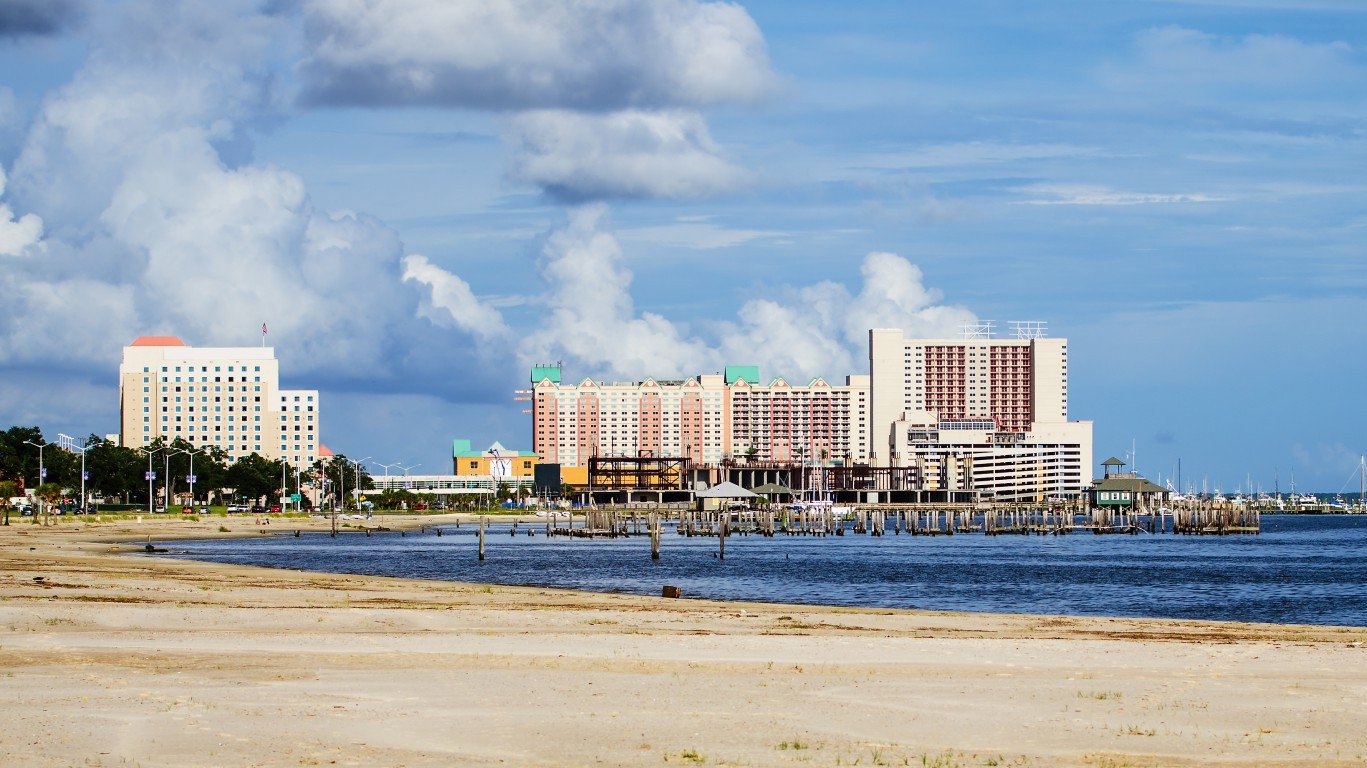
24. Mississippi
> Best city to live: Gulfport
> Population: 72,077
> Median home value: $118,100
> Poverty rate: 19.2%
> Adults with at least a bachelor’s degree: 22.7% (highest 25%)
Mississippi ranks among the worst U.S. states in many socioeconomic measures, and even the state’s best city to live in, Gulfport, does not fare much better. Some 19.2% of Gulfport residents live in poverty — the lowest of any city in the state but only slightly better than Mississippi’s poverty rate of 20.8%. Still, Gulfport’s poverty rate is much higher than the national rate of 14.0%.
Gulfport still has its upsides, though. The city’s violent crime rate of 316 incidents per 100,000 residents is lower than the national rate of 386 incidents per 100,000.
[in-text-ad-2]

25. Missouri
> Best city to live: O’Fallon
> Population: 86,276
> Median home value: $224,400 (highest 10%)
> Poverty rate: 3.3% (lowest 10%)
> Adults with at least a bachelor’s degree: 43.0% (highest 10%)
O’Fallon is one of the best places to live in the Midwest and in the country as a whole. In addition to the residents’ relatively high incomes, the city is also relatively affordable. The typical household in O’Fallon earns approximately $85,000 annually. When adjusted for the area’s low cost of living, the value of the median household income is even higher at nearly $90,000.
O’Fallon’s poverty rate is not only the lowest in Missouri, but also near the bottom of all U.S. cities. Just 3.3% of its residents live below the poverty live, several times lower than the 14.0% poverty rate shared by both Missouri’s and the U.S.
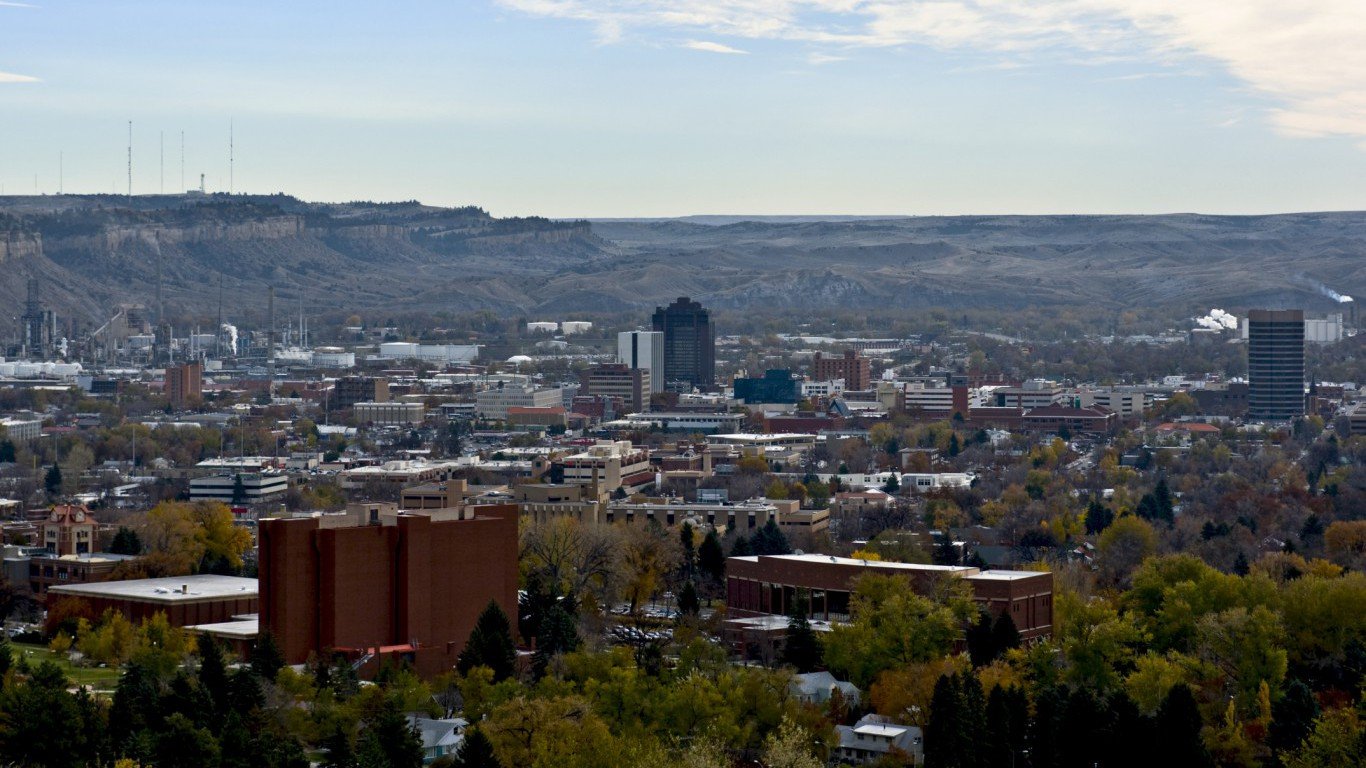
26. Montana
> Best city to live: Billings
> Population: 110,314
> Median home value: $215,500
> Poverty rate: 8.6% (lowest 25%)
> Adults with at least a bachelor’s degree: 33.7%
Residents of Billings, Montana are much less likely to be jobless or live in poverty than anywhere else in the state. Just 8.6% of people in Billings live in poverty, compared to 13.3% of people the state. Also, the city’s unemployment rate of 3.5% is lower than Montana’s 4.1% annual unemployment rate.
People in Yellowstone County, where Billings resides, also spend less on utilities than almost anywhere else in the United States. In Yellowstone County, people spend just 65.9 cents on utilities per dollar spent by the average American.
[in-text-ad]
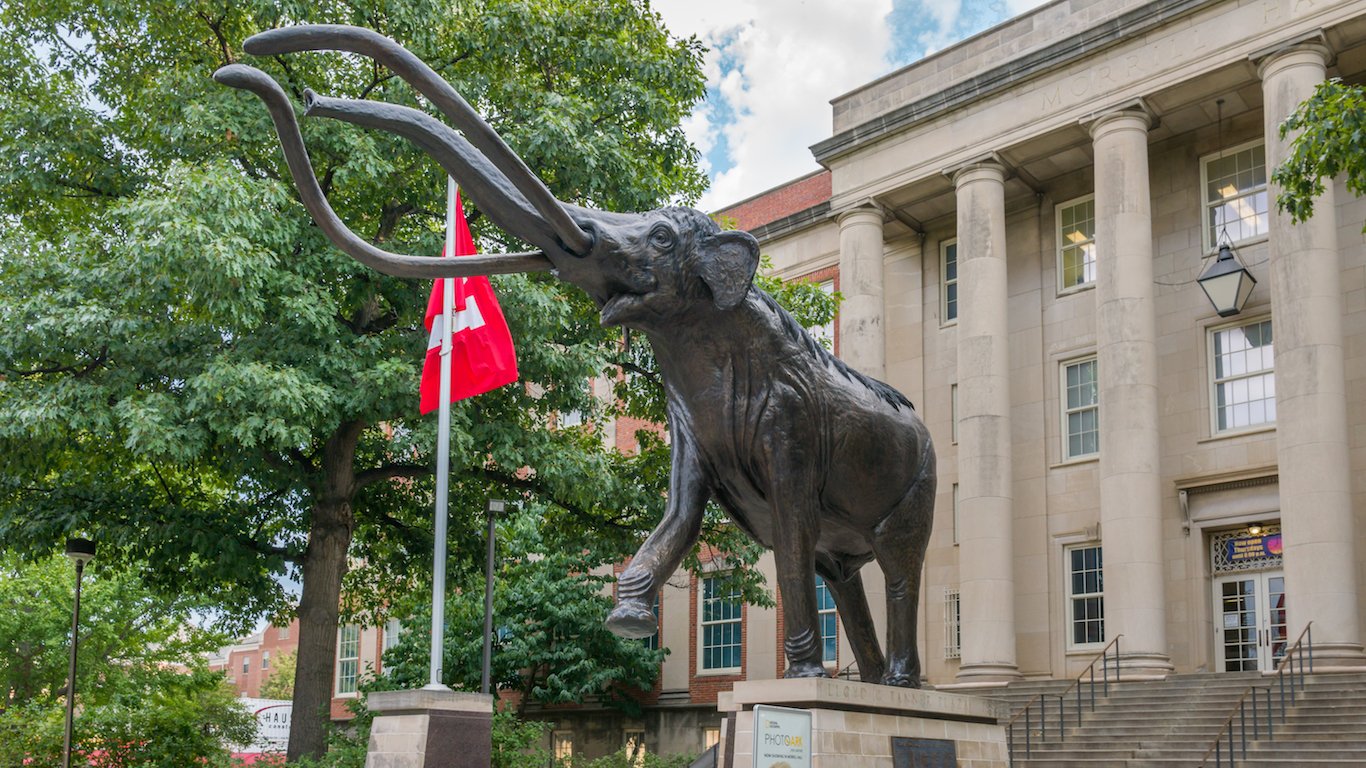
27. Nebraska
> Best city to live: Lincoln
> Population: 280,369
> Median home value: $160,600 (lowest 25%)
> Poverty rate: 13.7%
> Adults with at least a bachelor’s degree: 40.3%
Nebraska’s unemployment rate of just 3.2% is one lowest in the nation. In Lincoln, Nebraska’s capital city, the labor market is doing even better — just 2.8% of the city’s labor force is unemployed. Lincoln is also home to the University of Nebraska, which could explain why more than 40% of the city’s adults have a college degree. Nationwide, 31.3% of American adults have a bachelor’s degree.
Lincoln’s violent crime rate of 359 incidents per 100,000 residents is higher than Nebraska’s violent crime rate of 291 incidents per 100,000 people. However, in Nebraska’s only other qualifying city, Omaha, the violent crime rate is well above Lincoln’s at 566 incidents per 100,000 residents.
[recirclink id=432660]

28. Nevada
> Best city to live: Enterprise
> Population: 139,509
> Median home value: $269,000
> Poverty rate: 7.8% (lowest 25%)
> Adults with at least a bachelor’s degree: 29.2%
With an 80% population growth in the last 10 years, Enterprise, Nevada is the second fastest growing city in the United States. Several factors may have contributed to the city attracting so many new residents. The city is slightly less expensive the nation as a whole and both housing and health care cost about 6% less than the average comparable costs nationwide.
Poverty is also relatively low in Enterprise. The city’s 7.8% poverty rate is the lowest among Nevada’s larger cities and well below the 13.8% state rate.
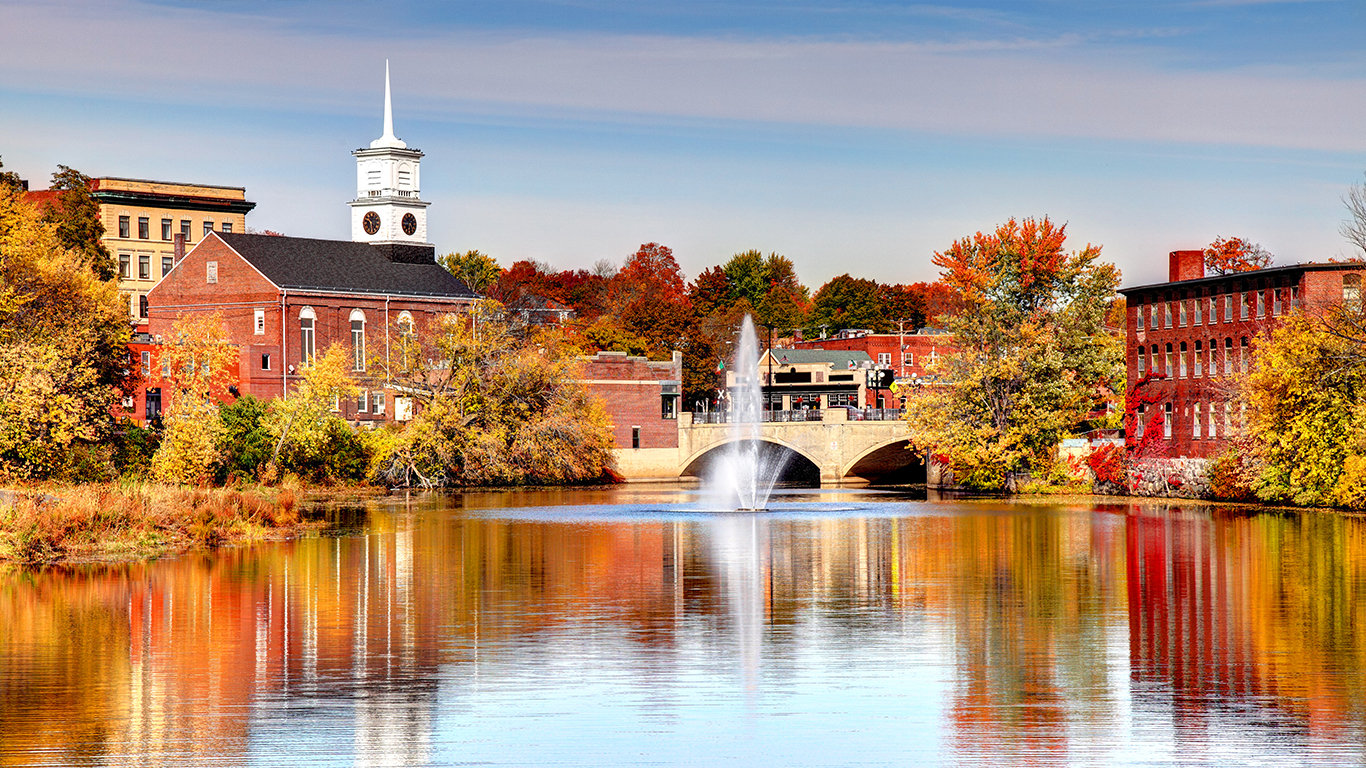
29. New Hampshire
> Best city to live: Nashua
> Population: 87,889
> Median home value: $256,800 (highest 25%)
> Poverty rate: 9.1% (lowest 25%)
> Adults with at least a bachelor’s degree: 31.3% (highest 25%)
Residents of Nashua, New Hampshire benefit from a strong economy and a high concentration of cultural amenities and entertainment venues. For example, only 3.3% of the local labor force is out of work, well below the 4.9% annual U.S. unemployment rate. And many workers are also well compensated. The typical area household earns $69,769 a year, which is over $12,000 more than the typical American household but still below the state’s median income of $70,936.
Nashua residents have plenty of options when it comes to spending their disposable income. There are 223 restaurants and cafes for every 100,000 residents — far more than the typical concentration nationwide.
[in-text-ad-2]

30. New Jersey
> Best city to live: Clifton
> Population: 85,847
> Median home value: $345,100
> Poverty rate: 8.6% (lowest 25%)
> Adults with at least a bachelor’s degree: 34.1%
Many of the best cities to live in the United States are relatively expensive, and Clifton, New Jersey is no exception. The cost of living in the city is about 28% higher than it is nationwide. However, the area’s expensive goods and services are largely offset by high incomes. The typical area household earns $77,923 a year — about $20,300 more than the median income nationwide. As is the case in many of the most livable American cities, serious financial hardship is relatively uncommon in Clifton. Only 8.6% of area residents live below the poverty line, below both the statewide poverty rate of 10.4% and the U.S. rate of 14.0%.
A part of the New York City metro area, Clifton residents have easy access to the cultural amenities of the country’s largest city, including easy access to transportation. The New York metro area boasts the most airports and the nation’s highest public transit usage rate.
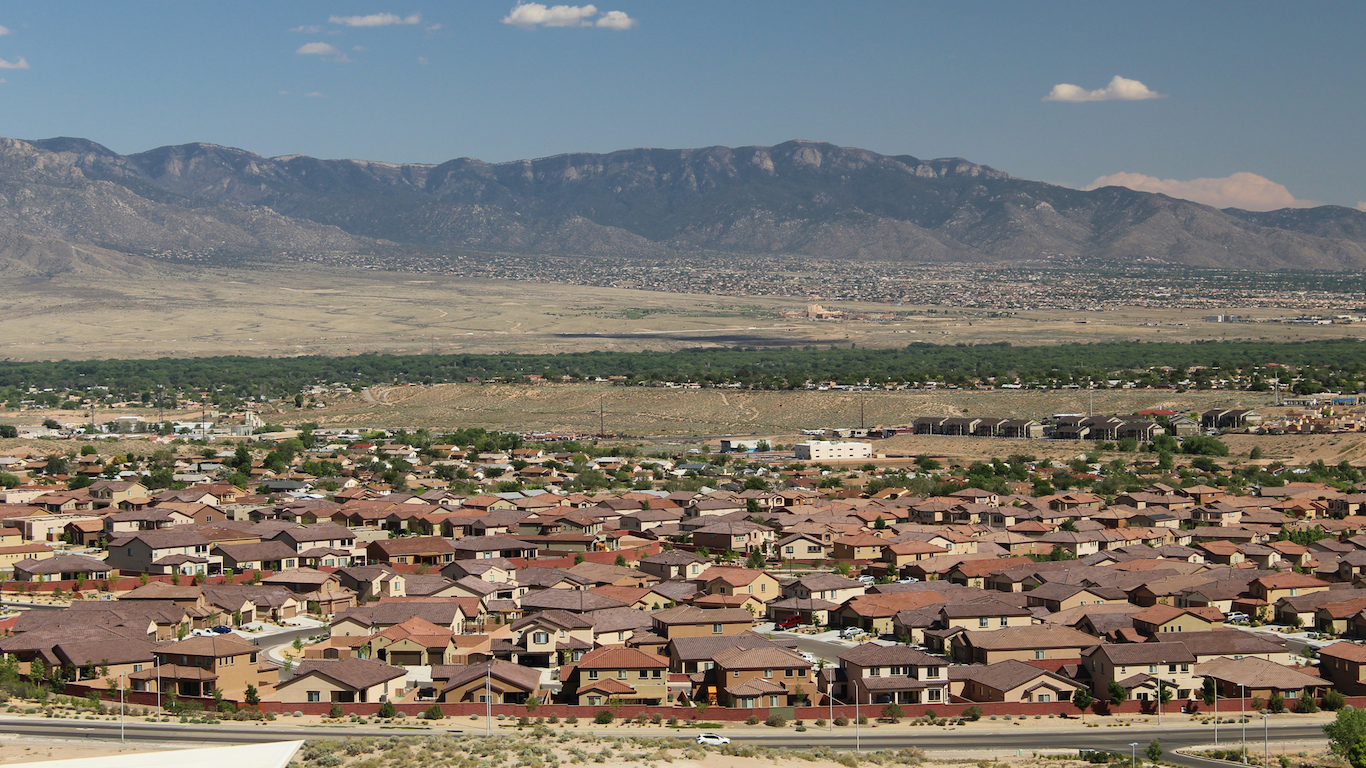
31. New Mexico
> Best city to live: Rio Rancho
> Population: 96,022
> Median home value: $178,100 (highest 25%)
> Poverty rate: 13.6%
> Adults with at least a bachelor’s degree: 33.8% (highest 25%)
Crime can have an impact not just on the immediate victims, but also on entire neighborhoods by deterring business and contributing to greater stress levels among residents. New Mexico has one of the highest violent crime rates of U.S. states, with 703 incidents per 100,000 residents. Compared to the state, Rio Rancho is relatively safe. It has just 224 violent crimes per 100,000 people, the lowest rate in the state.
New Mexico also has a very high poverty rate at 19.8%. Rio Rancho’s poverty rate of 13.6% is well below the state rate and slightly below U.S. rate of 14.0%. The city’s median household income of $60,979 per year is also much higher than any other city in New Mexico. The city with the next highest median income is Santa Fe, where the typical household has an income of $51,347 a year. The median annual household income statewide is $46,748.
[in-text-ad]
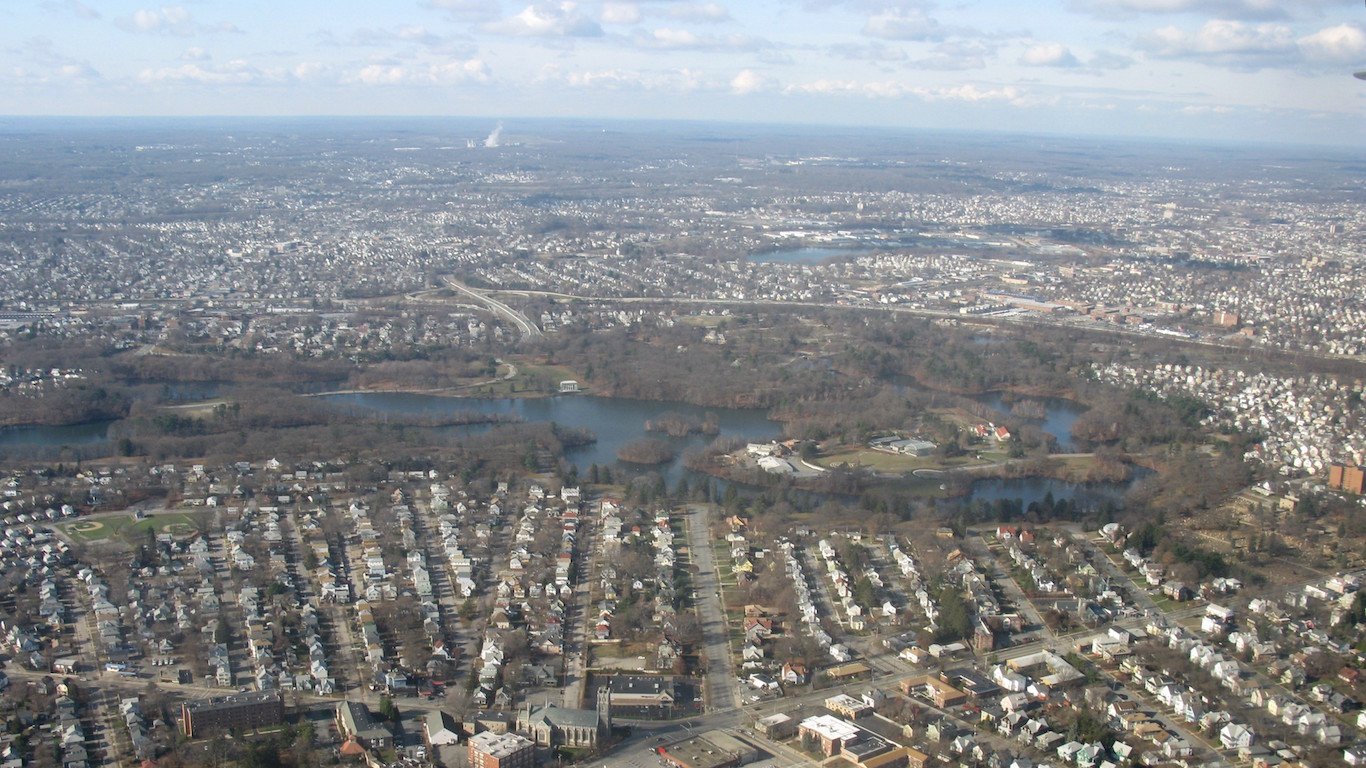
32. New York
> Best city to live: New Rochelle
> Population: 79,558
> Median home value: $523,300
> Poverty rate: 12.5%
> Adults with at least a bachelor’s degree: 45.6%
An estimated 19.4% of commuters in New Rochelle use public transportation, nearly four times the national average share. Many of those commuting from New Rochelle travel on the Metro-North Railroad to high-paying jobs in New York City. The typical New Rochelle household earns $75,757 a year, far more than the $62,909 the typical New York household earns a year.
In addition to providing access to the economic opportunities of a major metropolitan area, New Rochelle offers the quality of life of a wealthy suburb. The area has about one park and five golf courses per 100,000 residents, among the most of any city nationwide.
[recirclink id=433303]

33. North Carolina
> Best city to live: Raleigh
> Population: 458,862
> Median home value: $242,500
> Poverty rate: 12.1% (lowest 10%)
> Adults with at least a bachelor’s degree: 50.8% (highest 25%)
Raleigh is one of many fast-growing cities in North Carolina. Over the past 10 years, the population of Raleigh increased by 29.6%, the most of any city in the state other than neighboring Cary and far more than the 7.1% national population growth rate.
Raleigh is located in the southeastern corner of the Research Triangle, a prospering area with three leading research universities and many high-tech companies. North Carolina has one of the largest brain gains — more college graduates are staying in the state than leaving — in the country. This has contributed to higher educational attainment in cities across the state. In Raleigh, 50.8% of adults have at least a bachelor’s degree, far more than the 31.3% national share.
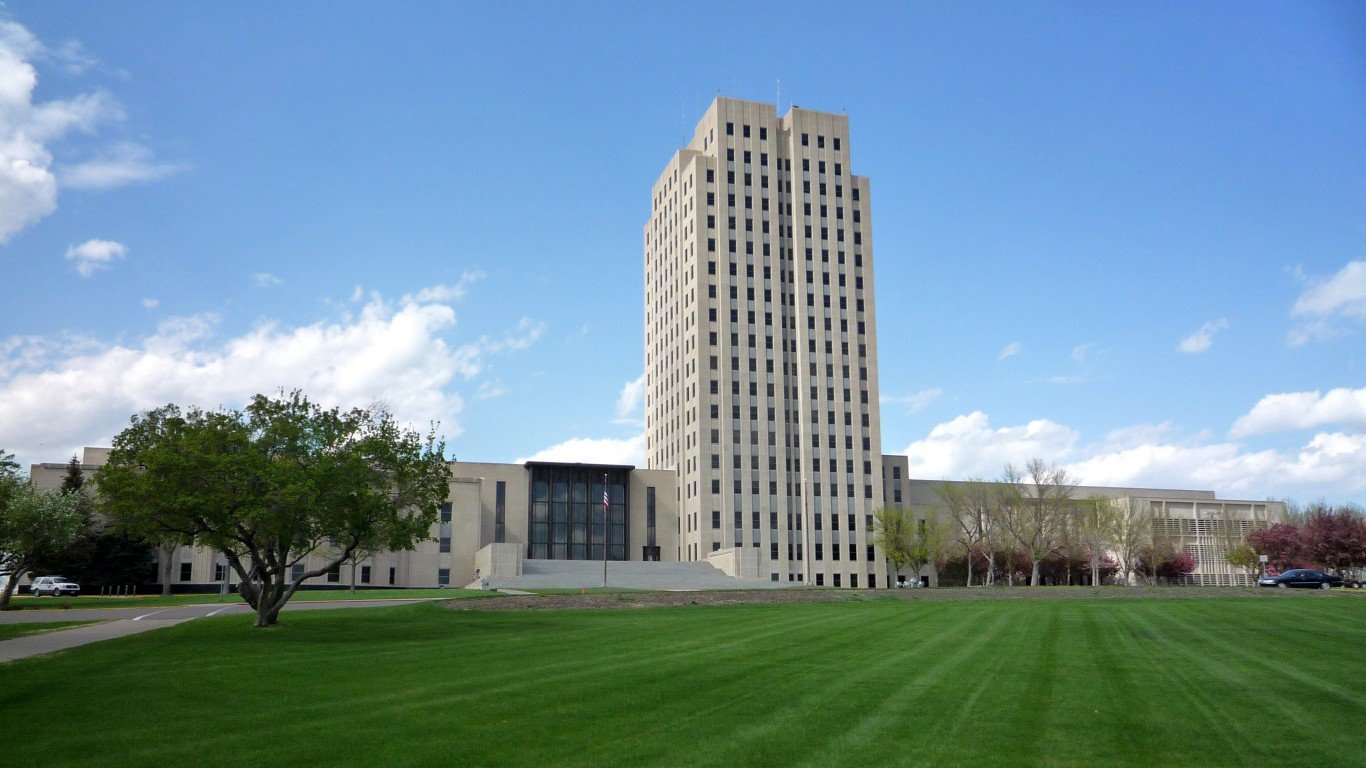
34. North Dakota
> Best city to live: Bismarck
> Population: 68,780
> Median home value: $235,900 (highest 25%)
> Poverty rate: 7.7% (lowest 25%)
> Adults with at least a bachelor’s degree: 34.6%
North Dakota has some of the lowest poverty and unemployment rates in the nation. Just 3.2% of North Dakota’s labor force are unemployed and 10.7% live in poverty, compared to the national figures of 4.9% and 14.0%, respectively. Still, Bismarck’s population is even more likely to earn a steady income and earn above-poverty wages. Just 2.5% of Bismarck labor force are unemployed and only 7.7% live below the poverty line.
Bismarck has also enjoyed huge employment growth as of late. From 2014 to 2016, employment grew by 7.4% in the city, more than double the national average employment growth of 3.5%. The city’s cost of living is also one of the lowest in the country.
[in-text-ad-2]
35. Ohio
> Best city to live: Parma
> Population: 79,423
> Median home value: $108,100
> Poverty rate: 8.6% (lowest 25%)
> Adults with at least a bachelor’s degree: 20.6%
In many of the best known cities in Ohio like Columbus, Cleveland, and Cincinnati socioeconomic measures are below national averages. However, the city of Parma stands out as far and away the best city to live in Ohio. Parma’s poverty rate of 8.6% is far below all other qualifying cities in Ohio. The city with the next lowest poverty rate is Columbus at 21.0%.
Parma is also the safest city in Ohio by a large margin. While Ohio’s violent crime rate is 300 per 100,000 people, in Parma the rate is 136 violent crimes per 100,000 people. For some context, the next safest city in Ohio is Columbus, with 522 violent crimes per 100,000 people, nearly four times the rate in Parma. Despite these factors, people are flocking away from Parma. The city’s population dropped 8.4% from 2006 to 2016. That may be due to the fact that Parma’s poverty and unemployment rates are worse than the national poverty and unemployment rates of 14.0% and 4.9%, respectively.
![]()
36. Oklahoma
> Best city to live: Broken Arrow
> Population: 109,439
> Median home value: $160,900 (highest 25%)
> Poverty rate: 8.6% (lowest 25%)
> Adults with at least a bachelor’s degree: 35.3%
Broken Arrow is not just the best place to live in Oklahoma, but also it is the fastest growing city in the state. Broken Arrow’s population has increased by 18.6% in the last 10 years — more than double the comparable U.S. population growth rate. Unlike much of Oklahoma, Broken Arrow is less at risk of some natural disasters. Specifically, much of Oklahoma is at high risk of tornadoes, Broken Arrow is tied for the lowest risk of any other city in the state.
Violent crime is also relatively uncommon. There were only 154 violent crimes for every 100,000 people in the city in 2016, nearly a third of the statewide violent crime rate.
[in-text-ad]
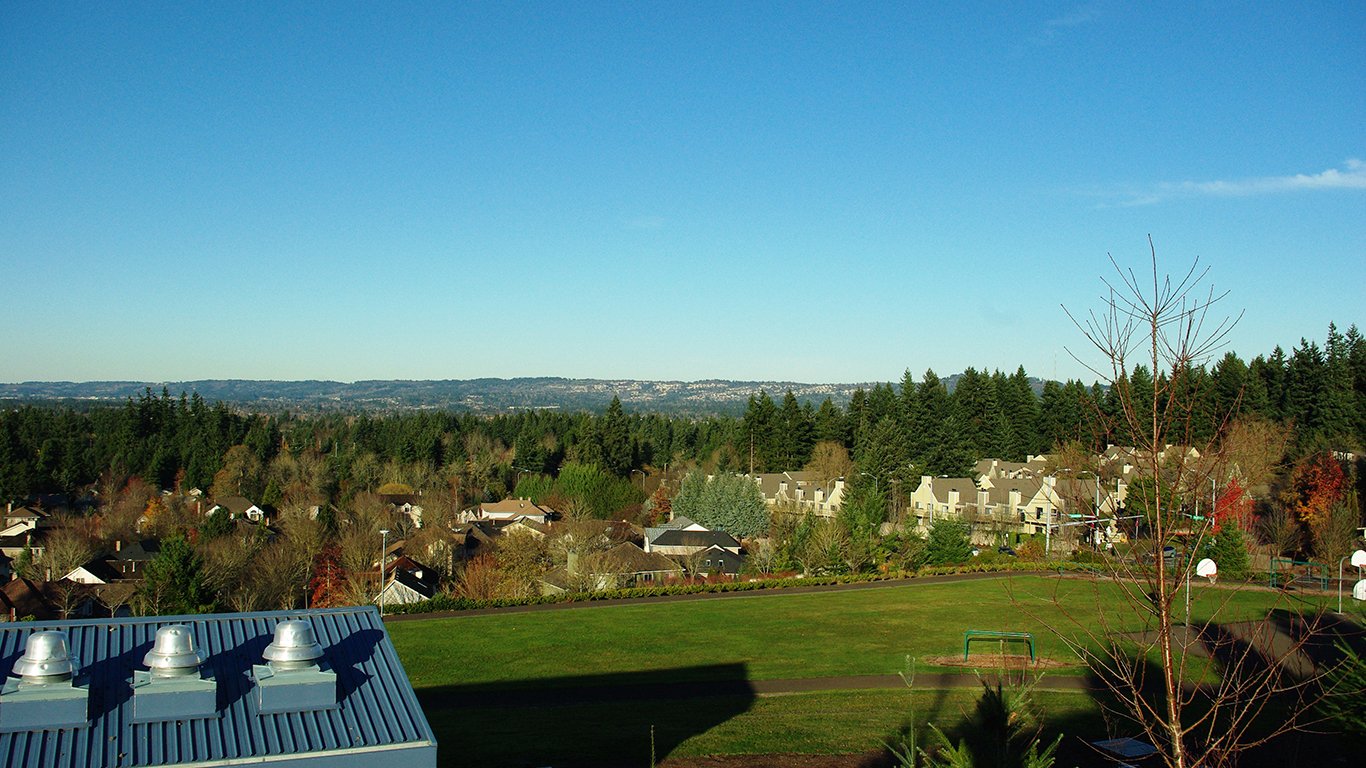
37. Oregon
> Best city to live: Beaverton
> Population: 97,602
> Median home value: $363,100
> Poverty rate: 9.6%
> Adults with at least a bachelor’s degree: 44.8%
Beaverton, which is part of the Portland metropolitan area, is the best city in Oregon in which to live. For those looking for job prospects, few cities are likely to offer more opportunities than Beaverton, which is a 15 to 25 minute drive from downtown Portland. Over the last two years, employment in Beaverton has increased by 8.3%, faster than in all but a few dozen other U.S. cities. The national job growth rate over the same period was 3.5%.
Living in one of the healthiest states, Beaverton’s population is also one of the healthiest in the country. The city has one of the lowest rates of preventable hospitalizations in both the state and the country.
[recirclink id=433280]
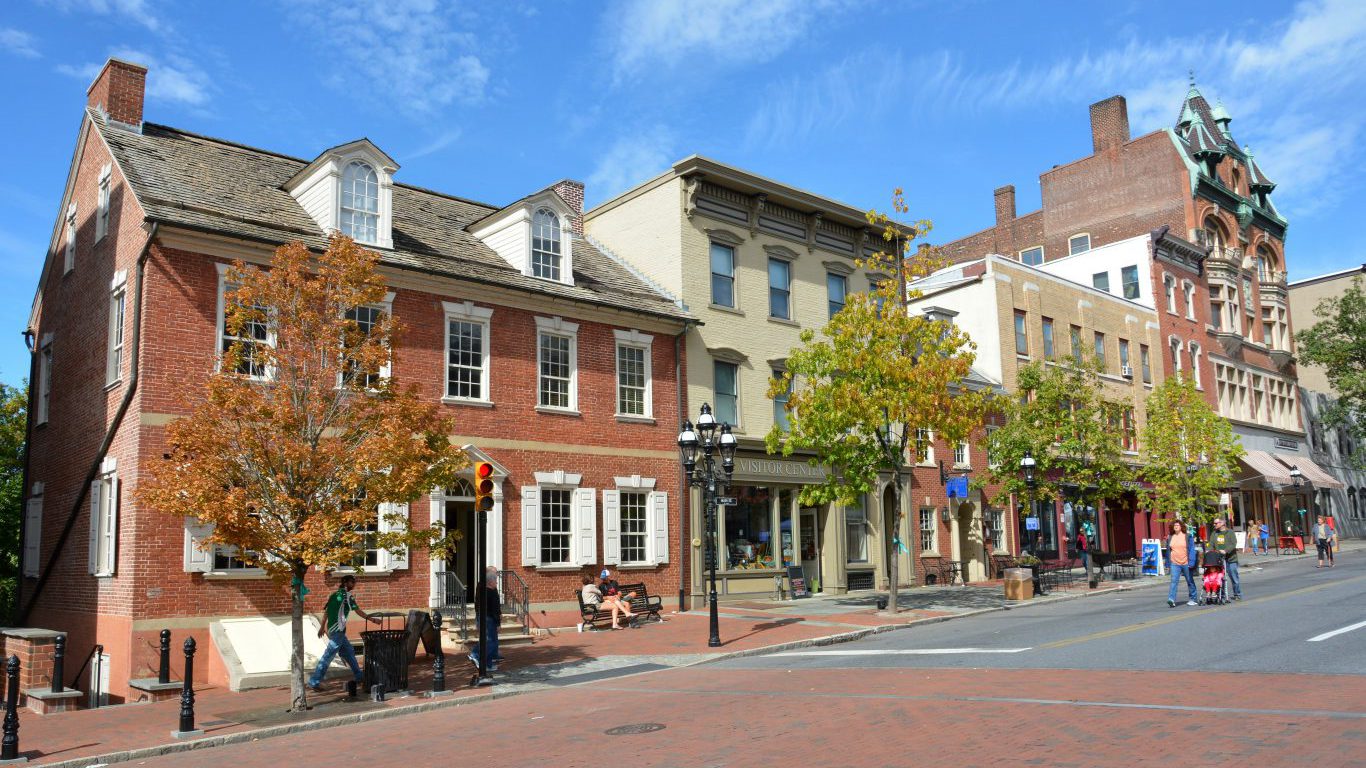
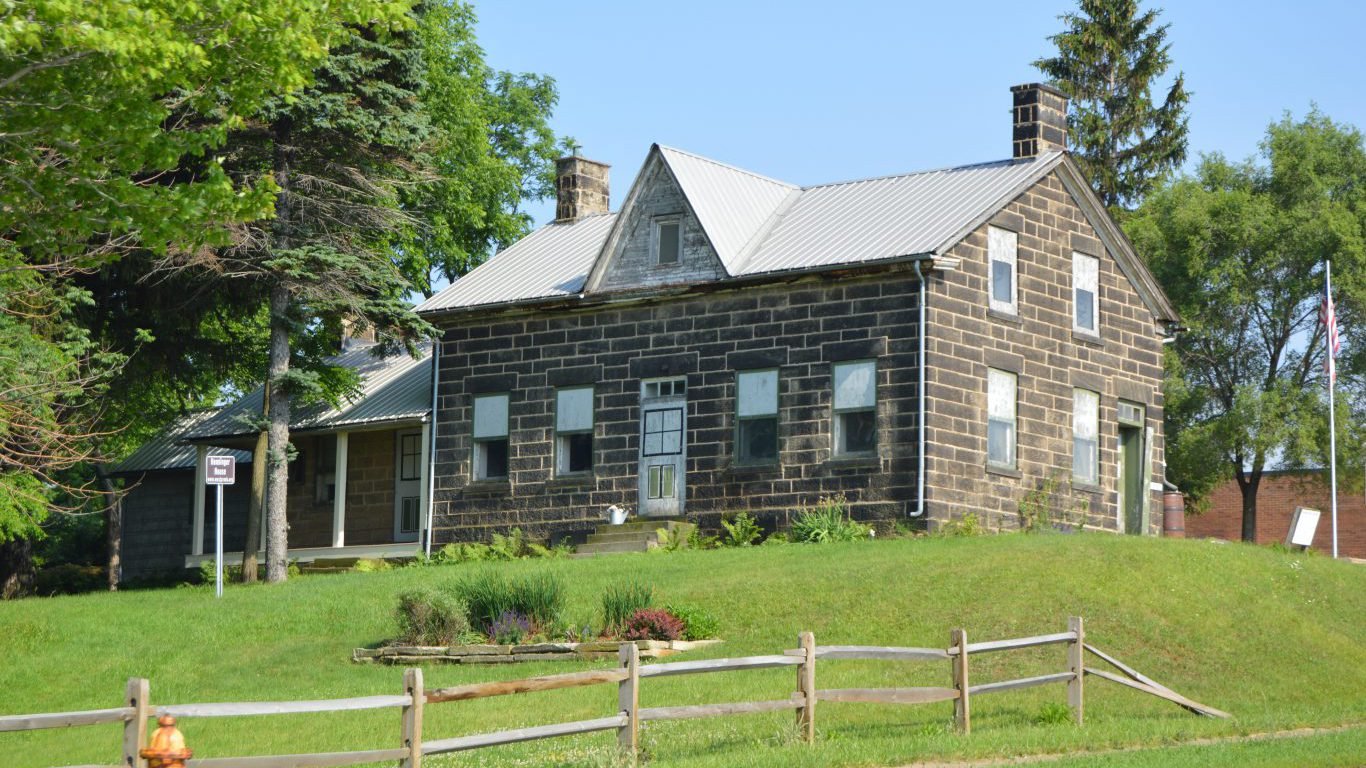
38. Pennsylvania
> Best city to live: Bethlehem
> Population: 76,427
> Median home value: $167,700
> Poverty rate: 18.1%
> Adults with at least a bachelor’s degree: 28.9%
Bethlehem, Pennsylvania’s bachelor’s degree attainment rate is just 28.9% compared to a 31.3% national rate, but that is nevertheless the second highest share in the state, behind only Pittsburgh. A college education is tied to higher incomes. The median income in Bethlehem is $52,588. Though that’s less than the state median of $56,907, it is still more than any other major city in the Keystone state. The next highest is Pittsburgh with $44,707.
Bethlehem also has the lowest poverty rate of any large Pennsylvania city, at 18.1%. Those with a reliable source of income are less likely to live in poverty, and Bethlehem has the second lowest unemployment rate in the state, at 5.8%.
39. Rhode Island
> Best city to live: Cranston
> Population: 81,025
> Median home value: $224,200 (highest 25%)
> Poverty rate: 6.0% (lowest 10%)
> Adults with at least a bachelor’s degree: 32.4% (highest 10%)
Cranston, Rhode Island has one of the strongest economies in the state and the country. Just 6.0% of Cranston residents live in poverty, less than half of Rhode Island’s 12.8% poverty rate and well below the 14.0% U.S. rate.
Cranston is safer than its neighboring cities. The city’s violent crime rate of 153.0 per 100,000 people is much lower than the rate across Rhode Island of 239.0 incidents per 100,000 people. There were also 1,862 property crimes in Cranston per 100,000 people, compared to 2,451 property crimes per 100,000 people nationwide.
[in-text-ad-2]
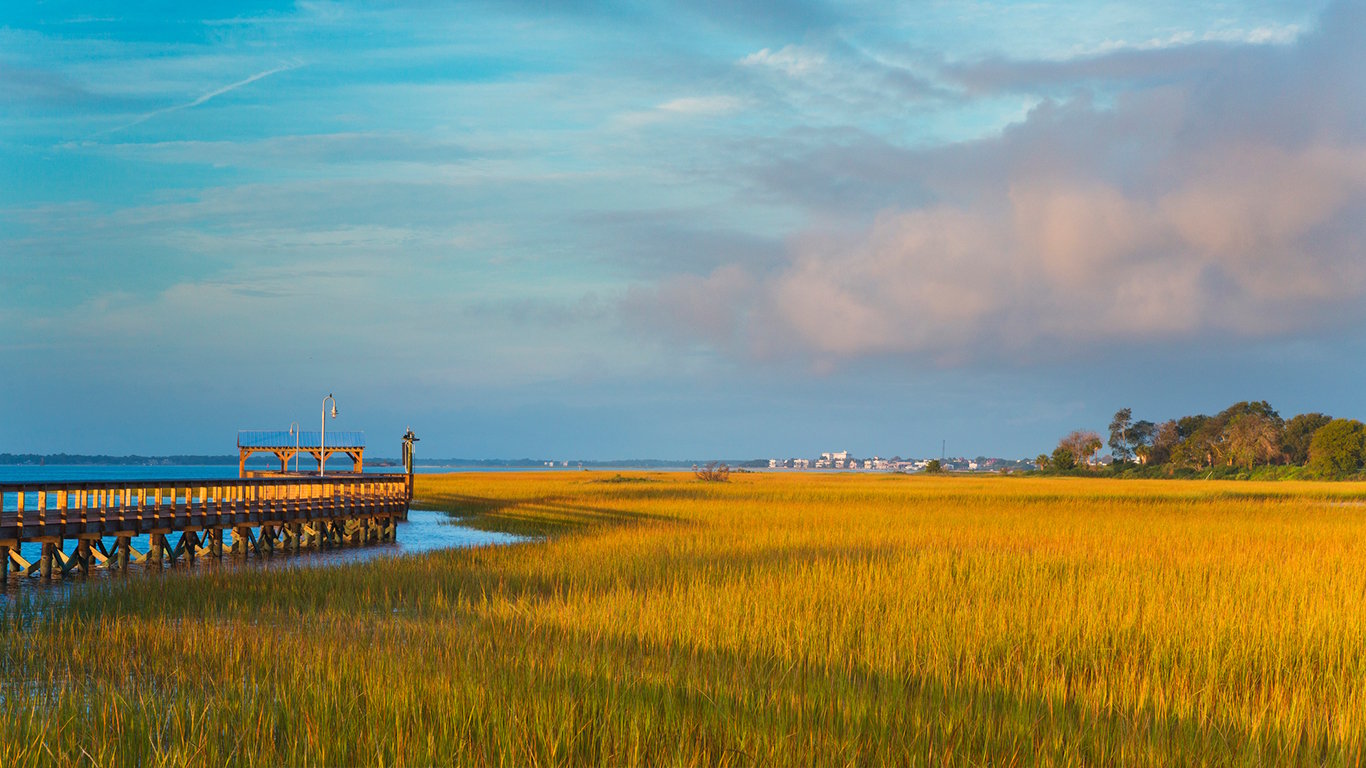
40. South Carolina
> Best city to live: Mount Pleasant
> Population: 84,177
> Median home value: $437,000
> Poverty rate: 4.2% (lowest 10%)
> Adults with at least a bachelor’s degree: 57.9%
Mount Pleasant, South Carolina is one of only seven large U.S. cities with a median income more than double that of its home state. One of the wealthiest cities in the country, Mount Pleasant’s median household income of $101,015 per year is well above the median household income across South Carolina of $49,501 a year. The area’s affluence is underscored by the relative low poverty level. Only 4.2% of Mount Pleasant’s population lives below the poverty line, less than one-third of both the statewide and U.S. poverty rates.
The Mount Pleasant area is also rich in cultural amenities. The city boasts a higher concentration of museums, recreation centers, movie theaters, and nature parks than is typical nationwide. Residents also have easy access to jobs, culture, and entertainment in Charleston, South Carolina’s largest city.
41. South Dakota
> Best city to live: Sioux Falls
> Population: 174,350
> Median home value: $173,400 (highest 25%)
> Poverty rate: 10.3%
> Adults with at least a bachelor’s degree: 36.3%
Sioux Falls, South Dakota’s unemployment rate of 2.4% is less than half of the U.S. jobless rate of 4.9% and below South Dakota’s rate of 2.8%. The median household income in Sioux Falls of $56,867 a year is just ahead of the median household income in South Dakota of $54,467.
Even though the median household income is $1,000 lower than the U.S. median household income of $57,617, the cost of goods and services in the city are much lower than is typical nationwide, with 87 cents spent in the city equivalent to the average dollar spent nationwide. Adjusted for cost of living, Sioux Falls’ median household income is equivalent to $65,140.
[in-text-ad]
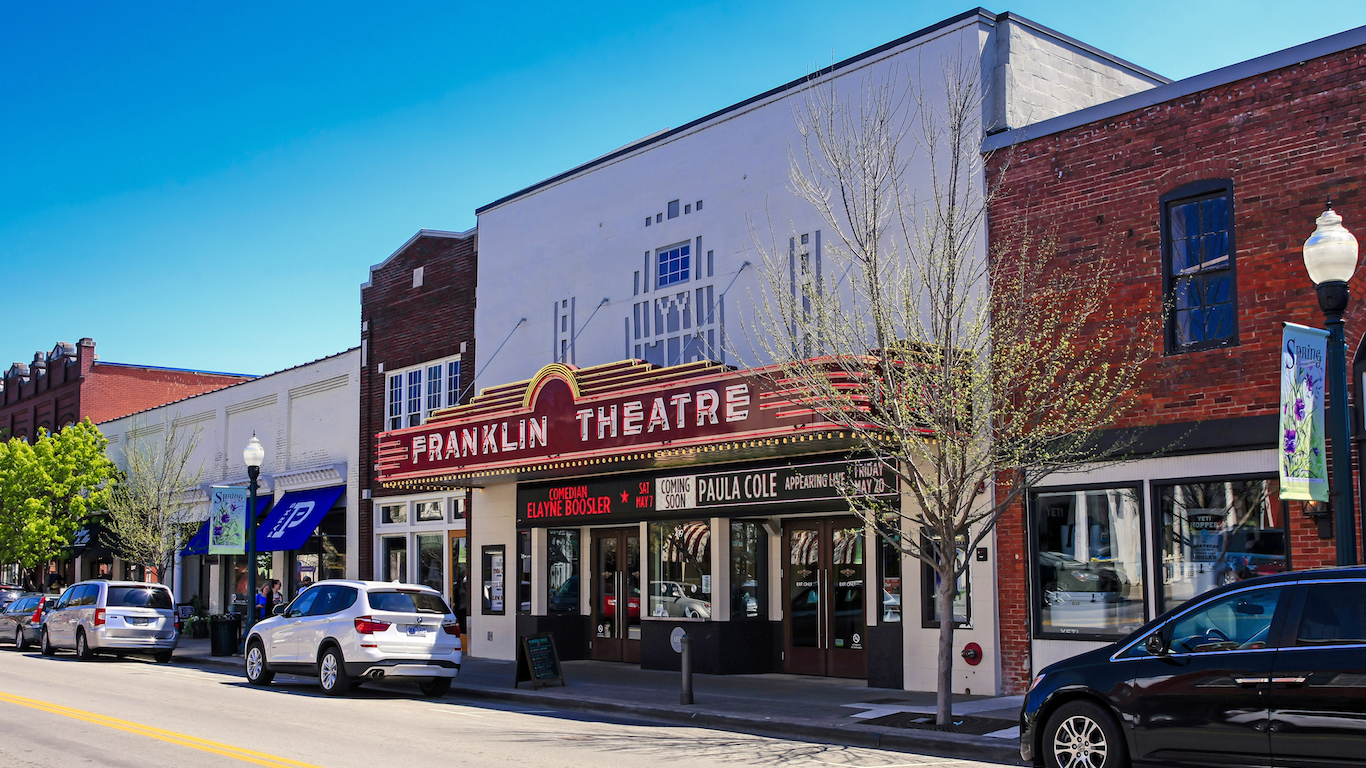
42. Tennessee
> Best city to live: Franklin
> Population: 74,788
> Median home value: $391,000
> Poverty rate: 10.1%
> Adults with at least a bachelor’s degree: 58.5%
A weak economy can undercut any number of advantages an American city might have. Conversely, a strong economy can create a virtuous cycle in a community. In Franklin, Tennessee, a city with only a 3.3% unemployment rate and an 8.4% uptick in total employment between 2014 and 2016 — more than double comparable U.S. employment growth rate — the economy is a boon.
A highly skilled workforce can be more resilient to economic slumps, and in Franklin, 58.5% of adults have at least a bachelor’s degree compared to only 31.3% of American adults. Better-educated populations also tend to be higher earning, and Franklin’s labor force is no exception. The typical area household earns $91,657 a year, or $43,000 more than the typical Tennessee household.
[recirclink id=433167]

43. Texas
> Best city to live: Flower Mound
> Population: 73,289
> Median home value: $344,300 (highest 10%)
> Poverty rate: 4.7% (lowest 10%)
> Adults with at least a bachelor’s degree: 61.3% (highest 10%)
The typical household in Flower Mound, Texas earns about $131,500 annually, the sixth most of any city. After adjusting for the area’s low cost of living, the median income in Flower Mound is the highest of any U.S. city. Just as a large share of area residents are wealthy, very few face serious financial hardship. Fewer than 5% of the city’s population lives in poverty — less than a third of the statewide poverty rate.
Largely financially secure, Flower Mound residents are also generally safe from the threat of violent crime. There were fewer than 50 violent crimes for every 100,000 city residents in 2016. In comparison, there were 434 violent crimes per 100,000 people in Texas and 386 incidents per 100,000 people in the United States.

44. Utah
> Best city to live: South Jordan
> Population: 69,034
> Median home value: $385,300
> Poverty rate: 4.1% (lowest 10%)
> Adults with at least a bachelor’s degree: 34.1% (highest 25%)
South Jordan is the best city to live in Utah and one of the best in the country. Among the factors contributing to the high quality of life in South Jordan are the city’s low poverty and unemployment rates. Just 4.1% of residents live in poverty, and only 3.0% of the city’s labor force is unemployed, below the state’s 10.2% poverty rate and 3.4% unemployment rate.
South Jordan is also one of the fastest growing cities in the country. The working population increased by 10.5% between 2014 and 2016, the eighth most of any U.S. city. One factor fueling the city’s rapid growth is the continued construction of the planned community known as Daybreak, which could nearly double South Jordan’s housing stock once completed.
[in-text-ad-2]
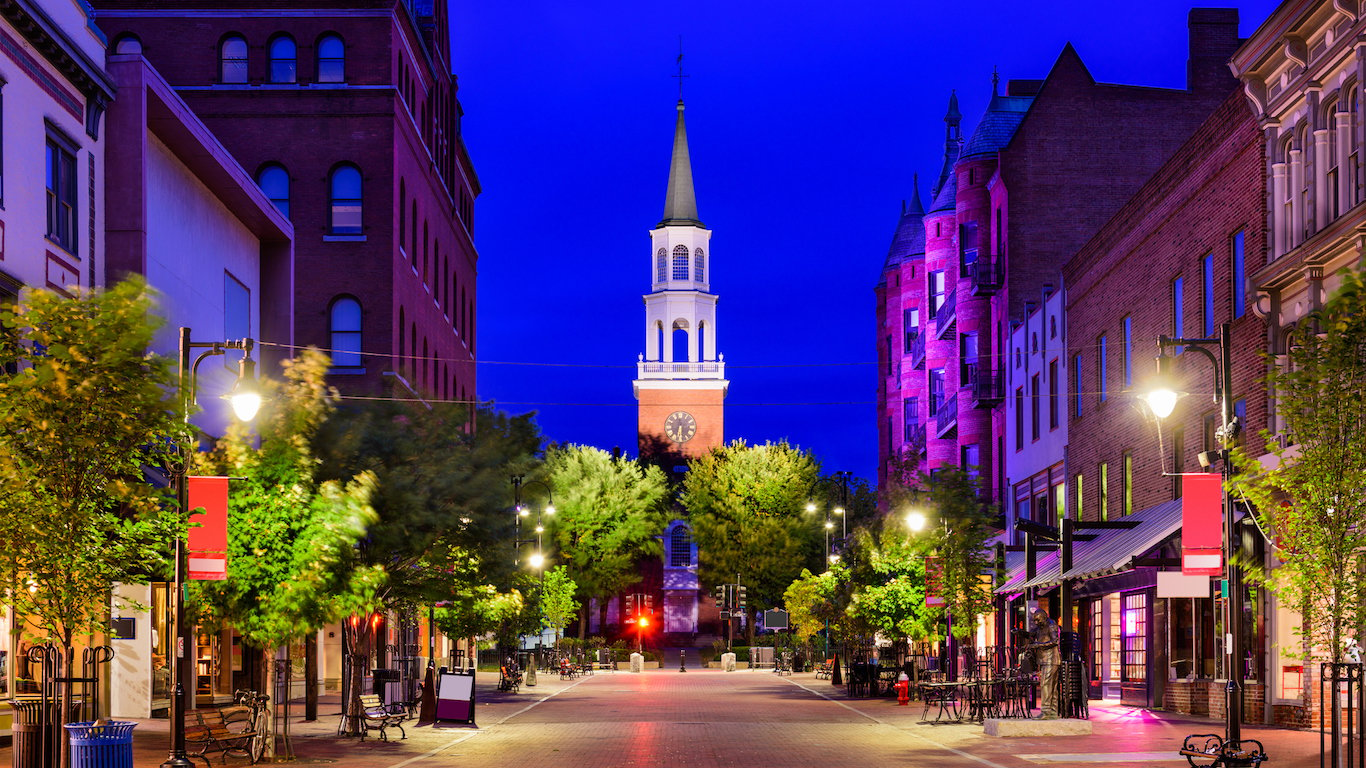
45. Vermont
> Best city to live: Burlington
> Population: 42,556
> Median home value: $264,300
> Poverty rate: 25.1% (highest 25%)
> Adults with at least a bachelor’s degree: 50.9%
Burlington is the only city in Vermont considered for this list, but it still has compares favorably to much of the country in a number of social and economic measures. For instance, more than half of its adults have at least a bachelor’s degree, which helps insure higher incomes and can often lead to a greater sense of well-being. The high educational attainment has likely contributed to the city’s low unemployment rate of 2.6%, which is lower than Vermont’s 3.3% rate.
Burlington is one of the top cities in the United States for leisure. It is located in Chittenden County, which has the third most ski resorts per capita, the fourth most golf courses per capita, and the 10th most restaurants per capita.
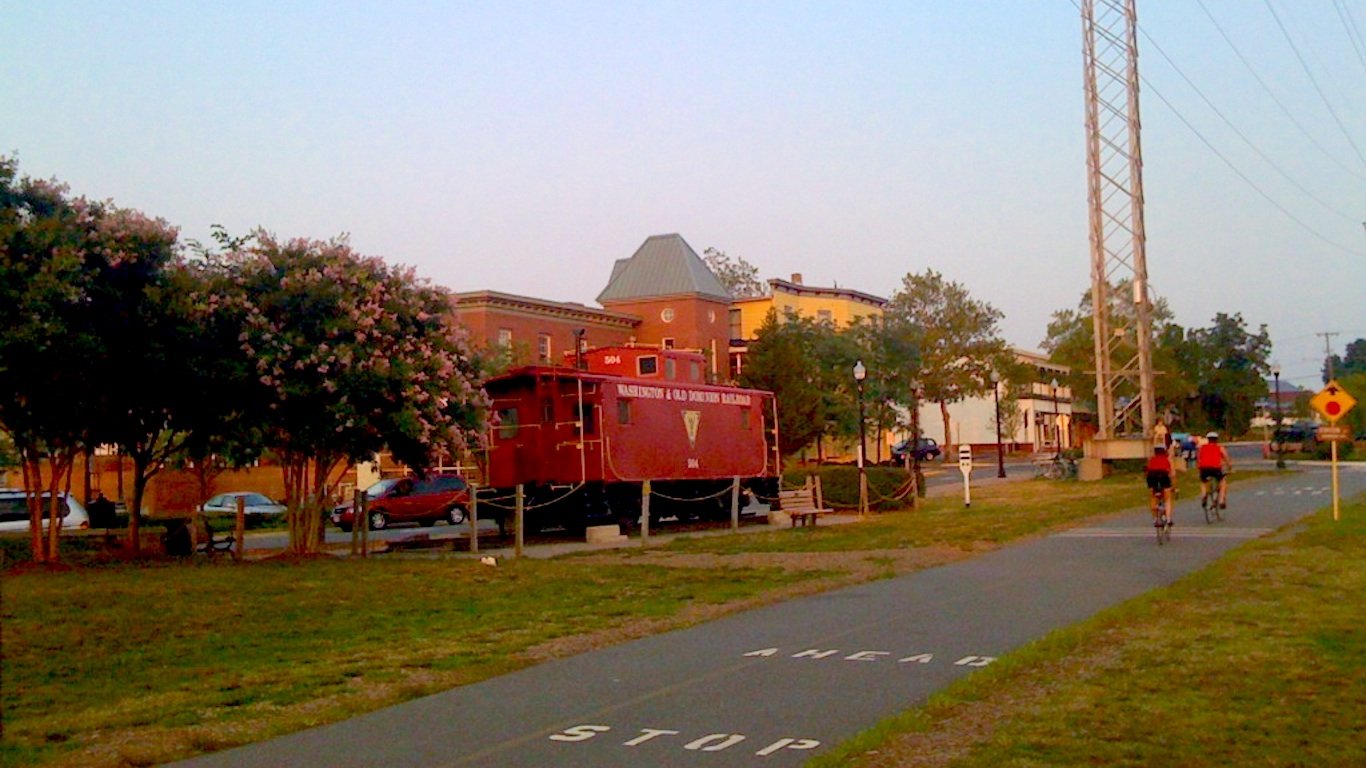
46. Virginia
> Best city to live: Dale City
> Population: 72,073
> Median home value: $297,800 (highest 25%)
> Poverty rate: 5.7% (lowest 10%)
> Adults with at least a bachelor’s degree: 27.8%
Dale City residents have relatively easy access to the entertainment and cultural amenities of nearby Washington D.C. Many likely work in high-paying jobs in and around the nation’s capital. The typical Dale City household earns about $95,600 a year, nearly $40,000 more than is typical nationwide and more than $27,000 above the state median income. Just as the area is home to a relatively large share of wealthy residents, very few in Dale City face serious financial hardship. Only 5.7% of the city’s population lives in poverty, nearly half of Virginia’s 11.0% poverty rate.
Housing in the Dale City area is more affordable than anywhere else in Virginia. The typical area home is worth about 3.1 times the city’s median household income, less than in any other major Virginia city.
[in-text-ad]

47. Washington
> Best city to live: Kirkland
> Population: 87,672
> Median home value: $582,100
> Poverty rate: 6.6% (lowest 10%)
> Adults with at least a bachelor’s degree: 62.3%
Many may know the name Kirkland from wholesaler Costco’s store brand, Kirkland Signature. The company was indeed once headquartered there. Even without Costco’s headquarters, the Seattle region city is home to a number of high-paying companies. Google notably has an office in the city. The presence of Google and other companies has contributed to Kirkland’s very high household incomes. The typical household in Kirkland earns $114,000 annually, almost double the nationwide median household income.
As is often the case, a well-educated workforce in the city accompanies an economy that requires high-paying, professional jobs. Over 60% of Kirkland’s adults have a college degree, nearly double the national college attainment rate.
[recirclink id=433018]
48. West Virginia
> Best city to live: Huntington
> Population: 48,735
> Median home value: $92,300 (lowest 25%)
> Poverty rate: 30.8% (highest 10%)
> Adults with at least a bachelor’s degree: 29.0%
Only two cities in West Virginia, Huntington and Charleston, are large enough to be considered in our ranking. Neither ranked particularly high among all U.S. cities, but Huntington fared slightly better in a number of key categories, including household income and lower unemployment.
Although it ranks as best city to live, Huntington’s violent crime rate of 778.7 incidents per 100,000 people is more than double the rate across West Virginia of 358.0 violent crimes per 100,000 people. Still, Huntington’s violent crime rate pales in comparison to Charleston’s rate of 1,551.7 violent crimes per 100,000 people, which makes Charleston one of the most dangerous places in the U.S.

49. Wisconsin
> Best city to live: Waukesha
> Population: 72,358
> Median home value: $196,100 (lowest 10%)
> Poverty rate: 12.7%
> Adults with at least a bachelor’s degree: 34.9%
The city of Waukesha in the Milwaukee metro area is the most liveable city in Wisconsin. Though the median household income in Waukesha of at $56,808 a year is nearly in line with the nation’s median income, poverty is slightly less common in the area. Only 12.7% of residents live below the poverty line, a lower rate than any other Wisconsin city. The city is also relatively safe. There were only 127 violent crimes in Waukesha in 2016 for every 100,000 people, a third of the comparable U.S. crime rate. Area residents have access to higher concentrations of restaurants, bars, fitness centers, and movie theaters than is typical nationwide.
[in-text-ad-2]
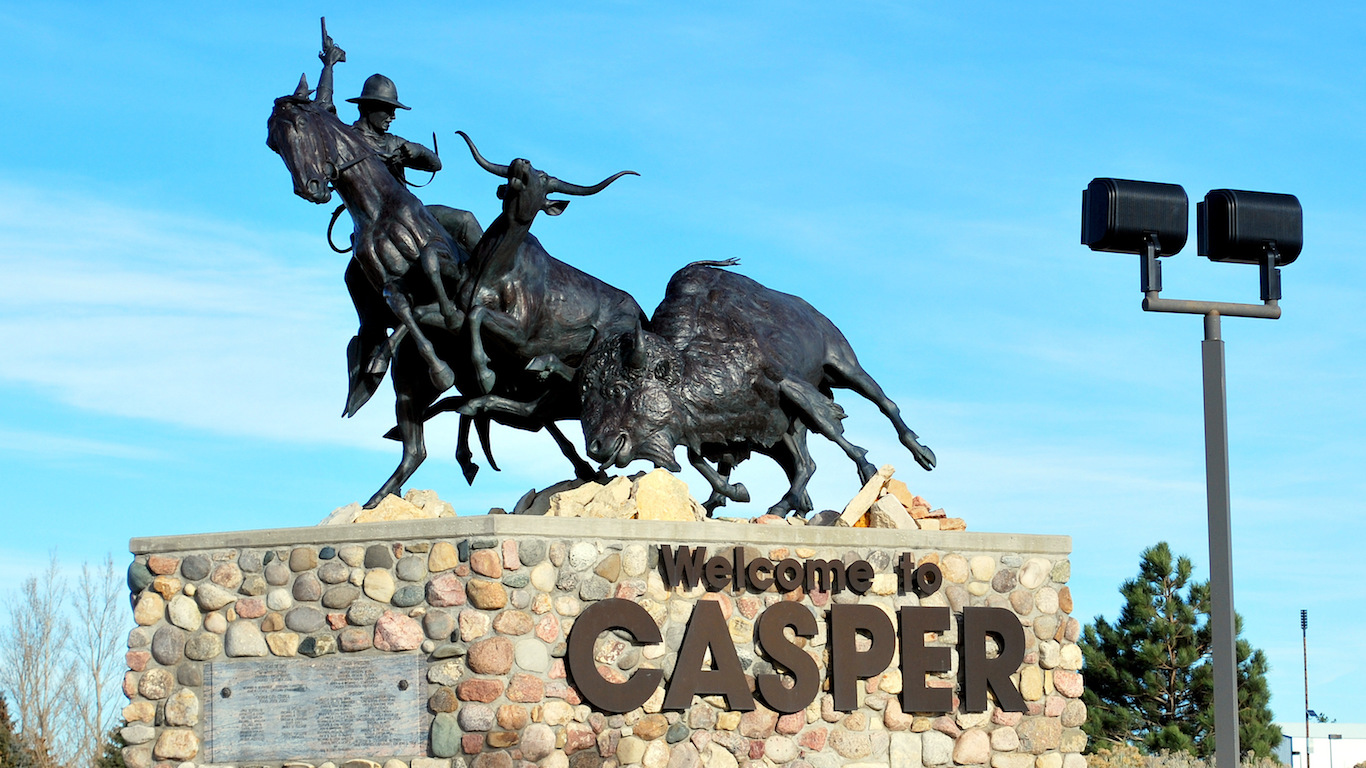
50. Wyoming
> Best city to live: Casper
> Population: 59,397
> Median home value: $189,400 (highest 10%)
> Poverty rate: 10.7%
> Adults with at least a bachelor’s degree: 23.9% (highest 25%)
People love to go out West for the fresh, clean air. And nowhere is the air cleaner than in Casper, Wyoming. The city’s air quality is considered hazardous only 0.4% of the year, the lowest rate of any city in the nation.
Casper is also one of the safest cities in the nation with a violent crime rate of just 114.1 incidents per 100,000 people, less than half of Wyoming’s violent crime rate of 244 incidents per 100,000 people.
Detailed Findings:
Depending on the state, the city ranking as most livable can have far different conditions than the best city in another state. In some of the less prosperous parts of the country, the best rated large cities may actually have worse living conditions, job prospects, and amenities than in the typical American city. Bethlehem, Pennsylvania compares unfavorably to the nation by a number of measures, but makes the list because other cities in the state report even worse outcomes and living conditions.
Educated populations are more resilient to economic downturns as a college education tends to lead to greater job opportunities and higher-paying jobs. Partially as a result, 39 of the 50 cities on this list are home to a larger share of college-educated adults than the 31.3% share of adults nationwide.
Just as solid employment figures can create a virtuous cycle of prosperity in U.S. cities, the presence of violent crime can be detrimental to a city’s livability, undermining growth. With only a handful of exceptions, the violent crime rate in every city on this list for which data is available is lower than the U.S. rate as a whole. In Johns Creek, for example, the best city to live in Georgia and the fourth best city to live in overall, there were only 14 violent crimes for every 100,000 residents in 2016 — a fraction of the U.S. violent crime rate of 386 incidents per 100,000 people.
Desirable, vibrant communities are often expensive — prohibitively so for most Americans. Indeed, the cost of goods and services is substantially higher than the average cost nationwide in about 21 of the cities on this list. However, higher incomes offset the higher cost of living in many of these. As a result, in 29 of the cities on this list housing is more affordable than the nation as a whole, as measured by median household income as a percentage of the typical cost of a home. What is clear
A major contributing factor to a given city’s livability is the presence of cultural amenities and entertainment venues. The majority of cities on this list have a greater concentration of restaurants and eateries or cultural amenities such as museums or theaters than is typical nationwide. Further, most of the best cities have relatively easy access to similar attractions in nearby major cities such as Denver, Minneapolis, New York, and Washington D.C.
Not surprisingly, the cities on this list are attractive to growing families and new residents. Well over half of the best cities have reported faster population growth over the last five years than the nation as a whole.
Methodology:
To determine the best city to live in each state, 24/7 Wall St. considered the 550 cities with populations of more than 65,000 residents in 2015. When no cities had populations of at least 65,000 in a given state, we considered all cities in the state with populations of 40,000 and more. Data were collected in nine major categories: crime, demography, economy, education, environment, health, housing, infrastructure, and leisure.
Within each category, specific measures contributed to a city’s overall category score.
Population figures are from the Census Bureau’s 2016 American Community Survey (ACS). The crime category consists of both violent and property crime rates from the Federal Bureau of Investigation’s 2016 Uniform Crime Report. High crime rates have the potential to make a city less livable. As a result, cities with crime rates lower than the national rates were rewarded, while cities with higher crime rates were penalized.
The economy category includes a city’s 2016 annual unemployment rate and employment growth from 2014-2016, both from the Bureau of Labor Statistics. We also considered the poverty rate in this category. Cities were penalized for having poverty rates above the national rate of 14.0%. Median household incomes were also considered. Cities were penalized if cost of living-adjusted incomes were less than $44,000 or more than $112,000 a year, roughly 80% to 200% of a typical household’s income nationwide. Poverty rates and median household income came from the 2016 ACS. Cost of living data came from property and real estate data provider ATTOM Data Solutions.
As a proxy for school system strength, we considered high school standardized test scores relative to state scores from ATTOM Data Solutions. Test score data are for 2015 or the most recently available year. Additionally, the education category included the percentage of adults with at least a bachelor’s degree from the ACS, as well as the number of colleges and universities in a city per 100,000 residents from the Department of Education. Both measures are as of 2015.
Whereas other measures in the weather index are specific to an individual city, many metrics in this category refer to the county in which the city is located because weather is likely similar, if not the same, in these two geographies. In this category, we included the air quality index to assess the levels of a variety of pollutants on a given year. Additionally, we considered an index measuring natural disaster risk, as well as average monthly rainfall. All data in this category came from ATTOM Data Solutions.
Contact [email protected] for any questions or corrections.