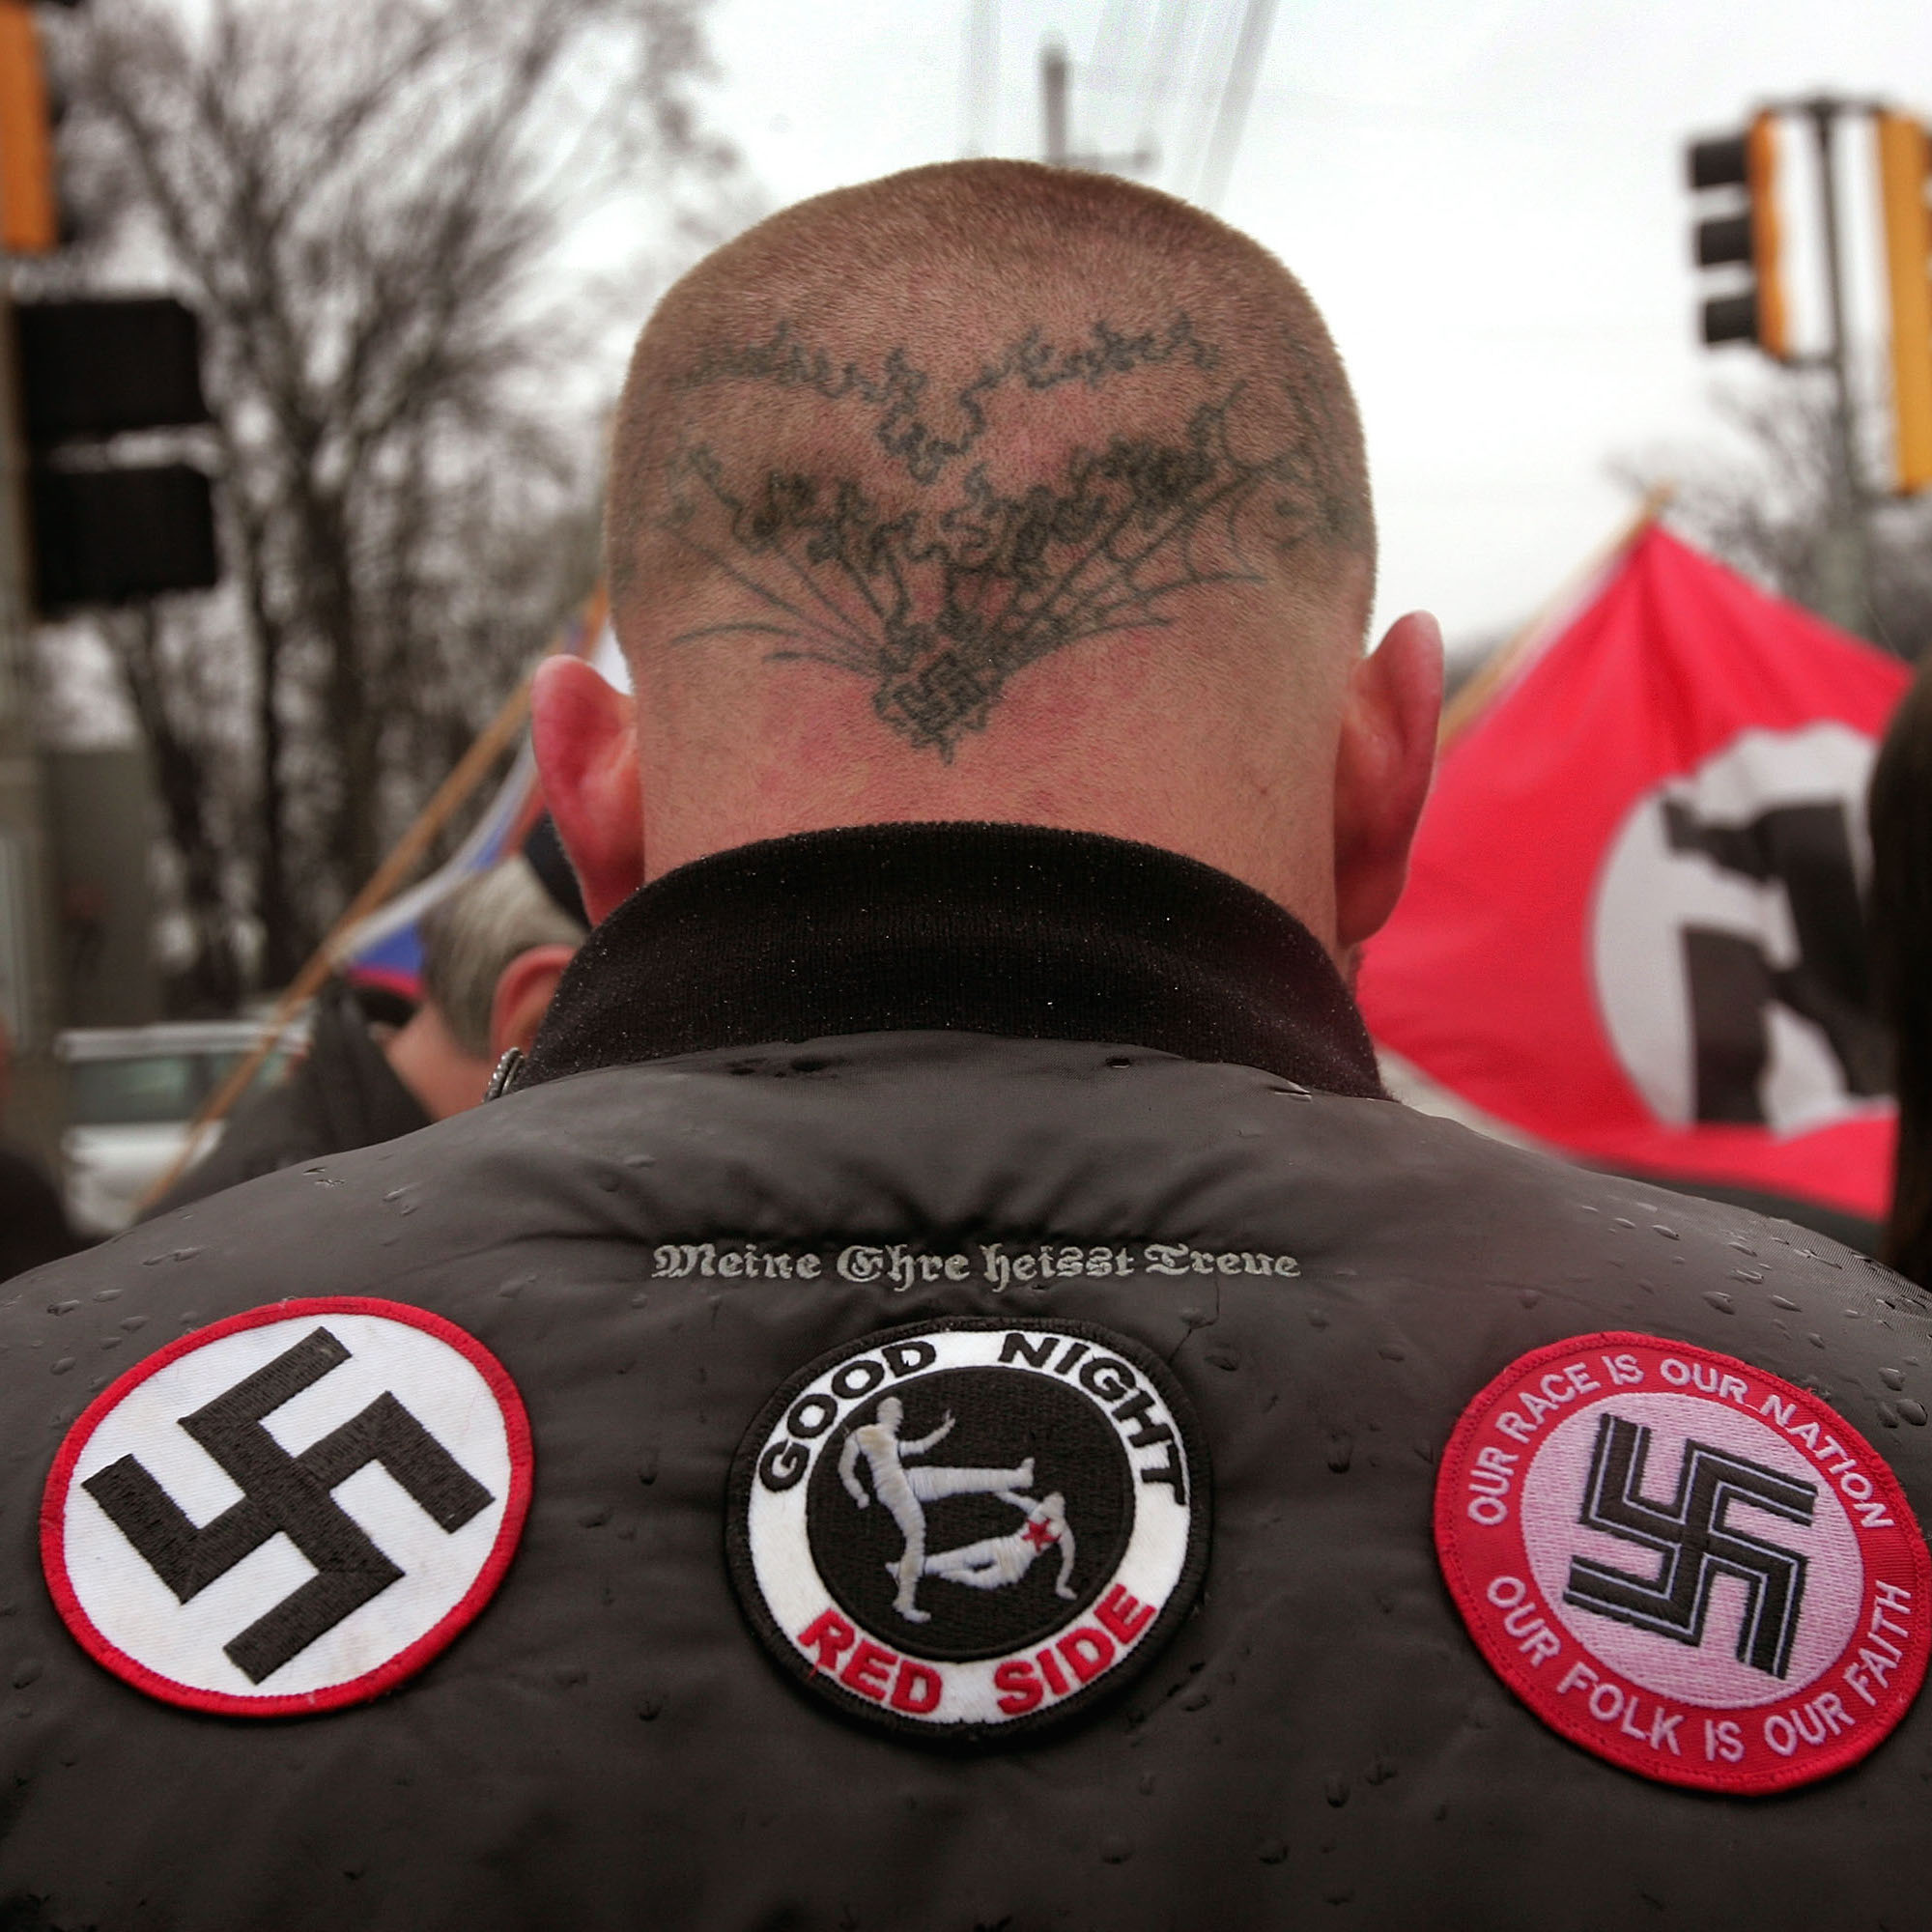

The number of active hate groups in the United States has steadily risen over the past several years, from 784 in 2014 to 954 as of 2017, according to the civil rights advocacy group Southern Poverty Law Center.
A number of factors can act as possible explanations for the rise in hate group activity in recent years. Many consider President Donald Trump’s campaign and his first year in office as one such factor. The ensuing social tensions likely emboldened new and existing hate groups — not only to speak out but also to attract new members. Opposition to such widespread adoption of hateful ideology has also inspired several counter organizations that have themselves adopted extremist and sometimes superior ideology, according to the SPLC.
While the number of SPLC-designated hate groups has increased throughout the nation as a whole, just a small group of states in the South and West are the hotbed of hate group activity. To determine the states with the highest concentration of hate groups, 24/7 Wall St. used data on hate groups in each state in 2017 from the Southern Poverty Law Center and adjusted it for the population. There are 10 states with more than 10 hate groups and at least 3.8 hate groups per 1 million residents.
Click here to see the full list of the 10 states with the most hate groups.
Click here to see or detailed findings and methodology.
10. Colorado
> Hate groups: 3.8 per million people
> Number of hate groups: 21
> Pct. pop. identifying as white: 84.0% (17th highest)
> Pct. pop. foreign born: 9.8% (17th highest)
Colorado is one of three Western states to rank among the 10 states states with the greatest number and greatest concentration of hate groups. There are 3.8 hate groups in Colorado for every 1 million state residents, versus the concentration of hate groups nationwide of 3.0 groups per 1 million Americans. Hate groups in the state include racist skinheads, white nationalists, Ku-Klux-Klan, and neo-Nazi groups. However, anti-LGBT groups are the most common in the state. Anti-LGBT groups include the Family Research Institute and The Pray in Jesus Name Project, each headquartered in Colorado Springs, and Generations With Vision, which is headquartered in Elizabeth.
The number of black nationalist groups operating in the United States is on the rise, and Colorado is home to two of them — Israel United in Christ and the Nation of Islam, both based in Denver. Though the Nation of Islam offers a range of programs to uplift African Americans, the group is also known for its rhetoric of black superiority, anti-LGBT, and anti-Semitism.
[in-text-ad]
9. Georgia
> Hate groups: 3.9 per million people
> Number of hate groups: 40
> Pct. pop. identifying as white: 58.7% (4th lowest)
> Pct. pop. foreign born: 10.1% (16th highest)
The SPLC identifies 40 active hate groups in Georgia, among the most of any state. Some 40% of these organizations are designated by the SPLC as promoting Black Nationalist ideologies, including the Nation of Islam, the New Black Panther Party, and the Nuwaubian Nation of Moors.
The Nuwaubian Nation of Moors moved to Georgia from New York City in the 1990s. The group built an Egyptian-style compound in the rural Putnam County with about 400 members living on-site and an estimated 1,000 additional members living in the surrounding county. The compound was shut down after the FBI arrested the group’s leader and founder, Dwight York. York was subsequently sentenced to 135 years in prison for child molestation and other crimes. Still, the movement persists throughout the state in a network of chapters and bookstores called All Eyes on Egipt. Other SPLC-designated hate groups active in the state include the white nationalist Identity Evropa and several iterations of the Ku Klux Klan.

8. Arkansas
> Hate groups: 4.0 per million people
> Number of hate groups: 12
> Pct. pop. identifying as white: 76.6% (23rd lowest)
> Pct. pop. foreign born: 4.6% (14th lowest)
Of the 12 hate groups the SPLC identified in Arkansas, half are overtly racist. The state is home to two Ku-Klux-Klan chapters as well as the League of the South, a neo-Confederate group, and the Aryan Strikeforce, a racist skinhead group. The state is also home to two chapters of the black nationalist organization Nation of Islam, with one chapter in Little Rock and another in Pine Bluff.
Hate groups in Arkansas are also formed from religion based hatred. The state is home to three separate Christian Identity groups — a theology that deems people of color to be subhuman and Jews to be cursed by God. One such group in the state is the headquarters for the Kingdom Identity Ministries, the world’s largest supplier of literature and materials on Christian Identity. Anti-Muslim group ACT for America also has a branch in Jonesboro.

7. Oregon
> Hate groups: 4.4 per million people
> Number of hate groups: 18
> Pct. pop. identifying as white: 84.4% (16th highest)
> Pct. pop. foreign born: 9.6% (18th highest)
Hate groups are a growing problem in Oregon. The SPLC counted 18 active hate groups in the state in 2017, up from just 11 the year prior. New groups identifying as white supremacist, racist skinhead, and neo-Nazi largely accounted for the growth. Nationwide, the number of black nationalist groups, while still nowhere near the count of groups that adhere to forms of white supremacist ideology, grew to 233 from 193 the previous year. As of last year, Oregon was home to three black nationalist groups, which are typically characterized by anti-white and anti-Semitic ideas as well as opposition to integration and interracial marriage.
It seems the rise in organized hatred in Oregon has not gone unnoticed. The City of Portland recently announced a $350,000 grant to support organizations working with Portland United Against Hate. The group tracks and reports acts of hate and provides support and protection in communities throughout the state’s largest city — which itself is home to three hate groups.
[in-text-ad-2]

6. Virginia
> Hate groups: 4.4 per million people
> Number of hate groups: 37
> Pct. pop. identifying as white: 67.8% (11th lowest)
> Pct. pop. foreign born: 12.3% (15th highest)
Virginia is one of eight states with over 35 active hate groups, according to the SPLC. With a total of 10, white nationalist groups comprise the largest share of hate groups in the state. Virginia’s white nationalist groups include the AltRight Corporation based in Alexandria, The New Byzantium Project operating out of Charlottesville, and The Right Stuff, which operates in various locations across the state. Twelve additional groups identify as either neo-Nazi, neo-Confederate, racist skinhead, or KKK.
In August 2017, several hundred white nationalists and white supremacists protested the removal of a statue of Confederate General Robert E. Lee. They first marched Friday night in a torchlight procession, and on Saturday they clashed with counter demonstrators. A man rammed a car into anti-racist protesters, killing one person and injuring several others. In all, three people were killed and 35 injured as the city declared a state of emergency.
5. Indiana
> Hate groups: 4.5 per million people
> Number of hate groups: 30
> Pct. pop. identifying as white: 83.5% (18th highest)
> Pct. pop. foreign born: 5.3% (19th lowest)
The SPLC identifies 30 active hate groups in Indiana, nearly the most of any state when adjusted for the population. Some of the most popular ideologies among hate groups in the state include white nationalism, neo-Nazism, Islamophobia, and the Ku Klux Klan.
The Ku Klux Klan has an active history in Indiana. The Indiana Klan initially rose to prominence in the aftermath of World War I, and by 1923 had the largest KKK membership of any state. Several years later, an estimated 30% of U.S.-born white men in Indiana belonged to the Indiana Klan, including Gov. Edward L. Jackson and more than half the members of the state legislature. The power and influence of the Indiana KKK has significantly declined in the decades following the 1925 conviction of its Grand Dragon of the rape and murder of a young woman. Still, several hate groups affiliated with the KKK remain active in the state. Examples include the Confederate White Knights, the Ku Klos Knights, and the United Northern and Southern Knights of the KKK.
[in-text-ad]

4. Alabama
> Hate groups: 4.7 per million people
> Number of hate groups: 23
> Pct. pop. identifying as white: 68.2% (13th lowest)
> Pct. pop. foreign born: 3.4% (6th lowest)
The number of active hate groups in the United States climbed from 917 in 2016 to 954 in 2017. However, not all states reported an increase. In Alabama, the number of active hate groups fell from 27 in 2016 to 23 last year. Still, the state has among the greatest number and concentration of hate groups in the country.
A focal point of the civil rights movement, Alabama is where Rosa Parks refused to give up her seat at the front of the bus and where Dr. Martin Luther King Jr. participated in the march from Selma to Montgomery. The legacy of racial strife remains today as evidenced by the number of racially motivated hate groups operating in Alabama. Of the 23 active hate groups the SPLC identified in the state, 21 are preoccupied by racial identity. Such groups include five KKK chapters, five neo-Confederate chapters, and six black nationalist groups.
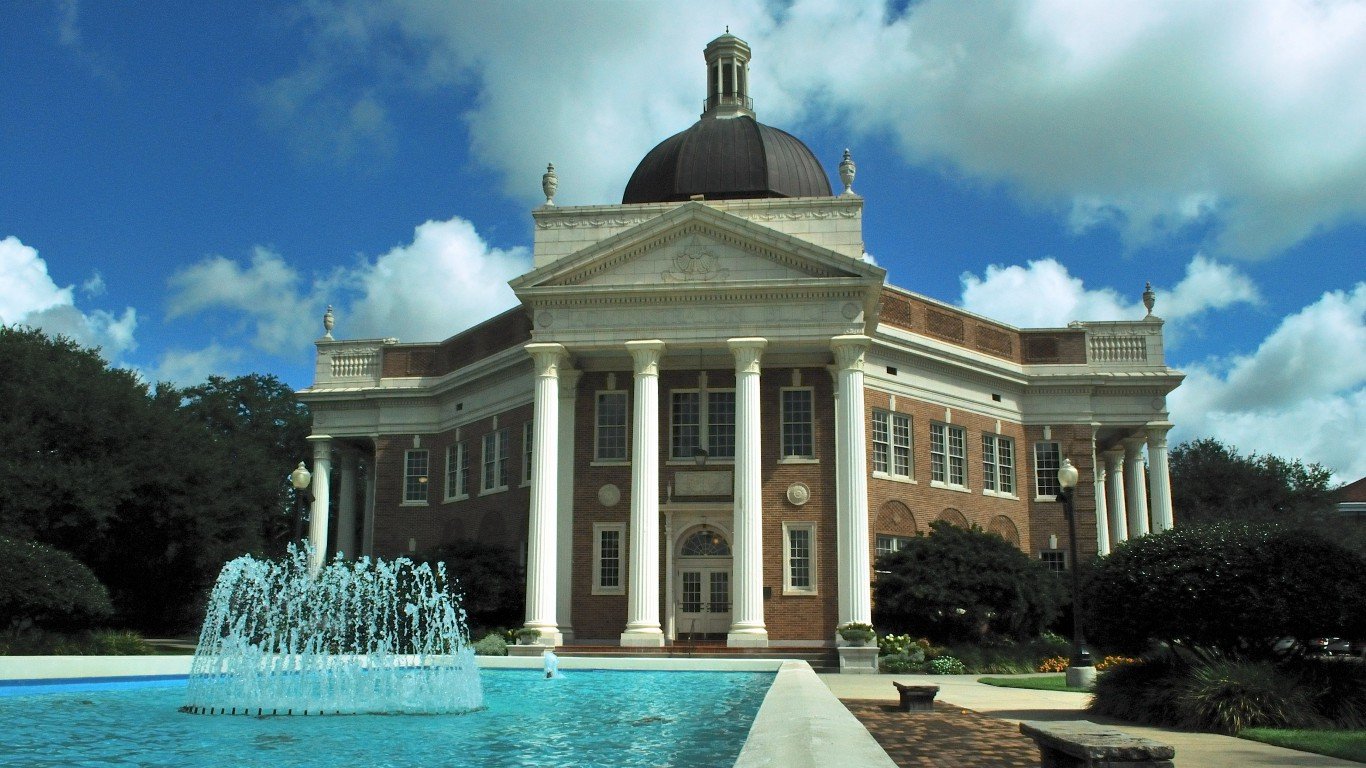
3. Mississippi
> Hate groups: 5.0 per million people
> Number of hate groups: 15
> Pct. pop. identifying as white: 58.5% (3rd lowest)
> Pct. pop. foreign born: 2.0% (2nd lowest)
The number of active hate groups in the United States climbed to 954 in 2017 from 917 the previous year. Much like Alabama, its neighbor to the east, Mississippi represents a break from the national trend. The number of hate groups in the state fell from 18 in 2016 to 15 in 2017. Mississippi still has one of the highest concentrations of hate groups in the country.
Like other parts of the Deep South, hate groups in Mississippi are primarily focused on racial identity. Some 38% of Mississippi’s population identifies as black or African American, the largest share of any state nationwide. Meanwhile, two-thirds of all hate groups in the state are anti-black or white supremacist, including seven chapters of the KKK. The only hate group in Mississippi that is not overtly racist is the American Family Associate, an anti-LGBT group headquartered in Tupelo.

2. Tennessee
> Hate groups: 5.6 per million people
> Number of hate groups: 37
> Pct. pop. identifying as white: 77.8% (25th lowest)
> Pct. pop. foreign born: 4.8% (16th lowest)
The SPLC identifies 37 active hate groups in Tennessee, nearly the most of any state when adjusted for the population. Tennessee has one of the larger U.S-born populations in the country, and many of the hate groups in the state are known to harbor white nationalist or Islamophobic sentiments.
Also as one of the major battlegrounds of the Civil War, Tennessee has the most neo-Confederate hate groups of any state other than Florida, with which it is tied. These include Identity Dixie, several local chapters of League of the South, and the Mary Noel Kershaw Foundation.
[in-text-ad-2]

1. Idaho
> Hate groups: 7.1 per million people
> Number of hate groups: 12
> Pct. pop. identifying as white: 89.7% (7th highest)
> Pct. pop. foreign born: 5.8% (22nd lowest)
One-quarter of the active hate groups in Idaho are overtly anti-Muslim. Anti-Muslim groups in the state include ACT for America operating out of Meridian, the Committee to End the CSI Refugee Center in Buhl, and Pig Blood Bullets in Priest River. Such groups are known for pressuring lawmakers to introduce anti-Sharia law legislation. Anti-Sharia law proposals serve little purpose beyond vilifying Muslims, as the U.S. Constitution already denies authority to any foreign law. Earlier this year, the Idaho House passed a bill sponsored by Rep. Eric Redman — who has warned for years of the potential for Sharia influence in U.S. courts — banning the application of foreign laws in Idaho courts.
Other hate groups identified by the SPLC in the state include multiple groups espousing white nationalist ideology and one Christian identity group.
Detailed Findings
According to the Southern Poverty Law Center, racially motivated hatred is being stoked by President Donald Trump. Considering the president’s appointment of advisors with ties to the radical right; his use of disparaging language in reference to African nations; and tone-deaf tweets following a deadly white supremacist rally in Charlottesville, Virginia — white nationalist groups are emboldened.
Of all hate groups espousing a white supremacist ideology, neo-Nazi groups grew the fastest, from 99 groups in 2016 to 121 in 2017.
The bulk of the increase in the number of hate groups operating in the United States appears to be a backlash to the reinvigorated white supremacy movement. Black nationalist groups are characterized by anti-white and anti-Semitic views, and they generally oppose integration and interracial marriage. The number of such groups in the United States climbed from 193 in 2916 to 233 in 2017, the largest increase of any hate group ideology.
Increasing numbers of neo-Nazi and black nationalist groups juxtapose a decline in the number of Ku Klux Klan chapters — the oldest hate group in the United States. The SPLC counted 72 KKK chapters in 2017, down from 130 the previous year and the lowest in at least the last 18 years. Still, the KKK maintains a strong presence in the South, particularly in Alabama and Mississippi.
In some of the states with high concentrations of hate groups, there is a centuries-long history of hate. In the early 20th century, for example, Indiana was a stronghold of the national Ku Klux Klan movement. With an estimated membership of 250,000 by 1923, the Indiana Klan had the largest KKK membership in the country, which included the governor of the state, more than half the state legislature, and 30% of the state’s white male population. While the KKK’s power and membership has declined since, there are still several active hate groups affiliated with the Ku Klux Klan in Indiana today.
Similarly, although Tennessee was the last state to secede from the Union, a majority of the Civil War was fought in the state and in Virginia. Today the SPLC counts six active hate groups affiliated with the neo-Confederate ideology in Tennessee, tied with Florida as the most of any state.
Few states were a greater hotbed of racial tension during the civil rights movement than Alabama. Over the decade since the Montgomery Bus Boycott in 1955 to the Selma to Montgomery Marches in 1965, the American public was made aware of how African Americans were being treated in the South. These events and others marked defining moments of the civil rights movement. The legacy of racial tension is still apparent today, evidenced by the large number of racially charged hate groups in the state. Of the 23 active hate groups the SPLC identified in the state, 21 are preoccupied by racial identity.
Methodology
To identify the states with the highest concentration of hate groups, 24/7 Wall St. reviewed the number of hate groups in each state for every 1 million state residents according to data provided by non-profit civil rights advocacy group Southern Poverty Law Center. To be considered for our ranking, a state needed to have at least 10 active hate groups. Rather than reviewing such factors as history of violence, SPLC identifies hate groups by ideology. These organizations claim that entire groups of human beings are evil by virtue of their class characteristics (e.g., race, religion, origin, gender and so on). For the SPLC, to be considered, groups also needed to be active in the year they are listed. Activity is deemed as on-the-ground activity such as holding rallies or simply accepting memberships and selling literature. SPLC provided the names of all hate groups tracked in each state for every year between 2000 and 2017.
We also reviewed the foreign-born population in each state (the immigrant population), as well as a range of social and economic data, including the percentage of adults 25 and over with at least a bachelor’s degree, the percentage of each state’s population that is white, poverty rates, and median household income. These data came from the U.S. Census Bureau’s 2016 American Community Survey. Annual unemployment rates for 2016 came from the Bureau of Labor Statistics.
Sponsored: Attention Savvy Investors: Speak to 3 Financial Experts – FREE
Ever wanted an extra set of eyes on an investment you’re considering? Now you can speak with up to 3 financial experts in your area for FREE. By simply
clicking here you can begin to match with financial professionals who can help guide you through the financial decisions you’re making. And the best part? The first conversation with them is free.
Click here to match with up to 3 financial pros who would be excited to help you make financial decisions.
Thank you for reading! Have some feedback for us?
Contact the 24/7 Wall St. editorial team.

