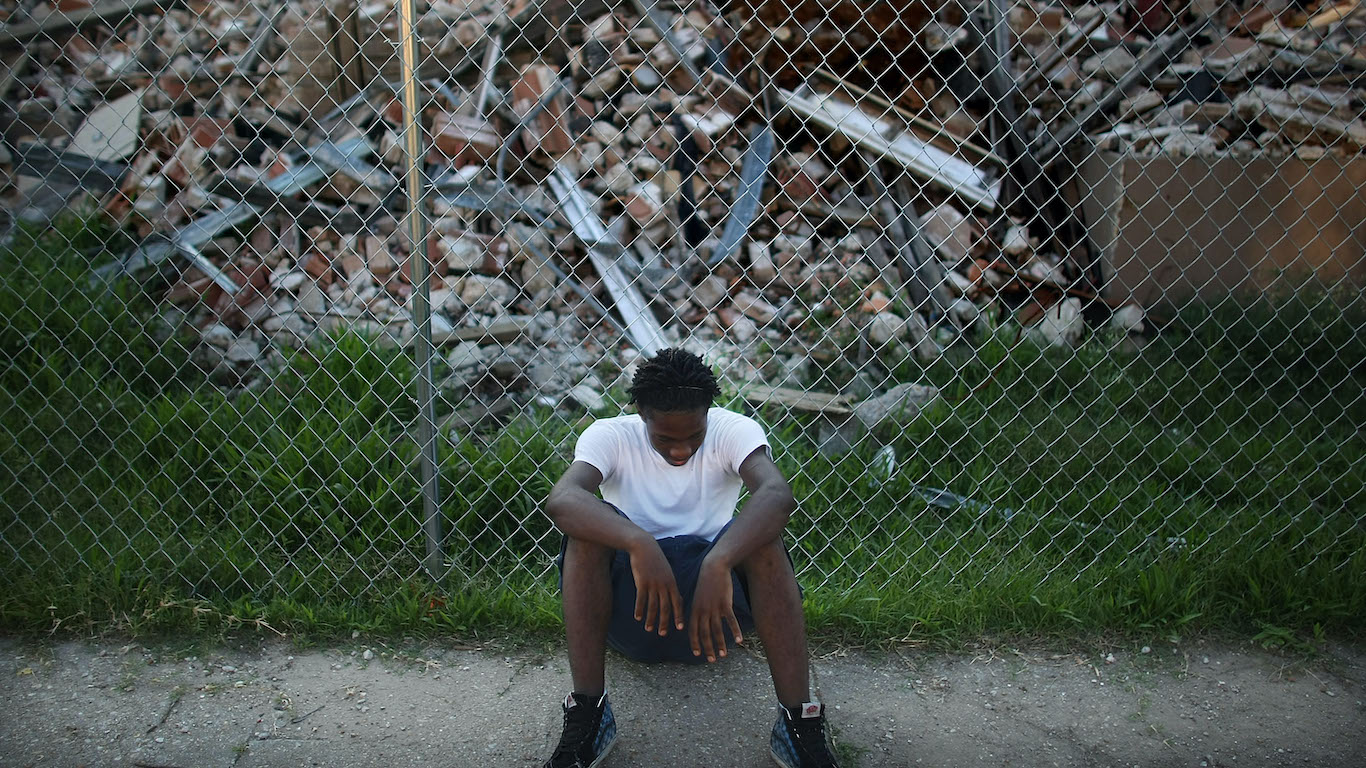
The unemployment rate for black Americans fell below 6.0% for the first time in history earlier this year. The historic dip in joblessness was a benchmark of progress in the continued pursuit of racial equality in the United States — and a reminder of the unique challenges black Americans face every day.
The black unemployment rate has hovered above the overall unemployment rate by several percentage points since the Bureau of Labor Statistics began tracking it over 40 years ago. Racial disparities in America do not stop with the labor market.
The median annual income among black households in the United States is just $36,651, about $24,000 shy of the median income among white households. Black Americans are also less likely to own a home, less likely to have a college education, and five times more likely to be incarcerated than white Americans.
Click here to see the worst cities for black Americans.
Disparities in socioeconomic measures exist to some degree nationwide. However, in certain cities, gaps in outcomes along racial lines are chasmic. 24/7 Wall St. created an index based on racial disparities in eight socioeconomic measures in U.S. metro areas to identify the worst cities for black Americans.
In an interview with 24/7 Wall St., Camille M. Busette, a senior fellow at the Brookings Institution, laid out some of the causal factors behind these disparities in the cities on this list. “Looking historically, these are cities where there is a tremendous amount of residential segregation,” Busette said.
The cities on this list are largely concentrated in the Midwest and have long histories of systemic racial segregation. Though about half a century has passed since the Fair Housing Act legally banned discriminatory lending, zoning, and renting practices, such practices persist in much of the country in less overt ways.
Busette described the day-to-day implications of segregation. “People are not walking around, working together, going to school together, taking the same metro together, et cetera. So there isn’t a lot of familiarity.”
This kind of segregation can have profound consequences for labor markets. “People tend to hire people like themselves, so when you get residential segregation, you tend to also get employment segregation,” Busette said.
Segregation serves to perpetuate inequality in other ways as well. “Where you have residential segregation and where you have large percentages of poor black populations, the schools that service those neighborhoods tend to be substandard relative to white neighborhoods,” Busette said.
Second-rate schools in black neighborhoods in many of the cities on this list result in lower educational attainment rates — which in turn contribute to disparities in other measures like income, unemployment, and incarceration.
Methodology
To determine the 15 worst cities for black Americans, 24/7 Wall St. created an index consisting of eight measures to assess race-based gaps in socioeconomic outcomes in each of the nation’s metropolitan areas. Creating the index in this way ensured that cities were ranked on the differences between black and white residents and not on absolute levels of socioeconomic development. For each measure, we constructed an index from the gaps between black and white Americans. The index was standardized using interdecile normalization so outliers in the data did not skew results. We excluded metro areas where black residents comprised less than 5% of the population or where data limitations made comparisons between racial groups impossible.
Within the index, we considered 2016 data from the U.S. Census Bureau’s American Community Survey on median household income, poverty, adult high school and bachelor’s degree attainment, homeownership, and unemployment rates. All ACS data are five-year estimates. Data on incarceration rates came from The Sentencing Project, a nonprofit dedicated to criminal justice reform, and are for the most recent available year. Because states, rather than metro areas, are responsible for the prison population, incarceration rates are for the state where the metro area is located. If a metro area spans more than one state, we used the state in which the metro area’s principal city is located. From the Centers for Disease Control and Prevention, we used age-adjusted mortality rates by race for each U.S. county from 2012-2016 to calculate mortality rates at the metro level using a variation on the indirect standardization method. Incarceration and mortality rates are per 100,000 residents.
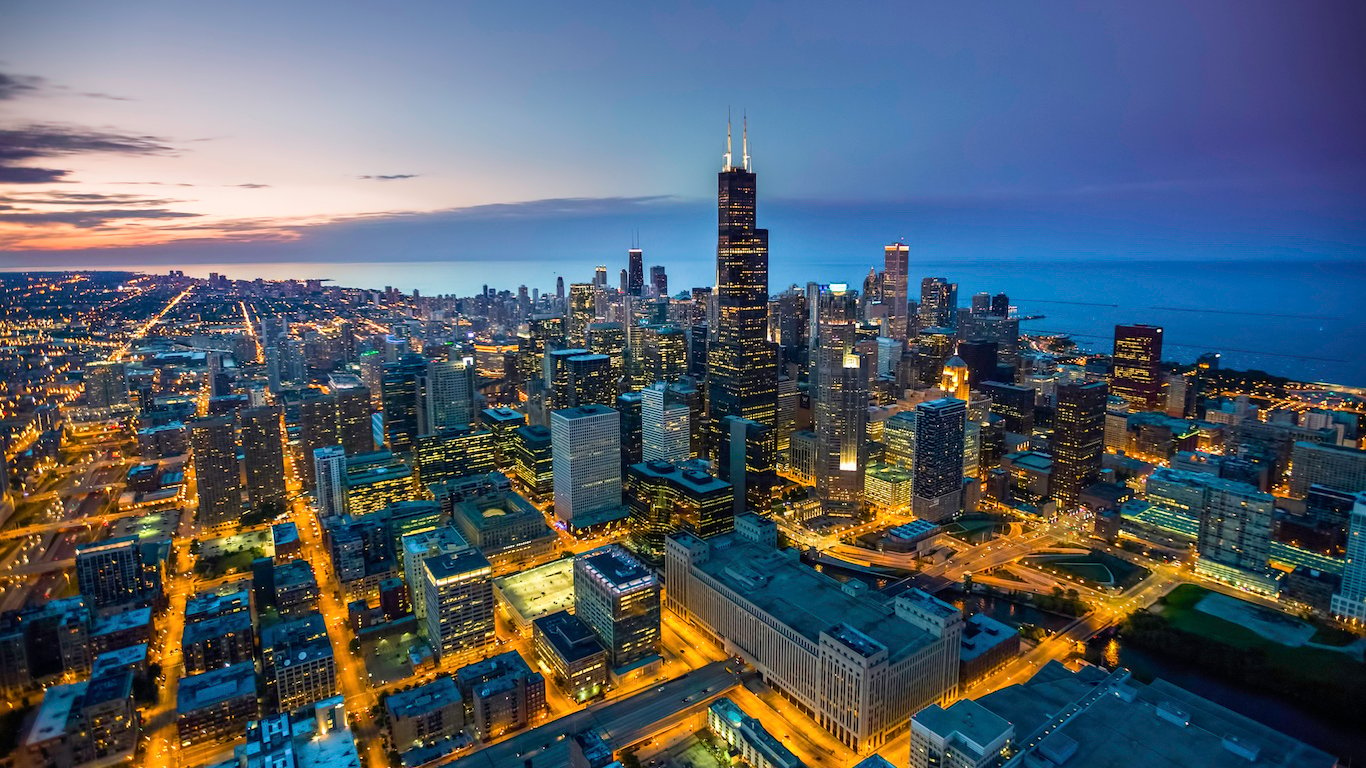
15. Chicago-Naperville-Elgin, IL-IN-WI
> Black population: 1.6 million (16.9%)
> Black median income: $36,017 (47.3% of white income)
> Unemployment: 18.7% black; 5.8% white
> Homeownership rate: 39.9% black; 74.6% white
A history of exclusionary zoning, redlining, and discriminatory lending practices in Chicago throughout the 20th century has led to deeply entrenched segregation in the Midwestern metropolis and contributed to some of the largest racial disparities in income, education, and health of any U.S. metro area. While nationwide the typical black household earns 60.1% of the income the typical white household earns, in Chicago the typical black household earns just 47.3% of the typical white household’s income. Just 21.3% of black adults in Chicago have a college degree, less than half the 43.7% of white adults with a degree. Additionally, the black unemployment rate is more than three times the white unemployment rate.
[in-text-ad]
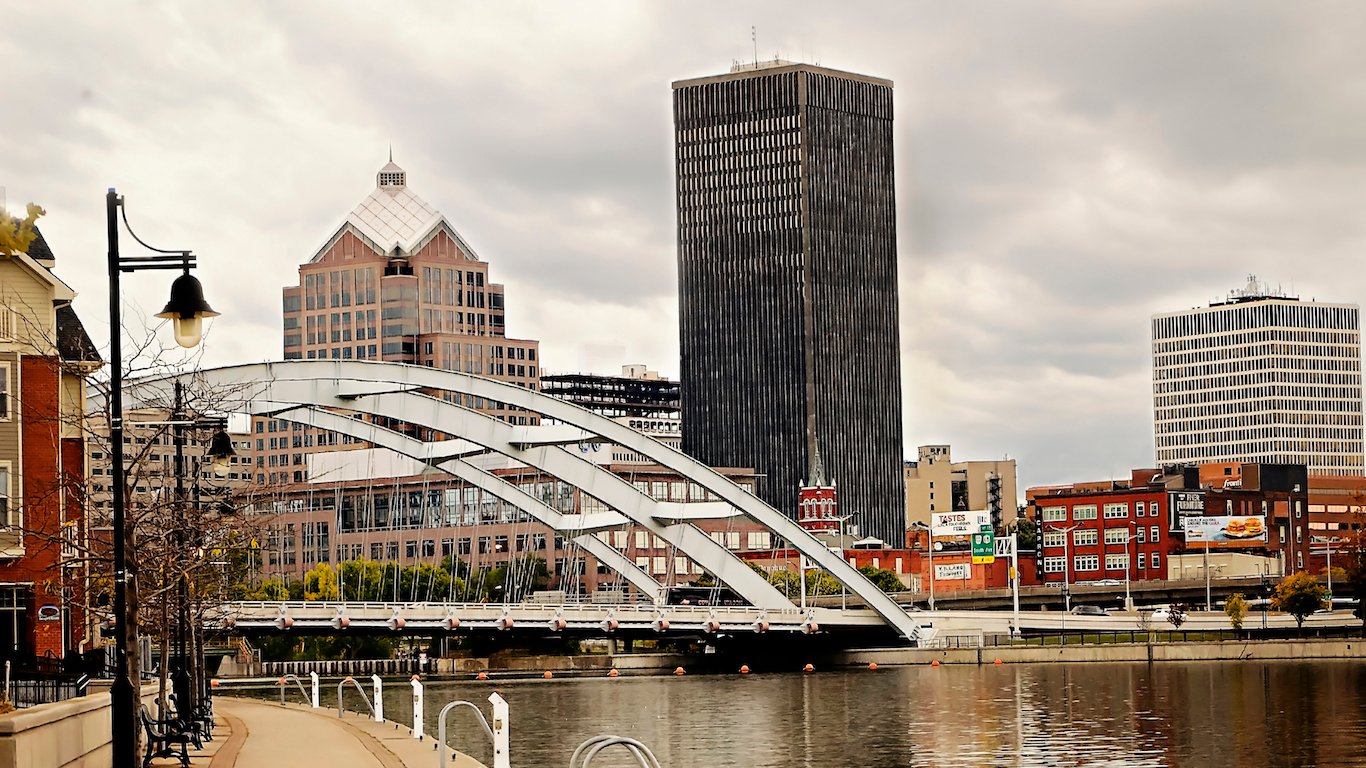
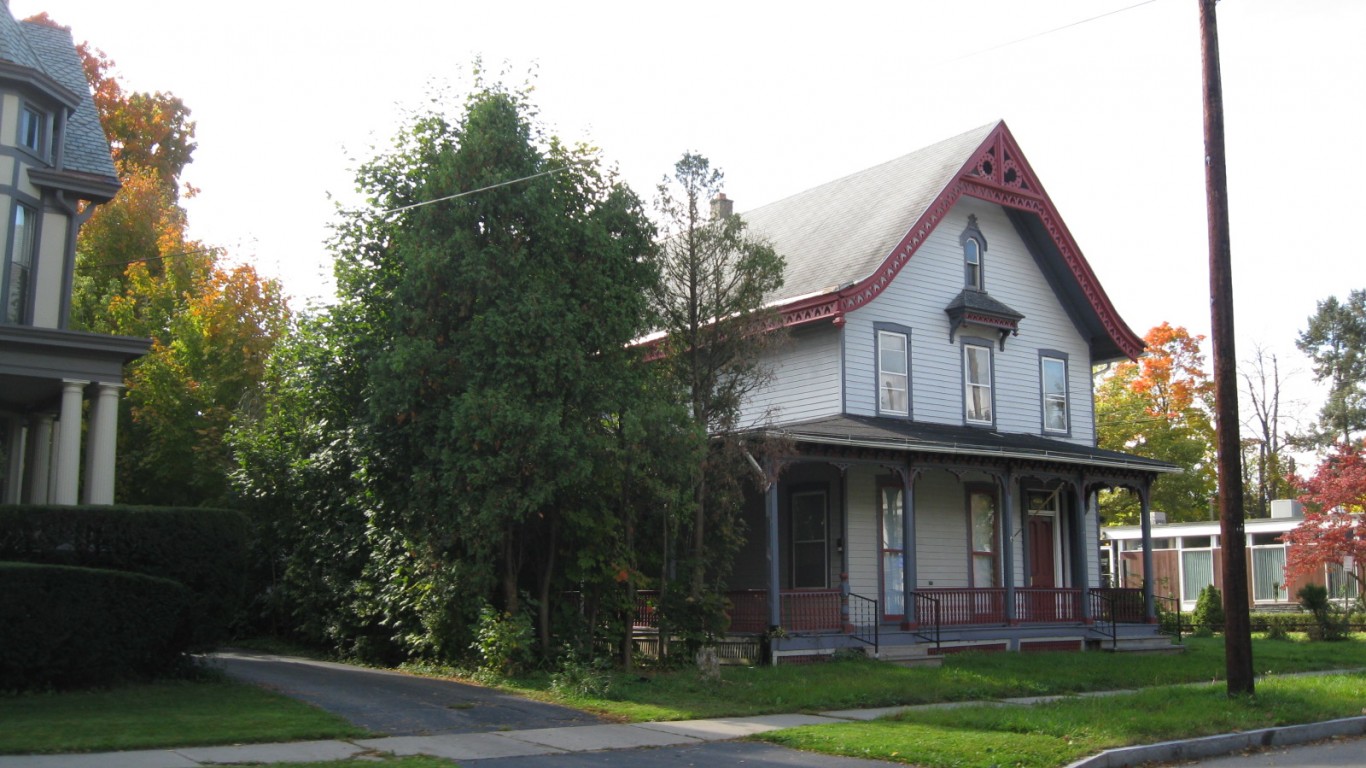
14. Rochester, NY
> Black population: 124,911 (11.5%)
> Black median income: $28,681 (48.7% of white income)
> Unemployment: 16.3% black; 5.4% white
> Homeownership rate: 32.3% black; 73.9% white
A recent report by the Civil Rights Project of the University of California, Los Angeles, found that segregation persists de facto in the Rochester metro area’s schools. From 1990 to 2010, white enrollment in Rochester’s inner-city public schools fell from more than 34% to just 15%. As white families relocated to the suburbs, the share of black students in urban Rochester schools climbed from 49% to 60%.
Segregated schools can perpetuate economic and social inequality. In Rochester just 78.8% of black adults have a high school diploma compared to 93.1% of white adults — nearly double the nationwide attainment gap. The median income for black area households of $28,681 a year is less than half the white median household income of $58,885 a year.
[recirclink id=488456]

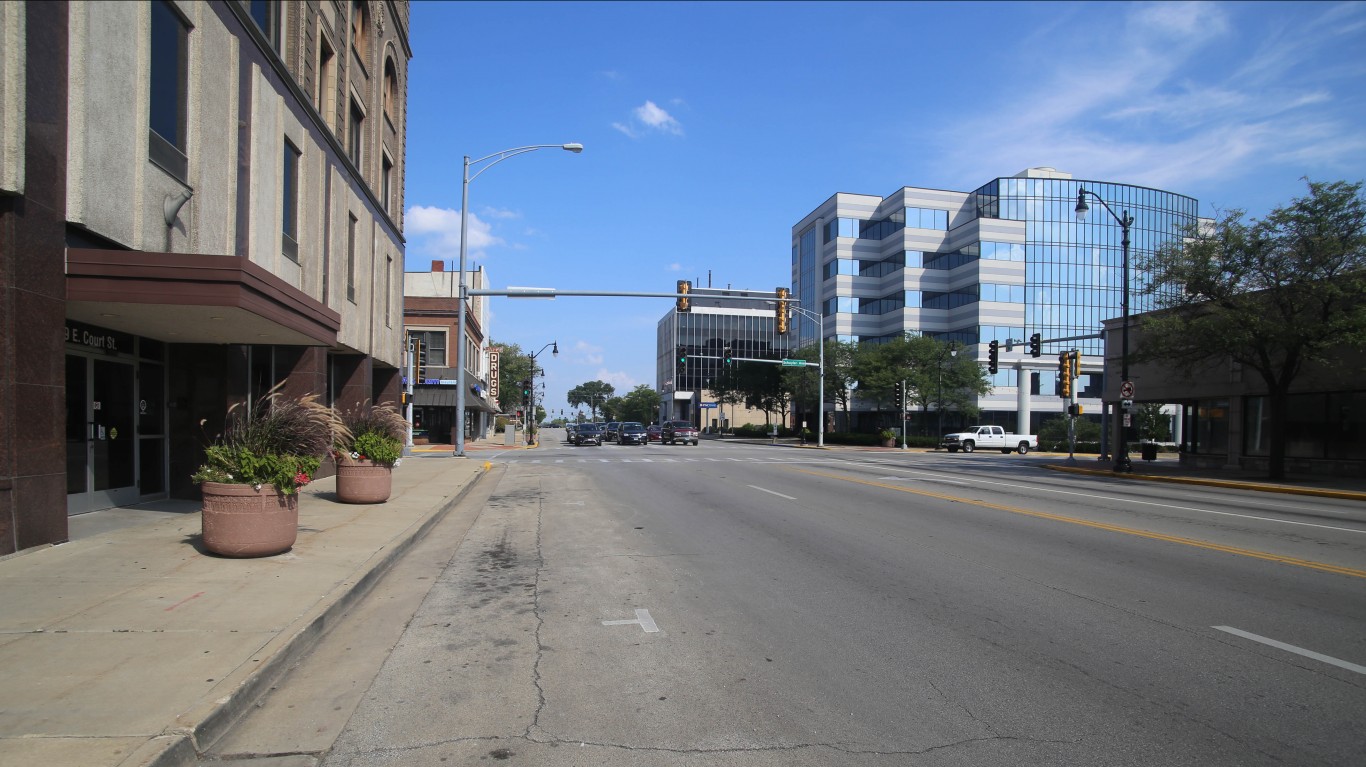
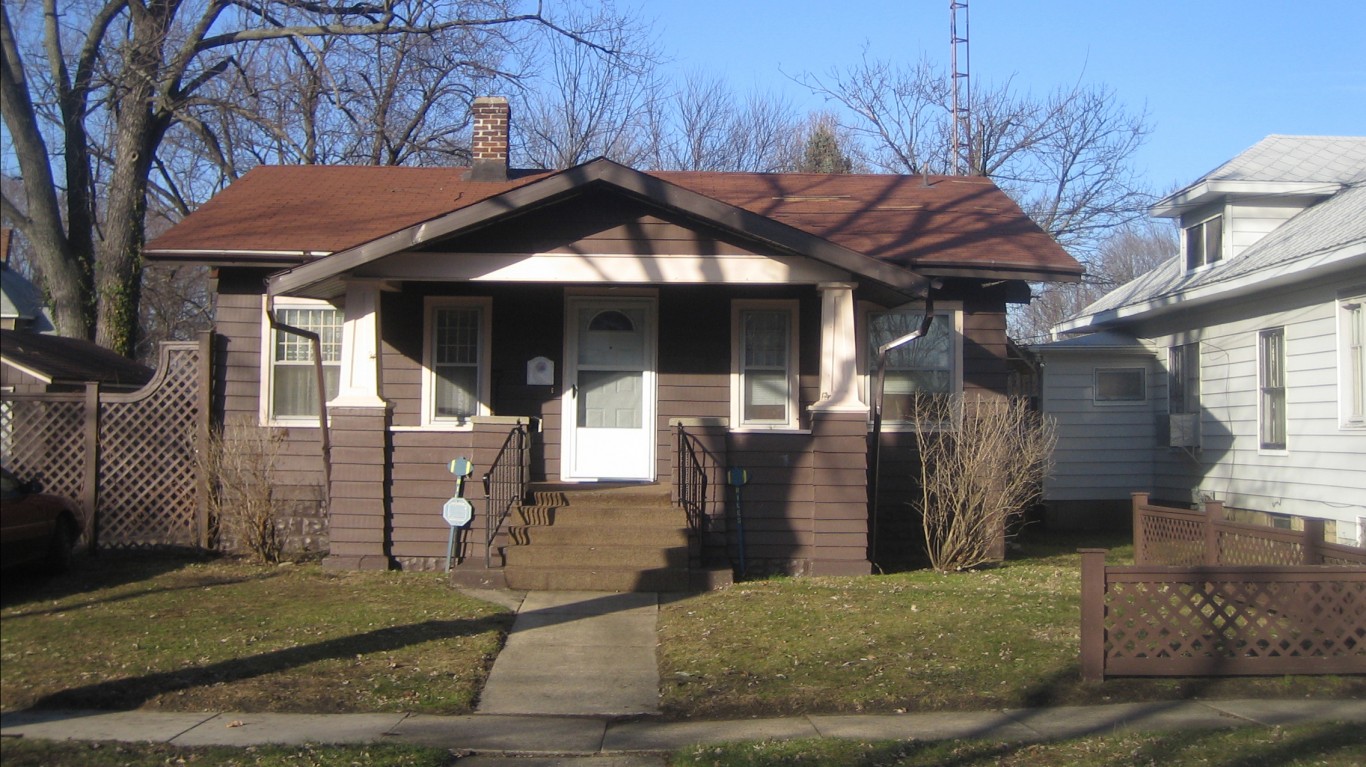
13. Danville, IL
> Black population: 10,946 (13.7%)
> Black median income: $24,504 (52.1% of white income)
> Unemployment: 22.5% black; 8.1% white
> Homeownership rate: 31.0% black; 75.0% white
Danville is one of several metro areas in Illinois in which the gaps in income, education, and health between white and black residents are among the widest in the country. The typical black household earns $24,504 a year, about half the income the typical white household earns of $47,054 a year. Just 31.0% of black heads of household own their homes, compared to the white homeownership rate of 75.0%.
One factor contributing to the large disparities in income and homeownership in Danville may be the high unemployment rate among black workers in the area. According to recent Census figures, 22.5% of the black workforce in Danville is unemployed, the sixth highest share of any U.S. metro area and nearly three times the area’s 8.1% white unemployment rate.
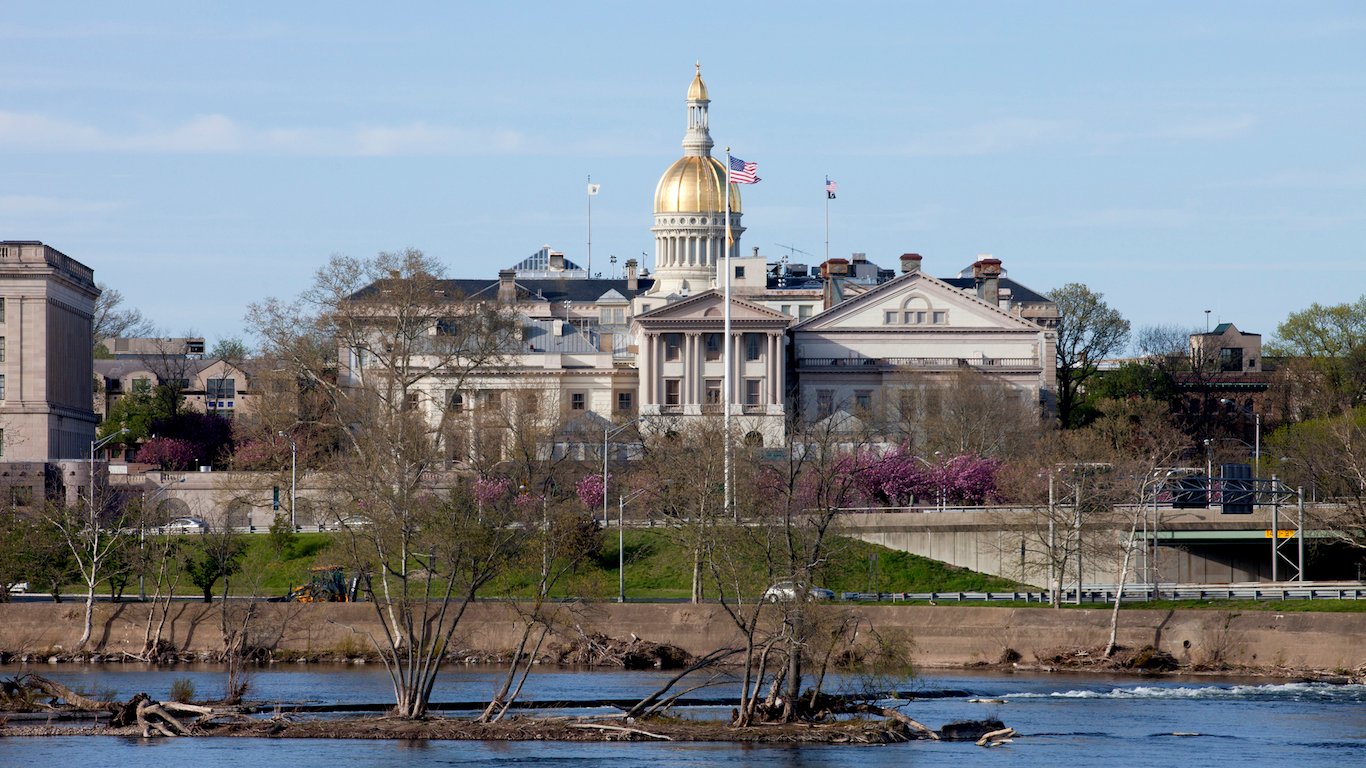
12. Trenton, NJ
> Black population: 75,905 (20.5%)
> Black median income: $43,393 (47.7% of white income)
> Unemployment: 15.6% black; 6.2% white
> Homeownership rate: 40.6% black; 76.3% white
In the Trenton metro area, gaps in socioeconomic measures such as income and poverty are partially rooted in disparities in educational attainment. While the 48.0% white college attainment rate in Trenton is far greater than the 33.8% national figure, the 18.2% black college attainment rate is below the 20.0% national figure. Those with lower educational attainment have lower earnings potential and are less likely to accumulate wealth over their lifetimes. The typical black household in Trenton earns $43,393 a year, less than half the median income for white households of $91,008 a year.
Trenton is the capital of the state with the largest black-white disparity in incarceration in the country. According to data from the Sentencing Project, a criminal justice reform advocacy group, black Americans are incarcerated at approximately five times the rate of white Americans nationwide. In New Jersey, the black incarceration rate is more than 12 times the rate for whites in the state.
[in-text-ad-2]
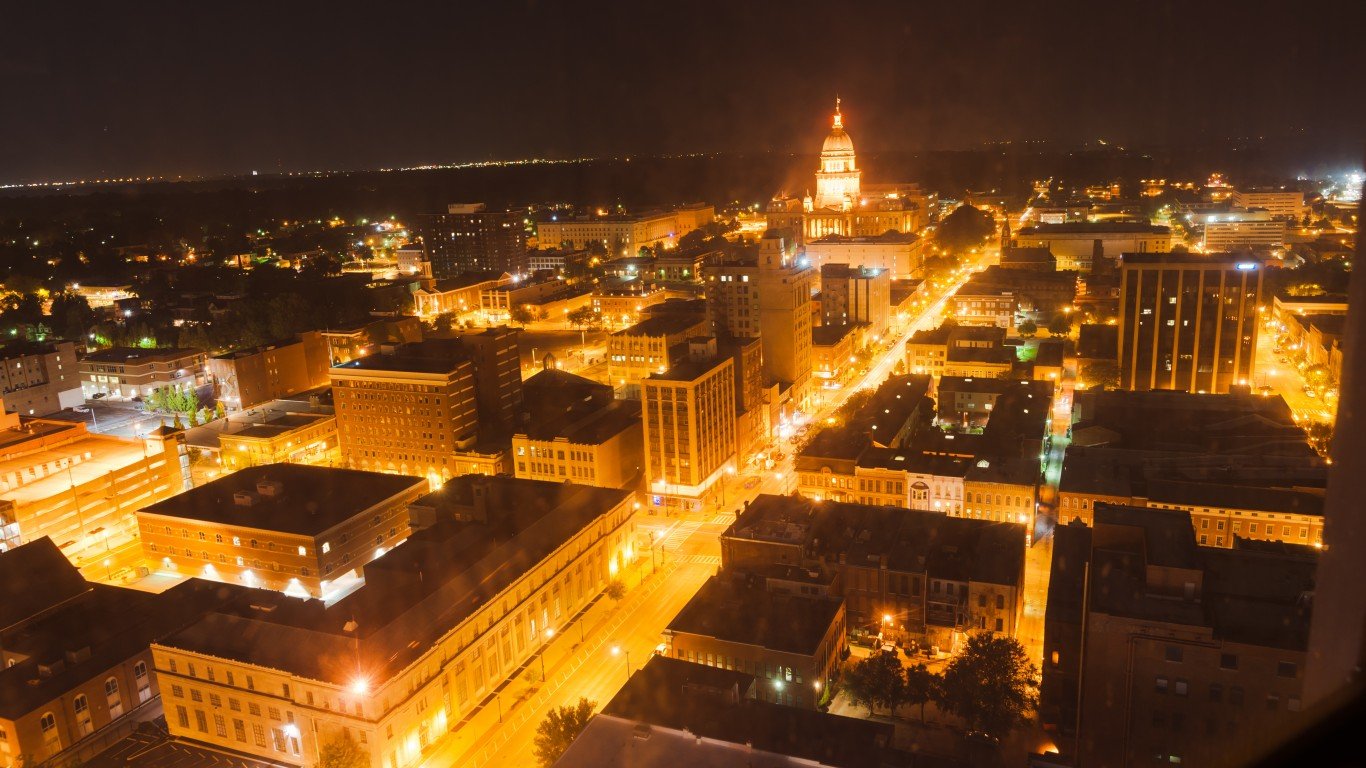
11. Springfield, IL
> Black population: 25,242 (12.0%)
> Black median income: $27,197 (43.9% of white income)
> Unemployment: 18.8% black; 5.8% white
> Homeownership rate: 30.6% black; 75.8% white
Across Illinois, black residents are nine times more likely than white residents to be incarcerated. A high incarceration rate can reduce the earning potential of affected families, and may be one of the many factors contributing to economic and social inequality in Illinois’ capital. The typical black household in Springfield earns $27,197 a year, less than half the median annual income of $61,976 for white households. A criminal record can also reduce the likelihood of finding employment, and the unemployment rate among black workers in Springfield stands at 18.8%, more than triple the white unemployment rate of 5.8%.
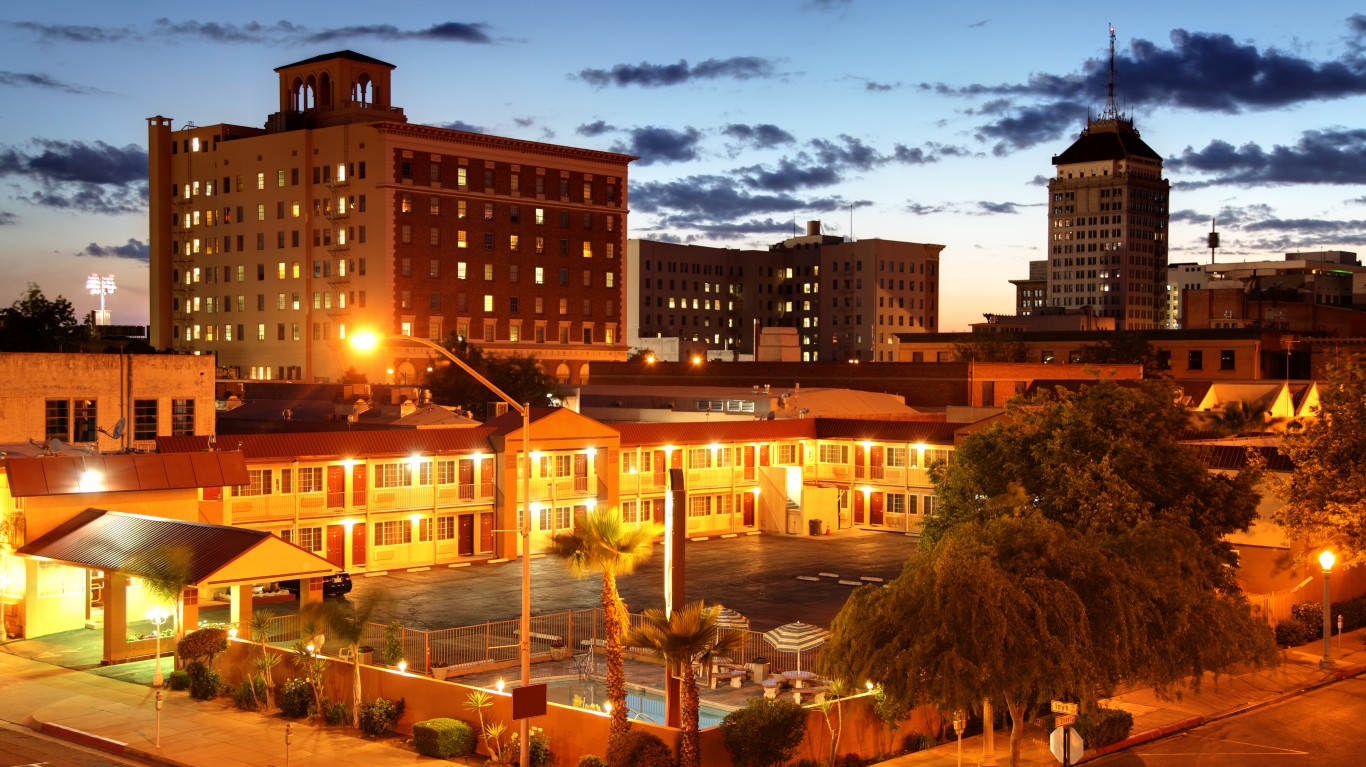
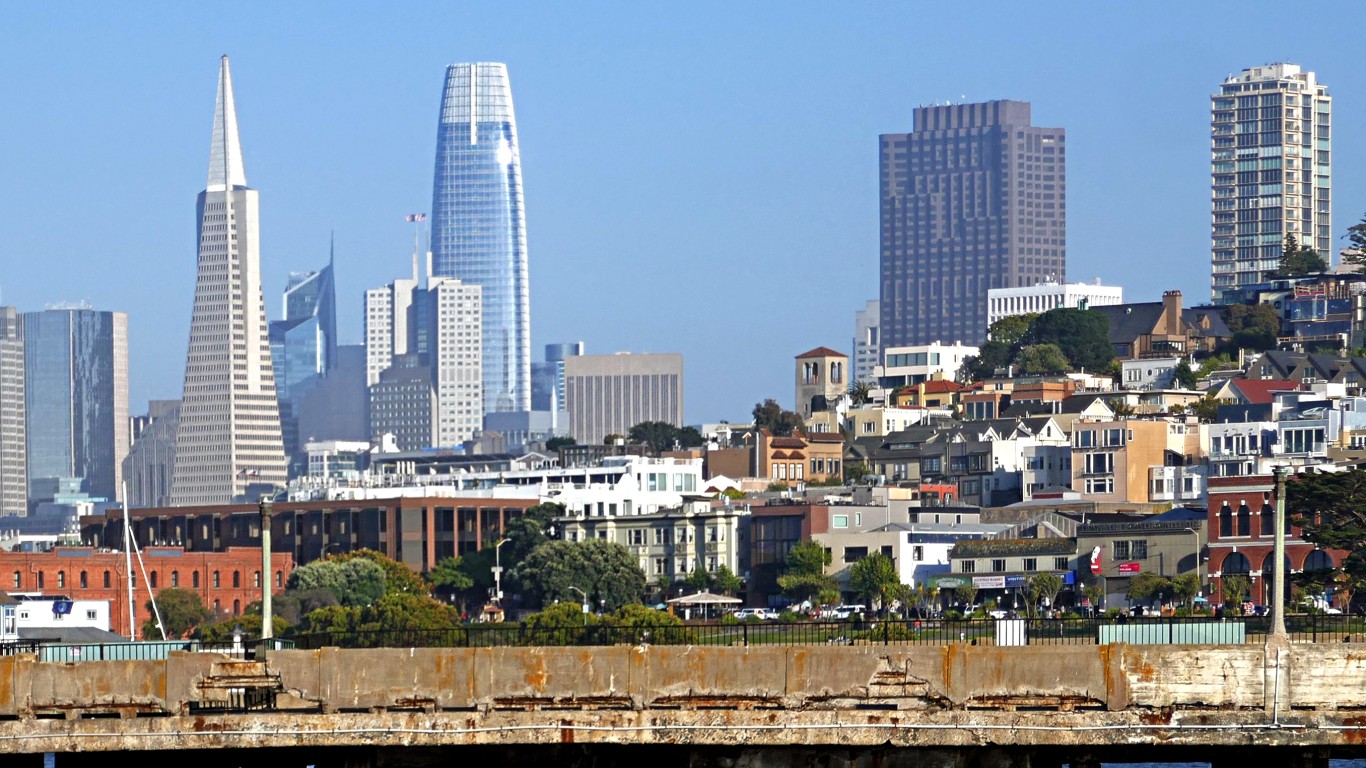
10. Fresno, CA
> Black population: 48,434 (5.0%)
> Black median income: $25,895 (42.2% of white income)
> Unemployment: 22.3% black; 8.9% white
> Homeownership rate: 25.1% black; 66.5% white
Fresno is the only West Coast metro area to rank among the worst cities for black Americans. In Fresno, like many U.S. cities, much of the overt housing segregation of the 20th century is evident today. Many of the city’s black and minority residents live in west Fresno, while the wealthier, largely white population lives in northern and eastern sections of the metro area. The construction of Highway 99 through Central Valley in the 1950s created a physical barrier between east and west Fresno, further concentrating poverty in minority neighborhoods. Today, 41.2% of black residents live in poverty, one of the largest shares of any city and more than three times the 13.0% white poverty rate.
According to a recent study by the California Environmental Protection Agency, life expectancy in Fresno varies by as much as 20 years between the city’s richest and poorest neighborhoods. With socioeconomic disparities largely divided along racial lines, so are health inequities. The black mortality rate of 908 deaths per 100,000 residents is nearly 20% greater than the white mortality rate of 750 deaths per 100,000 residents.
[in-text-ad]
9. Kankakee, IL
> Black population: 16,908 (15.2%)
> Black median income: $28,816 (47.5% of white income)
> Unemployment: 19.8% black; 6.2% white
> Homeownership rate: 34.5% black; 76.6% white
More than two in every five black residents of Kankakee, Illinois, live below the poverty line, compared to fewer than one in every 10 white residents. Disparities in poverty rates along racial lines tend to be higher in highly segregated areas, and Kankakee has some of the most racially segregated neighborhoods in Illinois.
While segregated schools were outlawed as the result of the Brown v. Board of Education Supreme Court decision in 1954, the concentration of minorities in poor neighborhoods and inequitable distribution of resources can result in predominantly black and underfunded schools that put their students at a substantial disadvantage. In Kankakee, fewer than 80% of black adults have a high school diploma compared to more than 90% of white adults.
[recirclink id=488594]
8. Niles-Benton Harbor, MI
> Black population: 22,985 (14.8%)
> Black median income: $22,757 (44.2% of white income)
> Unemployment: 17.4% black; 6.2% white
> Homeownership rate: 34.6% black; 76.8% white
Niles-Benton Harbor is the only metro area in Michigan to rank among the worst places for black Americans. Segregation can significantly deepen socioeconomic gaps along racial lines, and Niles-Benton Harbor is one of the most segregated cities in the country. Nearly half of all black metro area residents in Niles-Benton Harbor live in predominantly black neighborhoods, more than twice the national share.
Nearly 42% of the city’s black population lives below the poverty line, a higher black poverty rate than in all but 11 other metro areas nationwide. Meanwhile, 12.4% of white area residents live below the poverty line. The white-black poverty gap in Niles-Benton Harbor may be exacerbated in part by the metro area’s wide unemployment disparity. The area’s black unemployment rate stands at 17.4%, well more than double the 6.2% white unemployment rate.
7. Decatur, IL
> Black population: 15,319 (14.1%)
> Black median income: $21,871 (42.3% of white income)
> Unemployment: 21.7% black; 7.4% white
> Homeownership rate: 36.4% black; 75.9% white
Decatur is one of several Illinois metro areas to rank among the worst cities for black Americans. Just 77.6% of black adults in Decatur have a high school diploma, far less than the 91.8% of white adults who have a high school diploma. Individuals with less educational attainment tend to have lower earning potential, leading to similar disparities in income, unemployment, and other socioeconomic measures.
The 21.7% black unemployment rate in Decatur is nearly triple the 7.4% white unemployment rate. The typical black household in Decatur earns just $21,871 a year, less than half the white median household income of $51,662 a year. Black Decatur residents are also less likely to have as much in the way of material assets that white residents do. For example, the black homeownership rate in Decatur of 36.4% is less than half the white homeownership rate of 75.9%.
[in-text-ad-2]
6. Elmira, NY
> Black population: 5,143 (5.9%)
> Black median income: $21,767 (42.6% of white income)
> Unemployment: 15.9% black; 5.0% white
> Homeownership rate: 22.4% black; 71.7% white
Elmira, New York, has a relatively small black population. Just 5.9% of the nearly 88,000 area residents are black. For reference, 12.6% of the U.S. population is black. The gaps in some socioeconomic outcomes between white and black Elmira residents are among the largest in the country.
The typical black household in Elmira earns just $21,767 a year, less than half the income of the typical white household of $51,101 a year. Black Elmira residents are also less likely to have as much in the way of material assets that white residents do. For example, the homeownership rate among black Elmira residents is just 22.4% compared to 71.7% among white residents.
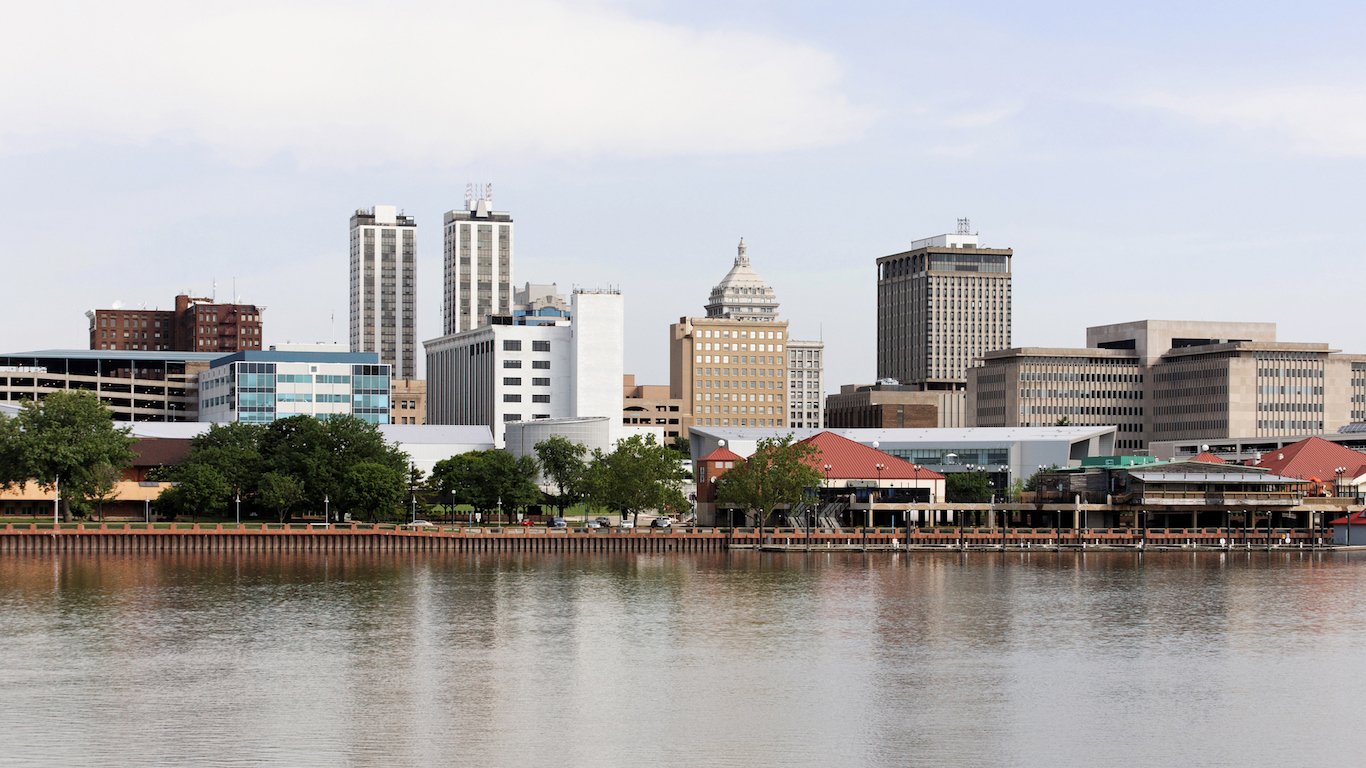
5. Peoria, IL
> Black population: 34,462 (9.1%)
> Black median income: $27,085 (45.6% of white income)
> Unemployment: 17.9% black; 5.6% white
> Homeownership rate: 31.4% black; 76.1% white
Peoria, Illinois, is one of many cities on this list with a long history of segregation, the effects of which linger today. Black Peoria residents are much more likely to struggle financially and far more likely to face difficulty finding employment than white Peoria residents. The metro area’s black poverty rate is 37.0% — higher than the national black poverty rate of 26.2% and well above the metro area’s white poverty rate of 9.2%. Additionally, 17.9% of the metro area’s black labor force is out of a job compared to a white unemployment rate of just 5.6%.
While segregated housing has been illegal nationwide since the passage of the Fair Housing Act of the Civil Rights Act of 1968, a recent federal lawsuit alleges that there are still housing codes in place in Peoria being used to unlawfully target African Americans. Filed in August 2017 by the Illinois-based nonprofit HOPE Fair Housing Center, the lawsuit claims that Peoria’s chronic nuisance ordinance, which requires landlords to evict tenants from homes that have been the subject of multiple police contacts, is being selectively enforced in predominantly black neighborhoods.
[in-text-ad]
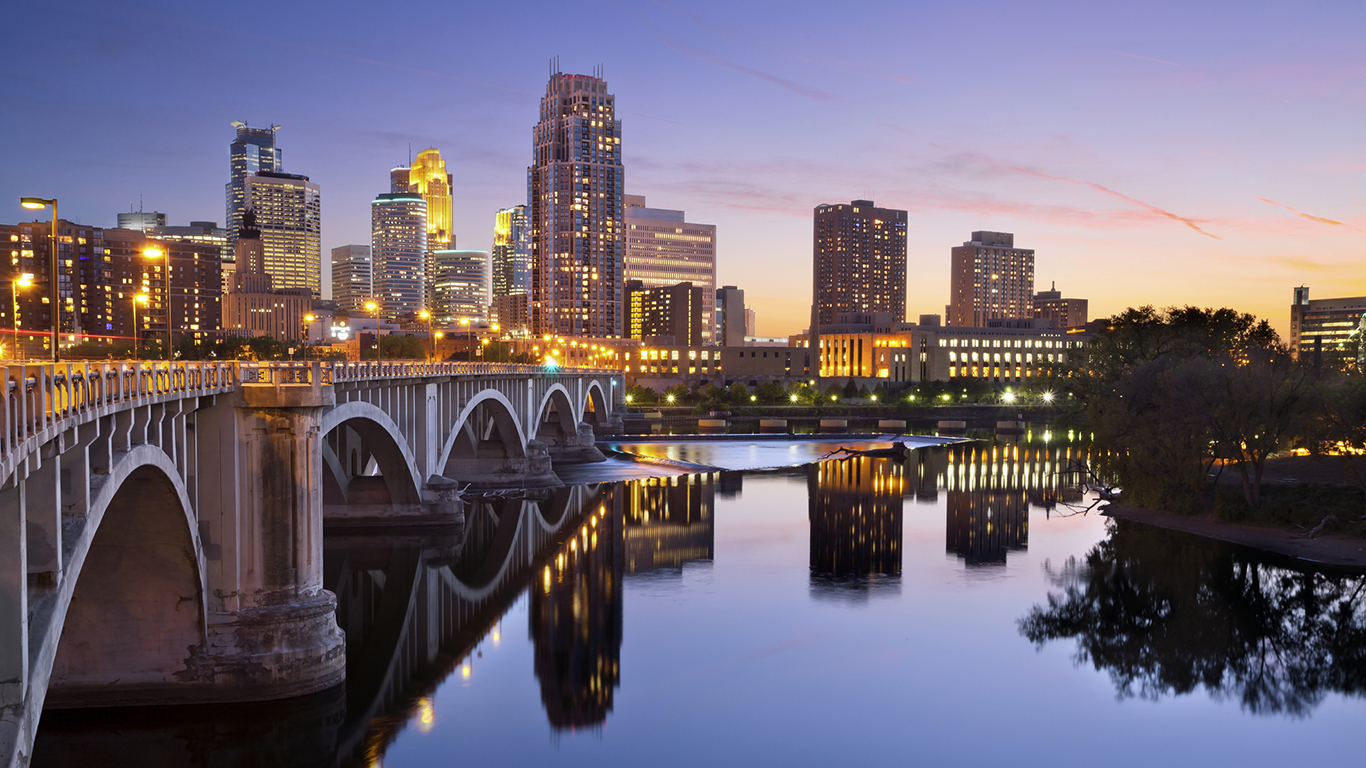
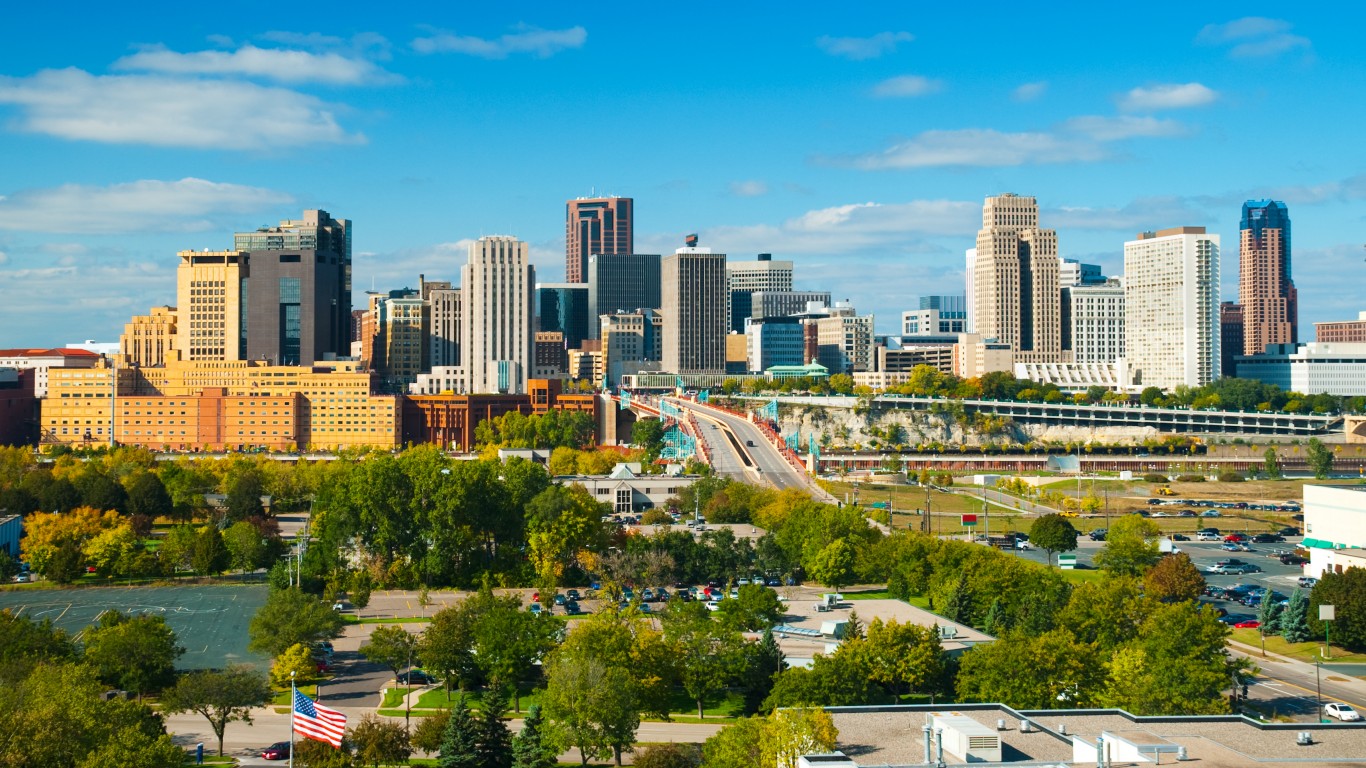
4. Minneapolis-St. Paul-Bloomington, MN-WI
> Black population: 270,924 (7.8%)
> Black median income: $31,653 (41.5% of white income)
> Unemployment: 12.3% black; 3.9% white
> Homeownership rate: 24.6% black; 75.8% white
The Minneapolis-St. Paul-Bloomington metro area is one of several Midwestern cities that enacted restrictive housing covenants and exclusionary zoning policies in the 20th century. These policies still impact residential patterns today. The city is highly segregated by race and has some of the largest disparities in poverty, income, and homeownership between black and white residents of any U.S. metro area.
While the 6.0% white poverty rate in Minneapolis is far lower than the comparable 10.6% national figure, the 32.0% black poverty rate is above the 26.2% national figure. Additionally, the typical black household in the area earns $31,653 a year, just 41.5% of the white median household income of $76,208. Disparity in homeownership is even more stark. The 24.6% black homeownership rate in the Twin Cities metro area is less than a third of the 75.8% white homeownership rate.
[recirclink id=488561]
3. Racine, WI
> Black population: 21,450 (11.0%)
> Black median income: $26,888 (42.3% of white income)
> Unemployment: 16.6% black; 6.1% white
> Homeownership rate: 31.4% black; 77.1% white
Racine, Wisconsin, is one of several Rust Belt cities where social and economic outcomes for black residents fall well behind those of white area residents. For example, the typical black household in the Racine metro area earns just $26,888 a year, less than half the $63,507 annual income the typical white household in the area earns.
Racial disparities in the metro area may be made worse by disproportionate incarceration rates. In Wisconsin, black residents are nearly 12 times more likely to be imprisoned than white residents. For reference, the black incarceration rate is five times the white incarceration rate nationwide. The effects of incarceration are far reaching, as adults with a criminal record are less likely to find employment, and households with a family member in jail have one less potential income earner.
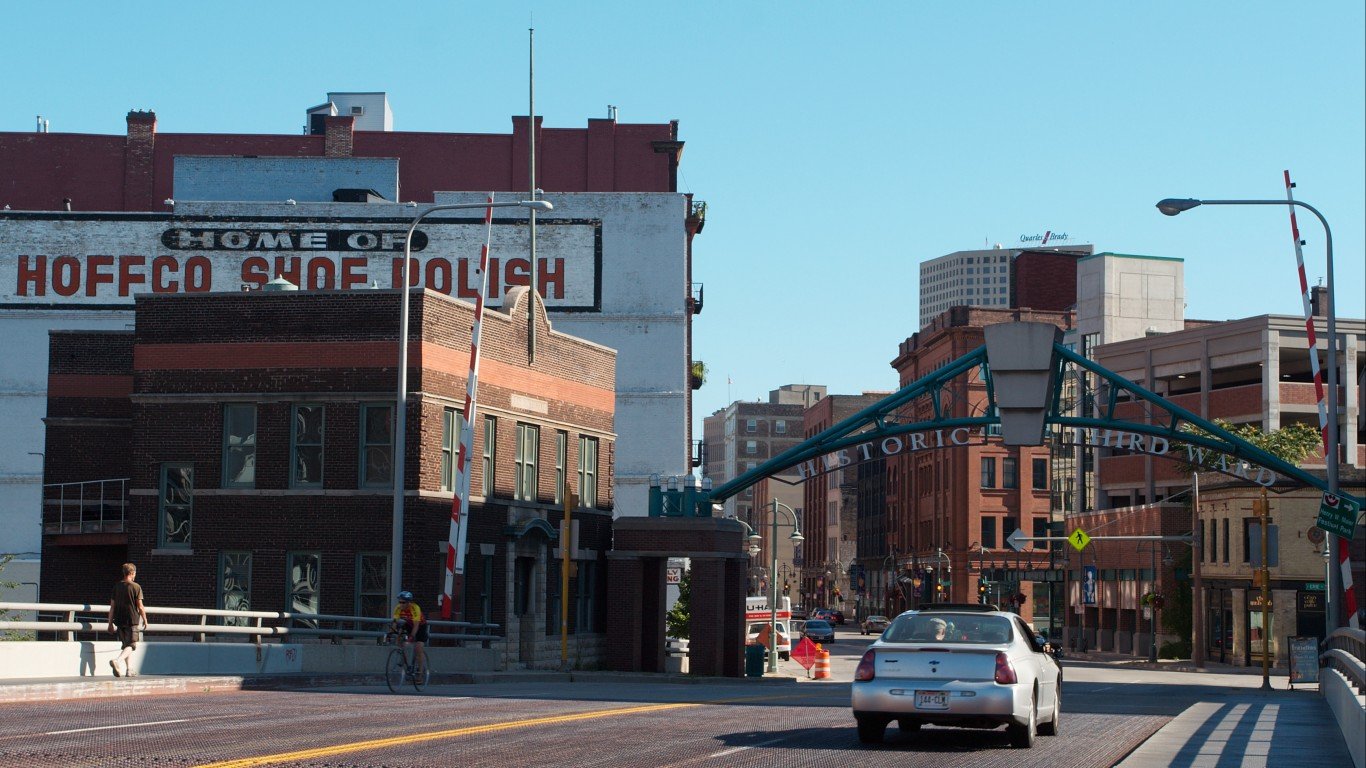
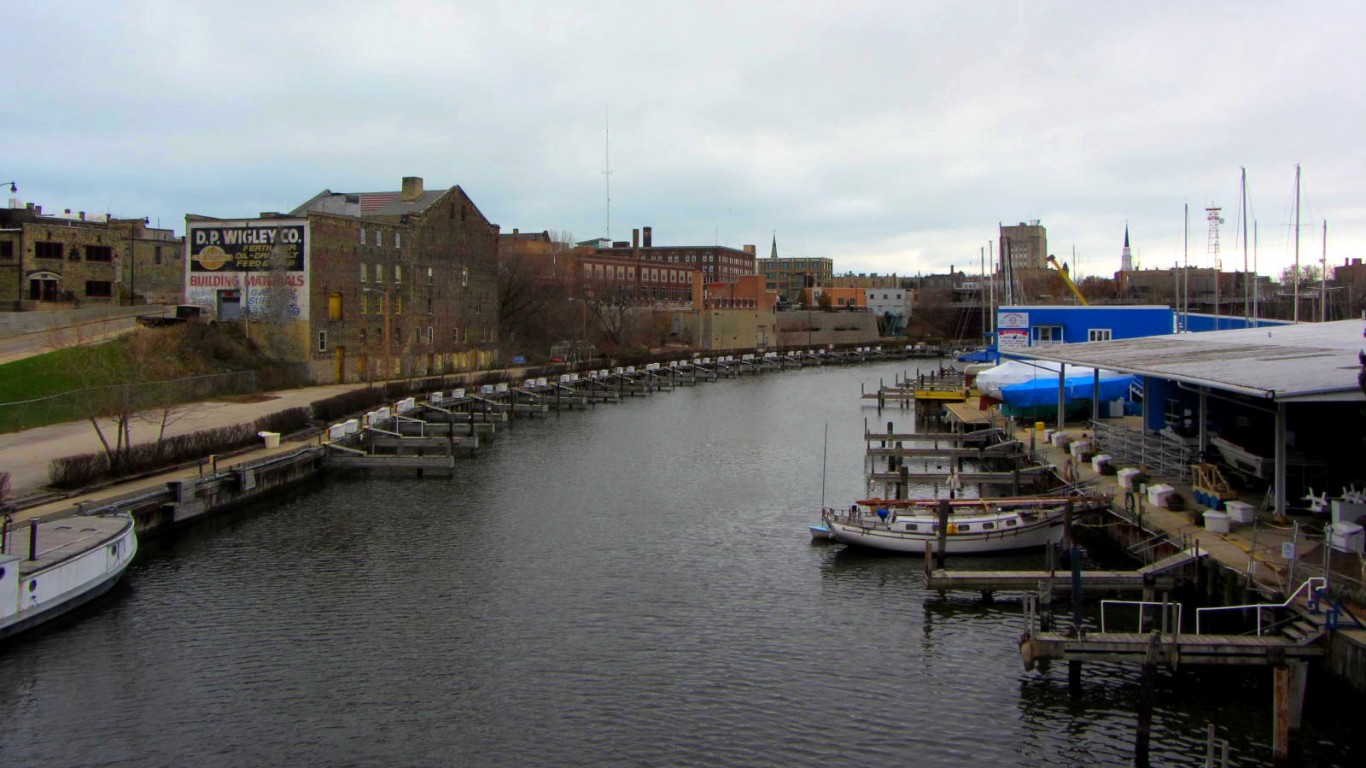
2. Milwaukee-Waukesha-West Allis, WI
> Black population: 260,776 (16.6%)
> Black median income: $27,834 (42.5% of white income)
> Unemployment: 16.1% black; 4.2% white
> Homeownership rate: 28.2% black; 69.5% white
Like many Midwestern cities with similar history, Milwaukee’s discriminatory housing policies from the mid-20th century still largely define residential patterns today. According to research published by the University of Wisconsin-Madison, 16 of the 18 suburbs of Milwaukee County enacted restrictive housing covenants in the 1940s, many of which remained in effect into the 1960s and 1970s. Segregation can contribute to income inequality, and today, the typical black household in Milwaukee earns just $27,834 a year — 42.5% of the $65,568 white median household income. While the white poverty rate in Milwaukee of 7.6% is one of the lowest in the country, the black poverty rate of 36.4% is among the highest.
Milwaukee is the largest city in Wisconsin, a state with one of the largest racial disparities in incarceration nationwide. Black Americans in Wisconsin are nearly 11 times more like to be incarcerated than white state residents. In Milwaukee County, more than half of all black adults in their 30s and early 40s have served time in a state correctional facility.
[in-text-ad-2]
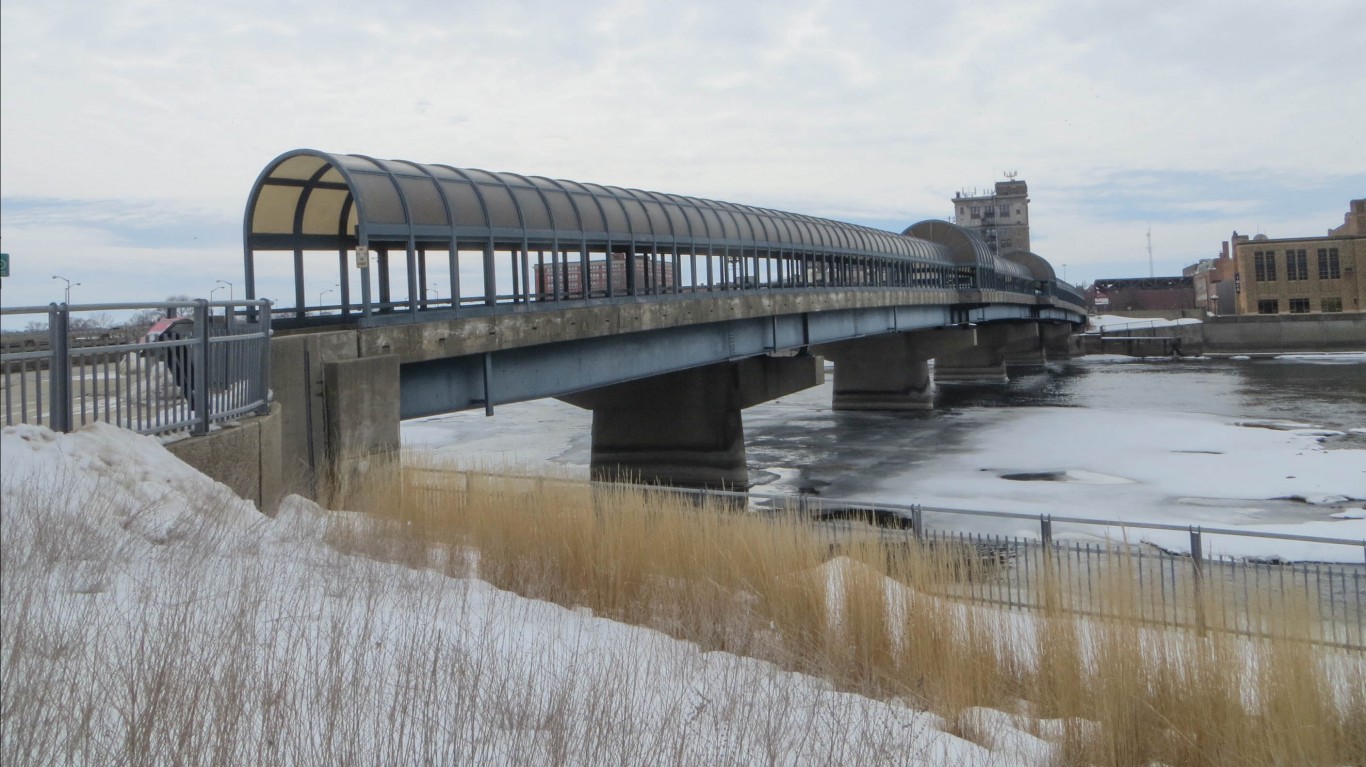
1. Waterloo-Cedar Falls, IA
> Black population: 12,085 (7.1%)
> Black median income: $25,897 (46.8% of white income)
> Unemployment: 23.9% black; 4.4% white
> Homeownership rate: 32.8% black; 73.2% white
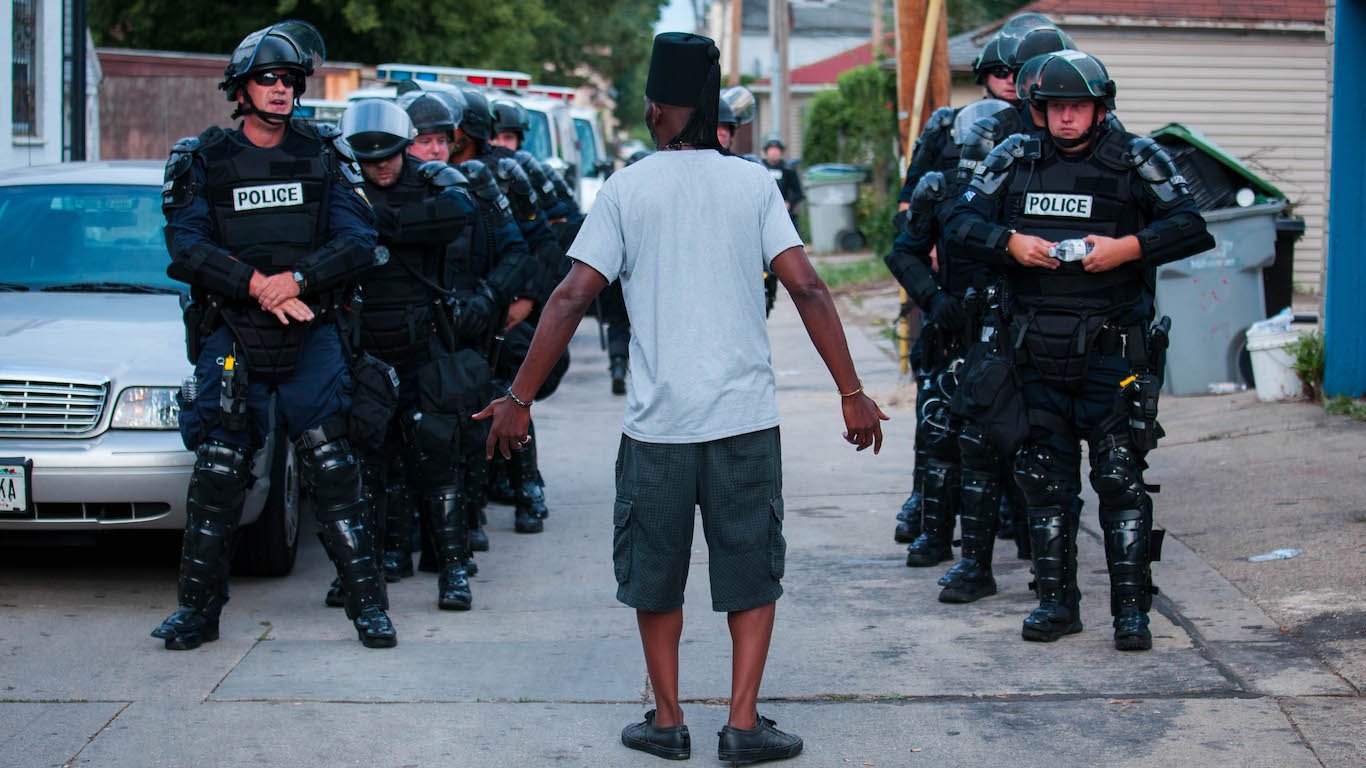
No U.S. metro area has larger social and economic disparities along racial lines than Waterloo-Cedar Falls, Iowa. Black metro area residents earn just 46.8% of what white area residents earn, and are far more likely to be unemployed than white workers in the city. The city’s black unemployment rate is 23.9%, well above the 13.3% nationwide black unemployment rate and the second highest such figure of any U.S. metro. Meanwhile, the area’s white unemployment rate stands at 4.4%, below the 5.9% national white unemployment rate and among the least of any city nationwide.
Like many U.S. cities with high economic and social inequality, Waterloo residents have struggled with several major incidents that have sparked racial tension in the area in recent years. In 2012, for example, a white police officer shot and killed a fleeing black suspect, and was later exonerated by a grand jury.
Contact [email protected] for any questions or corrections.