Life expectancy at birth in the United States dropped for the second year in a row in 2021. According to the Centers for Disease Control and Prevention, the average life expectancy at birth now stands at just 76.1 years, the lowest it has been since 1996.
The decline was precipitated largely by the more than 1.1 million COVID-19 deaths, as well as drug overdose, heart disease, chronic liver disease and cirrhosis, and suicide.
Health outcome measures, such as life expectancy at birth, are closely tied to other socioeconomic indicators. Both on an individual level and across broad populations, life expectancy tends to rise with educational attainment and financial security. And though with a $23 trillion economy the United States is the wealthiest nation on Earth, communities across the country are falling behind in key measures related to overall quality of life and individual well-being.
24/7 Wall St. created an equally-weighted index of three measures – average life expectancy at birth, the poverty rate, and the share of adults with a bachelor’s degree or higher – to identify the worst county or county equivalent in each state. The index was inspired by the United Nations Development Programme’s Human Development Index. The HDI’s intended purpose is to provide a more comprehensive measure than economic development alone, one that centers on the capabilities and quality of life of individuals within a given country or region.
In every county or county equivalent on this list, residents are more likely to live in poverty and less likely to have a four-year college degree than the typical state resident. Additionally, in the majority of these counties, life expectancy at birth is over four years lower than the statewide average.
Although Americans without a college degree are more likely to face serious financial hardship, educational attainment rates are not the only explanation for the widespread poverty in many of these places. According to five-year estimates from the U.S. Census Bureau’s 2021 American Community Survey, many of the counties and county equivalents on this list have double digit unemployment rates. (Here is a look at America’s poorest towns.)
With limited economic opportunity, Americans are leaving many of these places faster than they are moving there. Most of these counties and county equivalents reported population decline between 2015 and 2021, even as the U.S. population as a whole grew by 4.2% over the same period. (Here is a look at the best county to live in every state.)
Click here to see the worst county to live in every state.
Click here to see our detailed methodology.

Source: Public Domain / Wikimedia Commons
Alabama: Wilcox County
> Poverty rate (5-yr est., 2021): 27.4% (state: 15.8%)
> Adults with a bachelor’s degree (5-yr est., 2021): 11.0% (state: 26.7%)
> Life expectancy at birth, 2019: 71.9 years (state: 75.7 years)
> Median annual household income (5-yr est., 2021): $36,385 (state: $54,943)
> County seat: Camden
Based on several key socioeconomic indicators, Wilcox County ranks as the worst county to live in Alabama. Local residents are nearly twice as likely to live in poverty than the typical Alabama resident. The area’s high poverty is partially the result of a weak job market, including an average unemployment rate of 14.0% in the last five years, more than double the average 5.4% jobless rate across the state during that time.
In low-income areas, residents are less likely to be able to afford health care as well as a wide range of healthy options related to diet and lifestyle, and health outcomes suffer as a result. In Wilcox County, life expectancy at birth is just 71.9 years, nearly four years below the 75.7 year state average.
[in-text-ad]

Source: Public Domain / Wikimedia Commons
Alaska: Kusilvak Census Area
> Poverty rate (5-yr est., 2021): 36.6% (state: 10.4%)
> Adults with a bachelor’s degree (5-yr est., 2021): 2.9% (state: 30.6%)
> Life expectancy at birth, 2019: 69.2 years (state: 79.9 years)
> Median annual household income (5-yr est., 2021): $37,975 (state: $80,287)
> County seat: N/A
The Kusilvak Census Area, located along the coast in southwestern Alaska, ranks as the state’s worst county equivalent to live in. Kusilvak is the only county equivalent in the state where life expectancy is below 70 years. Additionally, the local poverty rate is over three times higher than the state rate.
Higher educational attainment is closely linked to both improved health outcomes and increased financial security. In the Kusilvak Census Area, only 2.9% of adults have a bachelor’s degree or higher, compared to over 30% of adults in Alaska.
 24/7 Wall St.
Arizona: Apache County
> Poverty rate (5-yr est., 2021): 33.9% (state: 13.5%)
> Adults with a bachelor’s degree (5-yr est., 2021): 12.8% (state: 31.2%)
> Life expectancy at birth, 2019: 72.4 years (state: 79.5 years)
> Median annual household income (5-yr est., 2021): $34,788 (state: $65,913)
> County seat: St. Johns
Apache County, which spans over much of Arizona’s eastern border, ranks as the worst place to live in the state. An average of 9.0% of the local labor force have been unemployed in the last five years, well above the 5.6% jobless rate across Arizona. A lack of sufficient employment opportunities may partly explain the county’s high poverty rate, which is more than double the rate across Arizona.
Financial hardship and job scarcity may be pushing people out of Apache County. Between 2015 and 2021, the local population has contracted by 7.8%, even as Arizona’s population expanded by 6.6% over the same period.

Source: BOB WESTON / iStock via Getty Images
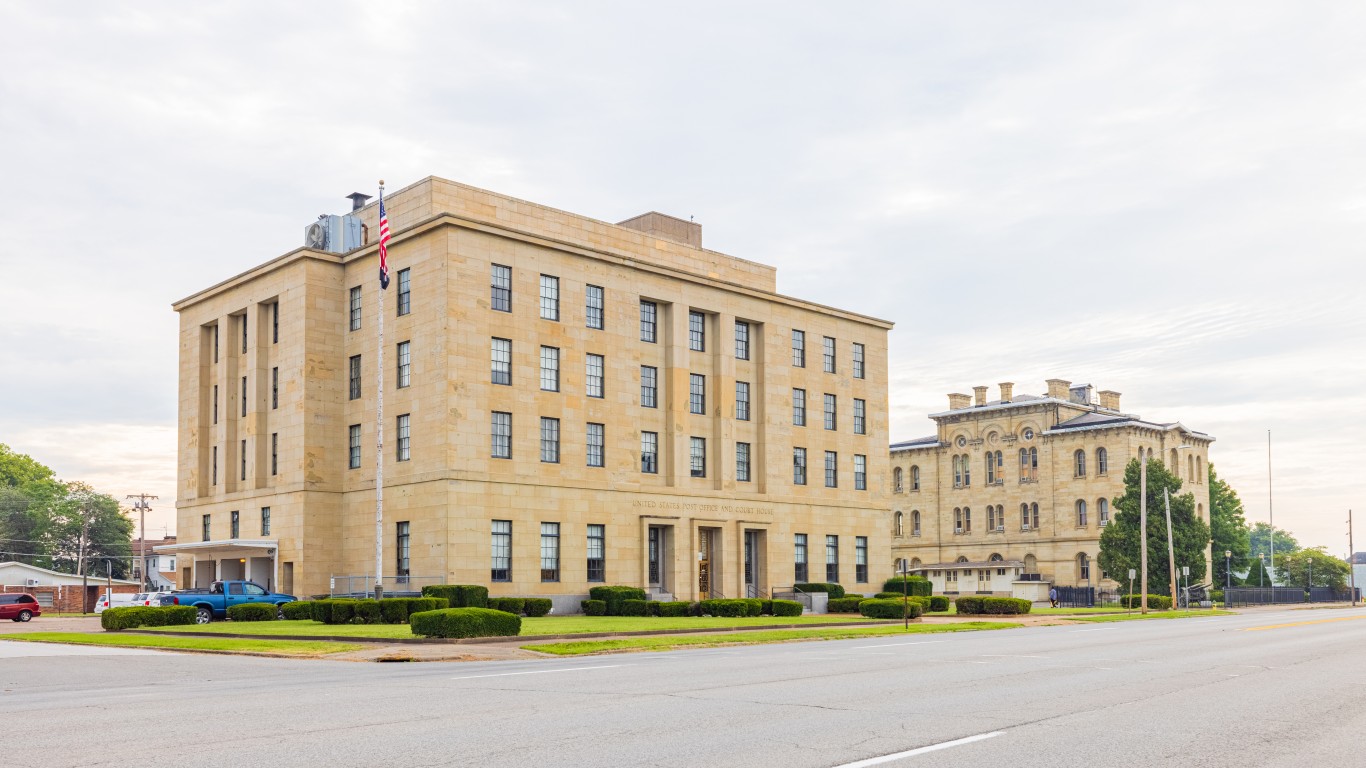
Arkansas: Phillips County
> Poverty rate (5-yr est., 2021): 33.3% (state: 16.0%)
> Adults with a bachelor’s degree (5-yr est., 2021): 14.3% (state: 24.3%)
> Life expectancy at birth, 2019: 71.7 years (state: 76.2 years)
> Median annual household income (5-yr est., 2021): $32,235 (state: $52,123)
> County seat: Helena
Phillips County ranks as the worst place to live in Arkansas. Located in the state’s Delta region, the county is a former agricultural and transportation hub with a history of racial tensions and violence. After decades of economic decline, the local poverty rate is more than double the state poverty rate. Well-educated areas tend to have lower rates of financial hardship, and only 14.3% of adults in the county have a bachelor’s degree, compared to 24.3% of adults in Arkansas.
As is often the case in parts of the country with high poverty, the population is declining in Phillips County. Since 2015, the number of people living in the county has fallen by 17.0%, even as Arkansas’ population expanded by 1.6%.
[in-text-ad-2]

Source: Public Domain / Wikimedia Commons
California: Lake County
> Poverty rate (5-yr est., 2021): 16.8% (state: 12.3%)
> Adults with a bachelor’s degree (5-yr est., 2021): 17.5% (state: 35.3%)
> Life expectancy at birth, 2019: 75.1 years (state: 81.5 years)
> Median annual household income (5-yr est., 2021): $53,399 (state: $84,097)
> County seat: Lakeport
A landlocked county located northwest of Sacramento, Lake County ranks as the worst county to live in the state. Like many communities on this list, the county struggles with both unemployment and poverty. Over the last five years, an average of 10.1% of the local labor force were unemployed, well above the comparable 6.5% state rate. Additionally, 16.8% of the local population live below the poverty line, compared to California’s 12.3% poverty rate.
Economic security tends to improve with greater educational attainment, and across Lake County, only 17.5% of adults have a bachelor’s degree or higher, compared to 35.3% of adults in California.
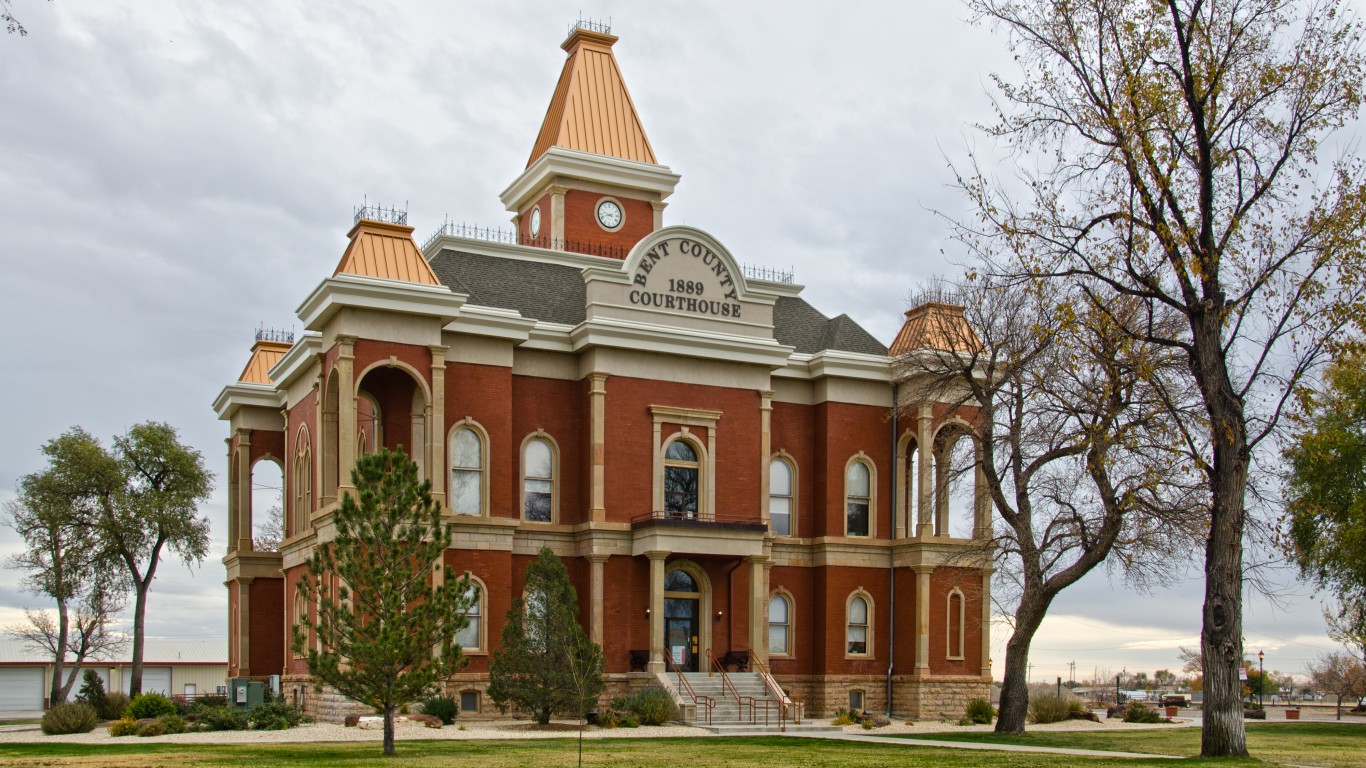
Source: chapin31 / iStock Editorial via Getty Images
Colorado: Bent County
> Poverty rate (5-yr est., 2021): 25.4% (state: 9.6%)
> Adults with a bachelor’s degree (5-yr est., 2021): 14.2% (state: 42.8%)
> Life expectancy at birth, 2019: 75.4 years (state: 80.0 years)
> Median annual household income (5-yr est., 2021): $40,972 (state: $80,184)
> County seat: Las Animas
Bent County is located in southeastern Colorado. Due to several key socioeconomic indicators, it ranks as the worst county to live in the state. At just 75.4 years, life expectancy at birth in the county is nearly half a decade below the statewide average.
The area’s lower than average life expectancy is likely closely tied to the high poverty rate. Low-income Americans are less likely to be able to afford necessary and preventative medical care and healthy lifestyle choices. In Bent County, 25.4% of the population live below the poverty line, more than double the 9.6% state poverty rate.
[in-text-ad]

Connecticut: Windham County
> Poverty rate (5-yr est., 2021): 11.3% (state: 10.0%)
> Adults with a bachelor’s degree (5-yr est., 2021): 24.4% (state: 40.6%)
> Life expectancy at birth, 2019: 78.9 years (state: 81.1 years)
> Median annual household income (5-yr est., 2021): $71,418 (state: $83,572)
> County seat: Willimantic
Of the eight counties in Connecticut, Windham County ranks as the worst to live in. Average life expectancy at birth in the county, located in the northeastern corner along the Massachusetts and Rhode Island borders, is over two years lower of the state average. Windham County residents are also less likely to have a college education and more likely to live below the poverty line than the typical Connecticut resident.

Source: benkrut / iStock via Getty Images
Delaware: Kent County
> Poverty rate (5-yr est., 2021): 13.3% (state: 11.4%)
> Adults with a bachelor’s degree (5-yr est., 2021): 25.7% (state: 33.6%)
> Life expectancy at birth, 2019: 77.3 years (state: 78.3 years)
> Median annual household income (5-yr est., 2021): $63,715 (state: $72,724)
> County seat: Dover
A geographically small state, Delaware has only three counties. As a result, even though Kent County ranks as the worst to live in the state, the disparity between the county and the state as a whole in several key socioeconomic indicators is not especially pronounced. The county’s poverty rate of 13.3% is only slightly higher than the 11.4% state rate. Similarly, life expectancy at birth is only a year below the average across Delaware.
However, adults living in Kent are considerably less likely to have a four-year college degree than the typical adult in Delaware.

Source: Ebyabe / Wikimedia Commons
Florida: Union County
> Poverty rate (5-yr est., 2021): 17.0% (state: 13.1%)
> Adults with a bachelor’s degree (5-yr est., 2021): 11.0% (state: 31.5%)
> Life expectancy at birth, 2019: 67.7 years (state: 79.4 years)
> Median annual household income (5-yr est., 2021): $55,463 (state: $61,777)
> County seat: Lake Butler
Union County is located in the central part of Florida, just north of Gainesville. At just 67.7 years, Union is the only county in Florida with a life expectancy below 70 years. The low average life expectancy is due in part to a high rate of drug deaths. There were 37.3 fatal drug overdoses for every 100,000 people in the county between 2018 and 2021, one of the highest such rates of any of Florida’s 67 counties.
Health outcomes tend to improve with educational attainment, and in Union County, only 11.0% of adults have a bachelor’s degree, compared to 31.5% of adults across the state.
[in-text-ad-2]

Source: BOB WESTON / iStock via Getty Images
Georgia: Clinch County
> Poverty rate (5-yr est., 2021): 30.2% (state: 13.9%)
> Adults with a bachelor’s degree (5-yr est., 2021): 11.0% (state: 33.0%)
> Life expectancy at birth, 2019: 72.7 years (state: 78.0 years)
> Median annual household income (5-yr est., 2021): $47,750 (state: $65,030)
> County seat: Homerville
Clinch County, located in south-central Georgia, ranks as the worst place to live in the state. Health outcomes in the county lag considerably behind those across the state as whole, as the local life expectancy at birth is just 72.7 years, compared to 78.0 years across Georgia.
Poverty can have a negative impact on health outcomes, including life expectancy, as poorer Americans often struggle to afford health care and healthy lifestyle options. The poverty rate in Clinch County is more than double the rate across Georgia.

Hawaii: Hawaii County
> Poverty rate (5-yr est., 2021): 13.8% (state: 9.5%)
> Adults with a bachelor’s degree (5-yr est., 2021): 30.2% (state: 34.3%)
> Life expectancy at birth, 2019: 80.6 years (state: 81.9 years)
> Median annual household income (5-yr est., 2021): $68,399 (state: $88,005)
> County seat: Hilo
Hawaii is a geographically small state of only five counties, and as a result, variation in socioeconomic outcomes between a given county and the state as a whole are relatively small. Still, based on several key measures, Hawaii County, coterminous with the Island of Hawaii — the largest by landmass in the archipelago — ranks behind the other counties in the state.
The local poverty rate of 13.8% is the second highest among the counties in Hawaii and well above the state poverty rate. Additionally, even though at 80.6 years, life expectancy at birth in the county is higher than the 79.1 year national average, it is lower than the statewide average life expectancy of 81.9 years.
[in-text-ad]

Source: csfotoimages / iStock Editorial via Getty Images
Idaho: Shoshone County
> Poverty rate (5-yr est., 2021): 15.1% (state: 11.4%)
> Adults with a bachelor’s degree (5-yr est., 2021): 11.3% (state: 29.1%)
> Life expectancy at birth, 2019: 75.0 years (state: 79.2 years)
> Median annual household income (5-yr est., 2021): $43,188 (state: $63,377)
> County seat: Wallace
Shoshone County is a mining region located in northern Idaho along the Montana border where prevailing economic hardships in the area contribute to its ranking as the state’s worst county to live in. The county’s poverty rate is lower than the statewide rate and median household income is about $20,000 lower than the state median. This may have contributed to poorer health outcomes. For example, life expectancy at birth in Shoshone County is 75.0 years, about four years shy of the state average.
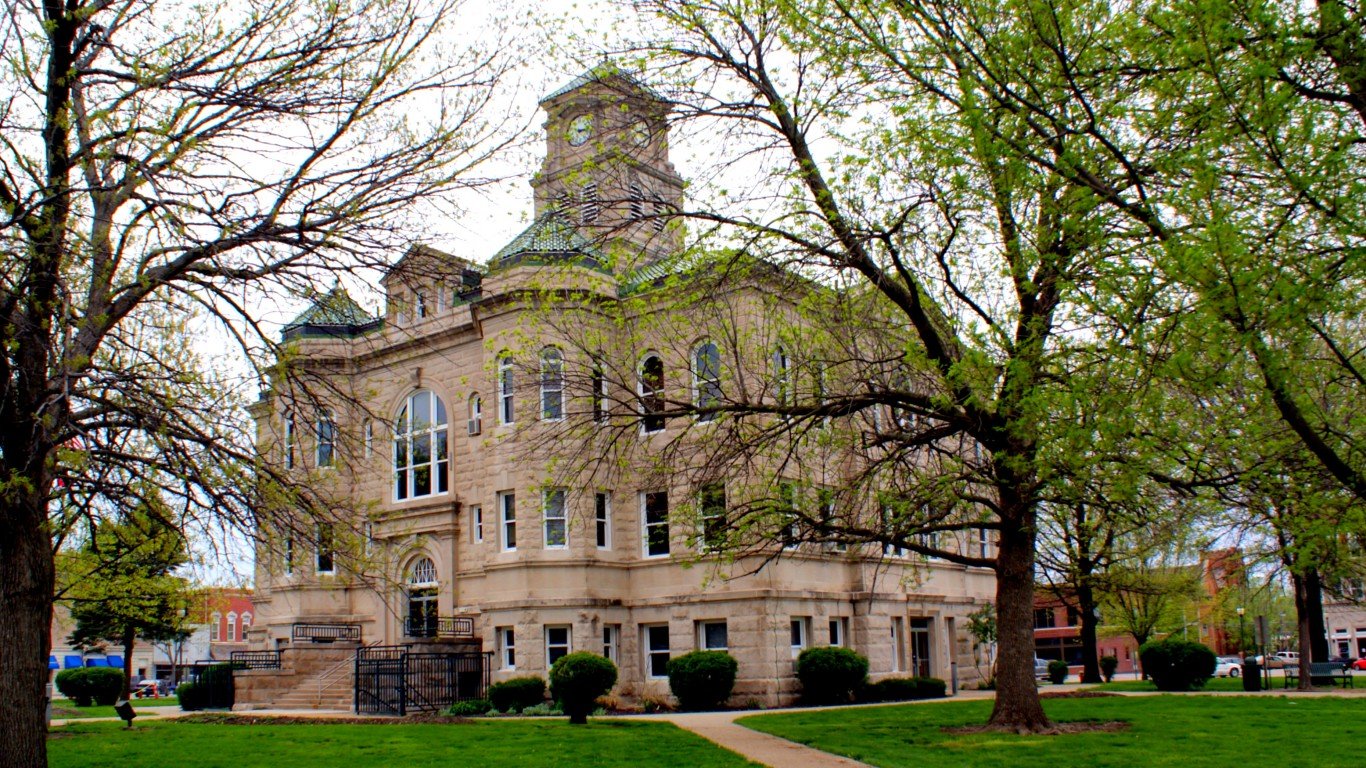
Source: Roberto Galan / iStock Editorial via Getty Images
Illinois: Alexander County
> Poverty rate (5-yr est., 2021): 24.5% (state: 11.8%)
> Adults with a bachelor’s degree (5-yr est., 2021): 12.3% (state: 36.2%)
> Life expectancy at birth, 2019: 74.4 years (state: 79.6 years)
> Median annual household income (5-yr est., 2021): $39,871 (state: $72,563)
> County seat: Cairo
The southern Illinois county of Alexander ranks as the worst of the state’s 102 counties to live in. An estimated 24.5% of local residents live below the poverty line, more than double the 11.8% state poverty rate.
Poverty can have a negative impact on health outcomes, including life expectancy, as poorer Americans often struggle to afford health care and healthy lifestyle choices. Partially as a result, at just 74.4 years, life expectancy at birth in the county is half a decade below the state average.

Indiana: Scott County
> Poverty rate (5-yr est., 2021): 16.6% (state: 12.5%)
> Adults with a bachelor’s degree (5-yr est., 2021): 13.3% (state: 27.8%)
> Life expectancy at birth, 2019: 71.9 years (state: 77.1 years)
> Median annual household income (5-yr est., 2021): $45,794 (state: $61,944)
> County seat: Scottsburg
Scott County ranks as Indiana’s worst county to live in. Adults in the area are about half as likely to have a college degree as the typical Indiana resident 25 and older. Financial security tends to improve with educational attainment, and the poverty rate in the county of 16.6% is well above the statewide rate of 12.5%.
Both educational attainment and poverty rates can have an impact on health outcomes in a given population. And in Scott County, life expectancy at birth is just 71.9 years, over half a decade below 77.1 year statewide average.
[in-text-ad-2]
Source: BOB WESTON / iStock via Getty Images
Iowa: Appanoose County
> Poverty rate (5-yr est., 2021): 19.4% (state: 11.0%)
> Adults with a bachelor’s degree (5-yr est., 2021): 18.9% (state: 29.7%)
> Life expectancy at birth, 2019: 76.3 years (state: 79.1 years)
> Median annual household income (5-yr est., 2021): $46,900 (state: $65,429)
> County seat: Centerville
Appanoose County, located along the Missouri state border, ranks as Iowa’s worst county to live in. Life expectancy at birth in the county, at 76.3 years, is nearly three years below the state average.
The area’s poor health outcomes are likely attributable in part to high poverty in the county as Americans living below the poverty line are more likely to struggle to afford health care and healthy lifestyles. In Appanoose County, 19.4% of the population live below the poverty line, compared to 11.0% of Iowa’s population.

Source: BOB WESTON / iStock / Getty Images Plus
Kansas: Harper County
> Poverty rate (5-yr est., 2021): 17.6% (state: 11.5%)
> Adults with a bachelor’s degree (5-yr est., 2021): 16.8% (state: 34.4%)
> Life expectancy at birth, 2019: 74.9 years (state: 78.4 years)
> Median annual household income (5-yr est., 2021): $52,188 (state: $64,521)
> County seat: Anthony
Harper County, located along the Oklahoma border, ranks as Kansas’ worst county to live in. One of the poorest parts of the state, the county’s 17.6% poverty rate is well above the 11.5% statewide rate.
Both on an individual basis and across broad populations, incomes and financial security tend to rise with educational attainment. In Harper County, only 16.8% of the adult population have bachelor’s degrees, compared to 34.4% of adults in Kansas.
[in-text-ad]
Source: BOB WESTON / iStock via Getty Images
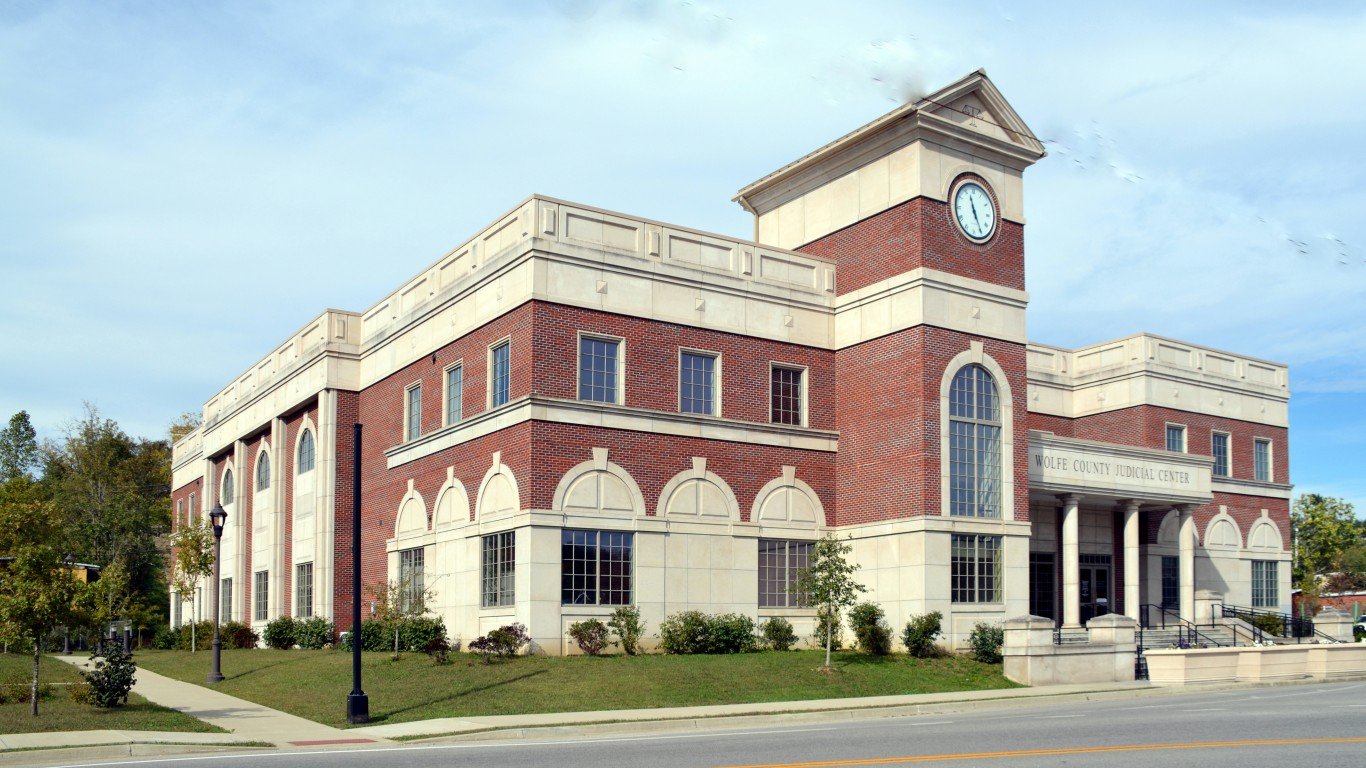
Kentucky: Wolfe County
> Poverty rate (5-yr est., 2021): 34.6% (state: 16.3%)
> Adults with a bachelor’s degree (5-yr est., 2021): 6.6% (state: 25.7%)
> Life expectancy at birth, 2019: 70.4 years (state: 75.8 years)
> Median annual household income (5-yr est., 2021): $24,349 (state: $55,454)
> County seat: Campton
Wolfe County ranks as the worst place to live in Kentucky. Fewer than one in every 10 area adults have a bachelor’s degree compared to more than one in every four adults in Kentucky. Both on an individual basis and across broad populations, incomes and financial security tend to rise with educational attainment. In Wolfe County, 34.6% of the population live below the poverty line, more than double the statewide poverty rate of 16.3%.
Like many U.S. counties lagging in key socioeconomic indicators, the county’s population is shrinking. Between 2015 and 2021, the number of people living there fell by 8.2%, even as Kentucky’s population expanded by 2.2%.

Louisiana: East Carroll Parish
> Poverty rate (5-yr est., 2021): 47.3% (state: 18.8%)
> Adults with a bachelor’s degree (5-yr est., 2021): 10.2% (state: 25.5%)
> Life expectancy at birth, 2019: 71.5 years (state: 75.7 years)
> Median annual household income (5-yr est., 2021): $25,049 (state: $53,571)
> County seat: Lake Providence
East Carroll Parish is the worst parish to live in Louisiana and is one of the poorest counties or county equivalents in the United States. An estimated 47.3% of the local population live below the poverty line, well above the state poverty rate of 18.8%.
Poverty can have a negative impact on health outcomes, including life expectancy, as poorer Americans often struggle to afford health care and healthy lifestyle choices. Partially as a result, life expectancy at birth in the parish is more than four years shorter than the state average and nearly eight years shorter than the 79.1 years national average.

Maine: Somerset County
> Poverty rate (5-yr est., 2021): 17.9% (state: 11.0%)
> Adults with a bachelor’s degree (5-yr est., 2021): 19.9% (state: 33.6%)
> Life expectancy at birth, 2019: 76.7 years (state: 78.7 years)
> Median annual household income (5-yr est., 2021): $47,488 (state: $63,182)
> County seat: Skowhegan
Somerset County stretches from the country’s northern border with Canada down through the central part of Maine. The county ranks as the worst county in the state to live in largely because of the prevalence of financial hardship. The county’s poverty rate of 17.9% is far higher than the 11.0% state poverty rate.
A college education is linked to longer life expectancy, greater financial security, and a stronger sense of control over one’s life. In Somerset County, however, only 19.9% of adults have a bachelor’s degree or higher, compared to the 33.6% share of adults across Maine who do.
[in-text-ad-2]

Source: Sean Pavone / iStock via Getty Images
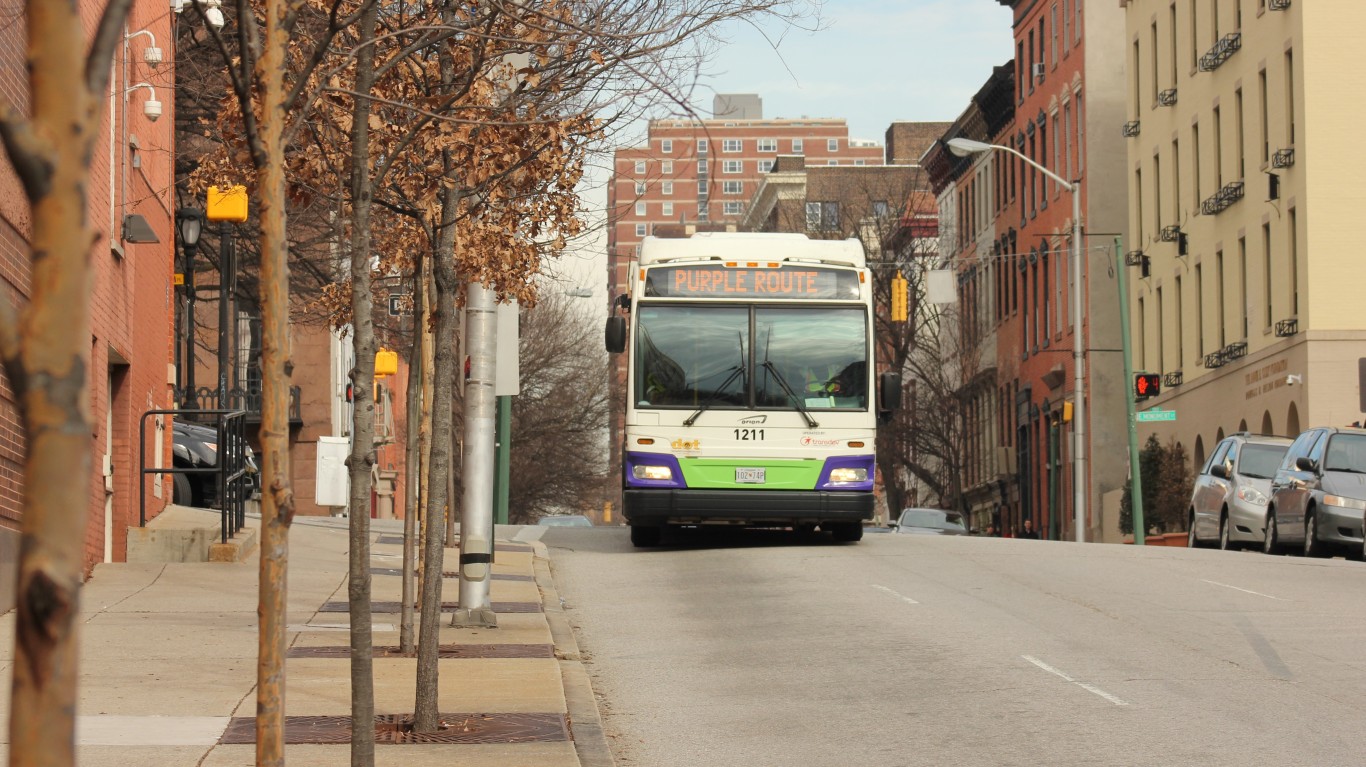
Maryland: Baltimore
> Poverty rate (5-yr est., 2021): 20.3% (state: 9.2%)
> Adults with a bachelor’s degree (5-yr est., 2021): 34.2% (state: 41.6%)
> Life expectancy at birth, 2019: 72.9 years (state: 79.3 years)
> Median annual household income (5-yr est., 2021): $54,124 (state: $91,431)
> County seat: N/A
Baltimore is an independent city in Maryland and one of 24 counties or county equivalents in the state. It ranks as the worst place to live in the state, largely because of widespread financial hardship. With a median household income of $91,431, Maryland is the wealthiest state in the country, but in Baltimore, the typical household earns just $54,124 annually. Additionally, more than one in every five Baltimore residents live below the poverty line, compared to fewer than one in every 10 Maryland residents.
Health outcomes are also lagging in the city. At just 72.9 years, life expectancy at birth is also lower in Baltimore than it is in any Maryland county and well below the 79.3 year statewide average.

Source: Sean Pavone / iStock via Getty Images
Massachusetts: Hampden County
> Poverty rate (5-yr est., 2021): 15.9% (state: 9.9%)
> Adults with a bachelor’s degree (5-yr est., 2021): 28.2% (state: 45.2%)
> Life expectancy at birth, 2019: 78.0 years (state: 80.3 years)
> Median annual household income (5-yr est., 2021): $61,310 (state: $89,026)
> County seat: Springfield
Hampden County, located in southern Massachusetts along the Connecticut border, ranks as the worst county in which to live in the state. Of the 14 counties in the state, Hampden has the lowest bachelor’s degree attainment rate, at 28.2%. Meanwhile, 45.2% of adults across Massachusetts have a bachelor’s degree or higher.
Hampden County also has some of the worst health outcomes in the state. Life expectancy at birth in the county is 78.0 years, nearly 2.5 years below the statewide average.
[in-text-ad]
Source: Roberto Galan / iStock Editorial via Getty Images
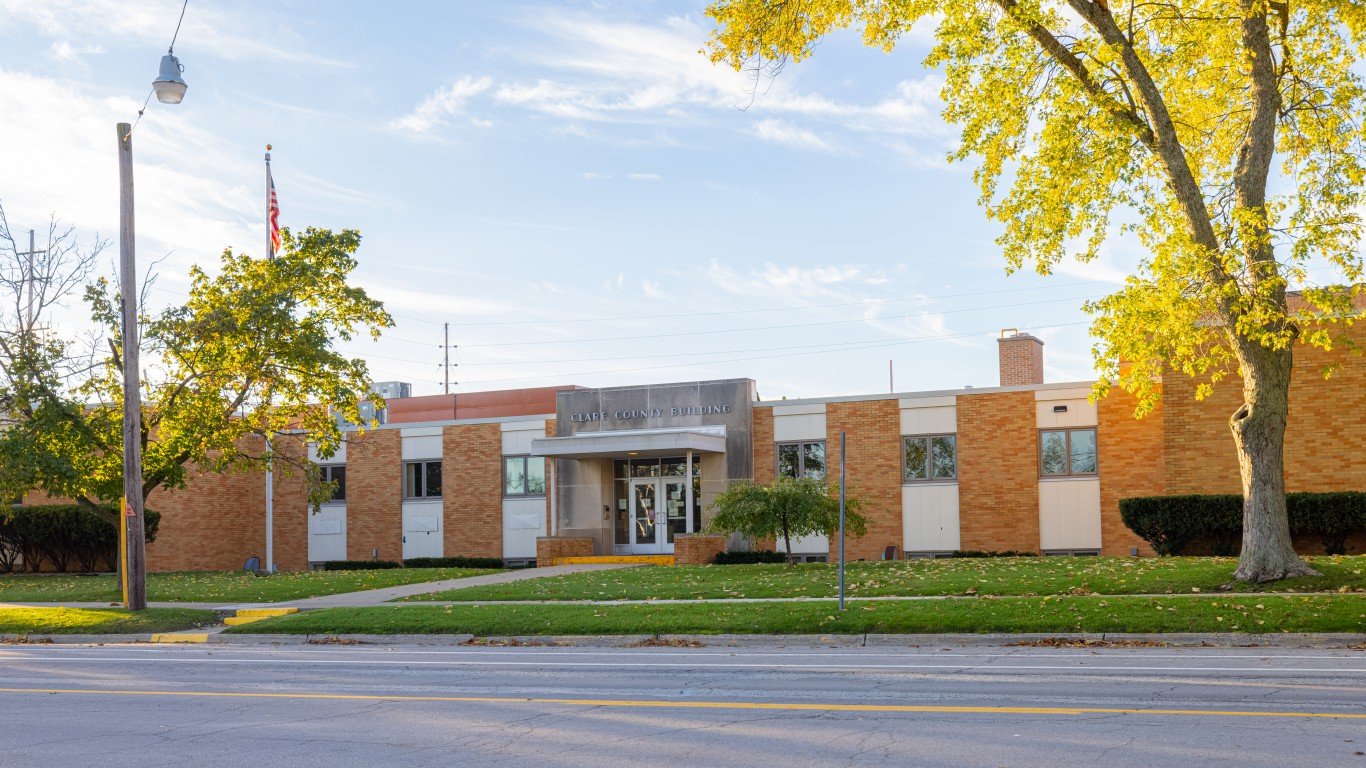
Michigan: Clare County
> Poverty rate (5-yr est., 2021): 23.7% (state: 13.3%)
> Adults with a bachelor’s degree (5-yr est., 2021): 12.1% (state: 30.6%)
> Life expectancy at birth, 2019: 75.2 years (state: 78.0 years)
> Median annual household income (5-yr est., 2021): $43,069 (state: $63,202)
> County seat: Harrison
Clare County is centrally located on Michigan’s Lower Peninsula. A college education is linked to longer life expectancy, greater financial security, and a stronger sense of control over one’s life – and Clare County has the lowest bachelor’s degree attainment rate in Michigan. Only 12.1% of the local adult population have a bachelor’s degree or higher, less than half the 30.6% share of adults with a college degree across the state.
Health outcomes in Clare County also lag behind much of the state. Life expectancy at birth in the county is just 75.2 years, nearly three years shorter than the average across Michigan.
 24/7 Wall St.
Minnesota: Mahnomen County
> Poverty rate (5-yr est., 2021): 21.1% (state: 9.2%)
> Adults with a bachelor’s degree (5-yr est., 2021): 12.9% (state: 37.6%)
> Life expectancy at birth, 2019: 74.4 years (state: 80.6 years)
> Median annual household income (5-yr est., 2021): $48,021 (state: $77,706)
> County seat: Mahnomen
Mahnomen County ranks as the worst place to live in Minnesota. Life expectancy at birth in the county is over half a decade less than it is across the state as a whole. College-educated adults are more likely to report better health outcomes than those without a college degree, and just 12.9% of the county’s 25 and older population have a bachelor’s degree or higher, less than half the 37.6% share of adults with a four-year degree across Minnesota.
Like many U.S. counties lagging in key socioeconomic indicators, Mahnomen County’s population is shrinking. Since 2015, the number of people living there fell by 1.2%, even as Minnesota’s population expanded by 4.6%.
")
Mississippi: Quitman County
> Poverty rate (5-yr est., 2021): 34.8% (state: 19.4%)
> Adults with a bachelor’s degree (5-yr est., 2021): 11.2% (state: 23.2%)
> Life expectancy at birth, 2019: 70.5 years (state: 74.7 years)
> Median annual household income (5-yr est., 2021): $25,783 (state: $49,111)
> County seat: Marks
Quitman County, located near the northwest corner of Mississippi, ranks as the state’s worst county to live in. Mississippi is the poorest state in the country with a 19.4% poverty rate — and Quitman is the poorest county in the state, with a 39.2% poverty rate, more than double the rate across the state.
Poverty can have a negative impact on health outcomes, including life expectancy, as poorer Americans often struggle to afford health care and healthy lifestyle choices. Partially as a result, life expectancy at birth in Quitman County is just 70.5 years, well below the 74.7 year average life expectancy statewide and 79.1 year average nationwide.
[in-text-ad-2]

Source: Roberto Galan / iStock Editorial via Getty Images
Missouri: Pemiscot County
> Poverty rate (5-yr est., 2021): 27.5% (state: 12.8%)
> Adults with a bachelor’s degree (5-yr est., 2021): 11.7% (state: 30.7%)
> Life expectancy at birth, 2019: 71.4 years (state: 77.5 years)
> Median annual household income (5-yr est., 2021): $35,865 (state: $61,043)
> County seat: Caruthersville
Pemiscot County ranks as Missouri’s worst county to live in. The local poverty rate of 27.5% is more than double the 12.8% poverty rate across the state. Health outcomes in the county also lag behind the state as a whole. Life expectancy at birth in the county is just 71.4 years, well below the 77.5 year average across Missouri.
Like many U.S. counties lagging in key socioeconomic indicators, Pemiscot County’s population is shrinking. From 2015 to 2021, the number of people living there fell by 10.6%, even as Missouri’s population expanded by 1.6%.

Source: lucentius / iStock via Getty Images
Montana: Roosevelt County
> Poverty rate (5-yr est., 2021): 32.3% (state: 12.5%)
> Adults with a bachelor’s degree (5-yr est., 2021): 19.4% (state: 33.7%)
> Life expectancy at birth, 2019: 69.5 years (state: 78.7 years)
> Median annual household income (5-yr est., 2021): $47,182 (state: $60,560)
> County seat: Wolf Point
Roosevelt County is located near the northeast corner of Montana, largely within the Fort Peck Indian Reservation. Due to a number of historical and contemporary factors, many Native American reservations are among the poorest communities in the United States — and Roosevelt is no exception. An estimated 32.3% of the population live below the poverty line, more than double the 12.5% share of Montana residents.
Health outcomes in the county are also far worse than they are statewide. Life expectancy at birth in Roosevelt is just 69.5 years, nearly a decade below the 78.7 year state average.
[in-text-ad]
Source: Public Domain / Wikimedia Commons
Nebraska: Thurston County
> Poverty rate (5-yr est., 2021): 20.5% (state: 10.3%)
> Adults with a bachelor’s degree (5-yr est., 2021): 18.9% (state: 32.9%)
> Life expectancy at birth, 2019: 73.3 years (state: 79.5 years)
> Median annual household income (5-yr est., 2021): $56,223 (state: $66,644)
> County seat: Pender
Thurston County, located in northeastern Nebraska, ranks as the worst place to live in the state. Life expectancy in the county, at 73.3 years, is six years shorter than it is across the state as a whole. Additionally, the local 20.5% poverty rate is the highest of the 93 counties in the state and well above the 10.3% poverty rate across Nebraska.
Like many U.S. counties lagging in key socioeconomic indicators, Thurston County’s population is shrinking. Between 2015 and 2021, the number of people living there fell by 2.0%, even as Nebraska’s population expanded by 4.4%.

Nevada: Nye County
> Poverty rate (5-yr est., 2021): 15.6% (state: 12.9%)
> Adults with a bachelor’s degree (5-yr est., 2021): 12.7% (state: 26.1%)
> Life expectancy at birth, 2019: 74.6 years (state: 79.1 years)
> Median annual household income (5-yr est., 2021): $52,570 (state: $65,686)
> County seat: Tonopah
Of the 17 counties in Nevada, Nye County, located along the state’s southern border with California and extending north towards the center of the state, ranks as the worst to live in. At just 74.6 years, life expectancy in the county is nearly half a decade lower than it is across Nevada as a whole.
A college education is linked to longer life expectancy, greater financial security, and a stronger sense of control over one’s life. In Nye County, only 12.7% of adults have a bachelor’s degree or higher, less than half the 26.1% share of adults across Nevada who do.
Source: BOB WESTON / iStock via Getty Images
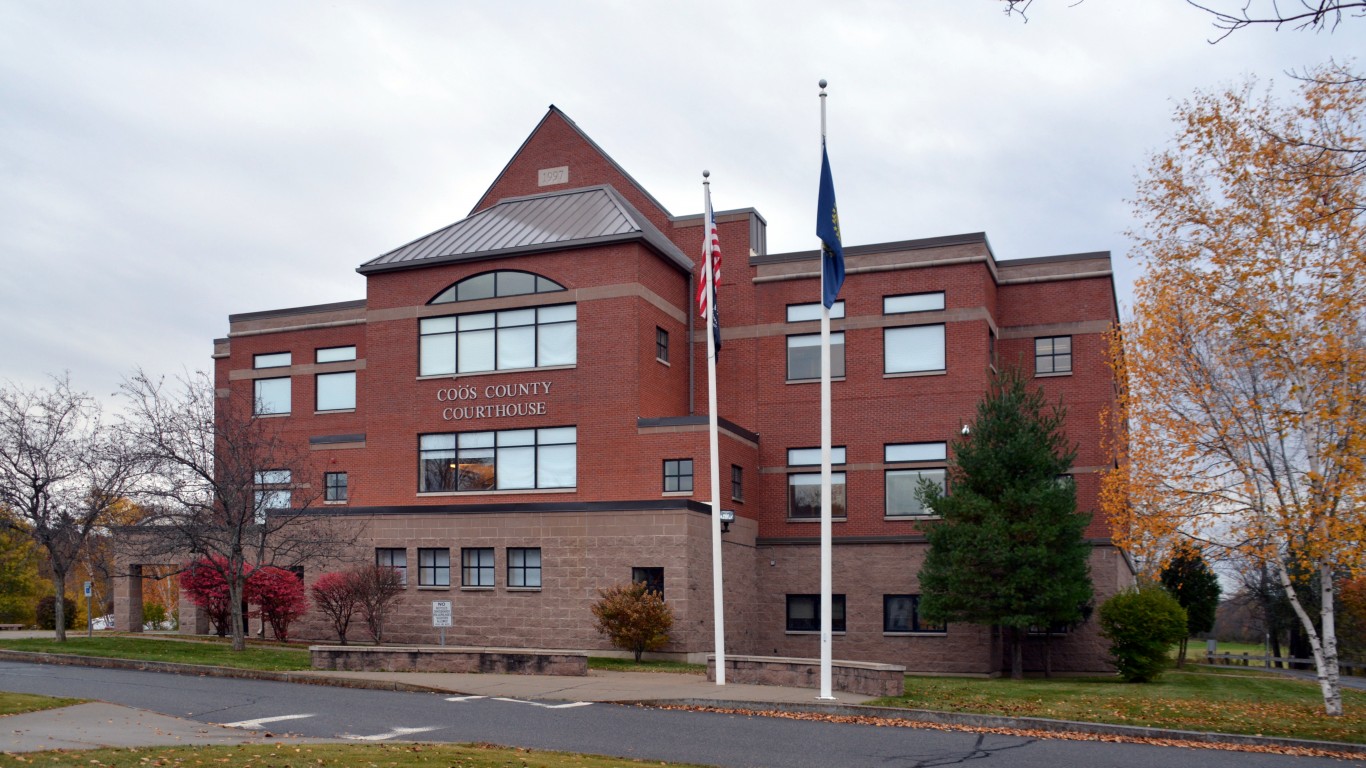
New Hampshire: Coos County
> Poverty rate (5-yr est., 2021): 10.9% (state: 7.4%)
> Adults with a bachelor’s degree (5-yr est., 2021): 20.0% (state: 38.2%)
> Life expectancy at birth, 2019: 76.6 years (state: 79.4 years)
> Median annual household income (5-yr est., 2021): $52,054 (state: $83,449)
> County seat: Lancaster
Coos County covers the northernmost tip of New Hampshire, bordering Canada, Maine, and Vermont. Of the 10 counties in New Hampshire, Coos ranks as the worst to live in. The 10.9% poverty rate in the county is nearly the highest in the state and well above the 7.4% rate across New Hampshire.
Certain health outcomes in Coos County are the worst in the state. Life expectancy at birth, for example, is just 76.6 years, nearly three years less than the life expectancy across New Hampshire.
[in-text-ad-2]

New Jersey: Cumberland County
> Poverty rate (5-yr est., 2021): 15.7% (state: 9.8%)
> Adults with a bachelor’s degree (5-yr est., 2021): 17.0% (state: 41.5%)
> Life expectancy at birth, 2019: 75.4 years (state: 80.6 years)
> Median annual household income (5-yr est., 2021): $58,397 (state: $89,703)
> County seat: Bridgeton
Of New Jersey’s 21 counties, Cumberland County along the state’s southern border ranks as the worst to live in. The 16.5% local poverty rate means that county residents are the most likely in the state to live below the poverty line. For context, New Jersey’s poverty rate is 10.0%.
Cumberland County also has some of the worst health outcomes in the state. Life expectancy at birth in the county is just 75.3 years, over five years below the state average.

New Mexico: McKinley County
> Poverty rate (5-yr est., 2021): 34.0% (state: 18.3%)
> Adults with a bachelor’s degree (5-yr est., 2021): 12.2% (state: 28.5%)
> Life expectancy at birth, 2019: 72.3 years (state: 78.3 years)
> Median annual household income (5-yr est., 2021): $40,262 (state: $54,020)
> County seat: Gallup
McKinley County, located in northwestern New Mexico encompassing parts of the Navajo Nation and Zuni Pueblo, ranks as the worst place to live in the state. Due to a number of historical and contemporary factors, many Native American reservations are among the poorest communities in the United States – and McKinley County is no exception. An estimated 34.0% of the population live below the poverty line, well above the 18.3% share of New Mexico residents.
Life expectancy in the county also lags considerably behind the state’s average. Life expectancy at birth in McKinley County is only 72.3 years, compared to the 78.3 year average across New Mexico.
[in-text-ad]
Source: Public Domain / Wikimedia Commons
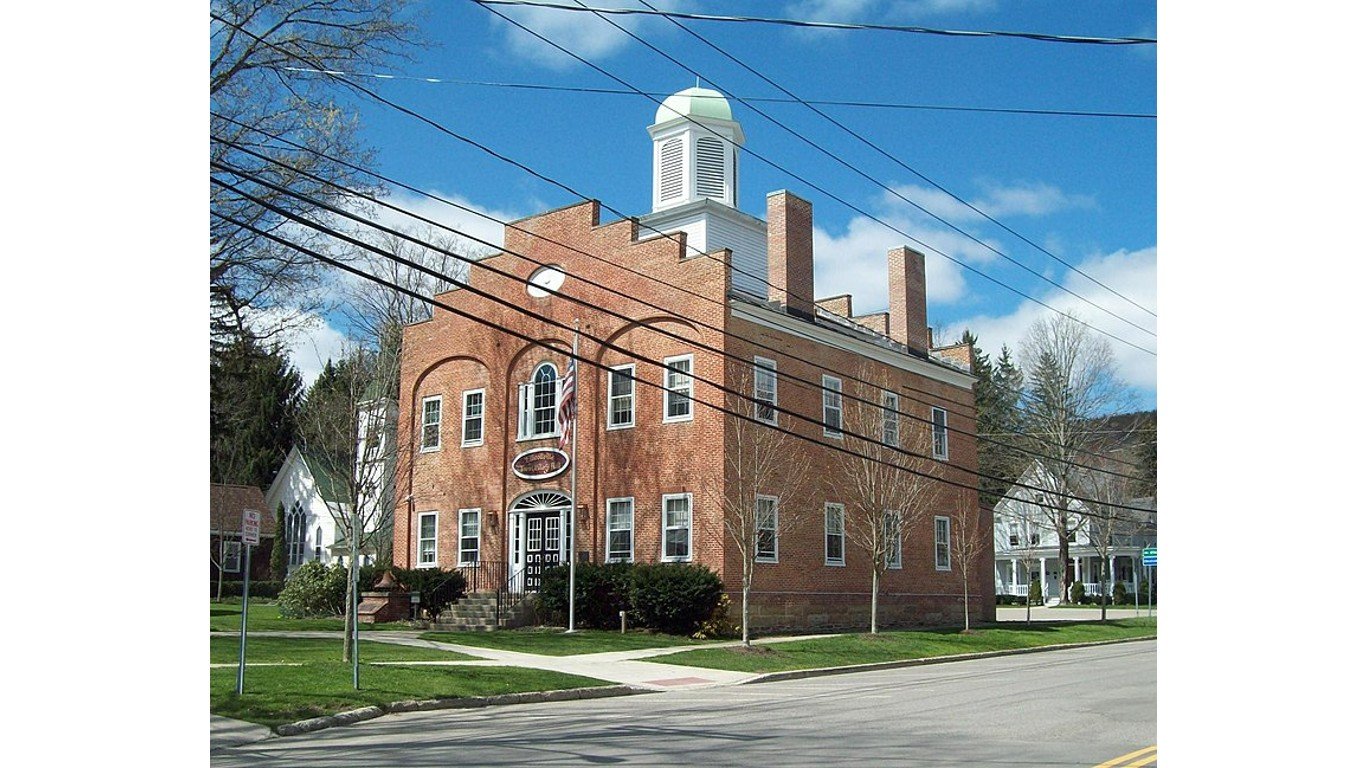
New York: Cattaraugus County
> Poverty rate (5-yr est., 2021): 17.3% (state: 13.5%)
> Adults with a bachelor’s degree (5-yr est., 2021): 20.0% (state: 38.1%)
> Life expectancy at birth, 2019: 77.7 years (state: 81.4 years)
> Median annual household income (5-yr est., 2021): $53,537 (state: $75,157)
> County seat: Little Valley
Cattaraugus County, located in western New York along the Pennsylvania border, ranks as the worst place to live in the state. The 17.3% poverty rate in the county is among the highest of any of New York’s 62 counties and well above the 13.5% state poverty rate.
The county’s higher poverty rate is likely due in part to low educational attainment rates. Only 20.0% of local adults have a bachelor’s degree. Meanwhile, across the state, 38.1% of adults do. The number of people living in the county declined by 2.2% since 2015, even as New York state’s population grew by 2.2%.

North Carolina: Robeson County
> Poverty rate (5-yr est., 2021): 27.3% (state: 13.7%)
> Adults with a bachelor’s degree (5-yr est., 2021): 14.2% (state: 33.0%)
> Life expectancy at birth, 2019: 73.0 years (state: 78.2 years)
> Median annual household income (5-yr est., 2021): $36,736 (state: $60,516)
> County seat: Lumberton
Robeson County, which sits along the South Carolina border, ranks as North Carolina’s worst county to live in. At just 73.0 years, life expectancy at birth in the county is over half a decade below the state average. Americans with a college education are statistically more likely to live longer, healthier lives than those with lower educational attainment. In Robeson, only 14.2% of 25 and older residents have a bachelor’s degree, compared to 33.0% of adults in North Carolina.
Like many U.S. counties lagging in key socioeconomic indicators, Robeson County’s population is shrinking. Between 2015 and 2021, the number of people living there fell by 11.9%, even as North Carolina’s population expanded by 5.3%.

North Dakota: Sioux County
> Poverty rate (5-yr est., 2021): 38.5% (state: 10.7%)
> Adults with a bachelor’s degree (5-yr est., 2021): 13.6% (state: 31.1%)
> Life expectancy at birth, 2019: 67.3 years (state: 79.0 years)
> Median annual household income (5-yr est., 2021): $39,755 (state: $68,131)
> County seat: Fort Yates
Sioux County, a largely rural area in southern North Dakota along the South Dakota border, ranks as the worst county to live in the state. Local residents are more than three times as likely to live in poverty than the typical North Dakota resident, and at just 67.3 years, life expectancy at birth is nearly 12 years below the state average. A college education is linked to longer life expectancy and greater financial security. In Sioux County, only 13.6% of adults have a bachelor’s degree or higher, less than half the 31.1% share of adults across North Dakota who do.
Between 2015 and 2021, the number of people living in the county fell by 8.8%, even as North Dakota’s population expanded by 7.2%.
[in-text-ad-2]

Ohio: Scioto County
> Poverty rate (5-yr est., 2021): 23.8% (state: 13.4%)
> Adults with a bachelor’s degree (5-yr est., 2021): 16.4% (state: 29.7%)
> Life expectancy at birth, 2019: 72.7 years (state: 77.0 years)
> Median annual household income (5-yr est., 2021): $43,266 (state: $61,938)
> County seat: Portsmouth
There are 88 counties in Ohio, and of them, Scioto County ranks as the worst place to live in. The area, located along the state’s southern border, has nearly the lowest life expectancy at birth of any Ohio county at just 72.7 years – more than four years shorter of the statewide average.
Scioto County also has a poverty rate of 23.8%, which is also nearly the highest of any county in Ohio and well above the 13.4% poverty rate across the state.

Oklahoma: Okfuskee County
> Poverty rate (5-yr est., 2021): 27.6% (state: 15.2%)
> Adults with a bachelor’s degree (5-yr est., 2021): 10.7% (state: 26.8%)
> Life expectancy at birth, 2019: 71.6 years (state: 76.1 years)
> Median annual household income (5-yr est., 2021): $43,000 (state: $56,956)
> County seat: Okemah
Okfuskee County, in east-central Oklahoma, ranks as the state’s worst county to live in. Major employers in the area include several manufacturing factories and a correctional facility, but jobs appear to be low paying. The typical household in the county earns just $43,000 a year, and 27.6% of the local population live below the poverty line – compared to a median income of $56,956 and a poverty rate of 15.2% across Oklahoma.
Of the 77 counties that make up Oklahoma, Okfuskee has the lowest life expectancy at birth, at just 71.6 years. Across the state, life expectancy at birth is 76.1 years.
[in-text-ad]

Source: Rex_Wholster / iStock via Getty Images
Oregon: Klamath County
> Poverty rate (5-yr est., 2021): 19.1% (state: 12.1%)
> Adults with a bachelor’s degree (5-yr est., 2021): 21.1% (state: 35.0%)
> Life expectancy at birth, 2019: 76.0 years (state: 79.6 years)
> Median annual household income (5-yr est., 2021): $50,790 (state: $70,084)
> County seat: Klamath Falls
Klamath County, located along Oregon’s southern border with California, has a poverty rate of 19.1% — well above the state rate of 12.1%. Health outcomes are also lagging in the county as the local life expectancy at birth is 76.0 years, three and a half years less than the state average.
Across broad populations, both financial security and life expectancy tend to rise with educational attainment. In Klamath County, only 21.1% of adults have a bachelor’s degree, compared to 35.0% of adults across all of Oregon.
 24/7 Wall St.
Source: Althom / iStock via Getty Images
Pennsylvania: Forest County
> Poverty rate (5-yr est., 2021): 16.7% (state: 11.8%)
> Adults with a bachelor’s degree (5-yr est., 2021): 11.2% (state: 33.1%)
> Life expectancy at birth, 2019: 76.7 years (state: 78.7 years)
> Median annual household income (5-yr est., 2021): $43,958 (state: $67,587)
> County seat: Tionesta
Forest County, located in western Pennsylvania, ranks as the state’s worst county to live in. An estimated 16.7% of the local population live below the poverty line, one of the top three highest poverty rates of all 67 counties in the state. As is the case in many parts of the country with relatively widespread financial insecurity, the county’s population is declining. Since 2015, the number of people living in Forest County fell by 6.1%, even as Pennsylvania’s population increased by 1.5%.
Life expectancy in the county also lags considerably behind the state as a whole. At birth, life expectancy is only 76.7 years, compared to the 78.7 year average across Pennsylvania.

Source: SeanPavonePhoto / iStock via Getty Images
Rhode Island: Providence County
> Poverty rate (5-yr est., 2021): 13.6% (state: 11.3%)
> Adults with a bachelor’s degree (5-yr est., 2021): 30.6% (state: 35.3%)
> Life expectancy at birth, 2019: 79.1 years (state: 79.5 years)
> Median annual household income (5-yr est., 2021): $65,797 (state: $74,489)
> County seat: Providence
A geographically small state, Rhode Island has only five counties. As a result, even though Providence County ranks as the worst county to live in the state, the disparity between the county and the state as a whole in several key socioeconomic indicators is not especially pronounced. The county’s poverty rate of 13.6% is not much higher than the 11.3% state rate. Similarly, at 79.1 years, life expectancy at birth in the county is nearly on par with the 79.5 year average across the state.
However, adults living in Providence County are considerably less likely to have a four-year college degree than the typical Rhode Island adult. Only 30.6% of the 25 and older population in the county have a bachelor’s degree compared to 35.3% of Rhode Island’s 25 and older population.
[in-text-ad-2]

Source: Public Domain / Wikimedia Commons
South Carolina: Marlboro County
> Poverty rate (5-yr est., 2021): 28.0% (state: 14.5%)
> Adults with a bachelor’s degree (5-yr est., 2021): 8.0% (state: 29.8%)
> Life expectancy at birth, 2019: 71.7 years (state: 76.8 years)
> Median annual household income (5-yr est., 2021): $32,136 (state: $58,234)
> County seat: Bennettsville
South Carolina is one of the fastest growing states in the country, reporting 6.3% population growth between 2015 and 2021. Marlboro County, however, located along the North Carolina border, is bucking the trend, reporting a 3.9% population decline over the same period.
The state’s worst county to live in, Marlboro’s poverty rate of 28.0% is nearly double the state rate of 14.5%. Health outcomes are also lagging in the county as the local life expectancy at birth is 71.7 years, more than half a decade below the statewide average.

South Dakota: Oglala Lakota County
> Poverty rate (5-yr est., 2021): 50.5% (state: 12.5%)
> Adults with a bachelor’s degree (5-yr est., 2021): 10.4% (state: 30.0%)
> Life expectancy at birth, 2019: 64.5 years (state: 78.7 years)
> Median annual household income (5-yr est., 2021): $33,192 (state: $63,920)
> County seat: Hot Springs
Oglala Lakota County, located in southern South Dakota and encompassing parts of the Pine Ridge Indian Reservation, ranks as the worst place to live in the state. Due to a number of historical and contemporary factors, many Native American reservations are among the poorest communities in the United States — and Oglala Lakota County is no exception. An estimated 50.5% of the population live below the poverty line, more than four times the 12.5% share of South Dakota residents.
Life expectancy in the county also lags considerably behind much of the rest of the state. At birth, life expectancy in Oglala Lakota County is only 64.5 years, compared to the 78.7 year average across South Dakota.
[in-text-ad]

Source: BOB WESTON / iStock via Getty Images
Tennessee: Hancock County
> Poverty rate (5-yr est., 2021): 29.1% (state: 14.3%)
> Adults with a bachelor’s degree (5-yr est., 2021): 11.1% (state: 29.0%)
> Life expectancy at birth, 2019: 72.1 years (state: 75.8 years)
> Median annual household income (5-yr est., 2021): $29,650 (state: $58,516)
> County seat: Sneedville
Hancock County is located in northern Tennessee along the Kentucky border. Lagging behind much of the rest of the state in several key socioeconomic measures, it ranks as the worst place to live in Tennessee.
For example, life expectancy at birth in Hancock County is only 72.1 years, well below the 75.8 year state average. Additionally, the local poverty rate of 29.1% is considerably higher than the 14.3% poverty rate across Tennessee. The county’s widespread poverty is likely due in part to a weak job market. In the last five years, an average of 8.8% of the local labor force was unemployed, compared to the 5.3% statewide jobless rate.
Source: dhughes9 / iStock via Getty Images
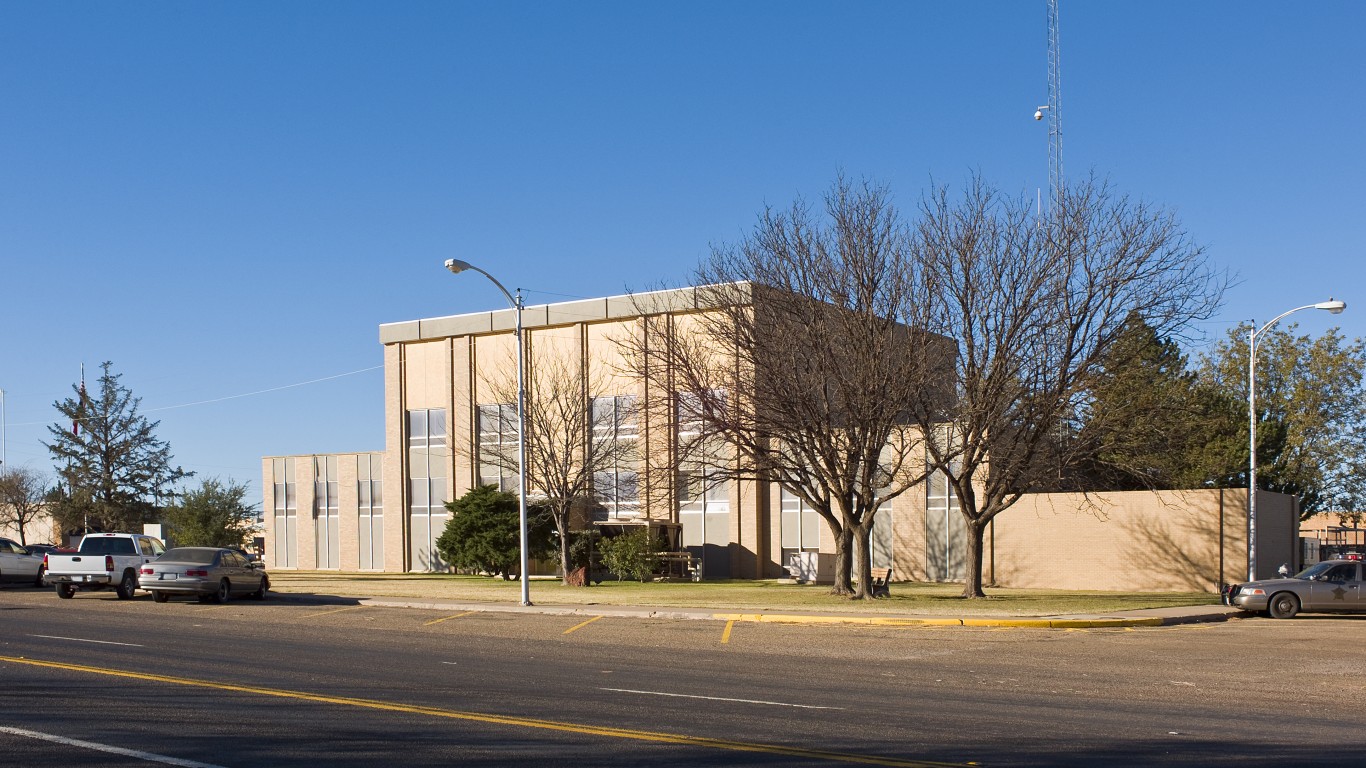
Texas: Cochran County
> Poverty rate (5-yr est., 2021): 27.1% (state: 14.0%)
> Adults with a bachelor’s degree (5-yr est., 2021): 9.7% (state: 31.5%)
> Life expectancy at birth, 2019: 74.8 years (state: 78.9 years)
> Median annual household income (5-yr est., 2021): $38,203 (state: $67,321)
> County seat: Morton
Of the 254 counties in Texas, Cochran County ranks as the worst place to live in. Located in central Texas along the New Mexico border, the area’s quality of life is undermined by widespread financial insecurity. An estimated 27.1% of the local population live below the poverty line, nearly two times the 14.0% poverty rate across Texas. Additionally, at just 74.8 years, life expectancy at birth in the county is over four years below the statewide average.
A college education is linked to longer life expectancy and greater financial security. In Cochran County, only 9.7% of adults have a bachelor’s degree or higher, well below the 31.5% share of adults across Texas who do.

Utah: Carbon County
> Poverty rate (5-yr est., 2021): 16.3% (state: 8.8%)
> Adults with a bachelor’s degree (5-yr est., 2021): 16.7% (state: 35.4%)
> Life expectancy at birth, 2019: 75.8 years (state: 79.9 years)
> Median annual household income (5-yr est., 2021): $51,725 (state: $79,133)
> County seat: Price
There are 29 counties in Utah, and of them, Carbon County, located in the southeast of Provo, ranks as the worst place to live in. The 16.3% local poverty rate is the third highest of any county in the state and well above the 8.8% poverty rate across Utah.
Americans with college educations are generally less exposed to economic downturns than those with lower educational attainment, and in Carbon County, only 16.7% of the adult population have a bachelor’s degree, compared to 35.4% of Utah residents over age 24. The county’s five-year average jobless rate of 6.8% is nearly double the comparable 3.5% rate across Utah. Economic conditions may be pushing people out of the county. Though Utah itself is one of the fastest-growing states, the county reported a 3.4% population decline between 2015 and 2021.
[in-text-ad-2]

Vermont: Essex County
> Poverty rate (5-yr est., 2021): 14.7% (state: 10.5%)
> Adults with a bachelor’s degree (5-yr est., 2021): 19.9% (state: 40.9%)
> Life expectancy at birth, 2019: 78.5 years (state: 79.9 years)
> Median annual household income (5-yr est., 2021): $48,194 (state: $67,674)
> County seat: Guildhall
A geographically small state, Vermont has only 14 counties. As a result, even though Essex County ranks as the worst county to live in the state, the disparity between the county and the state as a whole in several key socioeconomic indicators is not especially pronounced. At 78.5 years, life expectancy at birth in the county is within 1.5 years of the 79.9 year average across the state.
However, adults living in Essex County are half as likely to have a four-year college degree than the typical adult in Vermont. Only 19.9% of the 25 and older population in the county have a bachelor’s degree compared to 40.9% of Vermont’s 25 and older population.

Virginia: Martinsville
> Poverty rate (5-yr est., 2021): 25.4% (state: 9.9%)
> Adults with a bachelor’s degree (5-yr est., 2021): 22.1% (state: 40.3%)
> Life expectancy at birth, 2019: 67.9 years (state: 79.6 years)
> Median annual household income (5-yr est., 2021): $36,832 (state: $80,615)
> County seat: N/A
Of the 134 counties and county equivalents in Virginia, the independent city of Martinsville, located just above the North Carolina border, ranks as the state’s worst place to live in. More than one in every four Martinsville residents live below the poverty line, and at just 67.9 years, life expectancy at birth in the city is over a decade below the statewide average.
As is often the case in places with similarly poor socioeconomic conditions, Martinsville is losing residents faster than it is drawing them in. Between 2015 and 2021, the number of people living there fell by 1.1%, even as Virginia’s population expanded by 3.9%.
[in-text-ad]

Source: halbergman / E+ via Getty Images
Washington: Grays Harbor County
> Poverty rate (5-yr est., 2021): 15.1% (state: 10.0%)
> Adults with a bachelor’s degree (5-yr est., 2021): 16.3% (state: 37.3%)
> Life expectancy at birth, 2019: 76.7 years (state: 80.1 years)
> Median annual household income (5-yr est., 2021): $53,615 (state: $82,400)
> County seat: Montesano
Grays Harbor County ranks as Washington state’s worst county to live in. It is one of only two of the state’s 39 counties where fewer than 17% of adults have a bachelor’s degree or higher. The local bachelor’s degree attainment rate of 16.3% is less than half the comparable bachelor’s degree attainment rate of 37.3% statewide.
A college education is linked to greater financial security. In Grays Harbor County, 15.1% of residents live below the poverty line, compared to only 10.0% of Washington residents.

West Virginia: McDowell County
> Poverty rate (5-yr est., 2021): 28.9% (state: 16.9%)
> Adults with a bachelor’s degree (5-yr est., 2021): 6.4% (state: 21.8%)
> Life expectancy at birth, 2019: 69.0 years (state: 75.4 years)
> Median annual household income (5-yr est., 2021): $30,127 (state: $50,884)
> County seat: Welch
McDowell County was the largest coal-producing county in the United States in the early to mid 20th century. Like many coal-producing regions, it has suffered from long-term economic decline and now ranks as the worst of West Virginia’s 55 counties to live in. Since 2015, the local population has contracted by 7.1%, and in the last five years, an average of 13.5% of the labor force has been unemployed.
The local poverty rate of 28.9% is well above the 16.9% state poverty rate. Wide disparities also exist in health outcomes. Life expectancy at birth in McDowell County is only 69 years, over six years below life expectancy in West Virginia.

Source: Michael-Tatman / iStock via Getty Images
Wisconsin: Menominee County
> Poverty rate (5-yr est., 2021): 26.2% (state: 10.7%)
> Adults with a bachelor’s degree (5-yr est., 2021): 18.4% (state: 31.5%)
> Life expectancy at birth, 2019: 73.0 years (state: 79.5 years)
> Median annual household income (5-yr est., 2021): $54,940 (state: $67,080)
> County seat: Keshena
Wisconsin’s Menominee County ranks as the worst of the 72 counties in the state to live in. A college education is linked to greater financial and job security, and only 18.4% of county adults have a bachelor’s degree or higher, well below the 31.5% share of Wisconsin adults who do.
Meanwhile, the local poverty rate of 26.2% is more than double the 10.7% statewide rate, and in the last five years, an average of 12.5% of the local labor force has been unemployed, more than triple the 3.5% state jobless rate.
[in-text-ad-2]

Source: Jared Kail / iStock via Getty Images
Wyoming: Fremont County
> Poverty rate (5-yr est., 2021): 13.5% (state: 10.7%)
> Adults with a bachelor’s degree (5-yr est., 2021): 24.7% (state: 28.5%)
> Life expectancy at birth, 2019: 75.8 years (state: 79.0 years)
> Median annual household income (5-yr est., 2021): $57,887 (state: $68,002)
> County seat: Lander
In Fremont County, located in the central part of Wyoming, the typical area household earns only $57,887 a year, well below the median household income across the state of $68,002. Additionally, local residents are slightly more likely to live below the poverty line than the typical Wyoming resident.
Certain health outcomes in the county also lag considerably behind the state as a whole. At birth, life expectancy in Fremont County is 75.8 years, the lowest of all 23 Wyoming counties, and over four years below the 79.0 year average across Wyoming.
Methodology
To determine the worst county to live in every state, 24/7 Wall St. constructed an index of three measures: poverty, bachelor’s degree attainment among adults, and average life expectancy at birth. The selection of these three measures was inspired by the United Nations’ Human Development Index.
Data on the share of individuals living below the poverty line as well as the share of adults 25 years and older with at least a bachelor’s degree came from the 2021 U.S. Census Bureau’s American Community Survey and are five-year estimates.
Data on average life expectancy at birth came from the Institute for Health Metrics and Evaluation of the University of Washington and are for 2019.
Supplemental data on population, population change, and median household income are five-year estimates from the ACS. Data on the number of annual drug overdose deaths per 100,000 residents came from the Centers for Disease Control and Prevention and is for the years 2018 to 2021.
Take This Retirement Quiz To Get Matched With An Advisor Now (Sponsored)
Are you ready for retirement? Planning for retirement can be overwhelming, that’s why it could be a good idea to speak to a fiduciary financial advisor about your goals today.
Start by taking this retirement quiz right here from SmartAsset that will match you with up to 3 financial advisors that serve your area and beyond in 5 minutes. Smart Asset is now matching over 50,000 people a month.
Click here now to get started.
Thank you for reading! Have some feedback for us?
Contact the 24/7 Wall St. editorial team.
Editors' Picks