
The average Social Security retirement benefit for a retired worker is $1,837 a month, as of June 2023, according to the Social Security Administration. “Social Security is not meant to be your only source of income in retirement. On average, Social Security will replace about 40% of your annual pre-retirement earnings,” the SSA explains. Even so, in some of the nation’s metropolitan areas, that monthly Social Security check can go farther than others. (Also see: how much you need saved to retire comfortably in your state.)
To determine the cities where your Social Security check goes the farthest, 24/7 Wall St. reviewed data on retirement income from the U.S. Census Bureau and data on cost of living from the Economic Policy Institute 2022 Family Budget Calculator. Metropolitan areas where more than 31.1% of households receive Social Security were ranked based on average monthly household Social Security income as a percentage of estimated monthly living expenses for one person — that is, how much of the living expenses a Social Security check can cover.
The average of Social Security benefits covers at least 68% expenses in the 25 metropolitan areas on our list. The metro areas where Social Security benefits go the farthest are cities in the Midwest states of Michigan, Indiana, Illinois, Wisconsin, and Iowa, and in Florida. (These are the best places to retire in every state.)
Michigan has six cities on the list, the most of any state, including three in the top 10: Midland, Flint, and Monroe. Florida has three in the top 10 and five overall. The three Florida cities in the top 10 — The Villages, Sebastian-Vero Beach, Sebring-Avon Park — also rank among the top 10 metropolitan areas with the highest percentage of the population 65 years old and over.
Click here to see the best cities to live on social security alone.
Click here to read our detailed methodology.

25. Knoxville, TN
> Avg. Social Security benefits as share of expenses: 68.4%
> Avg. monthly Social Security income: $1,930 (126th highest of 384 MSAs)
> Avg. monthly living expenses: $2,820 (309th highest of 384 MSAs)
> Population 65 years and over: 18.9% (142nd highest of 384 MSAs)
[in-text-ad]

24. Homosassa Springs, FL
> Avg. Social Security benefits as share of expenses: 68.8%
> Avg. monthly Social Security income: $2,032 (41st highest of 384 MSAs)
> Avg. monthly living expenses: $2,953 (233rd highest of 384 MSAs)
> Population 65 years and over: 36.8% (3rd highest of 384 MSAs)
[recirclink id=1304224]

23. Bay City, MI
> Avg. Social Security benefits as share of expenses: 69.0%
> Avg. monthly Social Security income: $1,773 (281st highest of 384 MSAs)
> Avg. monthly living expenses: $2,569 (376th highest of 384 MSAs)
> Population 65 years and over: 21.5% (55th highest of 384 MSAs)

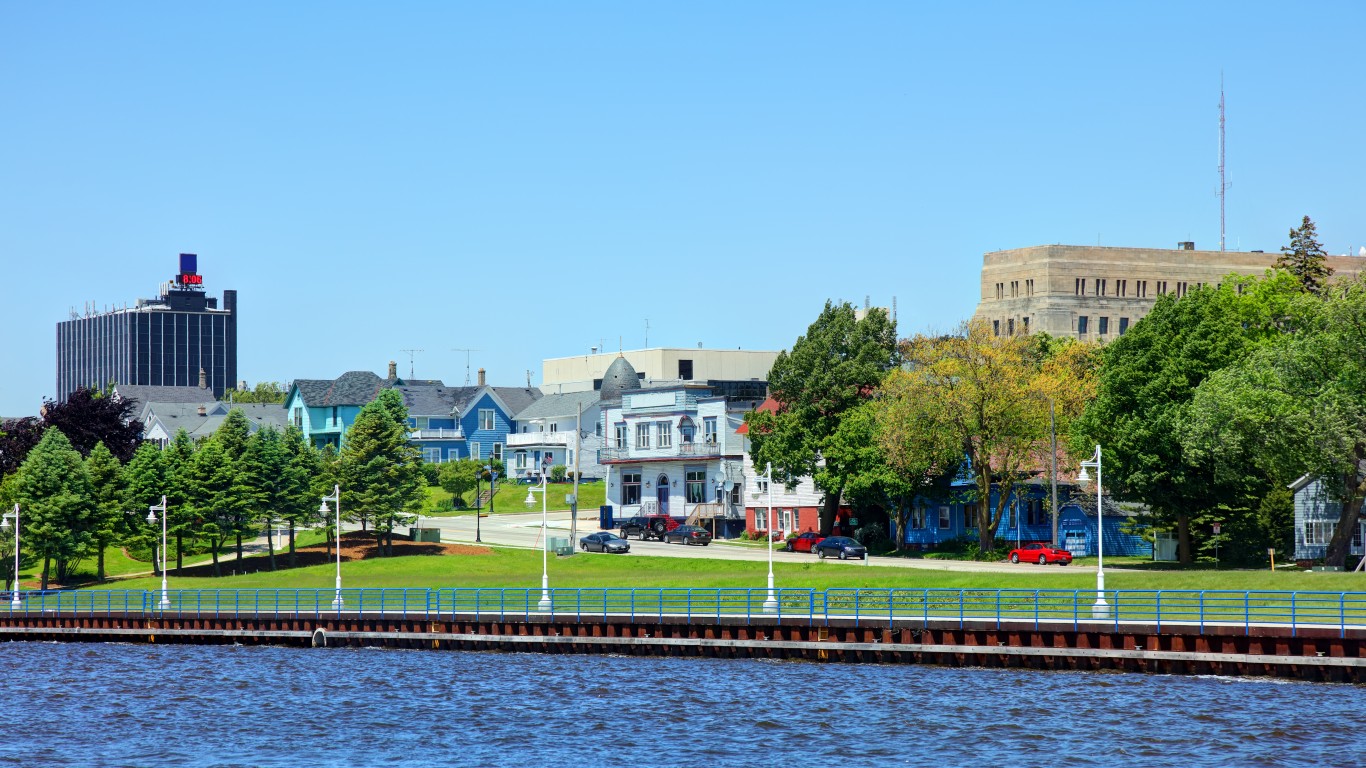
22. Battle Creek, MI
> Avg. Social Security benefits as share of expenses: 69.2%
> Avg. monthly Social Security income: $1,887 (172nd highest of 384 MSAs)
> Avg. monthly living expenses: $2,727 (347th highest of 384 MSAs)
> Population 65 years and over: 18.5% (153rd highest of 384 MSAs)
[in-text-ad-2]

21. Decatur, IL
> Avg. Social Security benefits as share of expenses: 69.3%
> Avg. monthly Social Security income: $1,940 (113th highest of 384 MSAs)
> Avg. monthly living expenses: $2,799 (320th highest of 384 MSAs)
> Population 65 years and over: 21.1% (62nd highest of 384 MSAs)

20. Decatur, AL
> Avg. Social Security benefits as share of expenses: 69.5%
> Avg. monthly Social Security income: $1,995 (65th highest of 384 MSAs)
> Avg. monthly living expenses: $2,871 (274th highest of 384 MSAs)
> Population 65 years and over: 18.4% (160th highest of 384 MSAs)
[in-text-ad]

19. Springfield, IL
> Avg. Social Security benefits as share of expenses: 69.7%
> Avg. monthly Social Security income: $2,016 (48th highest of 384 MSAs)
> Avg. monthly living expenses: $2,891 (264th highest of 384 MSAs)
> Population 65 years and over: 19.7% (106th highest of 384 MSAs)
[recirclink id=1264014]

18. La Crosse-Onalaska, WI-MN
> Avg. Social Security benefits as share of expenses: 69.9%
> Avg. monthly Social Security income: $1,988 (75th highest of 384 MSAs)
> Avg. monthly living expenses: $2,846 (295th highest of 384 MSAs)
> Population 65 years and over: 19.1% (132nd highest of 384 MSAs)

17. Myrtle Beach-Conway-North Myrtle Beach, SC-NC
> Avg. Social Security benefits as share of expenses: 69.9%
> Avg. monthly Social Security income: $2,125 (23rd highest of 384 MSAs)
> Avg. monthly living expenses: $3,039 (184th highest of 384 MSAs)
> Population 65 years and over: 28.9% (14th highest of 384 MSAs)
[in-text-ad-2]
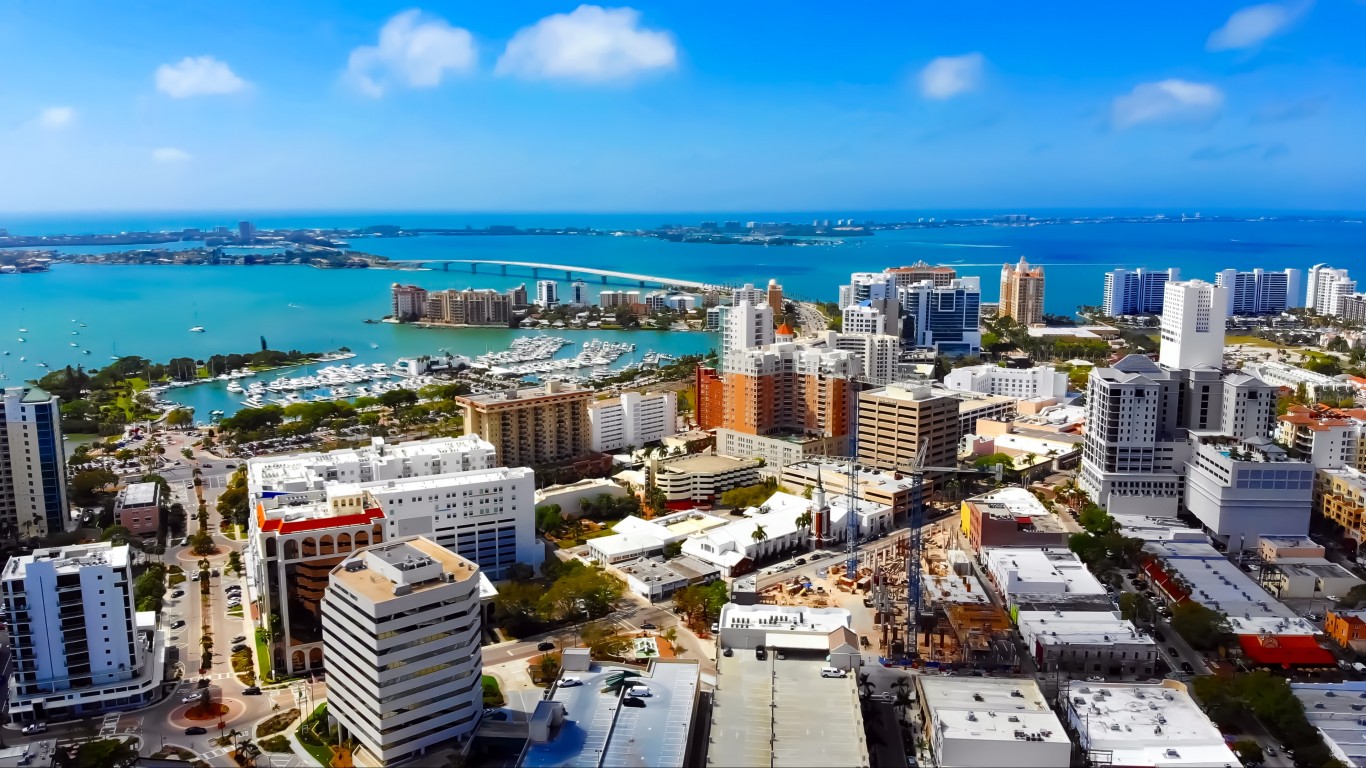
16. North Port-Sarasota-Bradenton, FL
> Avg. Social Security benefits as share of expenses: 70.0%
> Avg. monthly Social Security income: $2,235 (6th highest of 384 MSAs)
> Avg. monthly living expenses: $3,194 (117th highest of 384 MSAs)
> Population 65 years and over: 33.5% (9th highest of 384 MSAs)

15. Lansing-East Lansing, MI
> Avg. Social Security benefits as share of expenses: 70.1%
> Avg. monthly Social Security income: $2,012 (51st highest of 384 MSAs)
> Avg. monthly living expenses: $2,870 (276th highest of 384 MSAs)
> Population 65 years and over: 17.2% (226th highest of 384 MSAs)
[in-text-ad]

14. Waterloo-Cedar Falls, IA
> Avg. Social Security benefits as share of expenses: 70.1%
> Avg. monthly Social Security income: $1,962 (95th highest of 384 MSAs)
> Avg. monthly living expenses: $2,798 (321st highest of 384 MSAs)
> Population 65 years and over: 18.5% (157th highest of 384 MSAs)
[recirclink id=1240170]

13. Racine, WI
> Avg. Social Security benefits as share of expenses: 70.3%
> Avg. monthly Social Security income: $1,985 (79th highest of 384 MSAs)
> Avg. monthly living expenses: $2,823 (306th highest of 384 MSAs)
> Population 65 years and over: 18.2% (172nd highest of 384 MSAs)

12. Tucson, AZ
> Avg. Social Security benefits as share of expenses: 70.9%
> Avg. monthly Social Security income: $1,961 (96th highest of 384 MSAs)
> Avg. monthly living expenses: $2,765 (339th highest of 384 MSAs)
> Population 65 years and over: 21.2% (58th highest of 384 MSAs)
[in-text-ad-2]

11. Michigan City-La Porte, IN
> Avg. Social Security benefits as share of expenses: 71.2%
> Avg. monthly Social Security income: $1,892 (164th highest of 384 MSAs)
> Avg. monthly living expenses: $2,659 (365th highest of 384 MSAs)
> Population 65 years and over: 19.4% (121st highest of 384 MSAs)

10. Monroe, MI
> Avg. Social Security benefits as share of expenses: 71.3%
> Avg. monthly Social Security income: $2,022 (46th highest of 384 MSAs)
> Avg. monthly living expenses: $2,835 (301st highest of 384 MSAs)
> Population 65 years and over: 19.7% (103rd highest of 384 MSAs)
[in-text-ad]
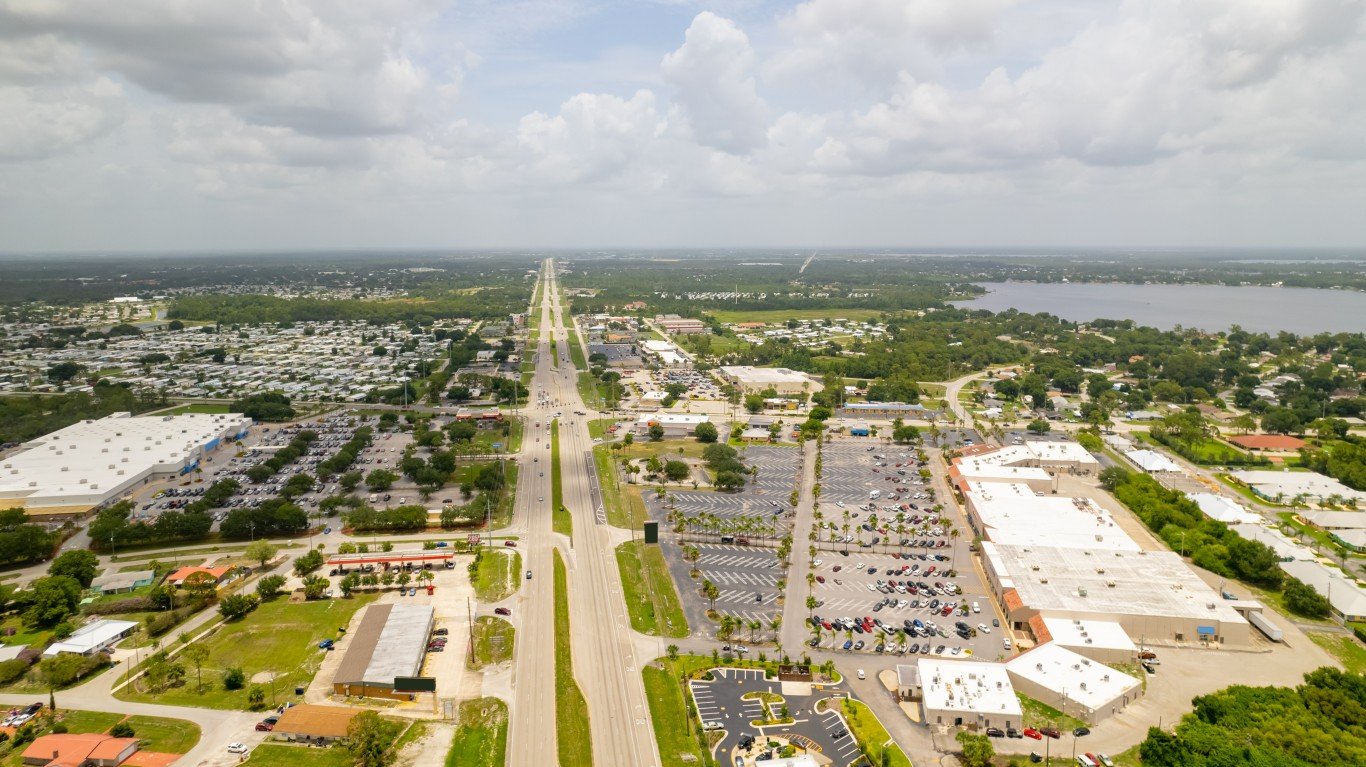
9. Sebring-Avon Park, FL
> Avg. Social Security benefits as share of expenses: 71.4%
> Avg. monthly Social Security income: $1,988 (76th highest of 384 MSAs)
> Avg. monthly living expenses: $2,786 (328th highest of 384 MSAs)
> Population 65 years and over: 35.8% (4th highest of 384 MSAs)
[recirclink id=1223888]

8. Sebastian-Vero Beach, FL
> Avg. Social Security benefits as share of expenses: 71.8%
> Avg. monthly Social Security income: $2,198 (9th highest of 384 MSAs)
> Avg. monthly living expenses: $3,062 (167th highest of 384 MSAs)
> Population 65 years and over: 35.5% (5th highest of 384 MSAs)
7. Sheboygan, WI
> Avg. Social Security benefits as share of expenses: 71.9%
> Avg. monthly Social Security income: $1,967 (91st highest of 384 MSAs)
> Avg. monthly living expenses: $2,734 (345th highest of 384 MSAs)
> Population 65 years and over: 20.1% (92nd highest of 384 MSAs)
[in-text-ad-2]

6. Cedar Rapids, IA
> Avg. Social Security benefits as share of expenses: 72.1%
> Avg. monthly Social Security income: $1,960 (97th highest of 384 MSAs)
> Avg. monthly living expenses: $2,717 (349th highest of 384 MSAs)
> Population 65 years and over: 18.2% (171st highest of 384 MSAs)

5. Pocatello, ID
> Avg. Social Security benefits as share of expenses: 72.5%
> Avg. monthly Social Security income: $1,989 (74th highest of 384 MSAs)
> Avg. monthly living expenses: $2,745 (343rd highest of 384 MSAs)
> Population 65 years and over: 15.4% (301st highest of 384 MSAs)
[in-text-ad]

4. Flint, MI
> Avg. Social Security benefits as share of expenses: 72.9%
> Avg. monthly Social Security income: $1,854 (205th highest of 384 MSAs)
> Avg. monthly living expenses: $2,544 (379th highest of 384 MSAs)
> Population 65 years and over: 18.9% (145th highest of 384 MSAs)
[recirclink id=1304224]

3. Salisbury, MD-DE
> Avg. Social Security benefits as share of expenses: 73.8%
> Avg. monthly Social Security income: $2,184 (11th highest of 384 MSAs)
> Avg. monthly living expenses: $2,959 (230th highest of 384 MSAs)
> Population 65 years and over: 26.5% (20th highest of 384 MSAs)

2. The Villages, FL
> Avg. Social Security benefits as share of expenses: 77.6%
> Avg. monthly Social Security income: $2,357 (highest of 384 MSAs)
> Avg. monthly living expenses: $3,038 (185th highest of 384 MSAs)
> Population 65 years and over: 57.8% (highest of 384 MSAs)
[in-text-ad-2]

1. Midland, MI
> Avg. Social Security benefits as share of expenses: 78.7%
> Avg. monthly Social Security income: $2,158 (17th highest of 384 MSAs)
> Avg. monthly living expenses: $2,744 (344th highest of 384 MSAs)
> Population 65 years and over: 20.5% (75th highest of 384 MSAs)
Methodology
To determine the cities where your Social Security check goes the farthest, 24/7 Wall St. reviewed data on retirement income from the U.S. Census Bureau and data on cost of living from the Economic Policy Institute 2022 Family Budget Calculator. Metropolitan statistical areas were ranked based on average monthly household Social Security income as a percentage of estimated monthly living expenses for one person.
Data on mean household Social Security income is from the U.S. Census Bureau’s 2022 American Community Survey and are one-year estimates. Data on estimated monthly living expenses, which includes housing costs, food costs, transportation costs, health care costs, taxes, and other costs, came from the EPI’s 2022 Family Budget Calculator and was aggregated from the county to the MSA level using boundary definitions for July 2023 from the U.S. Census Bureau. Only metropolitan statistical areas in which more households receive Social Security income than the 31.1% national figure were considered. Data on the percentage of the population that is 65 years and over is from the 2022 ACS and are one-year estimates.
Contact [email protected] for any questions or corrections.