
California and Hawaii are among the most desired domestic tourist spots in the United States, but not necessarily the most desirable destinations for retirees relying on Social Security to maintain their living standards. (Here are America’s most popular tourist attractions according to data.)
With the high cost of living in these states, retirees would spend considerably more of their Social Security checks on the same items than they would in other states. Further, within these states, some cities are even more expensive than the state average. Nationwide, several metropolitan areas have high cost of living.
To determine the cities where your Social Security gets eaten up, 24/7 Wall St. reviewed data on retirement income from the U.S. Census Bureau and data on cost of living from the Economic Policy Institute 2022 Family Budget Calculator. The list consists of metropolitan areas where Social Security income can cover 52% or less of average monthly household living expenses for one person.
The average Social Security retirement benefit for a retired worker is $1,837 a month, according to the Social Security Administration as of June 2023. On average, Social Security will replace about 40% of your annual pre-retirement earnings,” the SSA explains. In high-cost places, this is a challenge, especially while inflation, now running at 3.7%, continues to eat away at savings and at purchasing power.
Of the 25 metropolitan areas on the list, the ones where your Social Security gets eaten up the most, 11 are in California, including eight of the top 10. In two of those California locales, Social Security benefits can cover less than 40% of expenses. The other two cities in the top 10 — Honolulu and Kahului-Wailuku-Lahaina — are in Hawaii.
Five California cities on the list are in the the top 10 for the highest monthly living expenses among the 384 metropolitan statistical areas tracked by the U.S. Census Bureau. (Also see: how much you need saved to retire comfortably in your state.)
Other than the 11 metros in California and two in Hawaii, only one other state has multiple cities on the list. In three metros in Louisiana your Social Security check gets eaten up — in Hammond, Monroe, and Alexandria.
Click here to see the cities where you social security check gets eaten up.
Click here to read our detailed methodology.

25. Chico, CA
> Avg. Social Security benefits as share of expenses: 52.5%
> Avg. monthly Social Security income: $1,835 (224th highest of 384 MSAs)
> Avg. monthly living expenses: $3,496 (51st highest of 384 MSAs)
> Population 65 years and over: 18.6% (152nd highest of 384 MSAs)
[in-text-ad]

24. Elizabethtown-Fort Knox, KY
> Avg. Social Security benefits as share of expenses: 52.0%
> Avg. monthly Social Security income: $1,524 (374th highest of 384 MSAs)
> Avg. monthly living expenses: $2,932 (246th highest of 384 MSAs)
> Population 65 years and over: 15.7% (291st highest of 384 MSAs)
[recirclink id=1304224]

23. Grants Pass, OR
> Avg. Social Security benefits as share of expenses: 52.0%
> Avg. monthly Social Security income: $1,829 (231st highest of 384 MSAs)
> Avg. monthly living expenses: $3,520 (46th highest of 384 MSAs)
> Population 65 years and over: 27.4% (17th highest of 384 MSAs)

22. Texarkana, TX-AR
> Avg. Social Security benefits as share of expenses: 51.7%
> Avg. monthly Social Security income: $1,495 (376th highest of 384 MSAs)
> Avg. monthly living expenses: $2,889 (266th highest of 384 MSAs)
> Population 65 years and over: 18.4% (159th highest of 384 MSAs)
[in-text-ad-2]

21. Madera, CA
> Avg. Social Security benefits as share of expenses: 51.3%
> Avg. monthly Social Security income: $1,864 (196th highest of 384 MSAs)
> Avg. monthly living expenses: $3,636 (36th highest of 384 MSAs)
> Population 65 years and over: 15.0% (315th highest of 384 MSAs)
20. Goldsboro, NC
> Avg. Social Security benefits as share of expenses: 51.1%
> Avg. monthly Social Security income: $1,562 (368th highest of 384 MSAs)
> Avg. monthly living expenses: $3,056 (172nd highest of 384 MSAs)
> Population 65 years and over: 17.0% (231st highest of 384 MSAs)
[in-text-ad]

19. Carson City, NV
> Avg. Social Security benefits as share of expenses: 51.1%
> Avg. monthly Social Security income: $1,546 (373rd highest of 384 MSAs)
> Avg. monthly living expenses: $3,025 (195th highest of 384 MSAs)
> Population 65 years and over: 22.9% (35th highest of 384 MSAs)
[recirclink id=1264014]

18. Miami-Fort Lauderdale-Pompano Beach, FL
> Avg. Social Security benefits as share of expenses: 50.7%
> Avg. monthly Social Security income: $1,734 (307th highest of 384 MSAs)
> Avg. monthly living expenses: $3,420 (64th highest of 384 MSAs)
> Population 65 years and over: 19.5% (118th highest of 384 MSAs)

17. Dover, DE
> Avg. Social Security benefits as share of expenses: 50.4%
> Avg. monthly Social Security income: $1,740 (301st highest of 384 MSAs)
> Avg. monthly living expenses: $3,450 (58th highest of 384 MSAs)
> Population 65 years and over: 18.5% (155th highest of 384 MSAs)
[in-text-ad-2]

16. New Haven-Milford, CT
> Avg. Social Security benefits as share of expenses: 50.3%
> Avg. monthly Social Security income: $1,855 (203rd highest of 384 MSAs)
> Avg. monthly living expenses: $3,686 (30th highest of 384 MSAs)
> Population 65 years and over: 18.2% (167th highest of 384 MSAs)
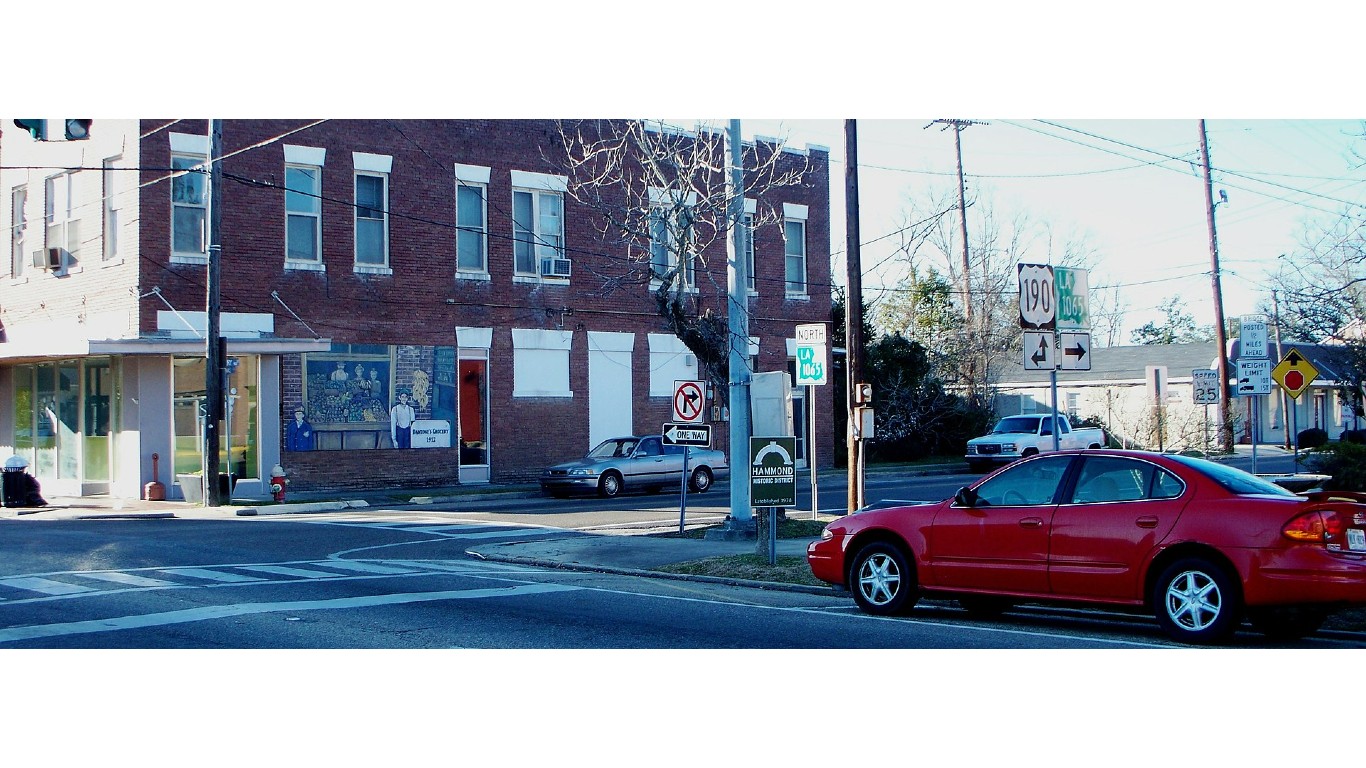
15. Hammond, LA
> Avg. Social Security benefits as share of expenses: 50.3%
> Avg. monthly Social Security income: $1,600 (359th highest of 384 MSAs)
> Avg. monthly living expenses: $3,184 (118th highest of 384 MSAs)
> Population 65 years and over: 15.5% (299th highest of 384 MSAs)
[in-text-ad]

14. Poughkeepsie-Newburgh-Middletown, NY
> Avg. Social Security benefits as share of expenses: 50.1%
> Avg. monthly Social Security income: $1,999 (60th highest of 384 MSAs)
> Avg. monthly living expenses: $3,988 (22nd highest of 384 MSAs)
> Population 65 years and over: 16.7% (245th highest of 384 MSAs)
[recirclink id=1240170]

13. Monroe, LA
> Avg. Social Security benefits as share of expenses: 50.0%
> Avg. monthly Social Security income: $1,506 (375th highest of 384 MSAs)
> Avg. monthly living expenses: $3,014 (202nd highest of 384 MSAs)
> Population 65 years and over: 17.1% (229th highest of 384 MSAs)

12. Alexandria, LA
> Avg. Social Security benefits as share of expenses: 48.3%
> Avg. monthly Social Security income: $1,379 (383rd highest of 384 MSAs)
> Avg. monthly living expenses: $2,853 (287th highest of 384 MSAs)
> Population 65 years and over: 16.9% (236th highest of 384 MSAs)
[in-text-ad-2]

11. Yuba City, CA
> Avg. Social Security benefits as share of expenses: 46.6%
> Avg. monthly Social Security income: $1,634 (351st highest of 384 MSAs)
> Avg. monthly living expenses: $3,505 (50th highest of 384 MSAs)
> Population 65 years and over: 15.2% (308th highest of 384 MSAs)

10. San Luis Obispo-Paso Robles, CA
> Avg. Social Security benefits as share of expenses: 46.1%
> Avg. monthly Social Security income: $1,952 (103rd highest of 384 MSAs)
> Avg. monthly living expenses: $4,230 (16th highest of 384 MSAs)
> Population 65 years and over: 22.2% (39th highest of 384 MSAs)
[in-text-ad]

9. Oxnard-Thousand Oaks-Ventura, CA
> Avg. Social Security benefits as share of expenses: 45.3%
> Avg. monthly Social Security income: $1,953 (101st highest of 384 MSAs)
> Avg. monthly living expenses: $4,314 (14th highest of 384 MSAs)
> Population 65 years and over: 17.5% (203rd highest of 384 MSAs)
[recirclink id=1223888]

8. Santa Rosa-Petaluma, CA
> Avg. Social Security benefits as share of expenses: 44.8%
> Avg. monthly Social Security income: $2,034 (40th highest of 384 MSAs)
> Avg. monthly living expenses: $4,544 (9th highest of 384 MSAs)
> Population 65 years and over: 22.0% (42nd highest of 384 MSAs)

7. Napa, CA
> Avg. Social Security benefits as share of expenses: 44.6%
> Avg. monthly Social Security income: $2,060 (32nd highest of 384 MSAs)
> Avg. monthly living expenses: $4,624 (7th highest of 384 MSAs)
> Population 65 years and over: 21.6% (51st highest of 384 MSAs)
[in-text-ad-2]

6. Vallejo, CA
> Avg. Social Security benefits as share of expenses: 44.5%
> Avg. monthly Social Security income: $1,817 (246th highest of 384 MSAs)
> Avg. monthly living expenses: $4,088 (18th highest of 384 MSAs)
> Population 65 years and over: 17.6% (192nd highest of 384 MSAs)
5. El Centro, CA
> Avg. Social Security benefits as share of expenses: 43.5%
> Avg. monthly Social Security income: $1,367 (384th highest of 384 MSAs)
> Avg. monthly living expenses: $3,140 (137th highest of 384 MSAs)
> Population 65 years and over: 13.8% (347th highest of 384 MSAs)
[in-text-ad]

4. Urban Honolulu, HI
> Avg. Social Security benefits as share of expenses: 42.9%
> Avg. monthly Social Security income: $1,976 (86th highest of 384 MSAs)
> Avg. monthly living expenses: $4,611 (8th highest of 384 MSAs)
> Population 65 years and over: 19.6% (112th highest of 384 MSAs)
[recirclink id=1303348]

3. Kahului-Wailuku-Lahaina, HI
> Avg. Social Security benefits as share of expenses: 40.6%
> Avg. monthly Social Security income: $1,891 (165th highest of 384 MSAs)
> Avg. monthly living expenses: $4,653 (6th highest of 384 MSAs)
> Population 65 years and over: 21.0% (63rd highest of 384 MSAs)

2. Salinas, CA
> Avg. Social Security benefits as share of expenses: 37.8%
> Avg. monthly Social Security income: $1,793 (262nd highest of 384 MSAs)
> Avg. monthly living expenses: $4,743 (5th highest of 384 MSAs)
> Population 65 years and over: 15.3% (304th highest of 384 MSAs)
[in-text-ad-2]

1. Santa Cruz-Watsonville, CA
> Avg. Social Security benefits as share of expenses: 34.1%
> Avg. monthly Social Security income: $1,978 (85th highest of 384 MSAs)
> Avg. monthly living expenses: $5,808 (2nd highest of 384 MSAs)
> Population 65 years and over: 19.1% (129th highest of 384 MSAs)
Methodology
To determine the cities where your Social Security gets eaten up, 24/7 Wall St. reviewed data on retirement income from the U.S. Census Bureau and data on cost of living from the Economic Policy Institute 2022 Family Budget Calculator. Metropolitan statistical areas were ranked based on average monthly household Social Security income as a percentage of estimated monthly living expenses for one person.
Data on mean household Social Security income is from the U.S. Census Bureau’s 2022 American Community Survey and are one-year estimates. Data on estimated monthly living expenses, which includes housing costs, food costs, transportation costs, healthcare costs, taxes, and other costs, came from the EPI’s 2022 Family Budget Calculator and was aggregated from the county to the MSA level using boundary definitions for July 2023 from the U.S. Census Bureau. Only metropolitan statistical areas in which more households receive Social Security income than the 31.1% national figure were considered. Data on the percentage of the population that is 65 years and over is from the 2022 ACS and are one-year estimates.
Contact [email protected] for any questions or corrections.