
Even though progress has been made to combat binge drinking in America, it remains a problem. One in six American adults indulges in excessive drinking on a single occasion, according to the Centers for Disease Control and Prevention. The agency defines binge drinking as consuming five or more drinks on one occasion for men or four or more drinks for women. Not surprisingly, the country’s drunkest metro areas track closely with the drunkest states in America.
To compile a list of the drunkest places in every state, 24/7 Tempo reviewed the percentage of men and women over 18 who reported heavy or binge drinking in each state’s metropolitan areas, then singled out the city or metropolitan area with the highest rate. (Only one metro area was considered in Delaware, New Hampshire, Rhode Island, and Vermont.) Metro level data was aggregated from the 2023 County Health Rankings & Roadmaps, a Robert Wood Johnson Foundation and University of Wisconsin Population Health Institute joint program. County level data on the number of alcohol-related Countywide driving deaths also came from the CHR.
Excessive drinking — along with tobacco use, inadequate exercise, and poor nutrition — is one of four main risk factors for preventable disease identified by the CDC. Besides tearing apart families, binge drinking has the potential for serious health consequences. Studies have shown that it can be a factor in chronic conditions such as liver disease, cancer, heart disease, and hypertension. Excessive alcohol use is responsible for more than 140,000 deaths in the United States each year. (See how deaths from alcohol-related cirrhosis have gone up almost every year since 2000.)
Binge drinking also imperils drivers and passengers in vehicles. In 2021, 13,384 in the U.S. perished in alcohol-impaired driving traffic deaths. Every day, about 37 in America die in drunk-driving crashes.
The national average for adult excessive drinking is 19.8%, and 34 metro areas imbibe at above that rate. The drunkest metro areas in America are in the Plains states, Midwest, and Far West. Three of the four metro areas with the highest incidence of alcohol-related Countywide driving deaths are in Montana, North Dakota, and Alaska. These also happen to be some of America’s largest states by size and areas that experience some of the coldest weather in the U.S., which may encourage alcohol consumption.
Seven of the biggest binge-drinking metropolitan areas on our list are metros with populations of more than 1 million. The Baltimore-Columbia-Towson metro, with a population of 2.8 million, is the largest.
An anomaly on the list is Ocean City, New Jersey. The town has prohibited alcohol sales and drinking in public since it was founded by Methodist ministers in 1879. This has apparently not stopped residents and visitors from quaffing plenty of alcohol.
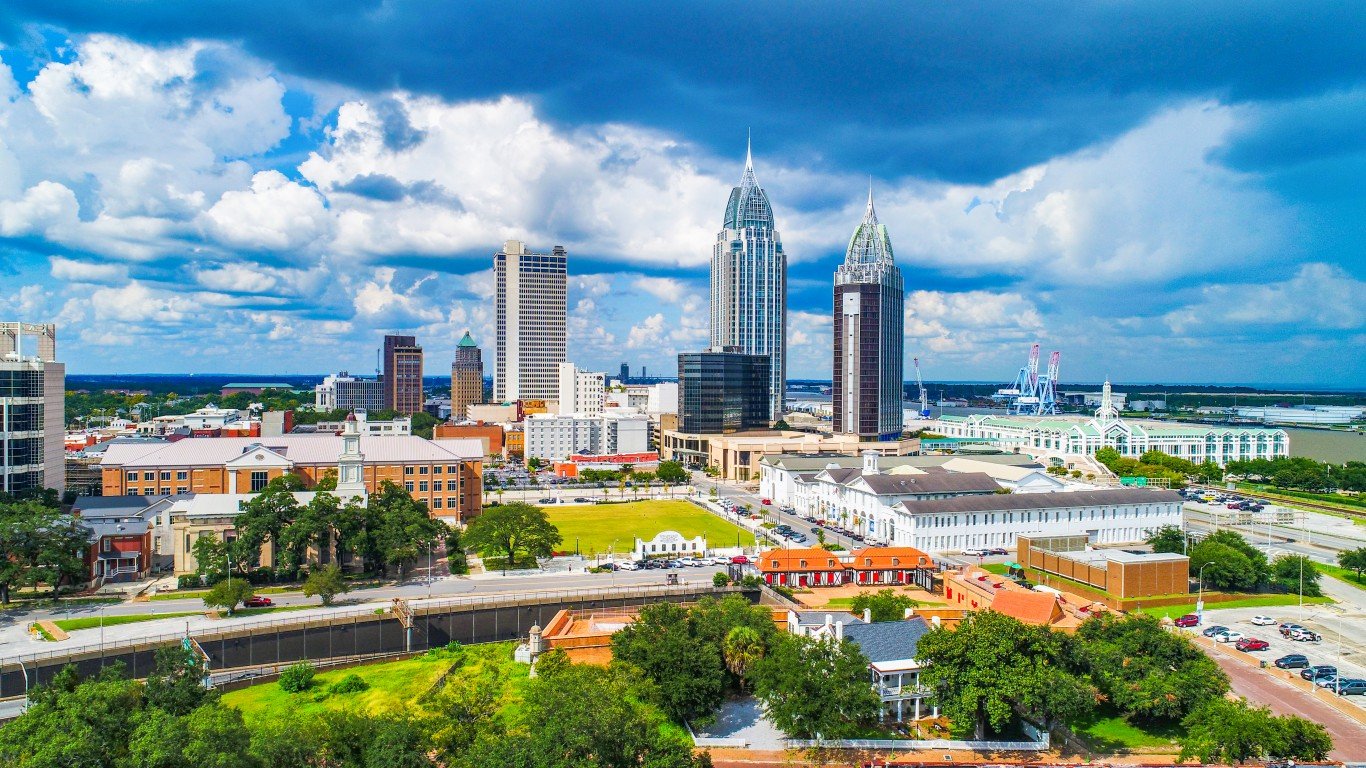
Alabama
> Drunkest metro area: Daphne-Fairhope-Foley
> Adults who drink excessively: 19.0% (Statewide: 16.1% – 6th lowest)
> Countywide driving deaths involving alcohol: 32.2% (Statewide: 25.9% – 17th lowest)
> Daphne-Fairhope-Foley population: 246,435
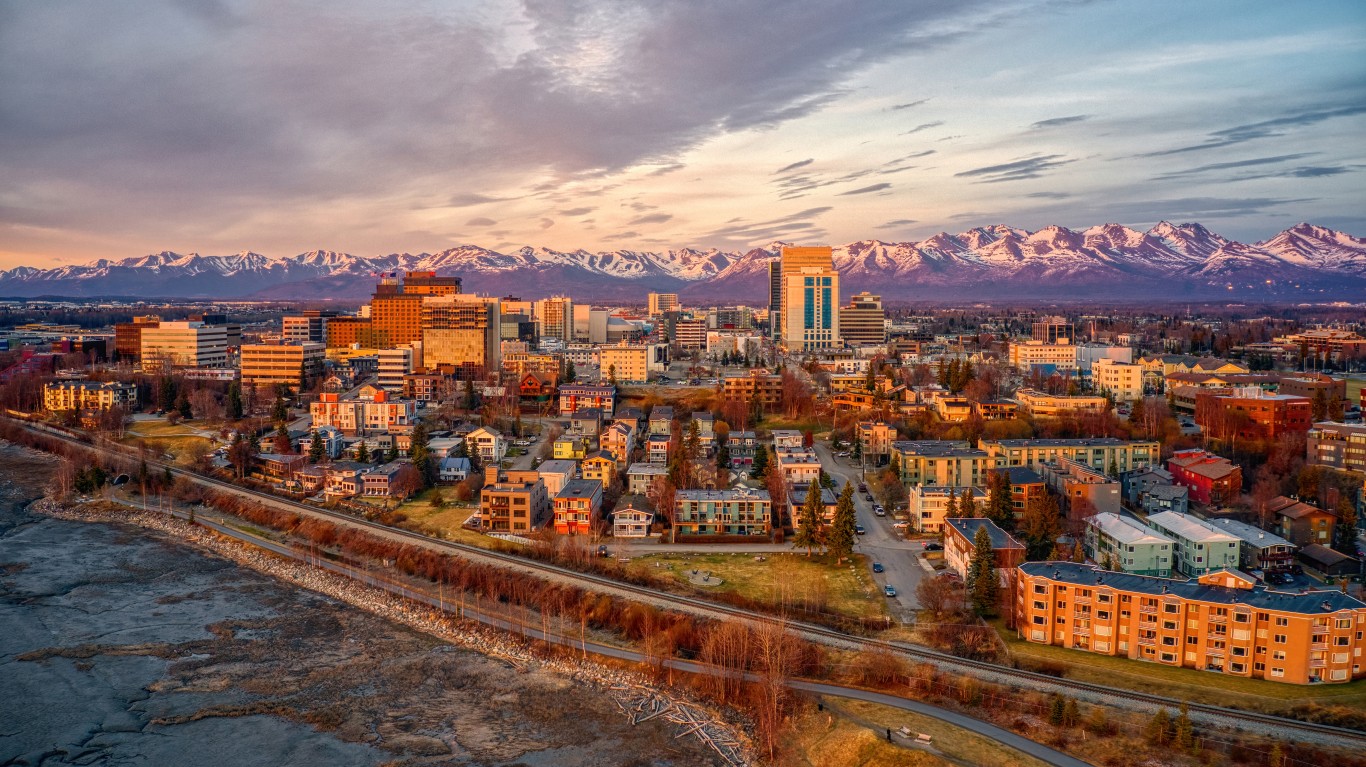
Alaska
> Drunkest metro area: Anchorage
> Adults who drink excessively: 21.6% (Statewide: 20.0% – 13th highest)
> Countywide driving deaths involving alcohol: 30.3% (Statewide: 36.9% – 4th highest)
> Anchorage population: 400,470

Arizona
> Drunkest metro area: Lake Havasu City-Kingman
> Adults who drink excessively: 22.3% (Statewide: 17.4% – 16th lowest)
> Countywide driving deaths involving alcohol: 22.5% (Statewide: 22.3% – 8th lowest)
> Lake Havasu City-Kingman population: 220,816
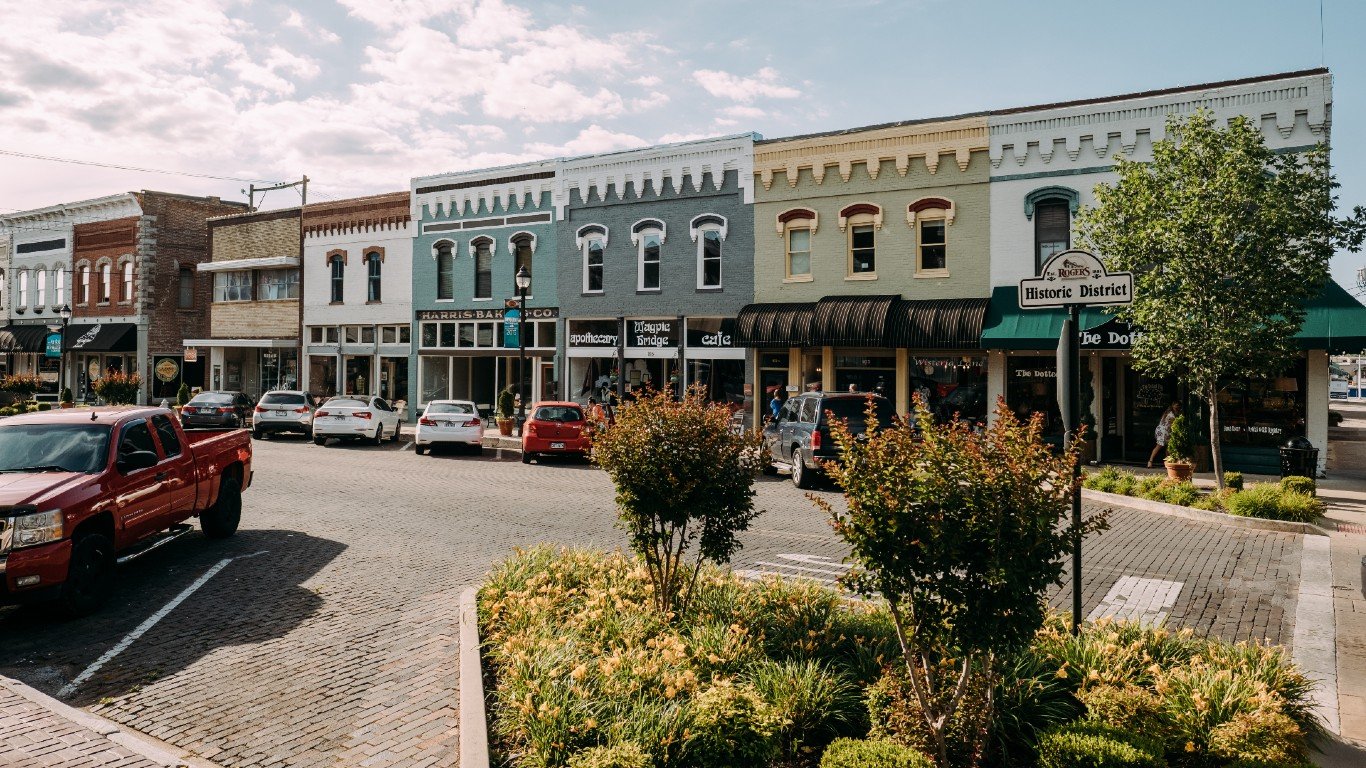
Arkansas
> Drunkest metro area: Fayetteville-Springdale-Rogers
> Adults who drink excessively: 18.0% (Statewide: 17.8% – 20th lowest)
> Countywide driving deaths involving alcohol: 25.7% (Statewide: 25.7% – 15th lowest)
> Fayetteville-Springdale-Rogers population: 576,724
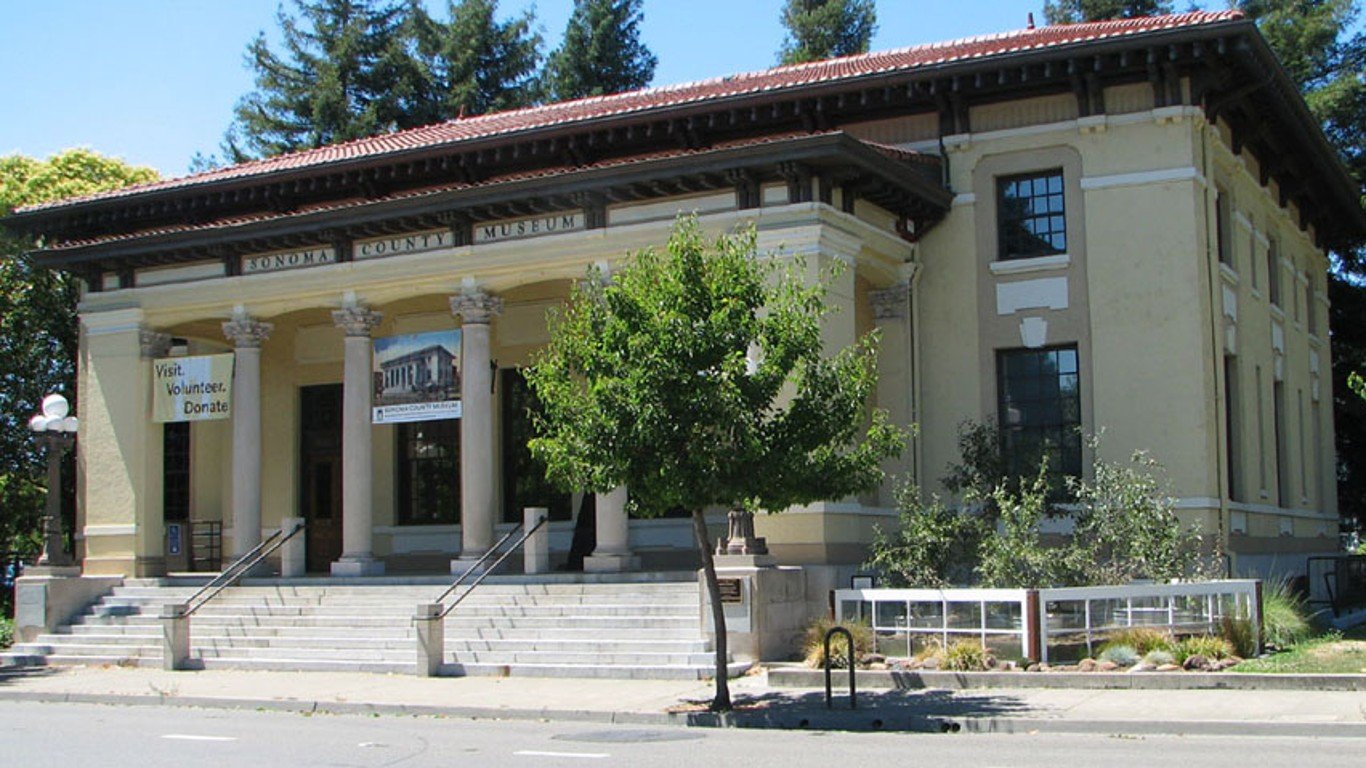
California
> Drunkest metro area: Santa Rosa-Petaluma
> Adults who drink excessively: 23.2% (Statewide: 18.4% – 24th lowest)
> Countywide driving deaths involving alcohol: 32.8% (Statewide: 27.7% – 23rd lowest)
> Santa Rosa-Petaluma population: 482,650
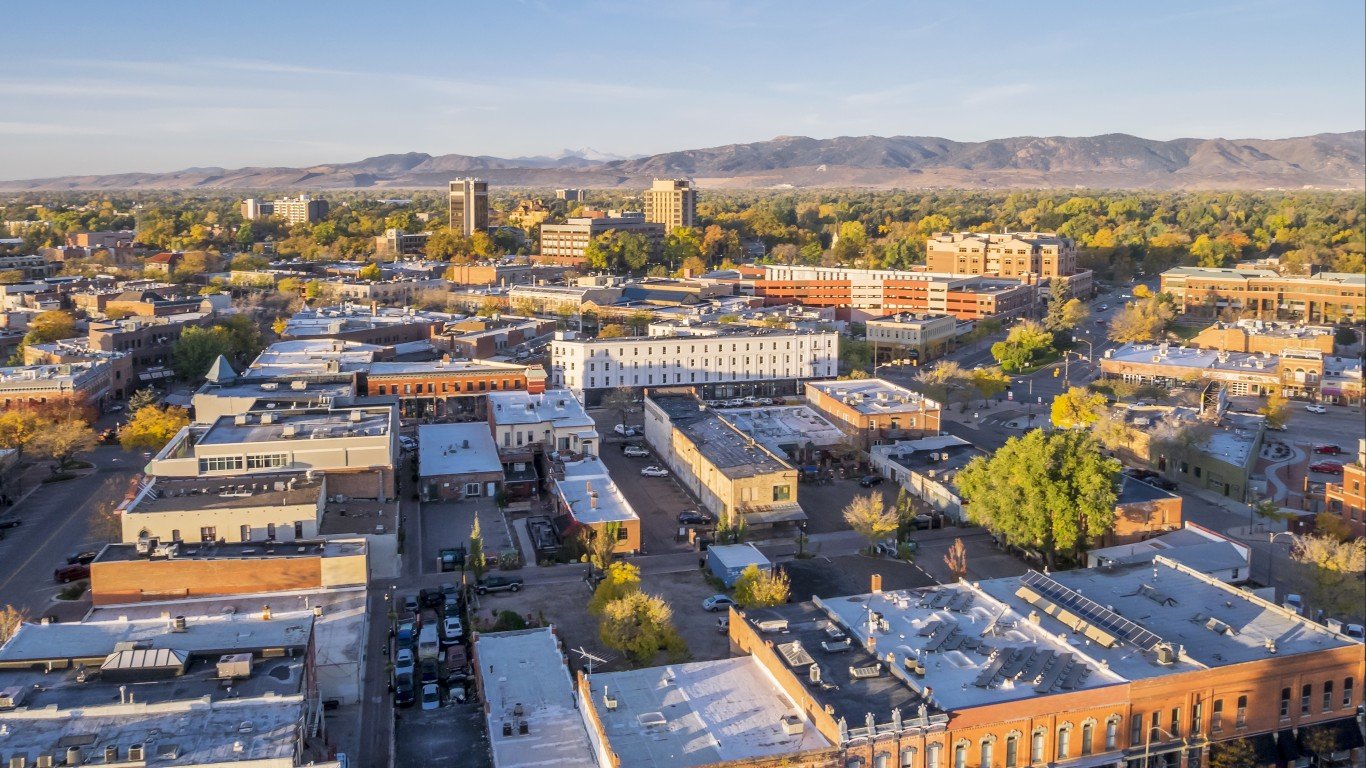
Colorado
> Drunkest metro area: Fort Collins
> Adults who drink excessively: 22.2% (Statewide: 20.3% – 11th highest)
> Countywide driving deaths involving alcohol: 33.3% (Statewide: 34.0% – 9th highest)
> Fort Collins population: 366,778
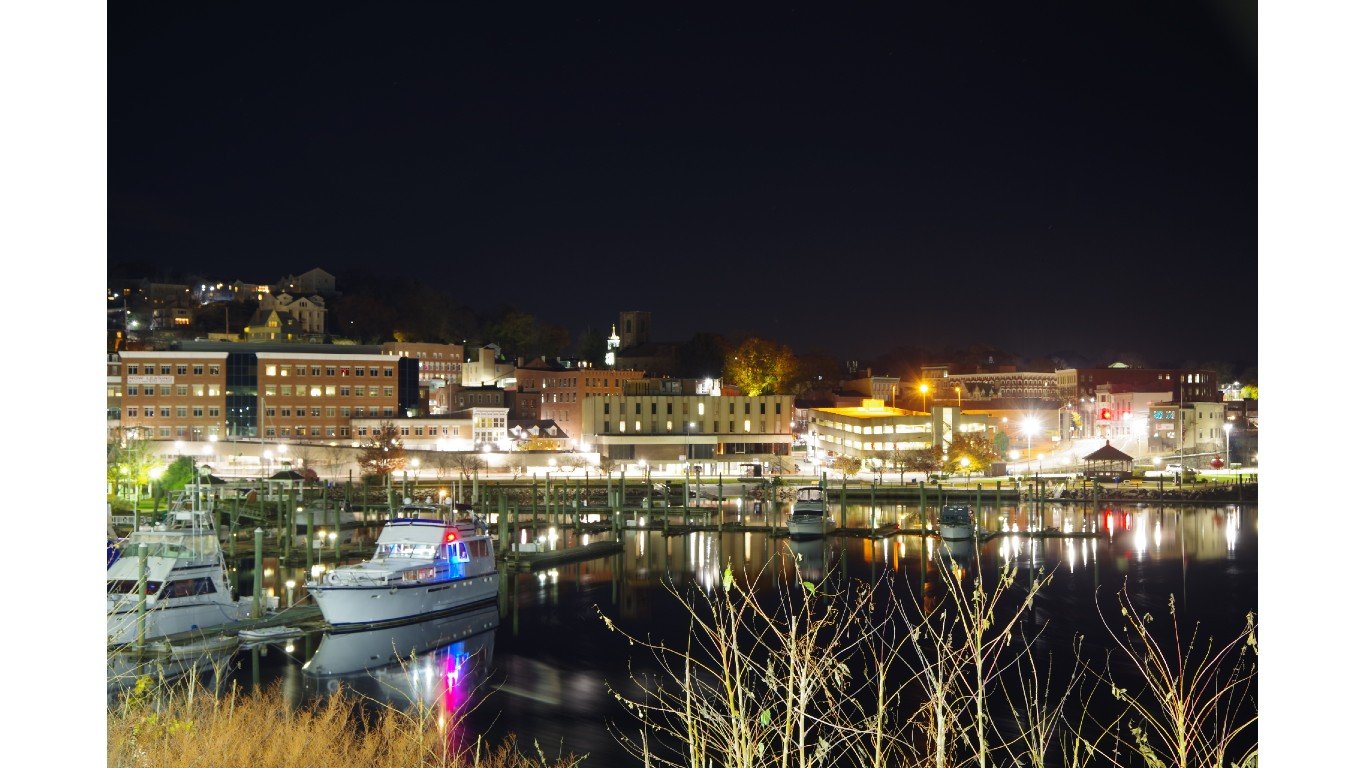
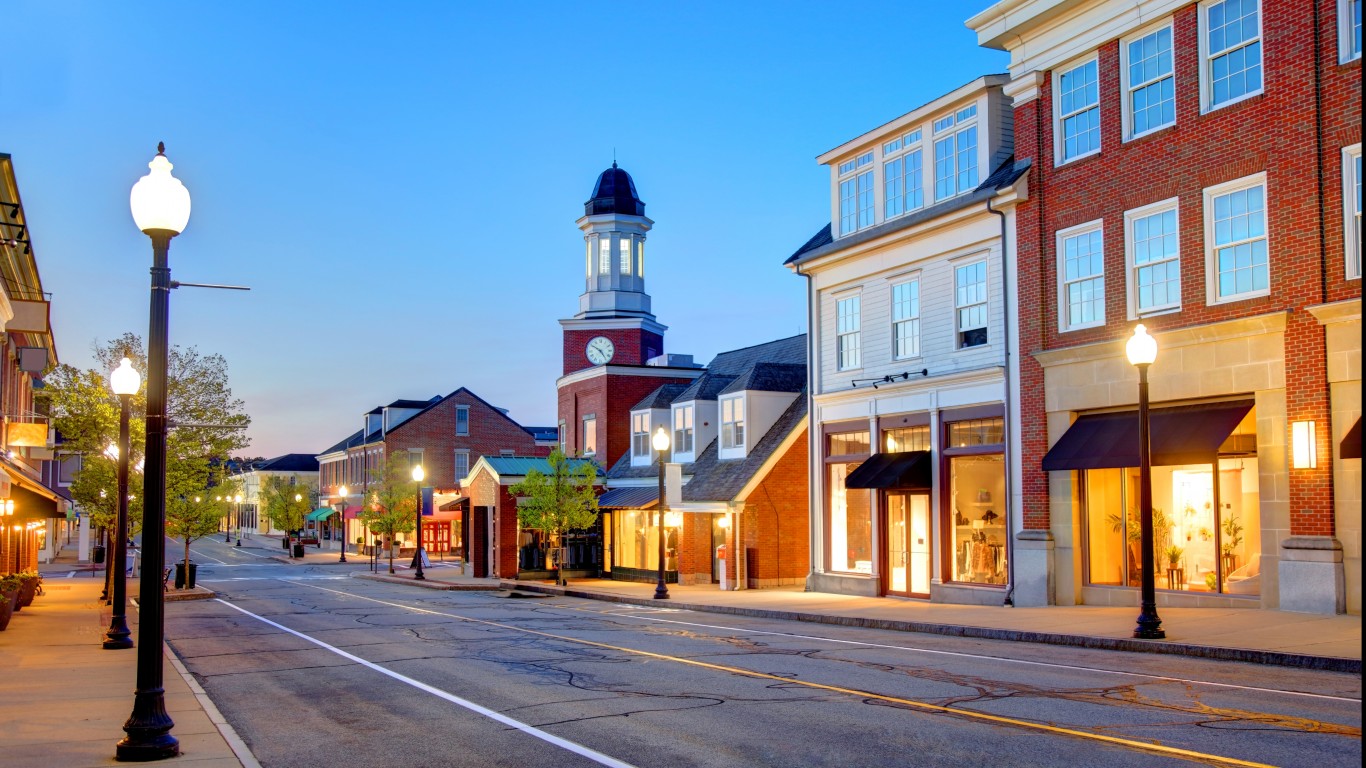
Connecticut
> Drunkest metro area: Norwich-New London
> Adults who drink excessively: 20.8% (Statewide: 17.4% – 17th lowest)
> Countywide driving deaths involving alcohol: 34.1% (Statewide: 30.4% – 20th highest)
> Norwich-New London population: 269,902
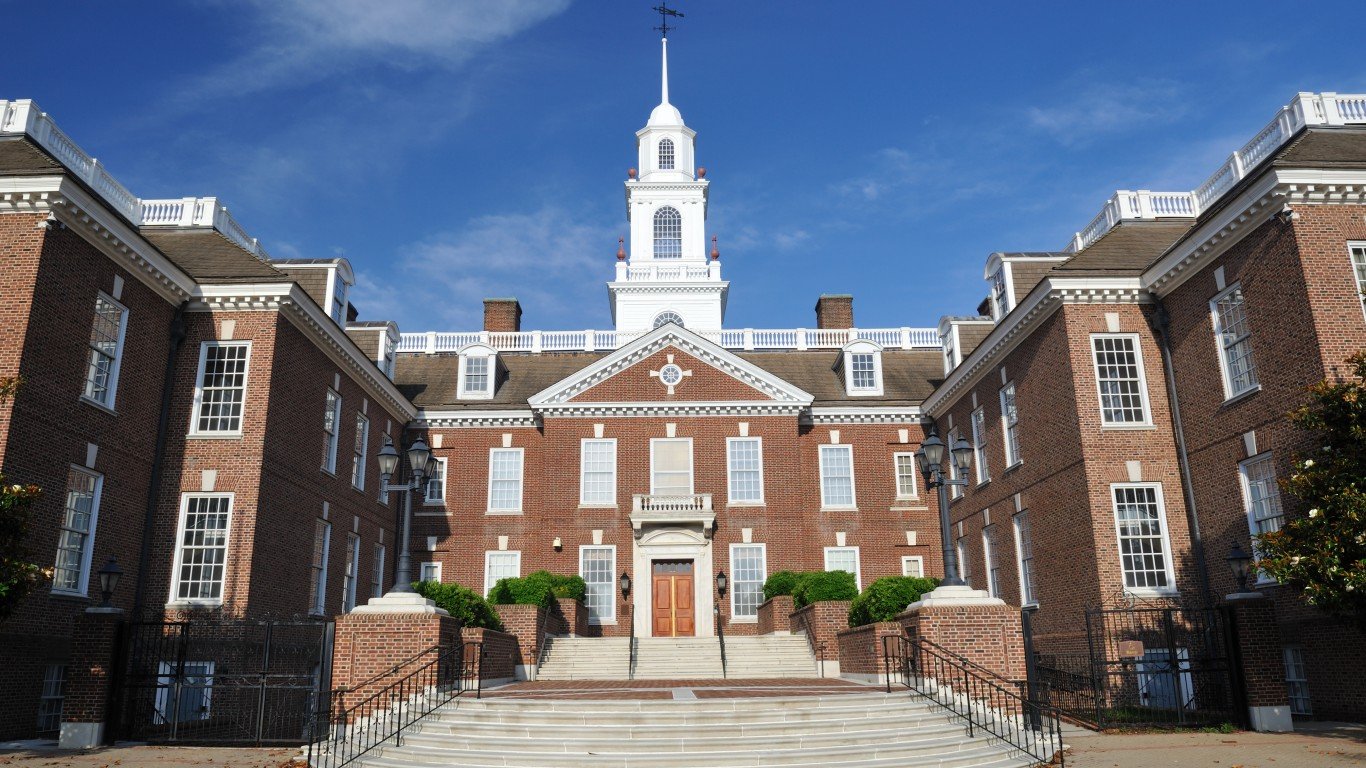
Delaware
> Drunkest metro area: Dover
> Adults who drink excessively: 16.1% (Statewide: 17.3% – 15th lowest)
> Countywide driving deaths involving alcohol: 28.0% (Statewide: 25.0% – 11th lowest)
> Dover population: 186,946

Florida
> Drunkest metro area: Homosassa Springs
> Adults who drink excessively: 21.6% (Statewide: 17.2% – 14th lowest)
> Countywide driving deaths involving alcohol: 21.9% (Statewide: 22.0% – 7th lowest)
> Homosassa Springs population: 162,529
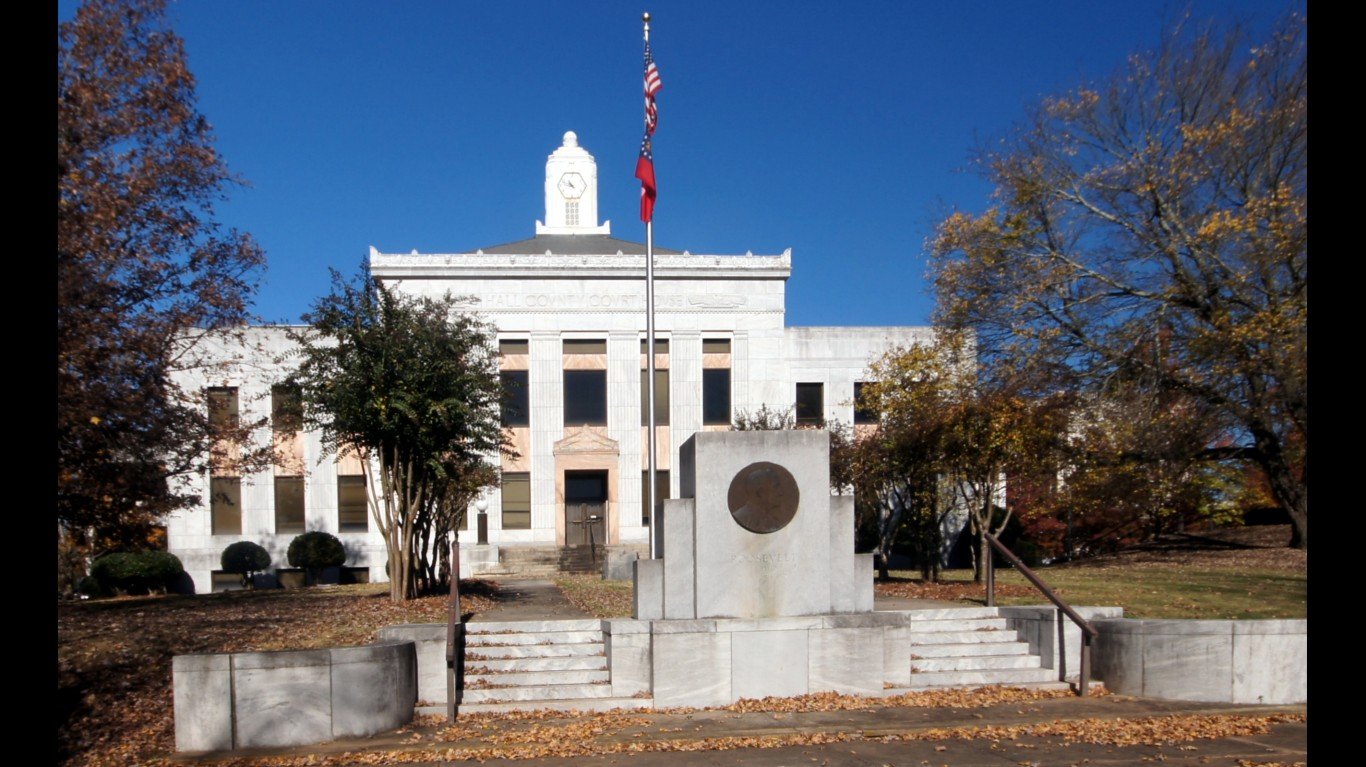
Georgia
> Drunkest metro area: Gainesville
> Adults who drink excessively: 17.5% (Statewide: 16.2% – 7th lowest)
> Countywide driving deaths involving alcohol: 17.6% (Statewide: 20.7% – 5th lowest)
> Gainesville population: 212,692

Hawaii
> Drunkest metro area: Kahului-Wailuku-Lahaina
> Adults who drink excessively: 21.5% (Statewide: 19.0% – 24th highest)
> Countywide driving deaths involving alcohol: 44.8% (Statewide: 31.5% – 16th highest)
> Kahului-Wailuku-Lahaina population: 164,365
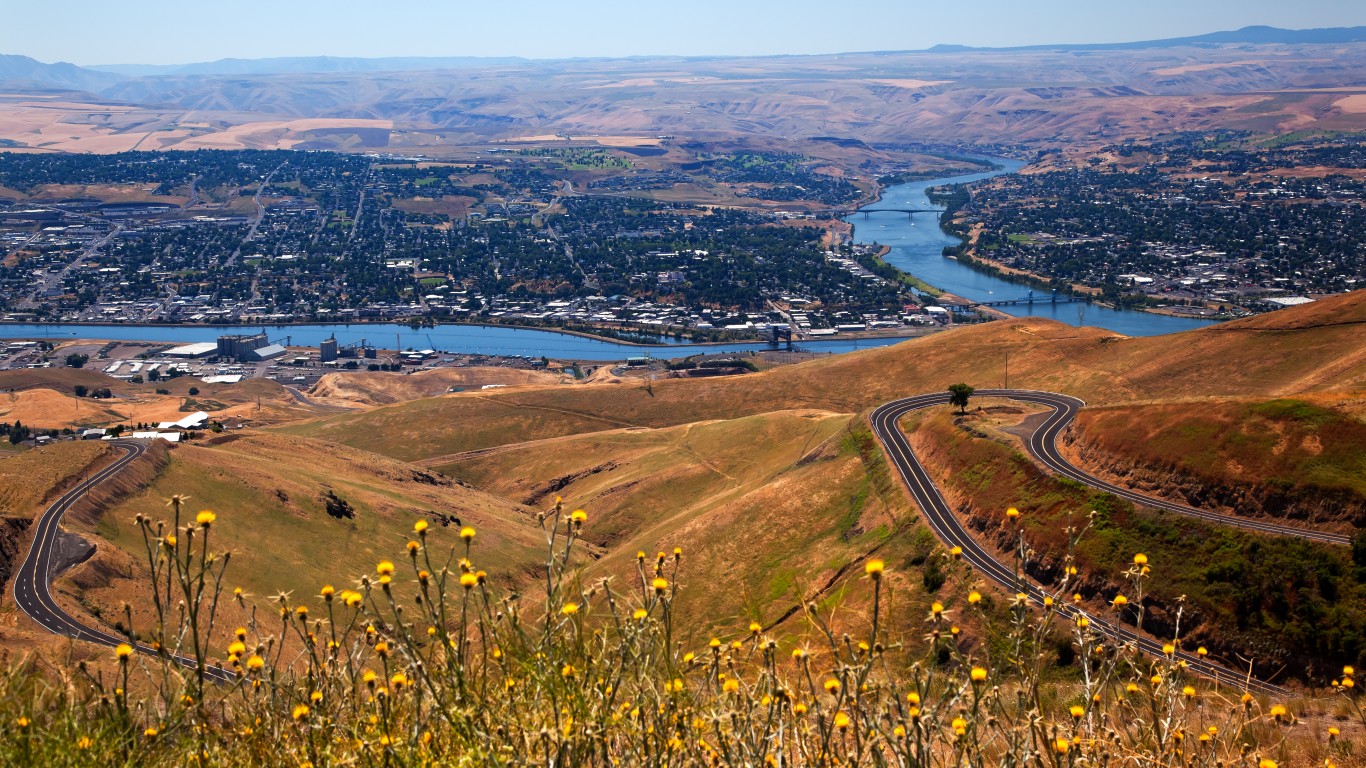
Idaho
> Drunkest metro area: Lewiston
> Adults who drink excessively: 20.3% (Statewide: 17.1% – 13th lowest)
> Countywide driving deaths involving alcohol: 28.2% (Statewide: 31.1% – 18th highest)
> Lewiston population: 65,512
Illinois
> Drunkest metro area: Kankakee
> Adults who drink excessively: 17.2% (Statewide: 15.4% – 5th lowest)
> Countywide driving deaths involving alcohol: 40.0% (Statewide: 28.8% – 25th highest)
> Kankakee population: 106,074
Indiana
> Drunkest metro area: Bloomington
> Adults who drink excessively: 19.4% (Statewide: 18.4% – 23rd lowest)
> Countywide driving deaths involving alcohol: 12.3% (Statewide: 19.0% – 2nd lowest)
> Bloomington population: 161,227
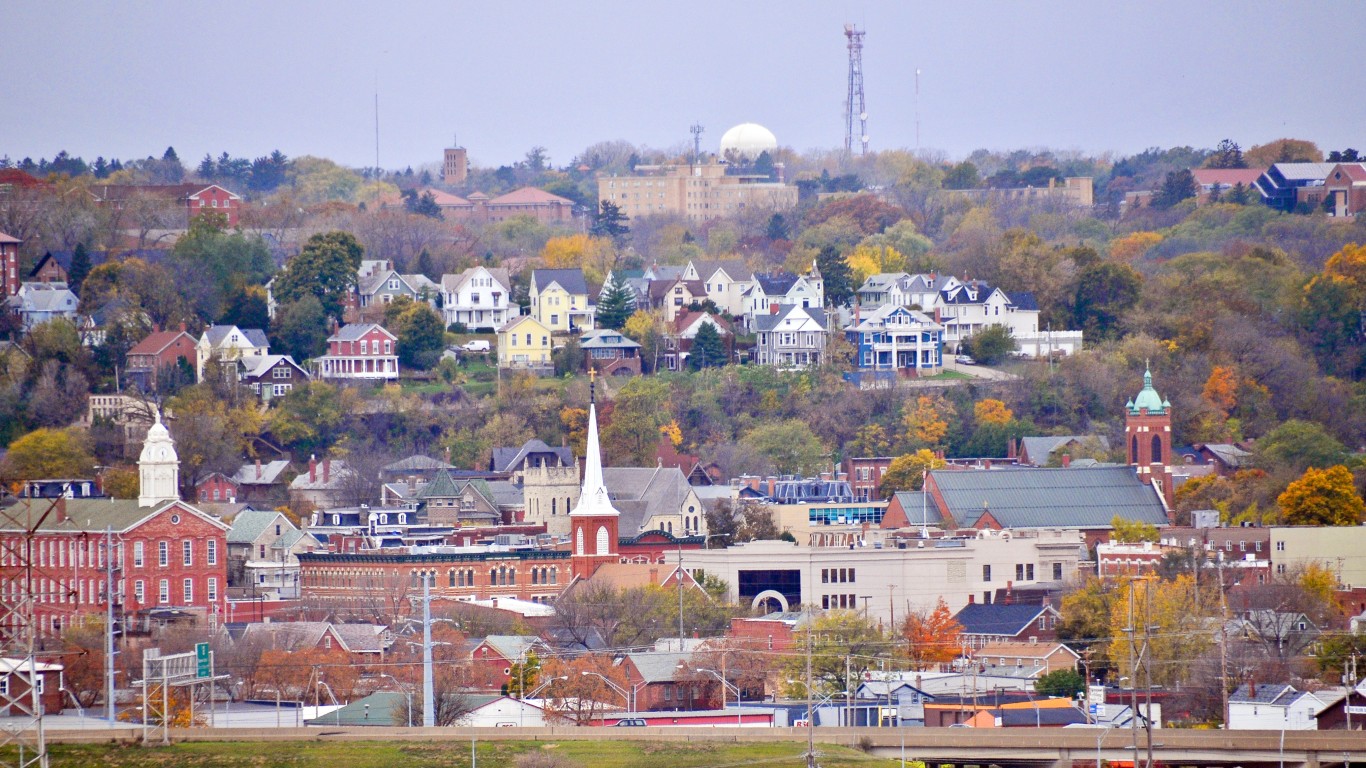
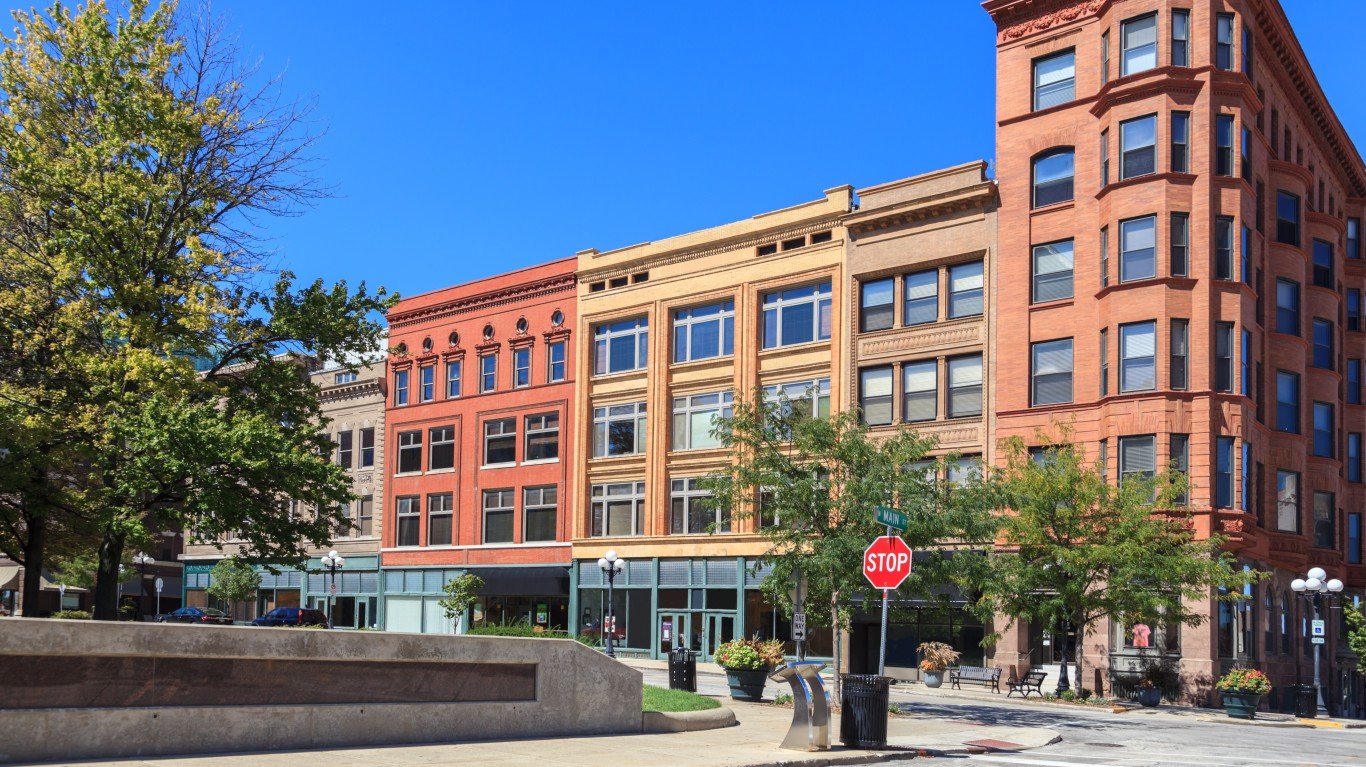
Iowa
> Drunkest metro area: Dubuque
> Adults who drink excessively: 27.4% Statewide: 24.7% – 2nd highest)
> Countywide driving deaths involving alcohol: 19.4% (Statewide: 26.8% – 19th lowest)
> Dubuque population: 98,677
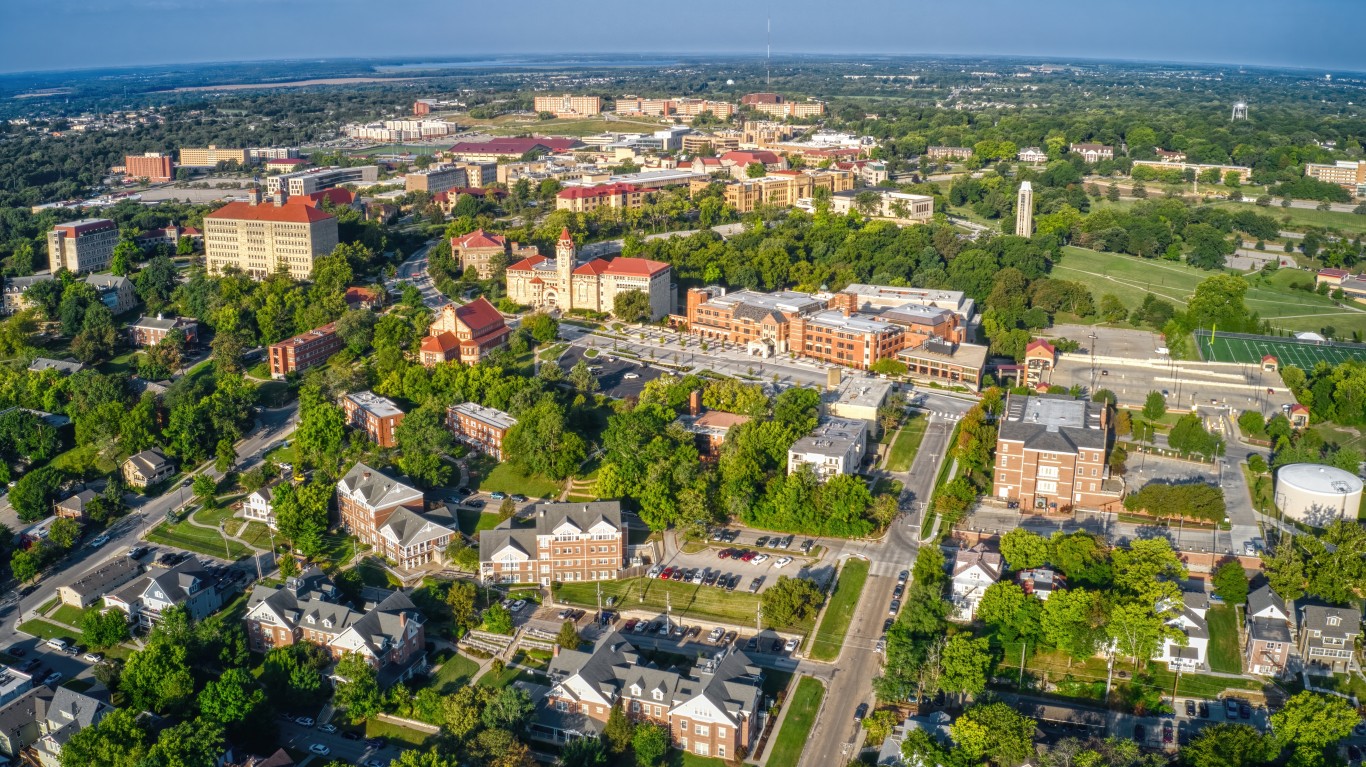
Kansas
> Drunkest metro area: Lawrence
> Adults who drink excessively: 20.6% (Statewide: 19.7% – 18th highest)
> Countywide driving deaths involving alcohol: 33.3% (Statewide: 19.4% – 3rd lowest)
> Lawrence population: 119,964

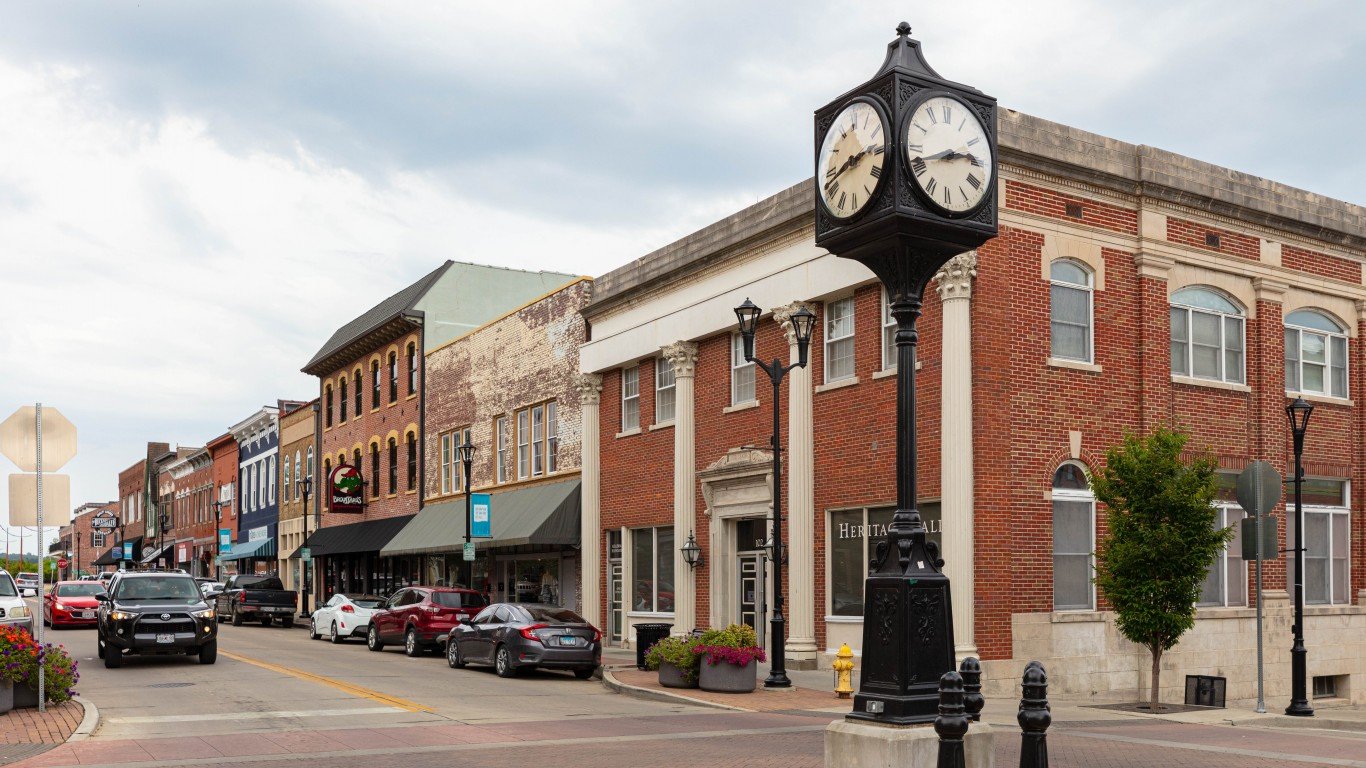
Kentucky
> Drunkest metro area: Louisville/Jefferson County
> Adults who drink excessively: 18.1% (Statewide: 16.8% – 9th lowest)
> Countywide driving deaths involving alcohol: 24.4% (Statewide: 25.5% – 14th lowest)
> Louisville/Jefferson County population: 1,285,426
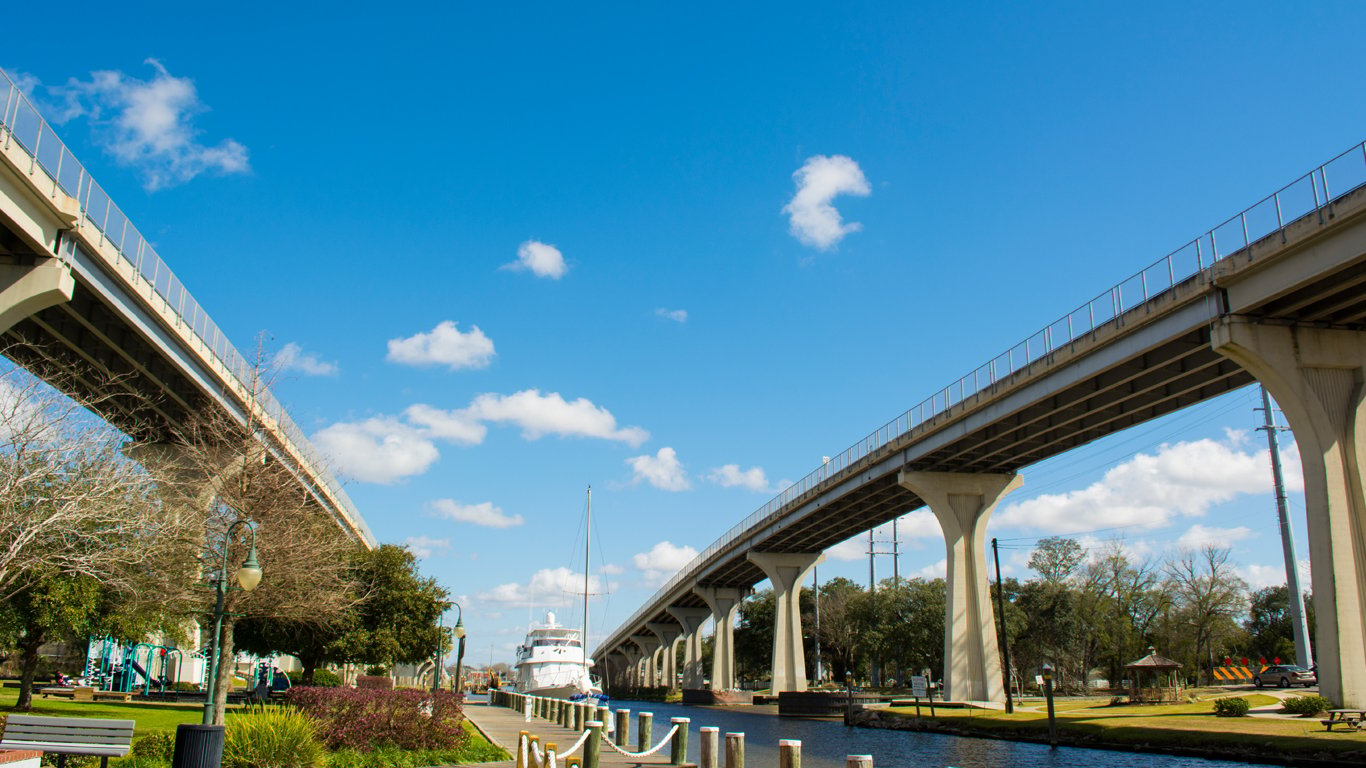
Louisiana
> Drunkest metro area: Houma-Thibodaux
> Adults who drink excessively: 22.7% (Statewide: 21.9% – 7th highest)
> Countywide driving deaths involving alcohol: 37.0% (Statewide: 31.2% – 17th highest)
> Houma-Thibodaux population: 200,656

Maine
> Drunkest metro area: Portland-South Portland
> Adults who drink excessively: 20.3% (Statewide: 19.0% – 21st highest)
> Countywide driving deaths involving alcohol: 28.2% (Statewide: 34.4% – 8th highest)
> Portland-South Portland population: 561,576

Maryland
> Drunkest metro area: Baltimore-Columbia-Towson
> Adults who drink excessively: 17.1% (Statewide: 14.6% – 4th lowest)
> Countywide driving deaths involving alcohol: 25.8% (Statewide: 28.3% – 25th lowest)
> Baltimore-Columbia-Towson population: 2,835,672
Massachusetts
> Drunkest metro area: Barnstable Town
> Adults who drink excessively: 24.2% (Statewide: 19.3% – 20th highest)
> Countywide driving deaths involving alcohol: 38.8% (Statewide: 30.5% – 19th highest)
> Barnstable Town population: 232,457
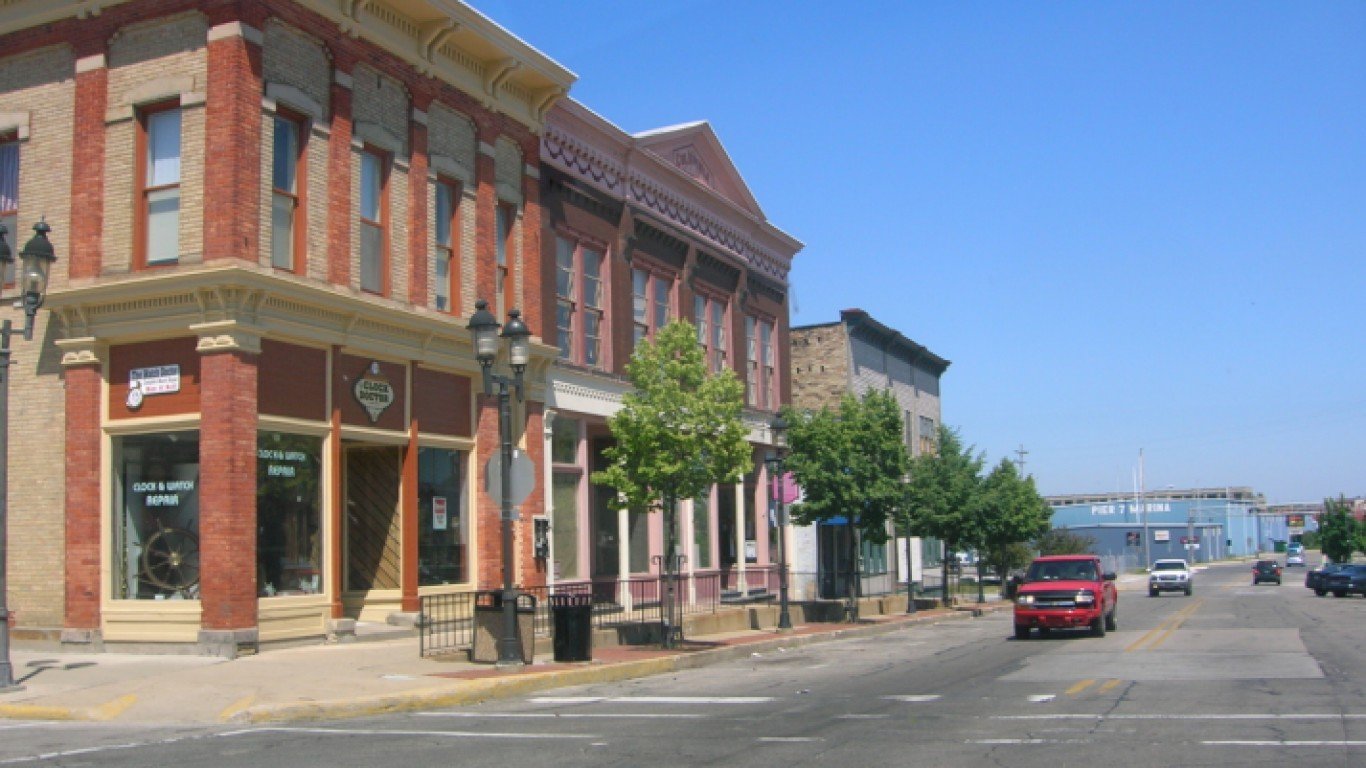
Michigan
> Drunkest metro area: Bay City
> Adults who drink excessively: 23.8% (Statewide: 20.1% – 12th highest)
> Countywide driving deaths involving alcohol: 28.3% (Statewide: 29.2% – 24th highest)
> Bay City population: 102,821
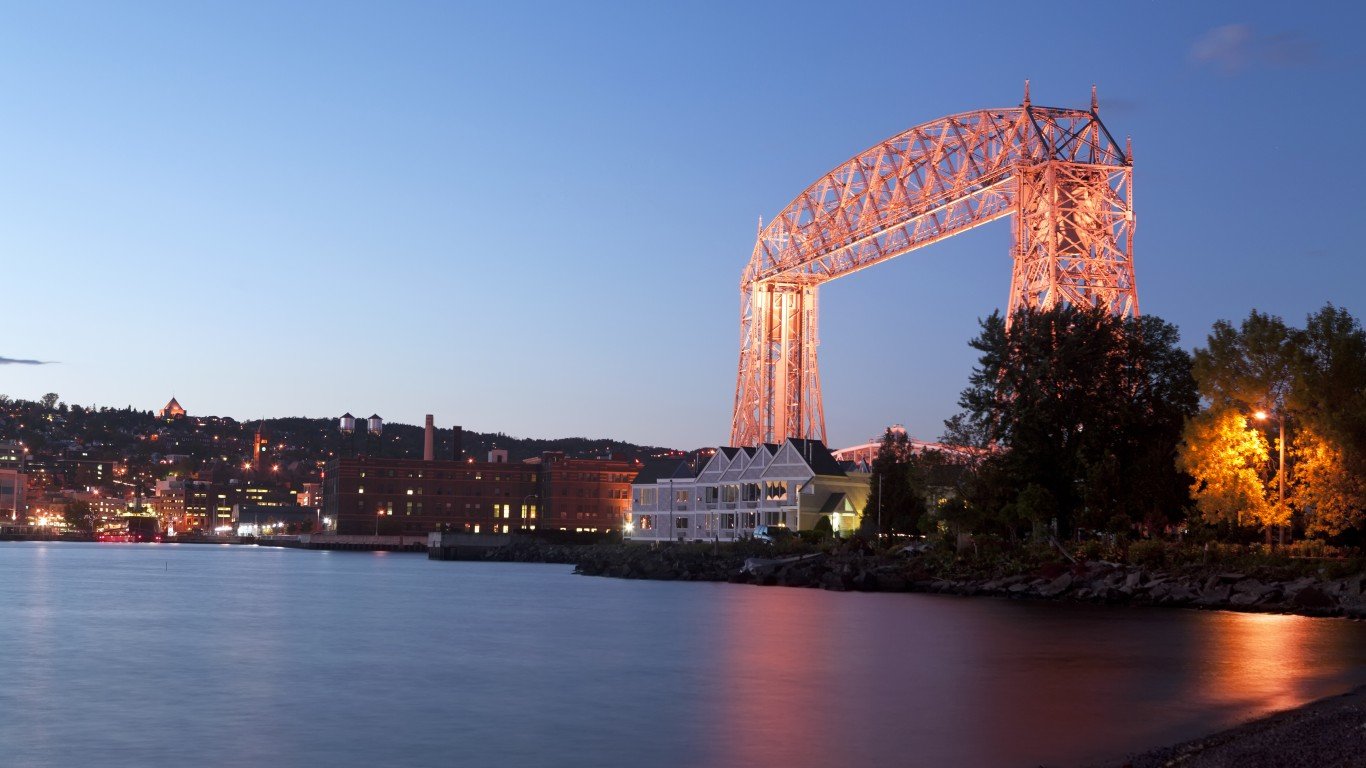
Minnesota
> Drunkest metro area: Duluth
> Adults who drink excessively: 24.2% (Statewide: 21.5% – 8th highest)
> Countywide driving deaths involving alcohol: 38.2% (Statewide: 29.9% – 22nd highest)
> Duluth population: 291,931

Mississippi
> Drunkest metro area: Gulfport-Biloxi
> Adults who drink excessively: 18.3% (Statewide: 16.4% – 8th lowest)
> Countywide driving deaths involving alcohol: 21.1% (Statewide: 18.5% – the lowest)
> Gulfport-Biloxi population: 420,782
Missouri
> Drunkest metro area: Cape Girardeau
> Adults who drink excessively: 20.8% (Statewide: 20.0% – 14th highest)
> Countywide driving deaths involving alcohol: 23.6% (Statewide: 27.6% – 22nd lowest)
> Cape Girardeau population: 95,449

Montana
> Drunkest metro area: Missoula
> Adults who drink excessively: 24.9% (Statewide: 23.9% – 3rd highest)
> Countywide driving deaths involving alcohol: 34.3% (Statewide: 46.4% – the highest)
> Missoula population: 121,041
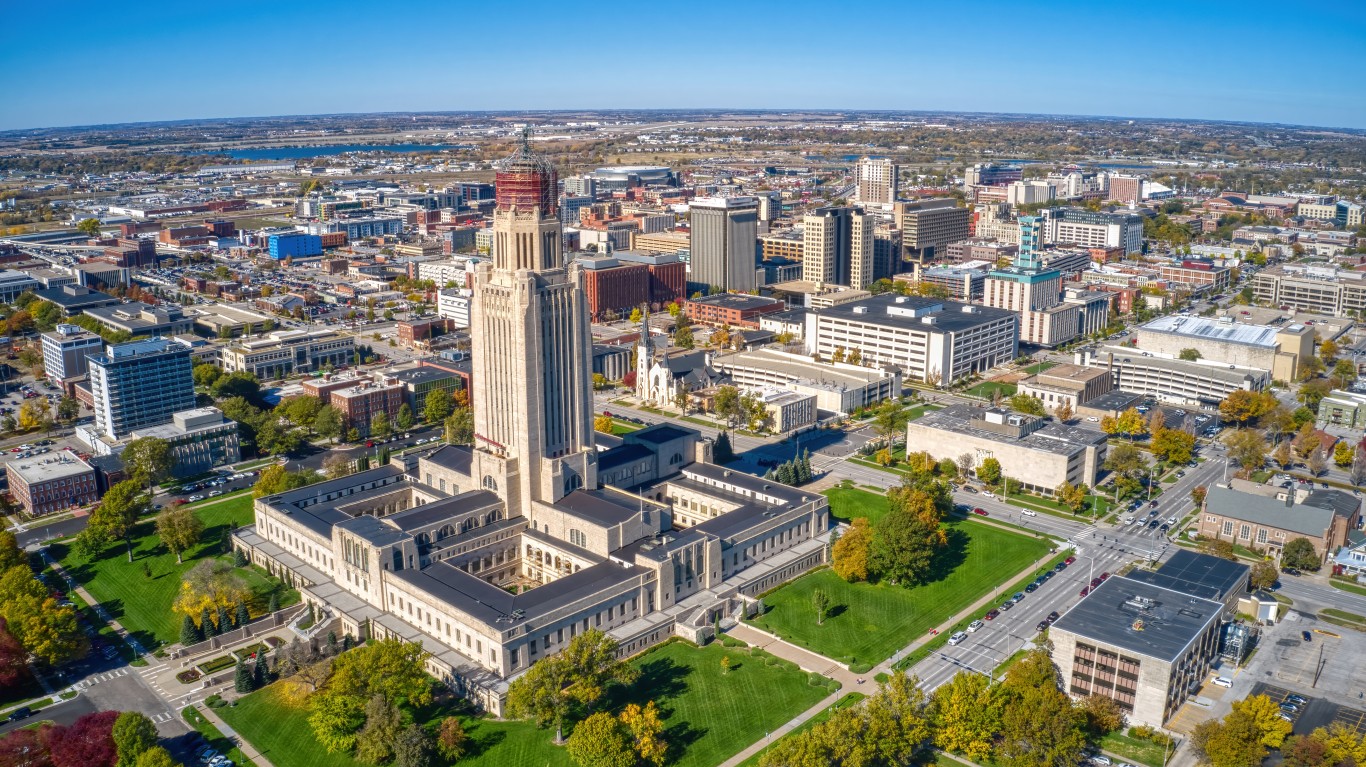
Nebraska
> Drunkest metro area: Lincoln
> Adults who drink excessively: 24.1% (Statewide: 23.2% – 5th highest)
> Countywide driving deaths involving alcohol: 33.9% (Statewide: 33.2% – 10th highest)
> Lincoln population: 341,229
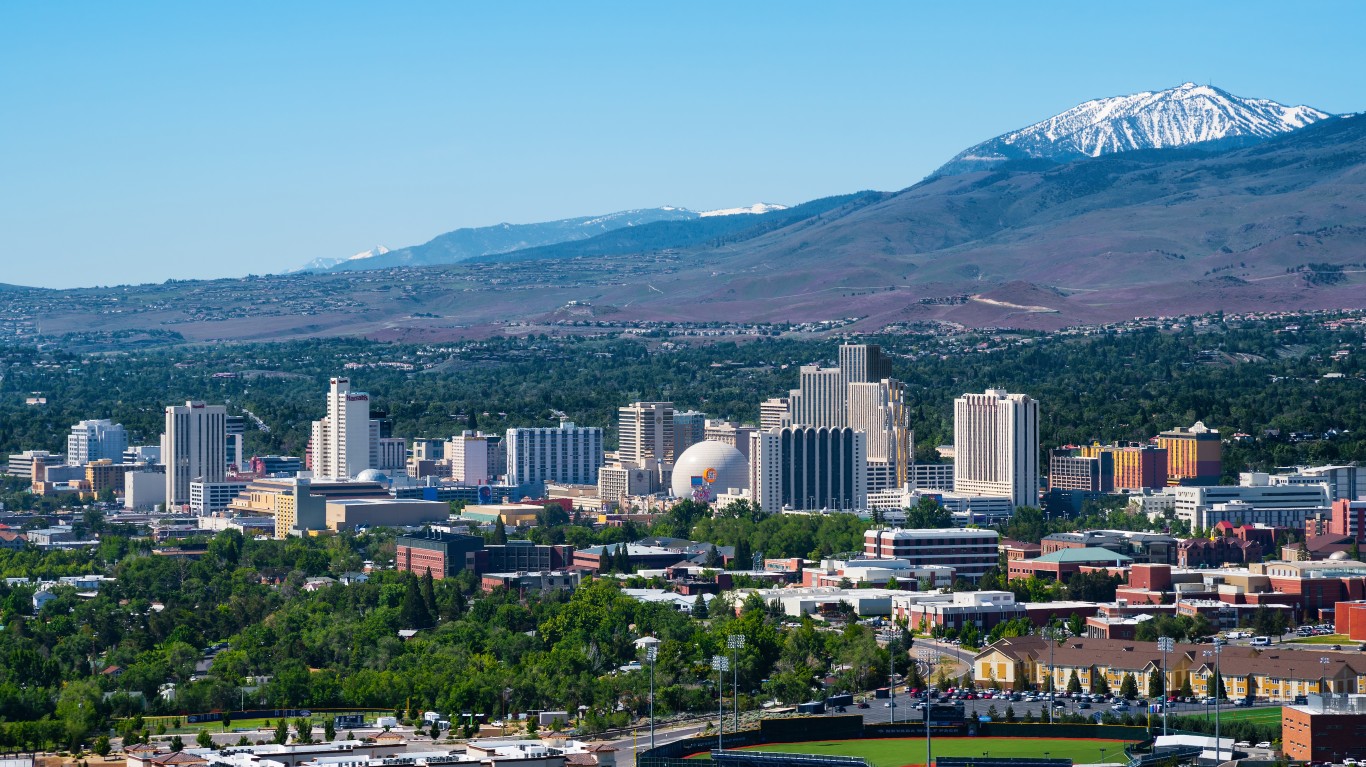
Nevada
> Drunkest metro area: Reno
> Adults who drink excessively: 22.6% (Statewide: 19.9% – 15th highest)
> Countywide driving deaths involving alcohol: 37.1% (Statewide: 27.3% – 21st lowest)
> Reno population: 501,206

New Hampshire
> Drunkest metro area: Manchester-Nashua
> Adults who drink excessively: 20.7% (Statewide: 19.9% – 17th highest)
> Countywide driving deaths involving alcohol: 33.6% (Statewide: 33.1% – 11th highest)
> Manchester-Nashua population: 426,594
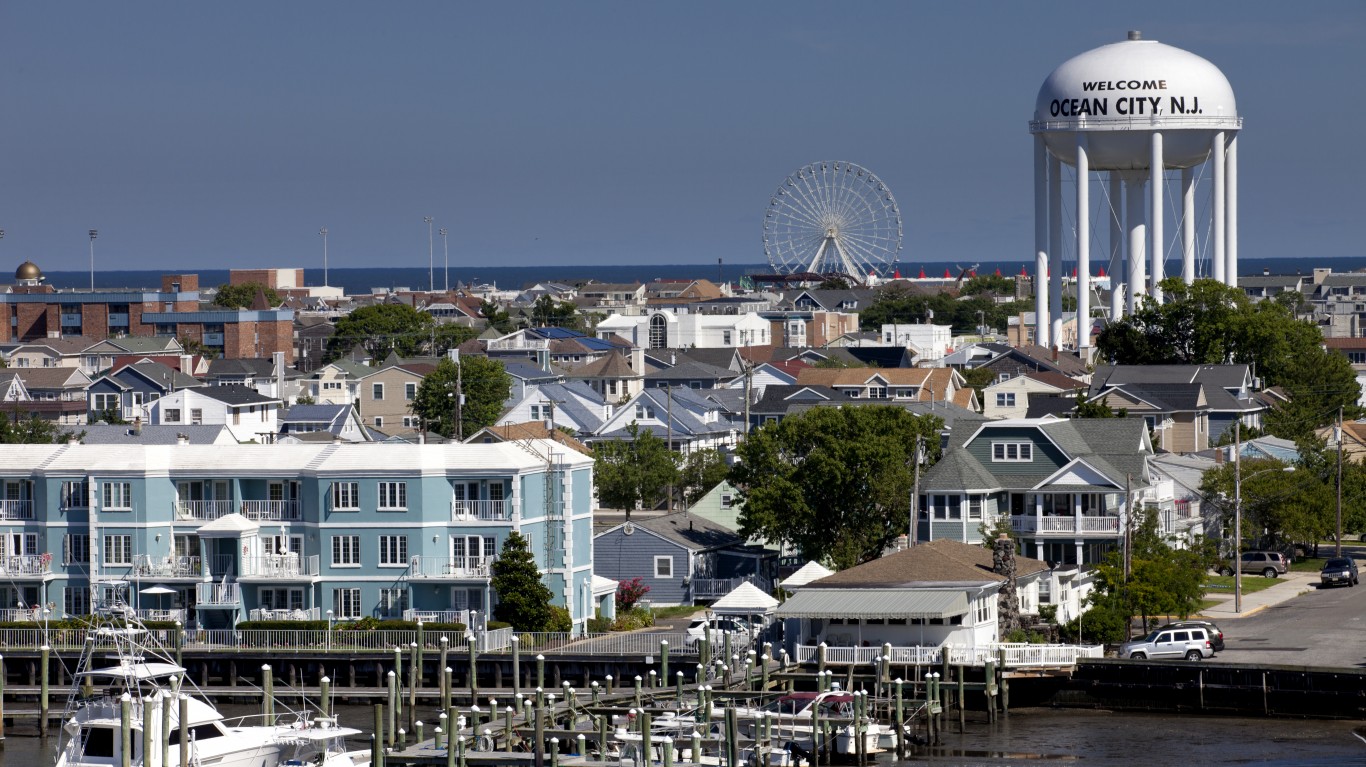
New Jersey
> Drunkest metro area: Ocean City
> Adults who drink excessively: 23.3% (Statewide: 18.6% – 25th highest)
> Countywide driving deaths involving alcohol: 31.7% (Statewide: 22.8% – 9th lowest)
> Ocean City population: 95,634
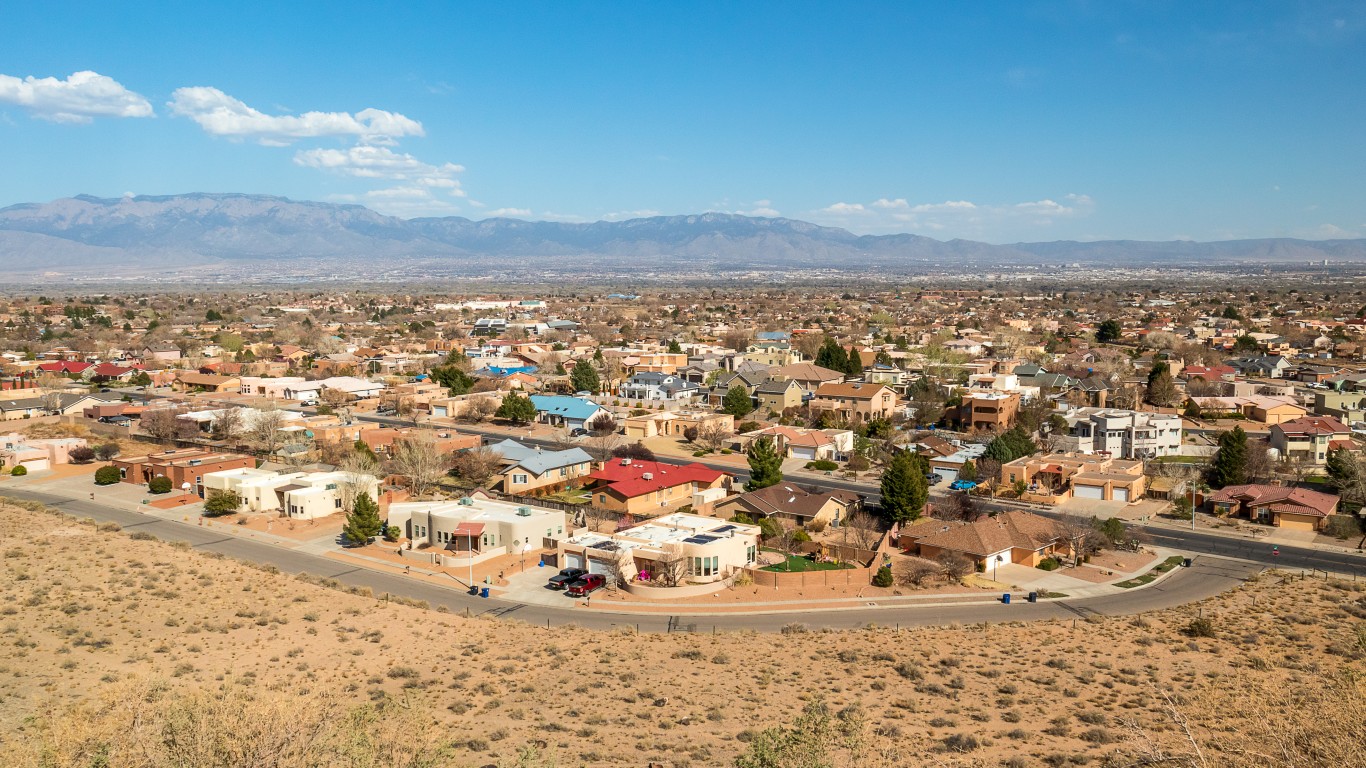
New Mexico
> Drunkest metro area: Albuquerque
> Adults who drink excessively: 17.0% (Statewide: 17.5% – 18th lowest)
> Countywide driving deaths involving alcohol: 27.1% (Statewide: 29.4% – 23rd highest)
> Albuquerque population: 923,925
New York
> Drunkest metro area: Glens Falls
> Adults who drink excessively: 22.3% (Statewide: 17.6% – 19th lowest)
> Countywide driving deaths involving alcohol: 19.6% (Statewide: 20.2% – 4th lowest)
> Glens Falls population: 126,440
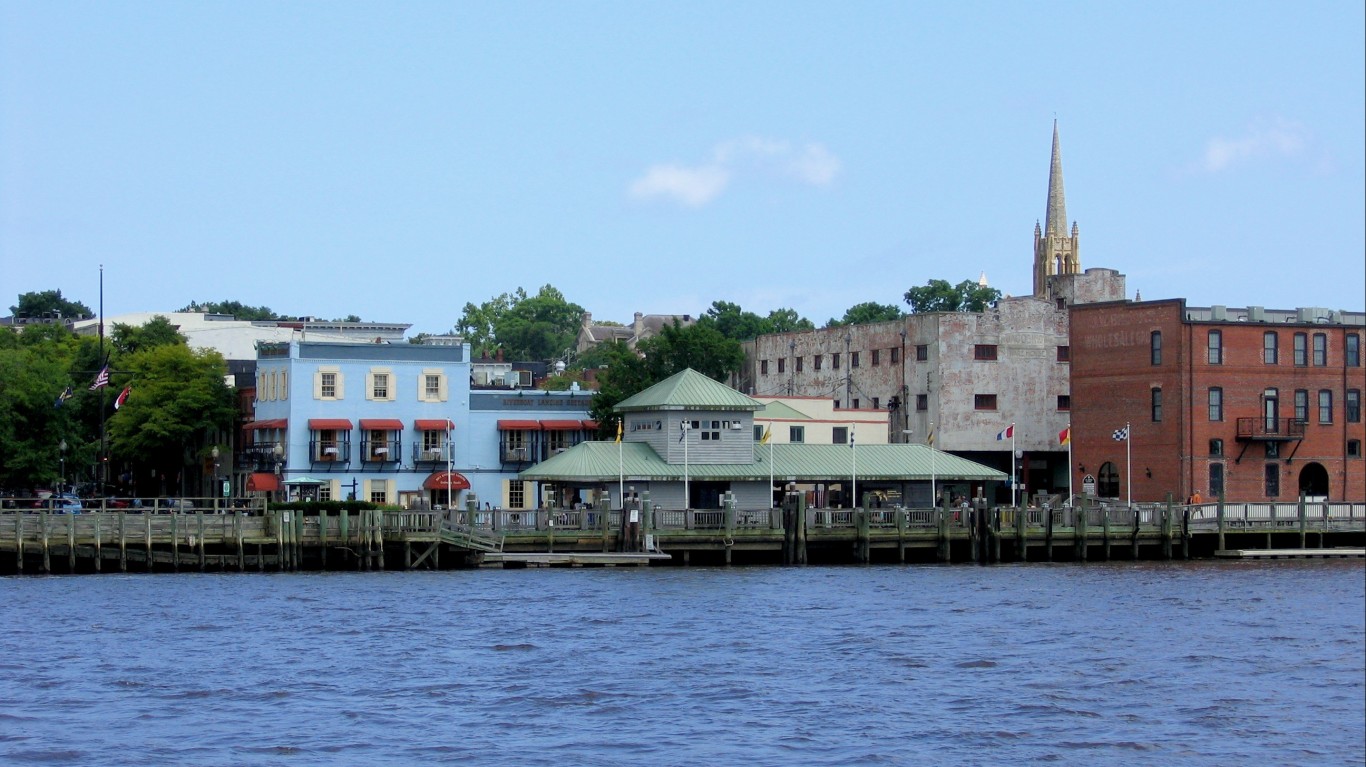
North Carolina
> Drunkest metro area: Wilmington
> Adults who drink excessively: 20.3% (Statewide: 17.0% – 12th lowest)
> Countywide driving deaths involving alcohol: 24.1% (Statewide: 25.9% – 16th lowest)
> Wilmington population: 300,658

North Dakota
> Drunkest metro area: Bismarck
> Adults who drink excessively: 23.1% (Statewide: 23.5% – 4th highest)
> Countywide driving deaths involving alcohol: 40.4% (Statewide: 41.4% – 2nd highest)
> Bismarck population: 134,427

Ohio
> Drunkest metro area: Columbus
> Adults who drink excessively: 20.5% (Statewide: 19.0% – 23rd highest)
> Countywide driving deaths involving alcohol: 32.0% (Statewide: 32.5% – 14th highest)
> Columbus population: 2,161,511

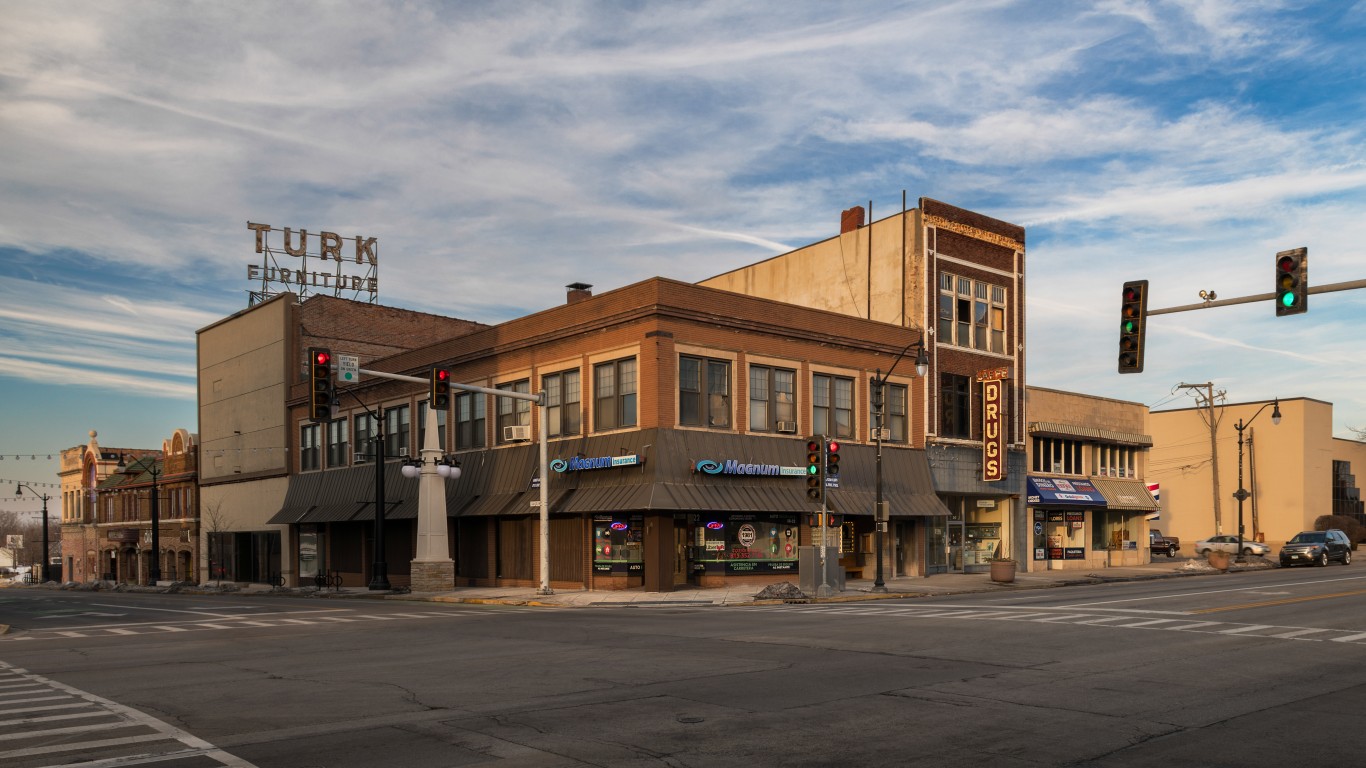
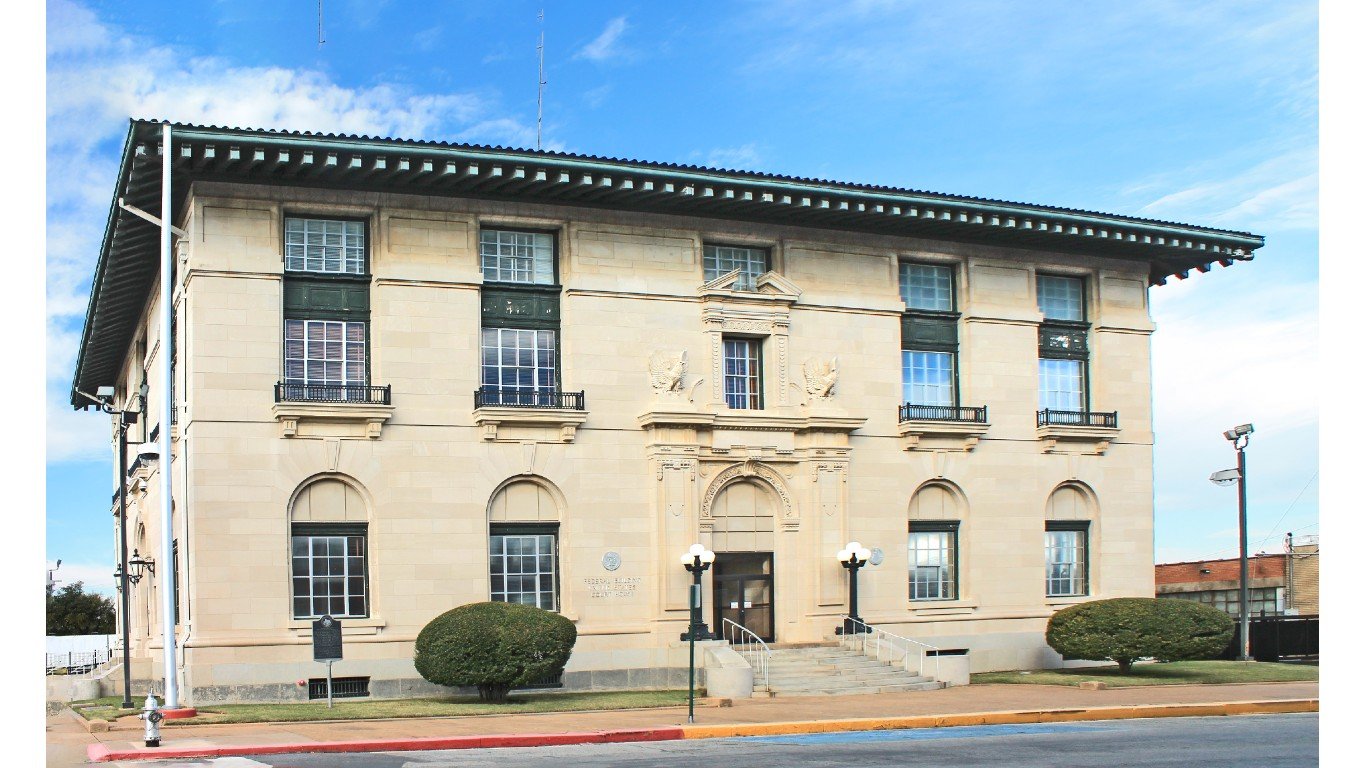
Oklahoma
> Drunkest metro area: Enid
> Adults who drink excessively: 15.2% (Statewide: 13.8% – 3rd lowest)
> Countywide driving deaths involving alcohol: 30.3% (Statewide: 26.8% – 20th lowest)
> Enid population: 61,920

Oregon
> Drunkest metro area: Bend
> Adults who drink excessively: 22.6% (Statewide: 19.9% – 16th highest)
> Countywide driving deaths involving alcohol: 27.0% (Statewide: 27.9% – 24th lowest)
> Bend population: 206,549
Pennsylvania
> Drunkest metro area: Pittsburgh
> Adults who drink excessively: 23.0% (Statewide: 20.7% – 10th highest)
> Countywide driving deaths involving alcohol: 28.4% (Statewide: 25.4% – 12th lowest)
> Pittsburgh population: 2,349,172

Rhode Island
> Drunkest metro area: Providence-Warwick
> Adults who drink excessively: 20.0% (Statewide: 18.3% – 22nd lowest)
> Countywide driving deaths involving alcohol: 36.2% (Statewide: 40.3% – 3rd highest)
> Providence-Warwick population: 1,673,802
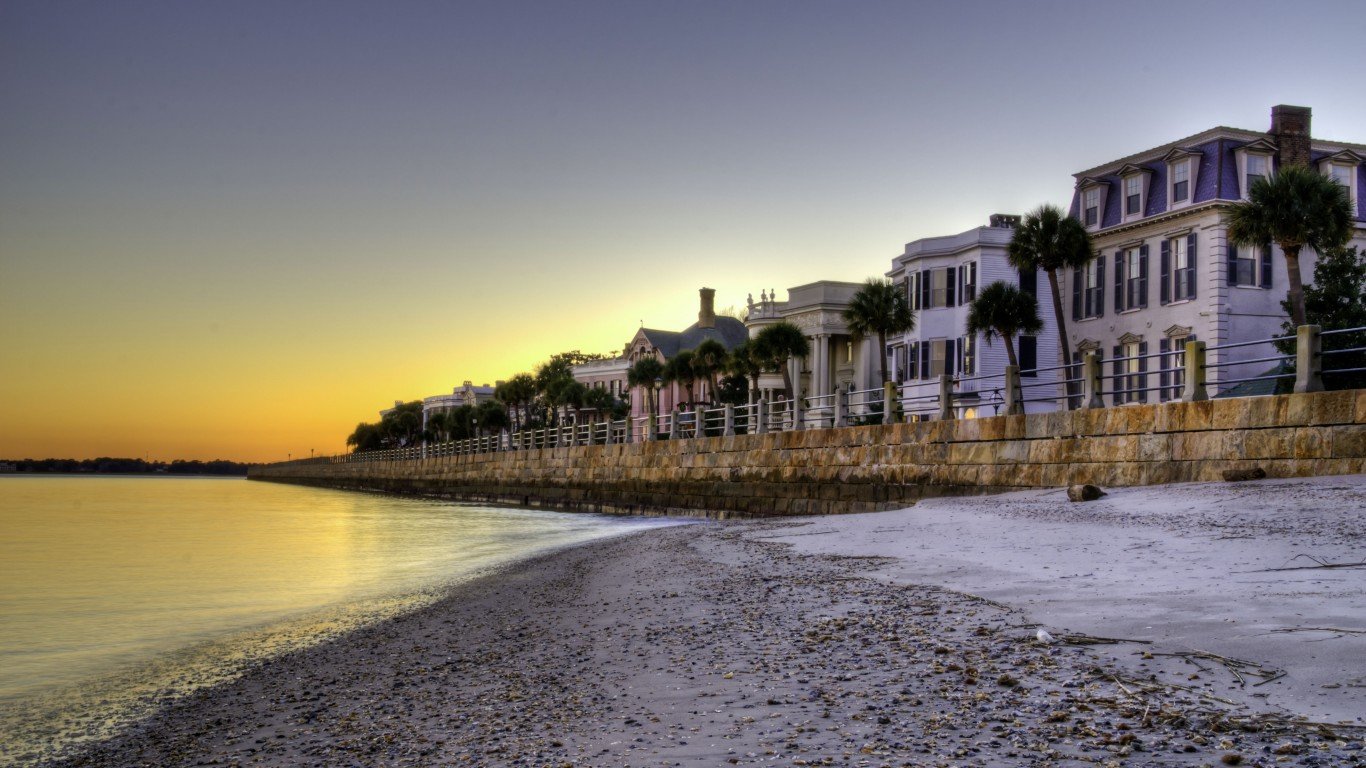
South Carolina
> Drunkest metro area: Charleston-North Charleston
> Adults who drink excessively: 21.8% (Statewide: 19.0% – 22nd highest)
> Countywide driving deaths involving alcohol: 34.4% (Statewide: 32.8% – 12th highest)
> Charleston-North Charleston population: 830,529
South Dakota
> Drunkest metro area: Rapid City
> Adults who drink excessively: 21.1% (Statewide: 21.0% – 9th highest)
> Countywide driving deaths involving alcohol: 39.0% (Statewide: 36.1% – 5th highest)
> Rapid City population: 144,890

Tennessee
> Drunkest metro area: Nashville-Davidson-Murfreesboro-Franklin
> Adults who drink excessively: 17.3% (Statewide: 17.0% – 11th lowest)
> Countywide driving deaths involving alcohol: 24.3% (Statewide: 23.5% – 10th lowest)
> Nashville-Davidson-Murfreesboro-Franklin population: 2,046,715
Texas
> Drunkest metro area: Sherman-Denison
> Adults who drink excessively: 21.1% (Statewide: 18.6% – 25th lowest)
> Countywide driving deaths involving alcohol: 23.6% (Statewide: 25.4% – 13th lowest)
> Sherman-Denison population: 143,131

Utah
> Drunkest metro area: Salt Lake City
> Adults who drink excessively: 14.0% (Statewide: 11.8% – the lowest)
> Countywide driving deaths involving alcohol: 27.0% (Statewide: 21.7% – 6th lowest)
> Salt Lake City population: 1,266,191
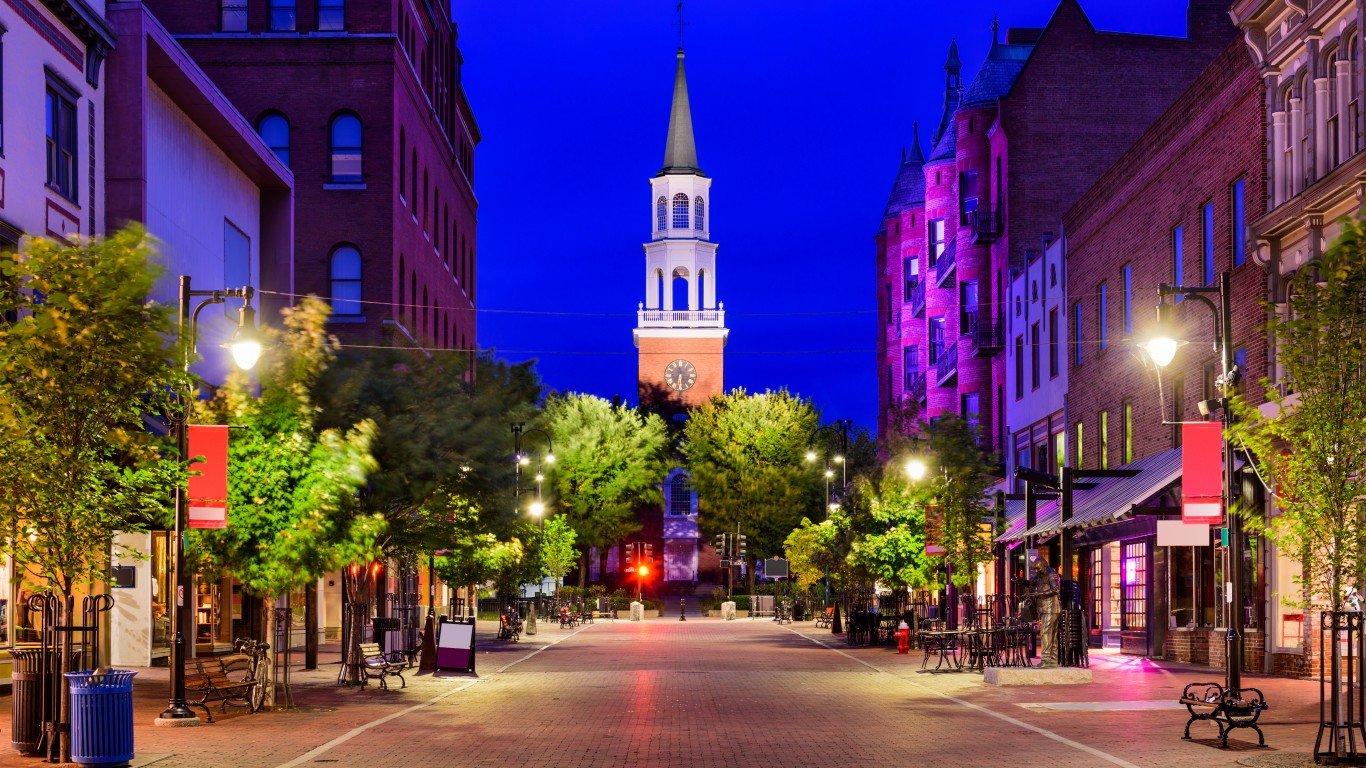
Vermont
> Drunkest metro area: Burlington-South Burlington
> Adults who drink excessively: 20.7% (Statewide: 22.1% – 6th highest)
> Countywide driving deaths involving alcohol: 35.3% (Statewide: 35.4% – 7th highest)
> Burlington-South Burlington population: 228,270
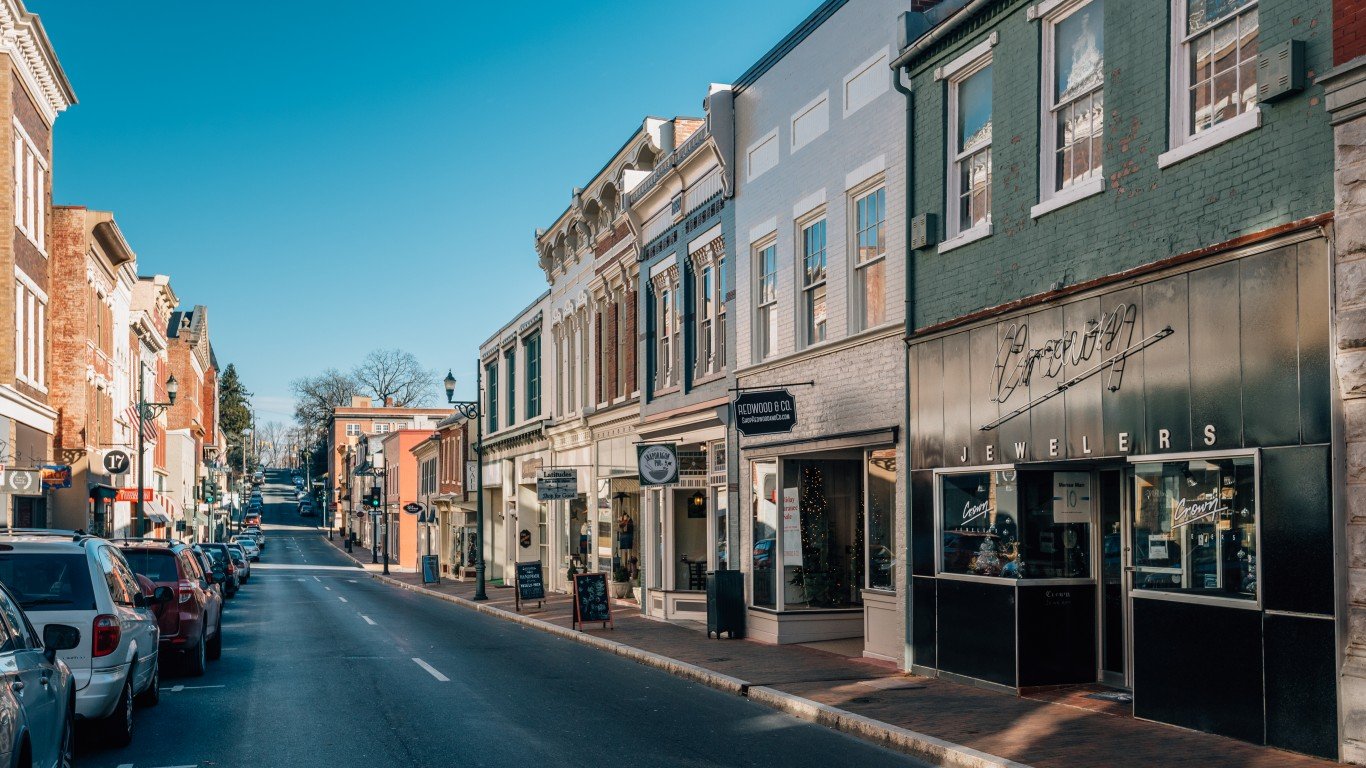
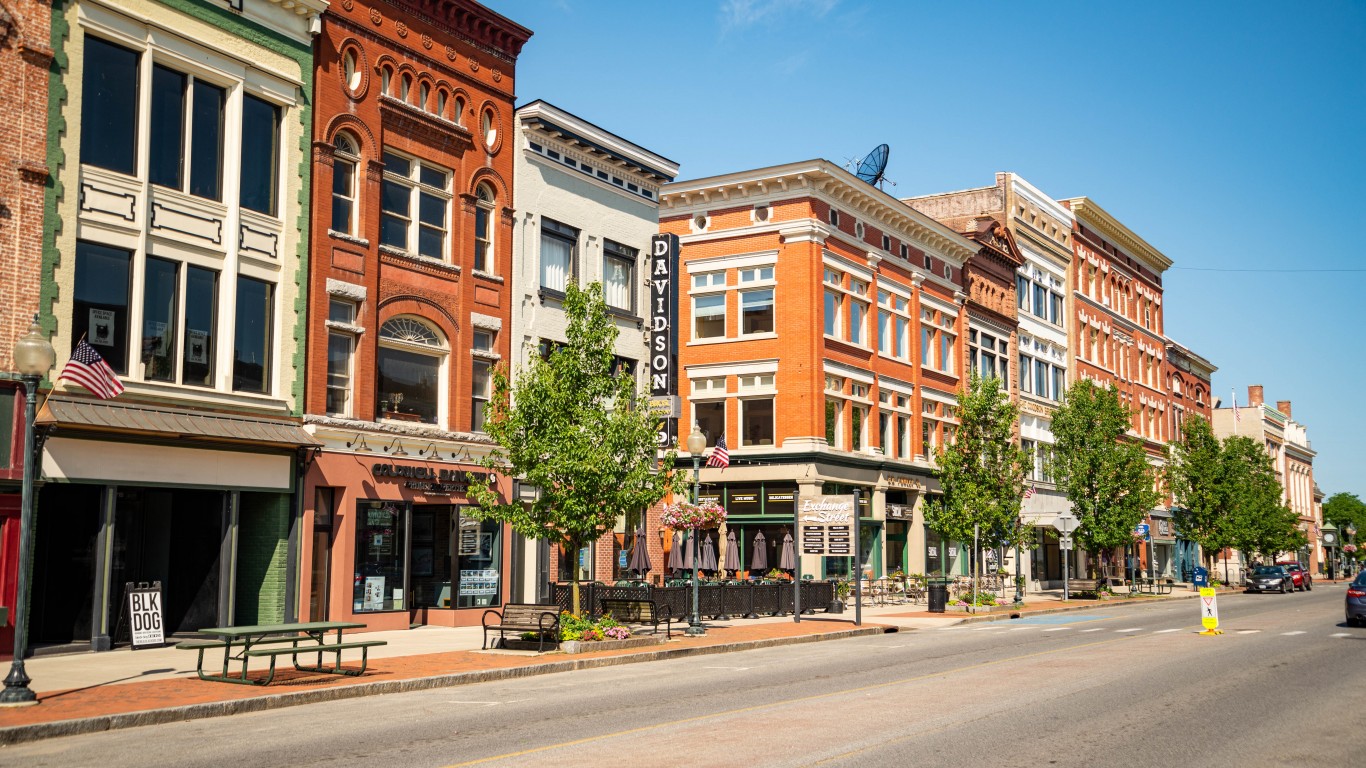
Virginia
> Drunkest metro area: Staunton
> Adults who drink excessively: 18.9% (Statewide: 16.9% – 10th lowest)
> Countywide driving deaths involving alcohol: 30.1% (Statewide: 30.3% – 21st highest)
> Staunton population: 126,776
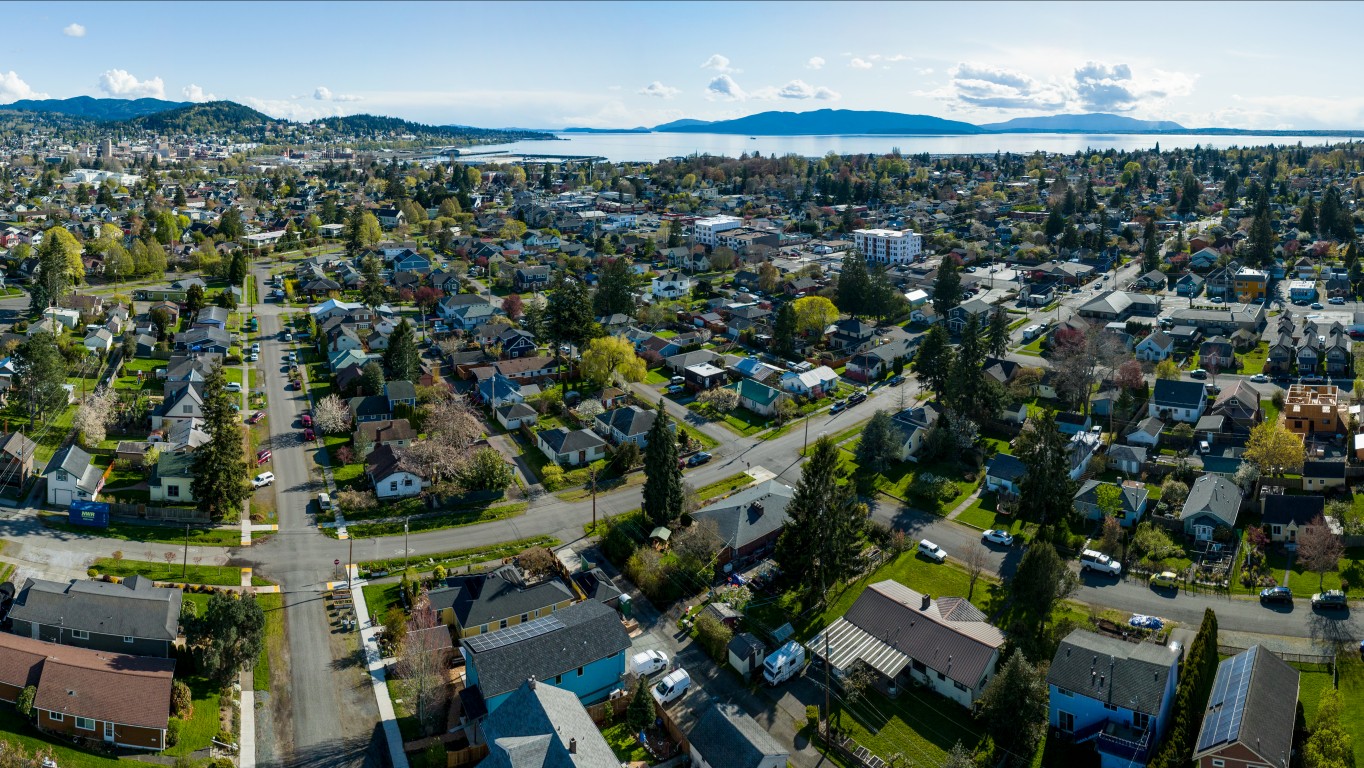
Washington
> Drunkest metro area: Bellingham
> Adults who drink excessively: 22.9% (Statewide: 18.0% – 21st lowest)
> Countywide driving deaths involving alcohol: 24.7% (Statewide: 32.7% – 13th highest)
> Bellingham population: 230,677
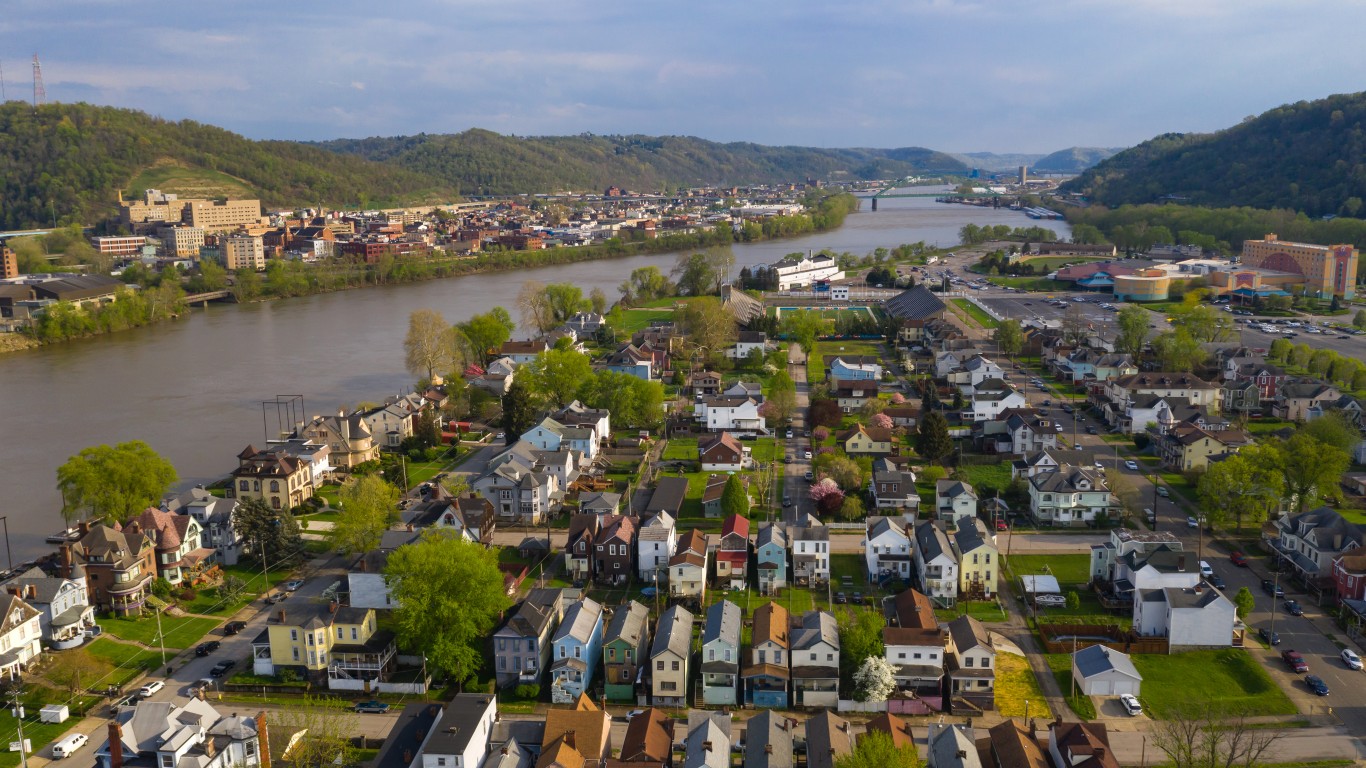
West Virginia
> Drunkest metro area: Wheeling
> Adults who drink excessively: 16.8% (Statewide: 13.5% – 2nd lowest)
> Countywide driving deaths involving alcohol: 32.4% (Statewide: 26.1% – 18th lowest)
> Wheeling population: 136,708
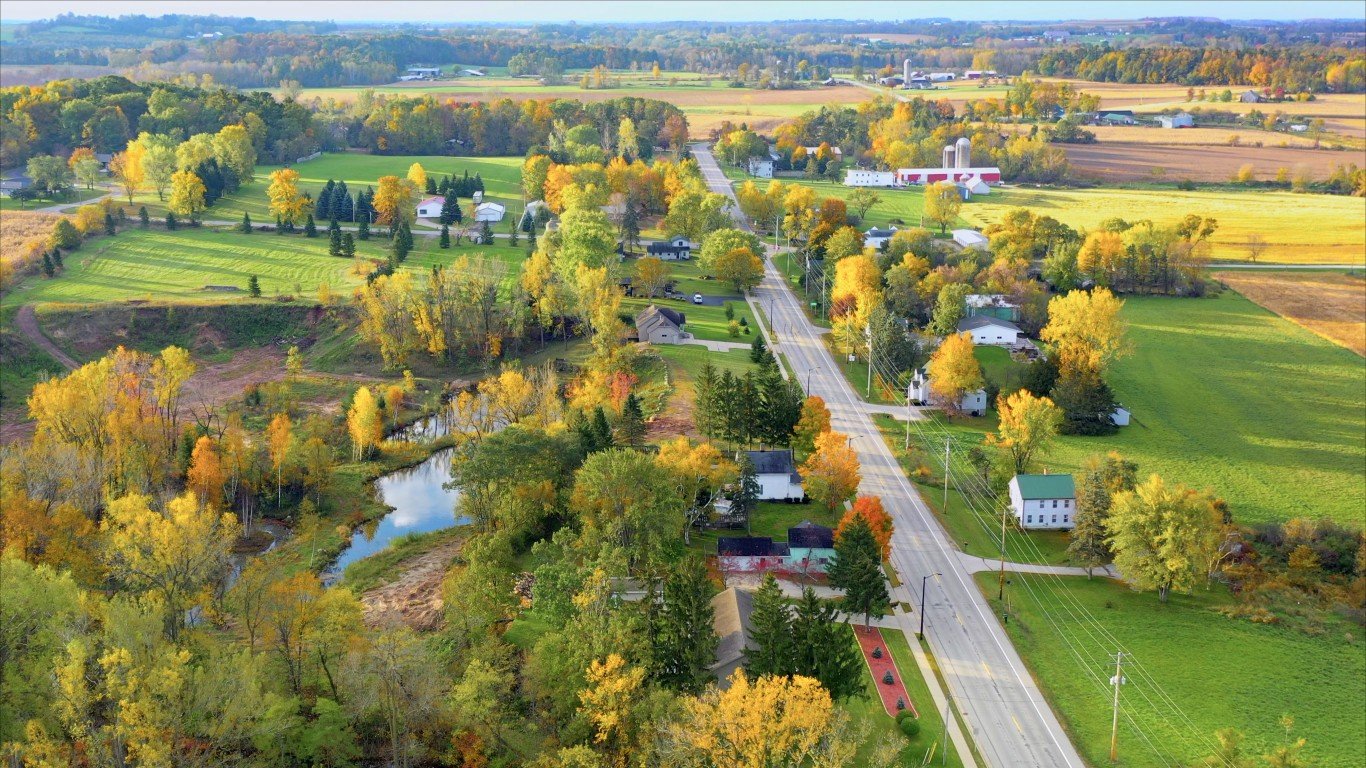
Wisconsin
> Drunkest metro area: Wausau-Weston
> Adults who drink excessively: 27.2% (Statewide: 26.1% – the highest)
> Countywide driving deaths involving alcohol: 23.2% (Statewide: 35.6% – 6th highest)
> Wausau-Weston population: 166,334
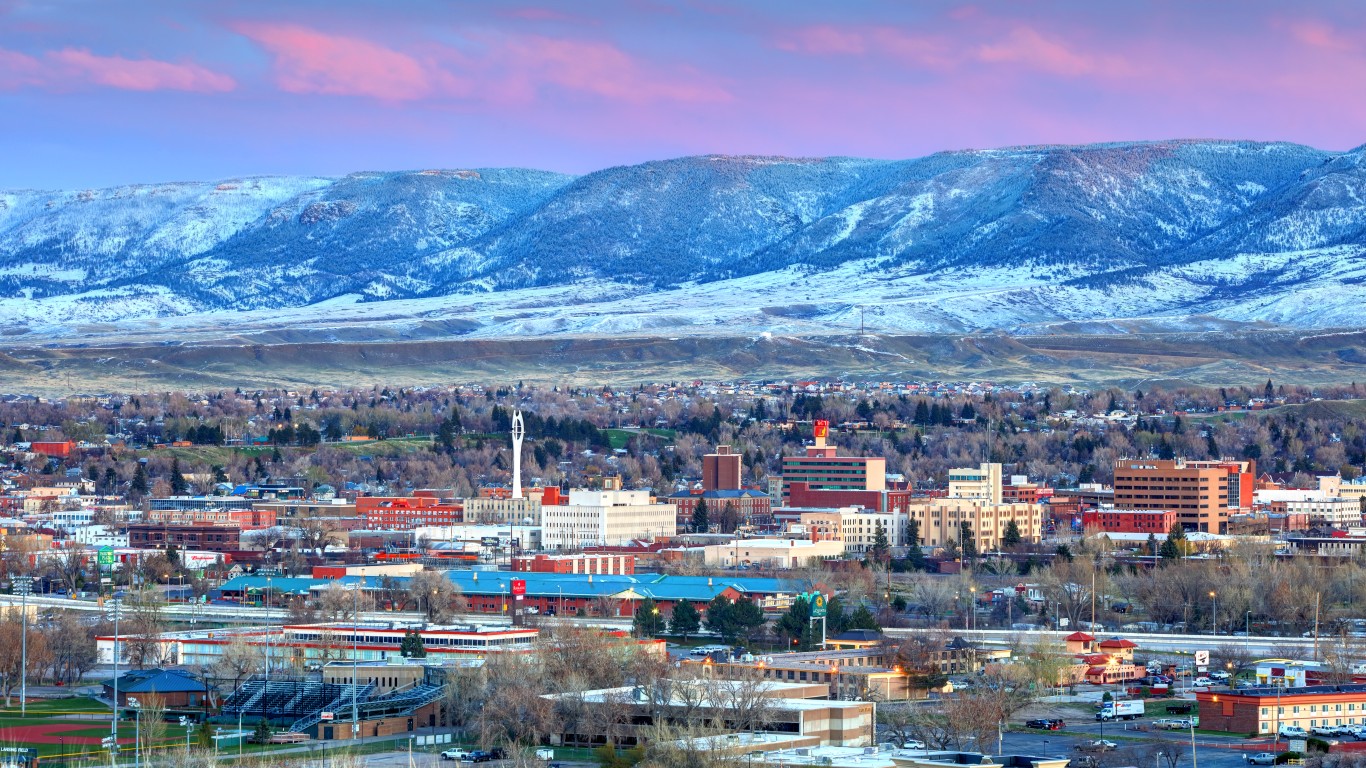
Wyoming
> Drunkest metro area: Casper
> Adults who drink excessively: 19.0% (Statewide: 19.3% – 19th highest)
> Countywide driving deaths involving alcohol: 34.1% (Statewide: 31.8% – 15th highest)
> Casper population: 79,601
Contact [email protected] for any questions or corrections.