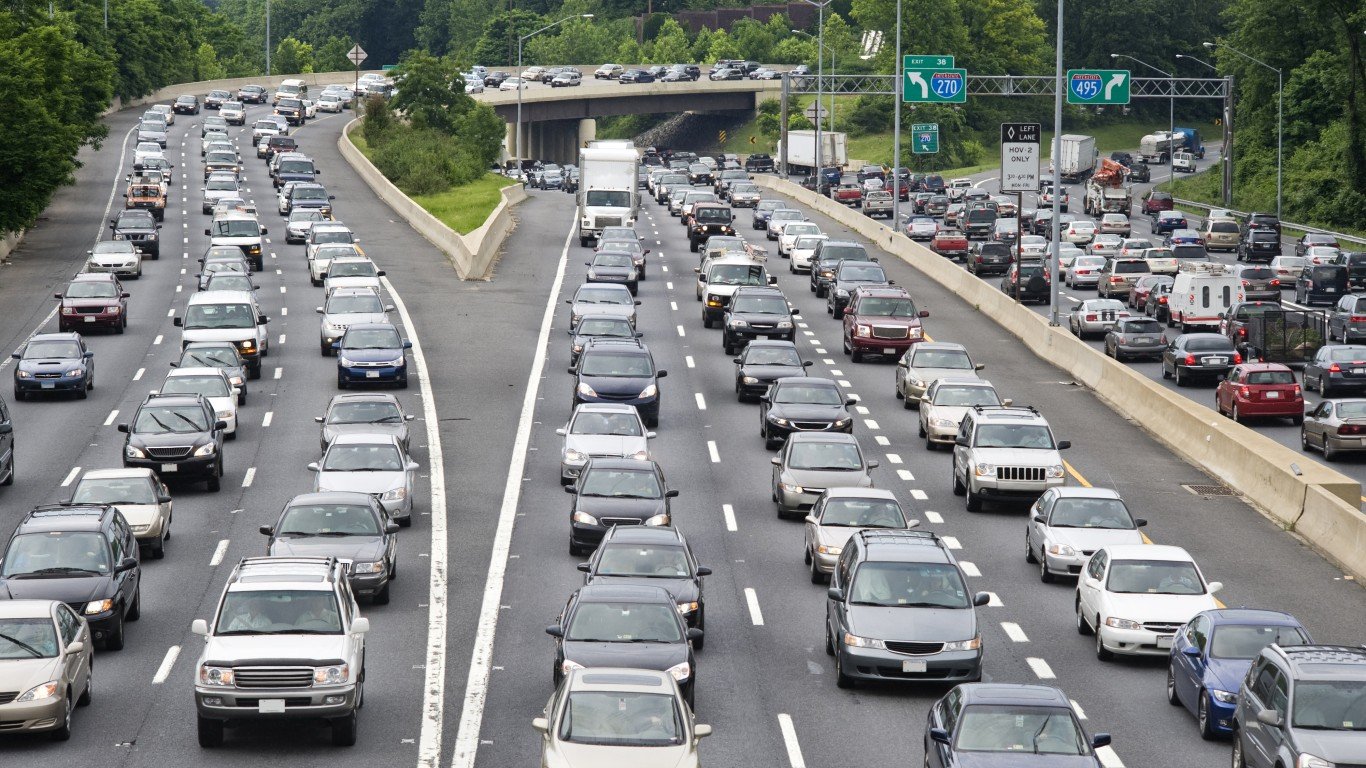

During the pandemic, it seemed as if the roads were perfect and every city was the ideal place to drive. Cities with the worst traffic in the world were now ideal as rush hour was virtually eliminated. Traffic jams were now rare, with daily commuter traffic almost cut in half, and streets and highways all but empty, except for truck traffic that saw an increase due to deliveries which increased during this time. For the most part, you could reach any intended destination in record time.
Due to this decrease in vehicle consumption, pollution decreased as well. In a study conducted by Boston University’s School of Public Health, it was found that ultrafine particle concentration dropped by nearly 50 percent due to reduced aviation and road activity during the first few months of the pandemic. But with the COVID-19 pandemic well into the rearview mirror, little traffic and reduced pollution are a thing of the past. Drivers across the globe have brought driving levels back up to pre-2020 levels. This return to normalcy presents a substantial problem for many major cities worldwide, as they wrestle with severe traffic gridlock.
24/7 Wall St. reviewed the annual Global Traffic Scorecard published by global transportation analytics company INRIX to determine the cities with the worst traffic congestion. We ranked the cities on INRIX’s scorecard according to the most hours lost due to traffic congestion per driver in 2022. Data on the last mile average speed, which is how fast a driver is traveling on average during the last mile on any given trip within a particular city, is also for the INRIX scorecard.
Every city on our list had at least 105 lost hours per driver last year as the result of traffic congestion, the equivalent of more than four full days stuck behind the wheel. Out of the 10 cities on the list, only Paris reported a decrease from 2021. (Also read: this is the worst American city to drive in.)
Of the 10 cities reporting a traffic surge from 2021, four are in the U.S. – Boston, where hours lost in traffic increased by 72%; Miami, with a 59% increase in time lost in traffic; Chicago with a 49% increase; and New York, where drivers spent 15% more time in traffic. Mexico’s Monterrey, Miami, Canada’s Toronto, and Boston made the largest leaps in the ranking from 2021 to 2022. None had been in the top 10 in 2021. (This is the city with the longest commute in every state.)
Although it may not seem like it, compared to before the COVID-19 pandemic, six cities reported a decline in time spent in traffic. Bogota, Colombia, reported the biggest decrease at 36%. Monterrey went in the other direction, with a spike of 108% compared to pre-pandemic traffic. It was joined by Miami, whose 30% increase in time lost to traffic compared to pre-pandemic levels has come as the Florida city’s population surges.
The most congested city for the second straight year is London, which has been trying to alleviate the traffic crush by implementing congestion pricing. Those driving in central London between 7 a.m. and 6 p.m., and from noon to 6 p.m. on the weekend, must prepay a daily Congestion Charge of £15 ($18.57).
Here are the cities with the most traffic in the world.
10. Monterrey, Mexico
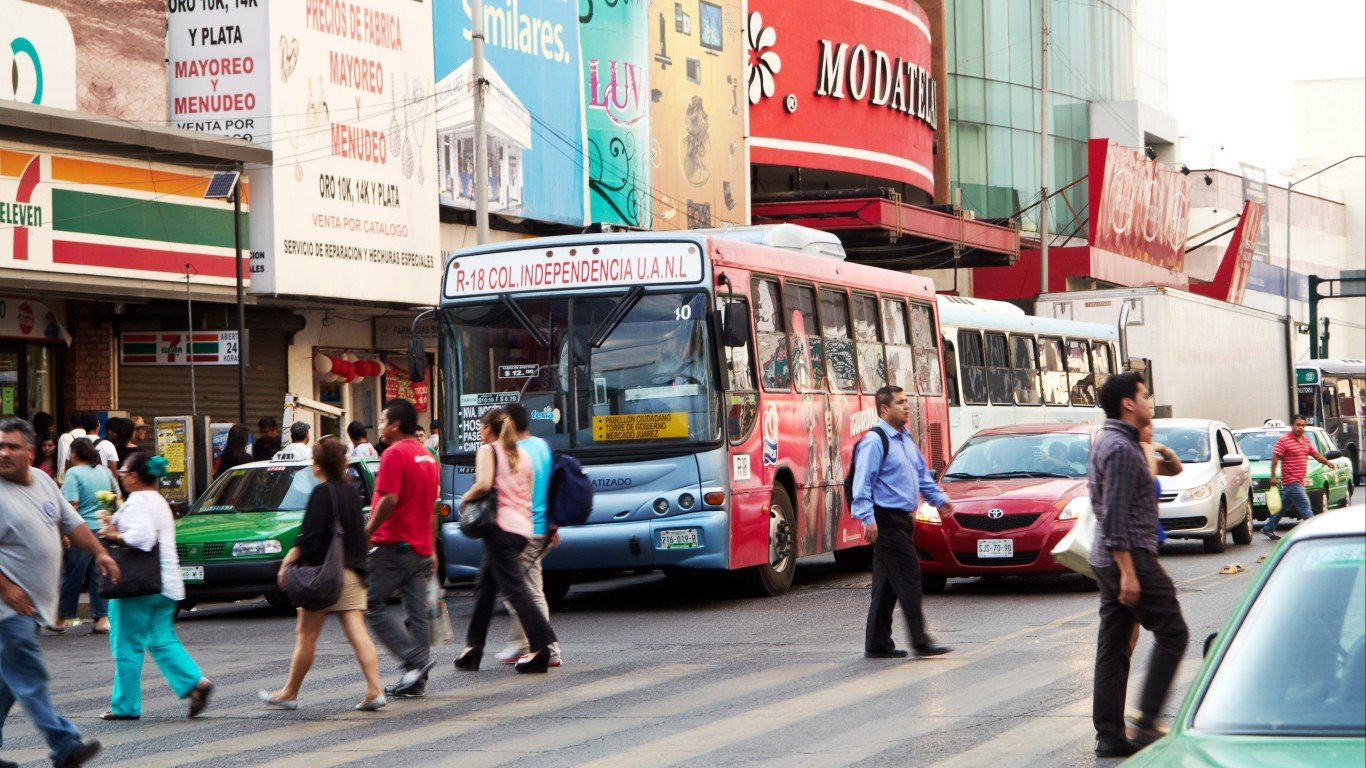
- Hours lost due to traffic congestion per driver (2022): 116
- Change in hours lost from 2021: 66%
- Change in hours lost from pre-Covid: 108%
- Average speed of the last mile of each trip in city: 19 MPH
- Change in last mile average speed from 2021: -4 MPH
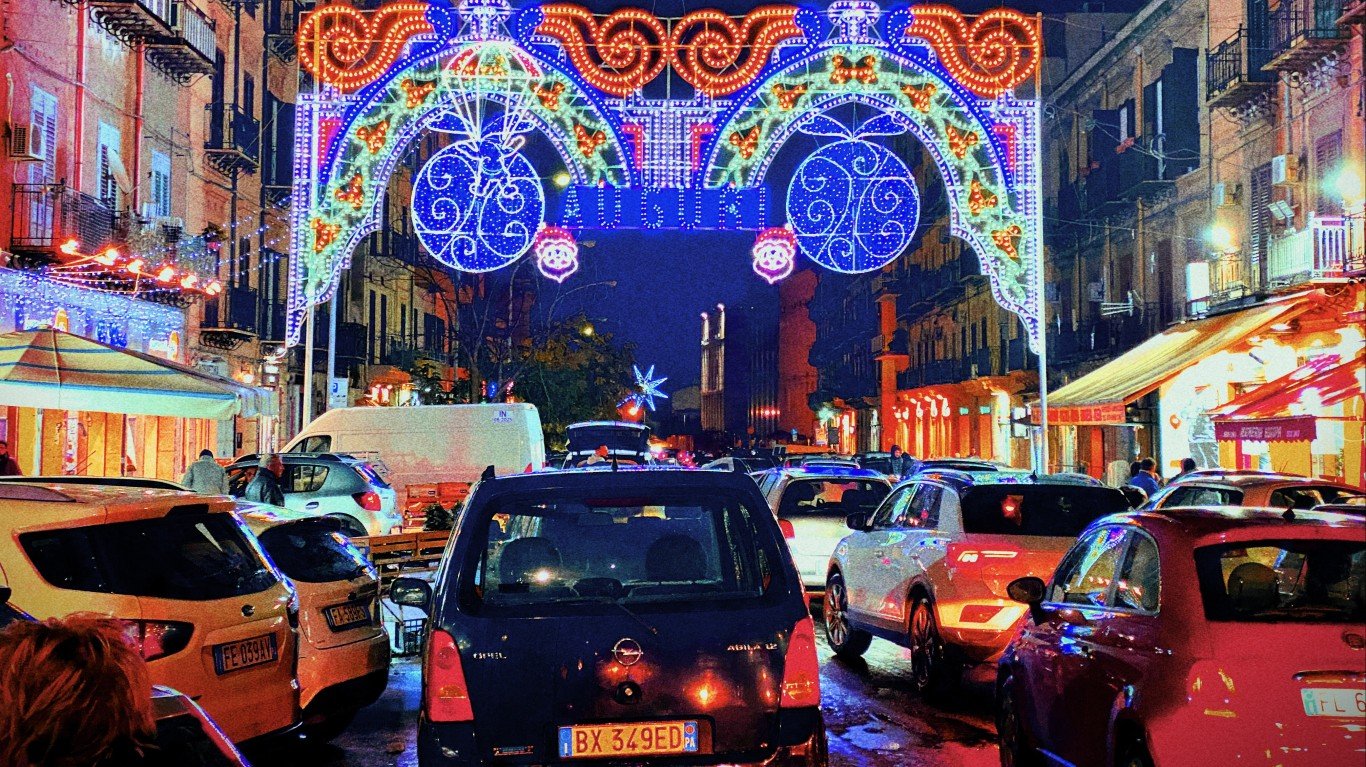
9. Palermo, Italy
- Hours lost due to traffic congestion per driver (2022): 121
- Change in hours lost from 2021: 11%
- Change in hours lost from pre-Covid: -12%
- Average speed of the last mile of each trip in city: 9 MPH
- Change in last mile average speed from 2021: 0 MPH
8. Miami, Florida
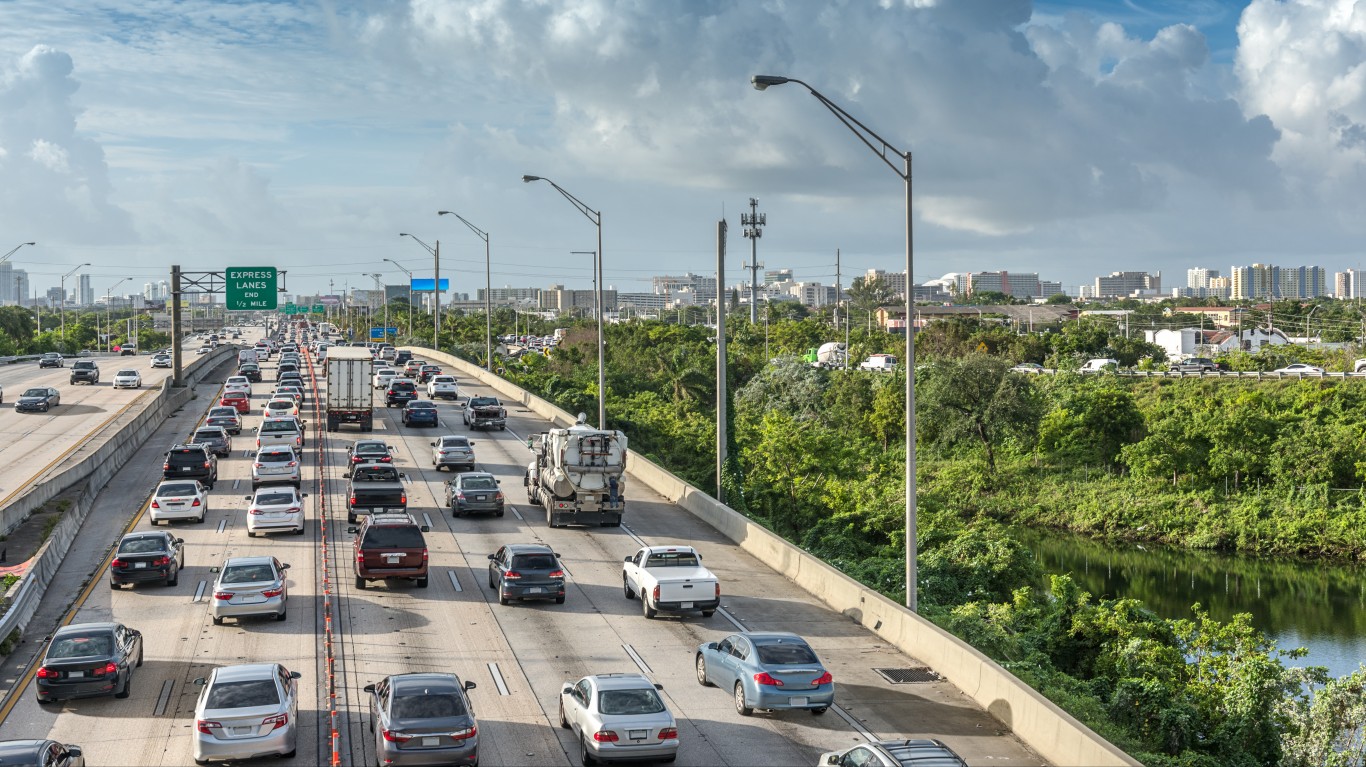
- Hours lost due to traffic congestion per driver (2022): 105
- Change in hours lost from 2021: 59%
- Change in hours lost from pre-Covid: 30%
- Average speed of the last mile of each trip in city: 15 MPH
- Change in last mile average speed from 2021: -4 MPH
7. Toronto, Canada
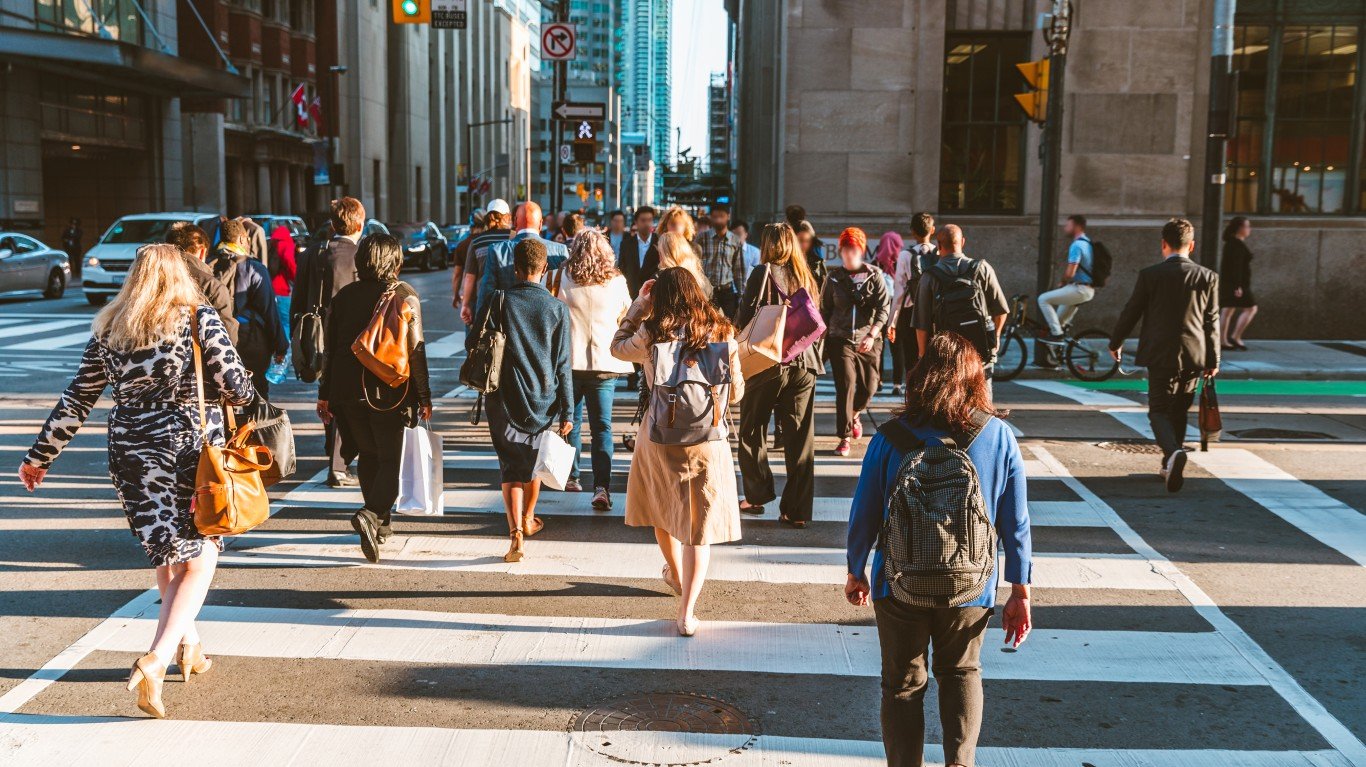
- Hours lost due to traffic congestion per driver (2022): 118
- Change in hours lost from 2021: 59%
- Change in hours lost from pre-Covid: -13%
- Average speed of the last mile of each trip in city: 10 MPH
- Change in last mile average speed from 2021: -4 MPH
6. Bogota, Colombia
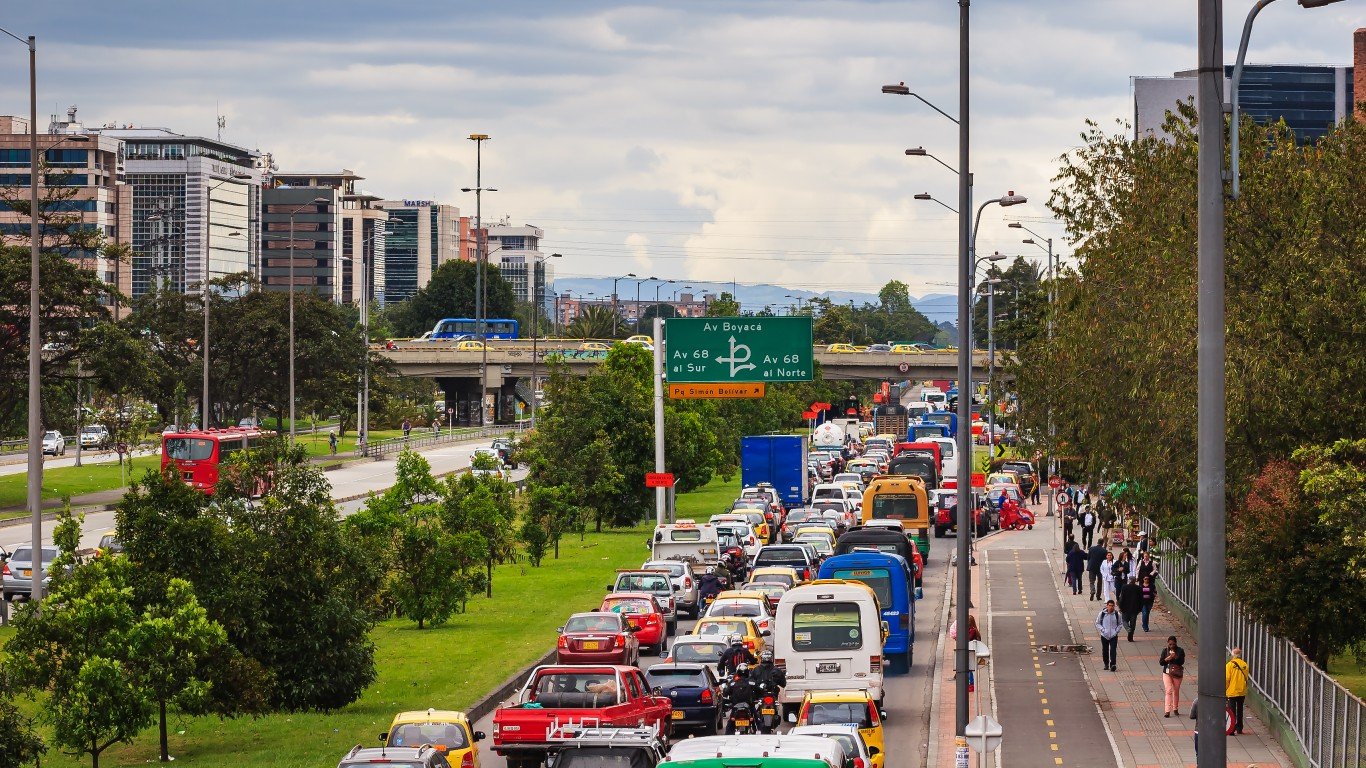
- Hours lost due to traffic congestion per driver (2022): 122
- Change in hours lost from 2021: 30%
- Change in hours lost from pre-Covid: -36%
- Average speed of the last mile of each trip in city: 11 MPH
- Change in last mile average speed from 2021: -2 MPH
5. New York City, New York
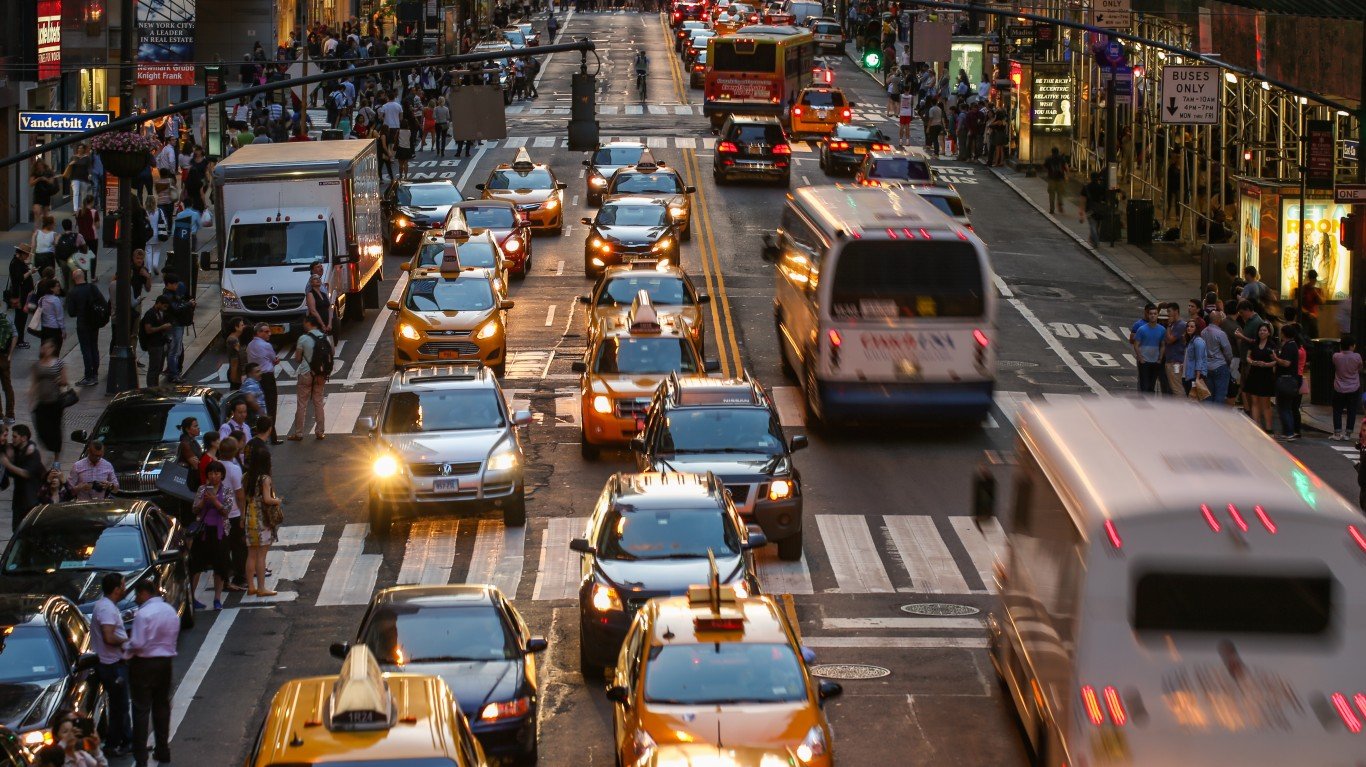
- Hours lost due to traffic congestion per driver (2022): 117
- Change in hours lost from 2021: 15%
- Change in hours lost from pre-Covid: -16%
- Average speed of the last mile of each trip in city: 11 MPH
- Change in last mile average speed from 2021: -2 MPH
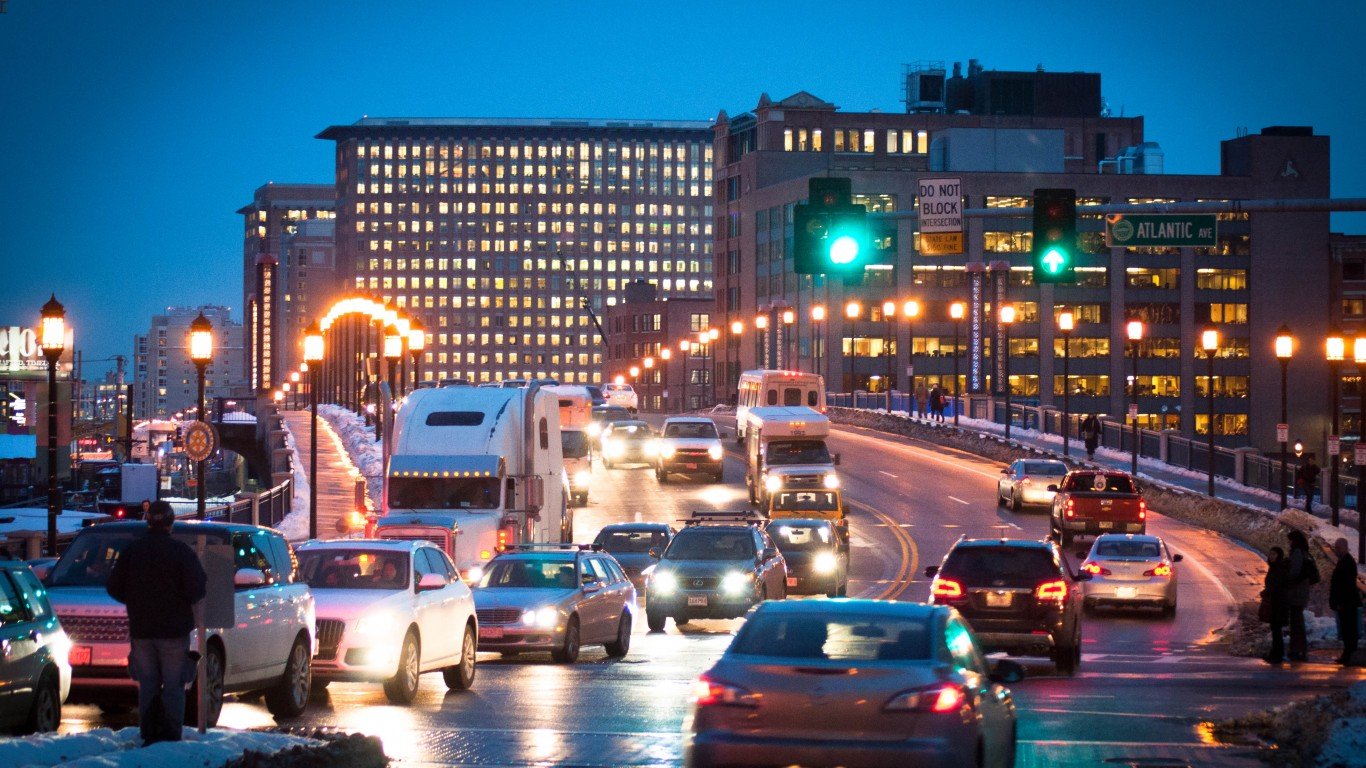
4. Boston, Massachusetts
- Hours lost due to traffic congestion per driver (2022): 134
- Change in hours lost from 2021: 72%
- Change in hours lost from pre-Covid: -10%
- Average speed of the last mile of each trip in city: 11 MPH
- Change in last mile average speed from 2021: -4 MPH
3. Paris, France
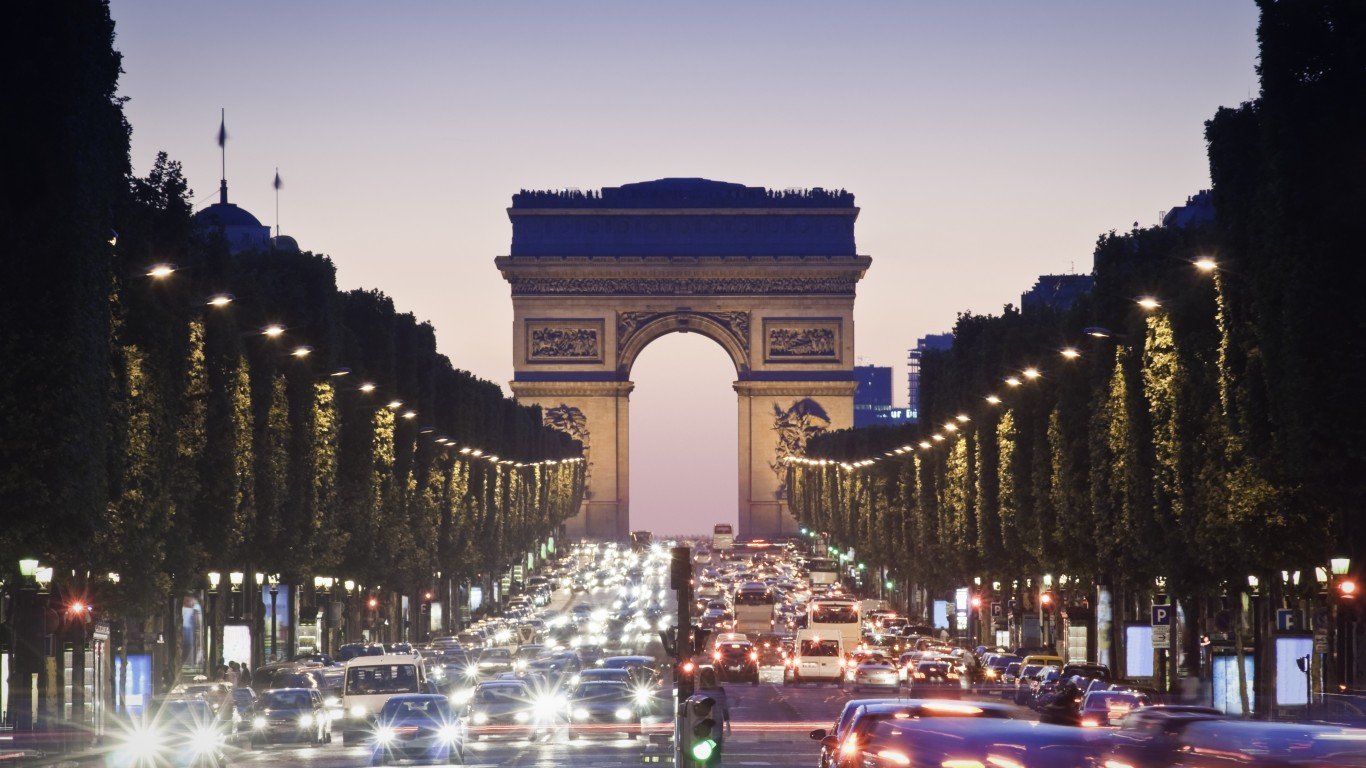
- Hours lost due to traffic congestion per driver (2022): 138
- Change in hours lost from 2021: -1%
- Change in hours lost from pre-Covid: -16%
- Average speed of the last mile of each trip in city: 11 MPH
- Change in last mile average speed from 2021: 0 MPH
2. Chicago, Illinois
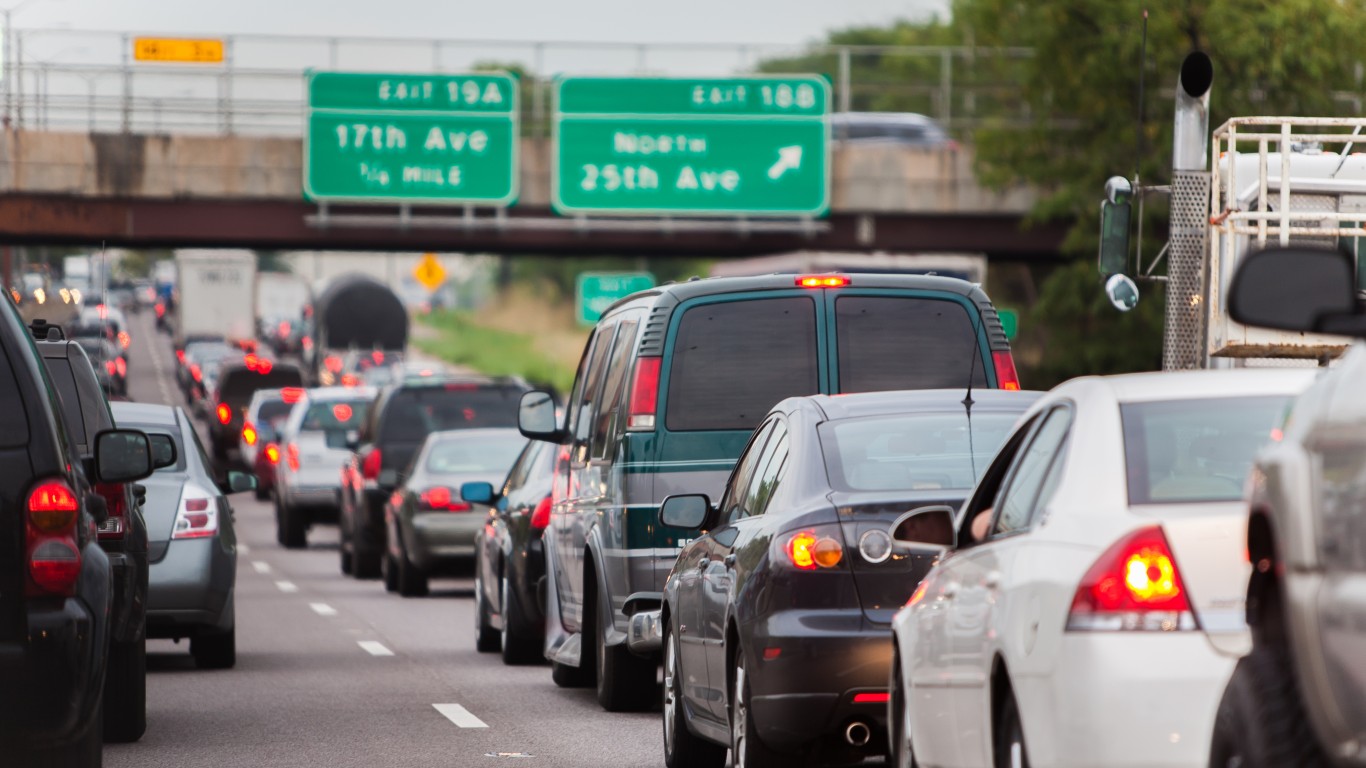
- Hours lost due to traffic congestion per driver (2022): 155
- Change in hours lost from 2021: 49%
- Change in hours lost from pre-Covid: 7%
- Average speed of the last mile of each trip in city: 11 MPH
- Change in last mile average speed from 2021: -4 MPH
1. London, United Kingdom
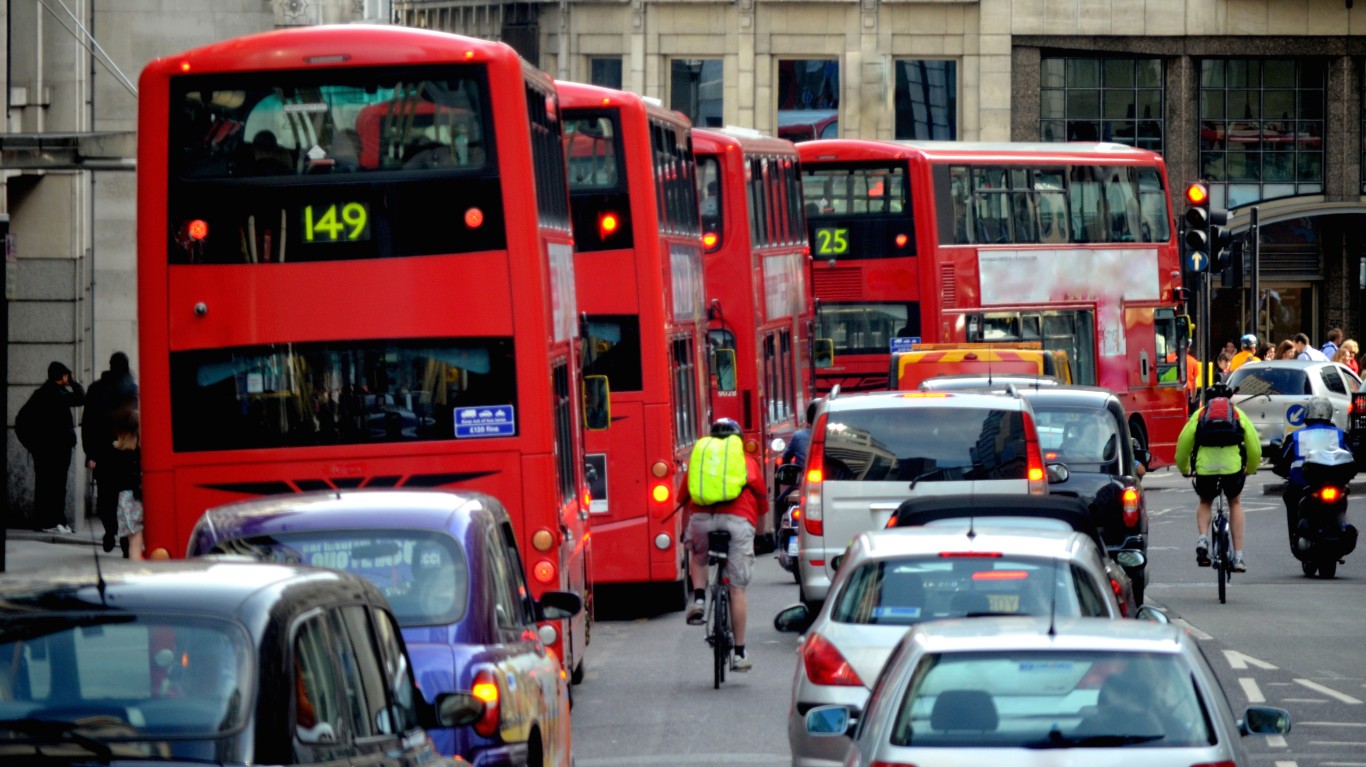
- Hours lost due to traffic congestion per driver (2022): 156
- Change in hours lost from 2021: 5%
- Change in hours lost from pre-Covid: 5%
- Average speed of the last mile of each trip in city: 10 MPH
- Change in last mile average speed from 2021: -1 MPH
Smart Investors Are Quietly Loading Up on These “Dividend Legends”
If you want your portfolio to pay you cash like clockwork, it’s time to stop blindly following conventional wisdom like relying on Dividend Aristocrats. There’s a better option, and we want to show you. We’re offering a brand-new report on 2 stocks we believe offer the rare combination of a high dividend yield and significant stock appreciation upside. If you’re tired of feeling one step behind in this market, this free report is a must-read for you.
Click here to download your FREE copy of “2 Dividend Legends to Hold Forever” and start improving your portfolio today.
Thank you for reading! Have some feedback for us?
Contact the 24/7 Wall St. editorial team.
