
Median home prices hit a record high in May, skyrocketing to $419,300 and reaching the 11th month in a row of price increases, according to the latest research published on realtor.com in June. Mortgage rates are also maintaining an average of 6.87% for 30-year fixed, making the possibility of first-time homeownership difficult for some, as these rates have more than doubled for home purchases since before 2020. Despite the high numbers, first-time homebuyers accounted for 31% of sales in May and have been reasonably steady over the last year. The housing supply has increased by 6.7% from the prior month, allowing for more available to see before these buyers make a tough decision.
Throughout the country, home sales have seen a minor to moderate slip from last year in certain areas. The South has fallen 5.1% from the prior year, the West dropped 1.3%, and the Northeast saw a slip of 4%. The Midwest has held steady and is up 1% from this time last year. Population growth does not necessarily follow these trends, as the South continues to be the nation’s most populated region, accounting for 87% of growth in 2023. This area of the country is the only one to maintain growth throughout the COVID-19 pandemic, and much of this is attributed to migrant populations. The region added over 1.45 million residents just in 2023.
To find the states that are growing fastest because people are moving there, 24/7 Wall St. reviewed the Census Bureau’s State Population Totals and Components of Change: 2020-2023, released December 2023. Using 2023 data, we compared each state’s population growth components from July 1, 2022, to July 1, 2023, ranking the states by the percentage of population growth from migration. All data provided is from the Census. (Interestingly, international migration includes armed forces movement.)
Of all 50 states, a few have seen great changes in 2023. Georgia’s population exceeded 11 million people, Texas had its largest numeric change in the nation, adding 473,453 people, and South Carolina and Florida were the two fastest-growing states, with 1.7% and 1.6% growth, respectively. Population growth concentration is also trending outside of the norm. For example, in 2022, Texas, Florida, North Carolina, and Georgia accounted for 93% of the nation’s growth, but only 67% in 2023.
Why Are We Writing About Population Growth?
Population growth within the United States has many implications for commerce, health, and environmental areas. With a growing population comes more labor, which brings in more tax revenue. It also requires increased availability of healthcare and public education. The rising numbers directly correlate to the need for more housing of all different types. A local economy can benefit from more people by utilizing tax dollars to improve services to its citizens, making life for everyone better when executed correctly.
50. New York

- % population change from migration, July 1, 2022-July 1, 2023: -0.73% — or a decrease of 142,911 people
- Migration components: -216,778 domestic migration; +73,867 international migration
- Natural pop change: +41,536 — 207,450 births; 165,914 deaths
- Population as of July 1, 2023: 19,571,216 — total change: -101,984 or -0.52% from 2022
49. Alaska

- % population change from migration, July 1, 2022-July 1, 2023: -0.48% — or a decrease of 3,539 people
- Migration components: -5,543 domestic migration; +2,004 international migration
- Natural pop change: +3,685 — 9,266 births; 5,581 deaths
- Population as of July 1, 2023: 733,406 — total change: 130 or 0.02% from 2022
48. California

- % population change from migration, July 1, 2022-July 1, 2023: -0.48% — or a decrease of 187,389 people
- Migration components: -338,371 domestic migration; +150,982 international migration
- Natural pop change: +111,416 — 414,120 births; 302,704 deaths
- Population as of July 1, 2023: 38,965,193 — total change: -75,423 or -0.19% from 2022
47. Hawaii

- % population change from migration, July 1, 2022-July 1, 2023: -0.46% — or a decrease of 6,566 people
- Migration components: -11,193 domestic migration; +4,627 international migration
- Natural pop change: +2,355 — 15,167 births; 12,812 deaths
- Population as of July 1, 2023: 1,435,138 — total change: -4,261 or -0.30% from 2022
46. Louisiana

- % population change from migration, July 1, 2022-July 1, 2023: -0.45% — or a decrease of 20,418 people
- Migration components: -29,692 domestic migration; +9,274 international migration
- Natural pop change: +6,115 — 56,209 births; 50,094 deaths
- Population as of July 1, 2023: 4,573,749 — total change: -14,274 or -0.31% from 2022
45. Illinois

- % population change from migration, July 1, 2022-July 1, 2023: -0.34% — or a decrease of 43,347 people
- Migration components: -83,839 domestic migration; +40,492 international migration
- Natural pop change: +10,453 — 127,235 births; 116,782 deaths
- Population as of July 1, 2023: 12,549,689 — total change: -32,826 or -0.26% from 2022
44. Oregon

- % population change from migration, July 1, 2022-July 1, 2023: -0.04% — or a decrease of 1,747 people
- Migration components: -6,051 domestic migration; +4,304 international migration
- Natural pop change: –4,239 — 39,046 births; 43,285 deaths
- Population as of July 1, 2023: 4,233,358 — total change: -6,021 or -0.14% from 2022
43. Kansas
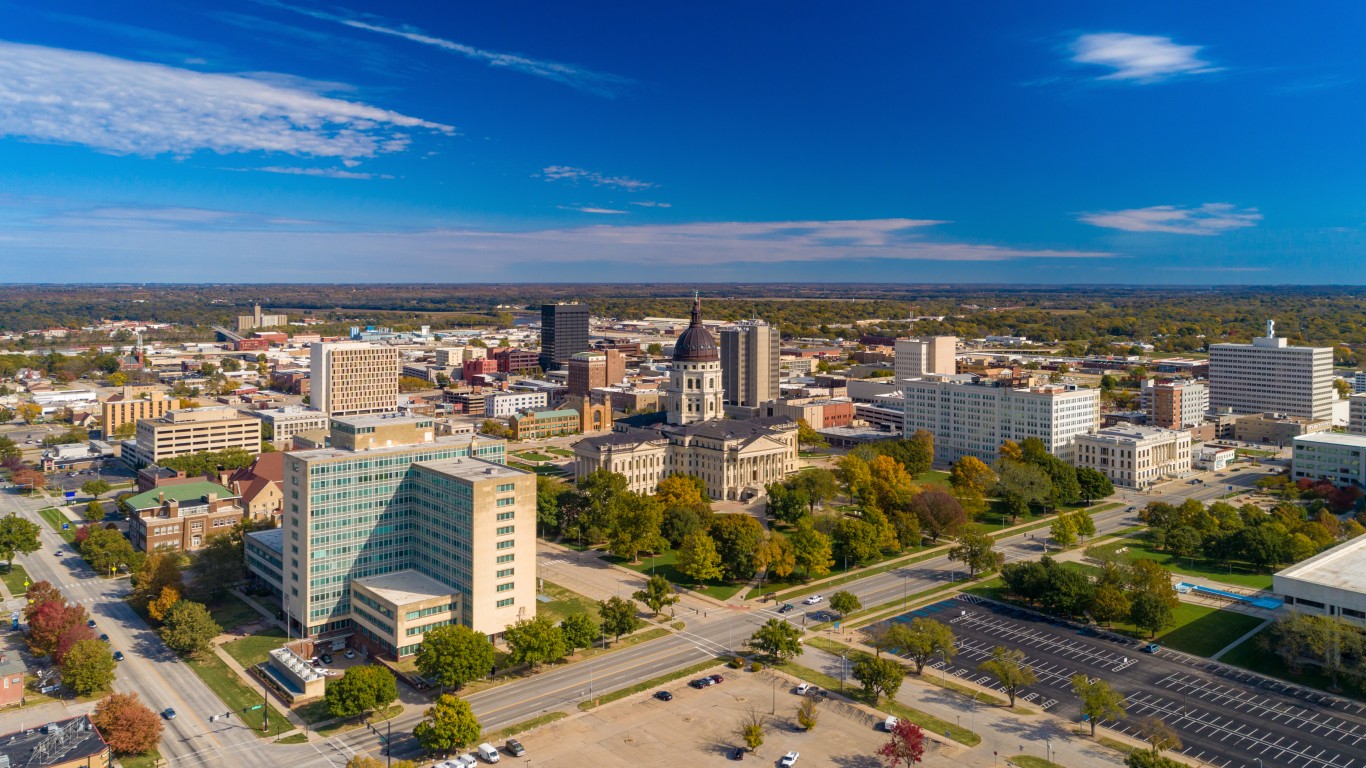
- % population change from migration, July 1, 2022-July 1, 2023: -0.02% — or a decrease of 642 people
- Migration components: -4,574 domestic migration; +3,932 international migration
- Natural pop change: +4,439 — 34,768 births; 30,329 deaths
- Population as of July 1, 2023: 2,940,546 — total change: 3,830 or 0.13% from 2022
42. Pennsylvania

- % population change from migration, July 1, 2022-July 1, 2023: 0.01% — or an increase of 951 people
- Migration components: -24,825 domestic migration; +25,776 international migration
- Natural pop change: –11,079 — 129,489 births; 140,568 deaths
- Population as of July 1, 2023: 12,961,683 — total change: -10,408 or -0.08% from 2022
41. Maryland

- % population change from migration, July 1, 2022-July 1, 2023: 0.03% — or an increase of 2,072 people
- Migration components: -30,905 domestic migration; +32,977 international migration
- Natural pop change: +14,199 — 67,969 births; 53,770 deaths
- Population as of July 1, 2023: 6,180,253 — total change: 16,272 or 0.26% from 2022
40. New Jersey

- % population change from migration, July 1, 2022-July 1, 2023: 0.05% — or an increase of 4,632 people
- Migration components: -44,666 domestic migration; +49,298 international migration
- Natural pop change: +25,492 — 102,055 births; 76,563 deaths
- Population as of July 1, 2023: 9,290,841 — total change: 30,024 or 0.32% from 2022
39. Mississippi

- % population change from migration, July 1, 2022-July 1, 2023: 0.07% — or an increase of 2,186 people
- Migration components: -2,614 domestic migration; +4,800 international migration
- Natural pop change: –1,404 — 34,628 births; 36,032 deaths
- Population as of July 1, 2023: 2,939,690 — total change: 762 or 0.03% from 2022
38. Michigan

- % population change from migration, July 1, 2022-July 1, 2023: 0.08% — or an increase of 7,766 people
- Migration components: -15,051 domestic migration; +22,817 international migration
- Natural pop change: –4,030 — 101,911 births; 105,941 deaths
- Population as of July 1, 2023: 10,037,261 — total change: 3,980 or 0.04% from 2022
37. Iowa

- % population change from migration, July 1, 2022-July 1, 2023: 0.11% — or an increase of 3,509 people
- Migration components: -3,603 domestic migration; +7,112 international migration
- Natural pop change: +3,779 — 36,898 births; 33,119 deaths
- Population as of July 1, 2023: 3,207,004 — total change: 7,311 or 0.23% from 2022
36. New Mexico

- % population change from migration, July 1, 2022-July 1, 2023: 0.12% — or an increase of 2,554 people
- Migration components: -1,088 domestic migration; +3,642 international migration
- Natural pop change: –1,616 — 20,728 births; 22,344 deaths
- Population as of July 1, 2023: 2,114,371 — total change: 895 or 0.04% from 2022
35. Massachusetts

- % population change from migration, July 1, 2022-July 1, 2023: 0.16% — or an increase of 11,498 people
- Migration components: -39,149 domestic migration; +50,647 international migration
- Natural pop change: +6,983 — 68,387 births; 61,404 deaths
- Population as of July 1, 2023: 7,001,399 — total change: 18,659 or 0.27% from 2022
34. Minnesota

- % population change from migration, July 1, 2022-July 1, 2023: 0.17% — or an increase of 9,889 people
- Migration components: -4,686 domestic migration; +14,575 international migration
- Natural pop change: +13,843 — 63,754 births; 49,911 deaths
- Population as of July 1, 2023: 5,737,915 — total change: 23,615 or 0.41% from 2022
33. Connecticut

- % population change from migration, July 1, 2022-July 1, 2023: 0.17% — or an increase of 6,248 people
- Migration components: -9,016 domestic migration; +15,264 international migration
- Natural pop change: +2,115 — 34,957 births; 32,842 deaths
- Population as of July 1, 2023: 3,617,176 — total change: 8,470 or 0.23% from 2022
32. Washington

- % population change from migration, July 1, 2022-July 1, 2023: 0.18% — or an increase of 13,643 people
- Migration components: -15,276 domestic migration; +28,919 international migration
- Natural pop change: +14,860 — 82,523 births; 67,663 deaths
- Population as of July 1, 2023: 7,812,880 — total change: 28,403 or 0.36% from 2022
31. Rhode Island

- % population change from migration, July 1, 2022-July 1, 2023: 0.23% — or an increase of 2,553 people
- Migration components: -3,224 domestic migration; +5,777 international migration
- Natural pop change: –428 — 10,006 births; 10,434 deaths
- Population as of July 1, 2023: 1,095,962 — total change: 2,120 or 0.19% from 2022
30. Nebraska

- % population change from migration, July 1, 2022-July 1, 2023: 0.23% — or an increase of 4,607 people
- Migration components: -834 domestic migration; +5,441 international migration
- Natural pop change: +5,699 — 24,195 births; 18,496 deaths
- Population as of July 1, 2023: 1,978,379 — total change: 10,319 or 0.52% from 2022
29. Virginia

- % population change from migration, July 1, 2022-July 1, 2023: 0.24% — or an increase of 21,132 people
- Migration components: -6,985 domestic migration; +28,117 international migration
- Natural pop change: +15,689 — 95,669 births; 79,980 deaths
- Population as of July 1, 2023: 8,715,698 — total change: 36,599 or 0.42% from 2022
28. Ohio

- % population change from migration, July 1, 2022-July 1, 2023: 0.24% — or an increase of 28,718 people
- Migration components: +637 domestic migration; +28,081 international migration
- Natural pop change: –2,462 — 128,826 births; 131,288 deaths
- Population as of July 1, 2023: 11,785,935 — total change: 26,238 or 0.22% from 2022
27. West Virginia

- % population change from migration, July 1, 2022-July 1, 2023: 0.26% — or an increase of 4,696 people
- Migration components: +3,595 domestic migration; +1,101 international migration
- Natural pop change: –8,666 — 17,263 births; 25,929 deaths
- Population as of July 1, 2023: 1,770,071 — total change: -3,964 or -0.22% from 2022
26. North Dakota

- % population change from migration, July 1, 2022-July 1, 2023: 0.29% — or an increase of 2,289 people
- Migration components: -9 domestic migration; +2,298 international migration
- Natural pop change: +2,704 — 9,649 births; 6,945 deaths
- Population as of July 1, 2023: 783,926 — total change: 5,014 or 0.64% from 2022
25. Missouri

- % population change from migration, July 1, 2022-July 1, 2023: 0.31% — or an increase of 19,023 people
- Migration components: +11,171 domestic migration; +7,852 international migration
- Natural pop change: –55 — 68,334 births; 68,389 deaths
- Population as of July 1, 2023: 6,196,156 — total change: 18,988 or 0.31% from 2022
24. Wisconsin

- % population change from migration, July 1, 2022-July 1, 2023: 0.33% — or an increase of 19,301 people
- Migration components: +5,648 domestic migration; +13,653 international migration
- Natural pop change: +1,147 — 59,839 births; 58,692 deaths
- Population as of July 1, 2023: 5,910,955 — total change: 20,412 or 0.35% from 2022
23. Colorado

- % population change from migration, July 1, 2022-July 1, 2023: 0.33% — or an increase of 19,167 people
- Migration components: +7,236 domestic migration; +11,931 international migration
- Natural pop change: +17,399 — 62,498 births; 45,099 deaths
- Population as of July 1, 2023: 5,877,610 — total change: 36,571 or 0.63% from 2022
22. Indiana

- % population change from migration, July 1, 2022-July 1, 2023: 0.33% — or an increase of 22,468 people
- Migration components: +4,599 domestic migration; +17,869 international migration
- Natural pop change: +7,508 — 79,587 births; 72,079 deaths
- Population as of July 1, 2023: 6,862,199 — total change: 29,925 or 0.44% from 2022
21. Vermont
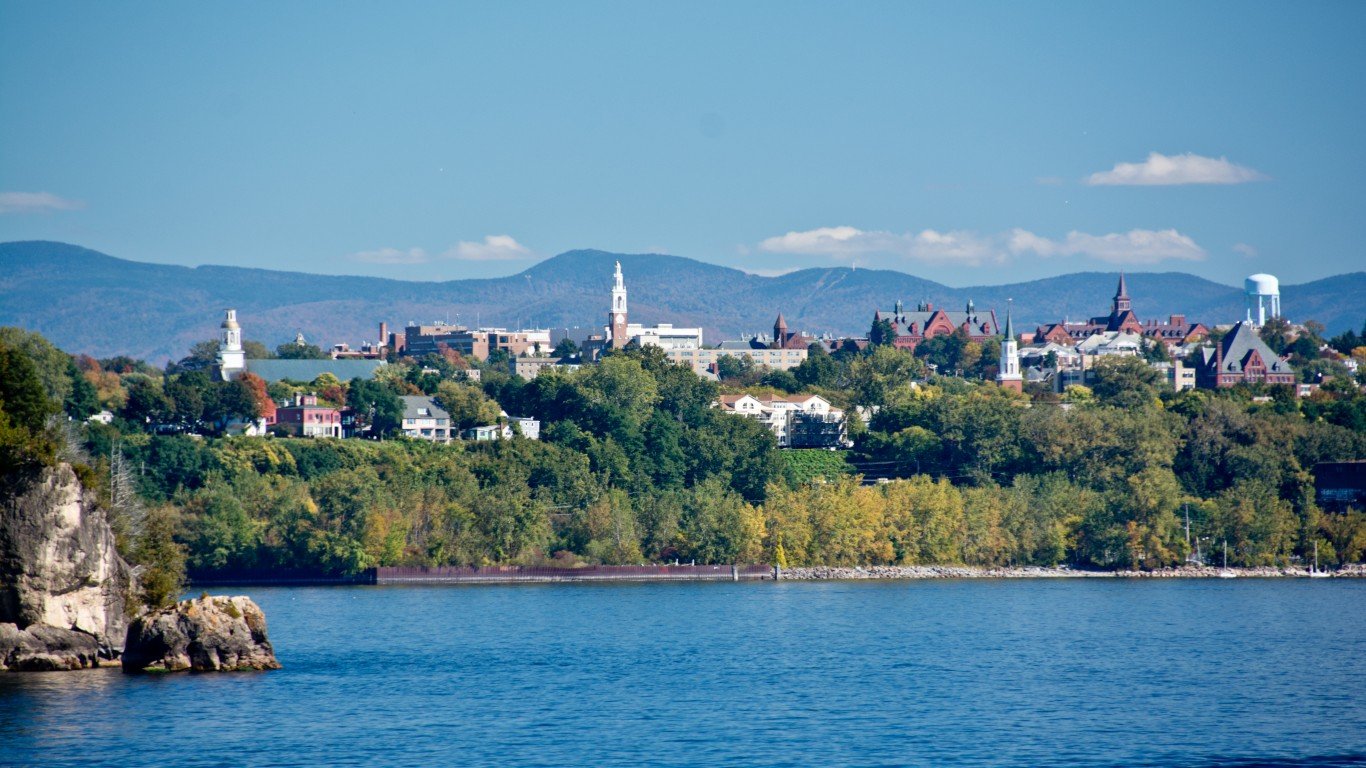
- % population change from migration, July 1, 2022-July 1, 2023: 0.33% — or an increase of 2,156 people
- Migration components: +844 domestic migration; +1,312 international migration
- Natural pop change: –1,804 — 5,072 births; 6,876 deaths
- Population as of July 1, 2023: 647,464 — total change: 354 or 0.05% from 2022
20. Utah

- % population change from migration, July 1, 2022-July 1, 2023: 0.34% — or an increase of 11,623 people
- Migration components: +1,338 domestic migration; +10,285 international migration
- Natural pop change: +24,796 — 45,965 births; 21,169 deaths
- Population as of July 1, 2023: 3,417,734 — total change: 36,498 or 1.08% from 2022
19. Kentucky

- % population change from migration, July 1, 2022-July 1, 2023: 0.37% — or an increase of 16,592 people
- Migration components: +8,965 domestic migration; +7,627 international migration
- Natural pop change: –2,005 — 52,380 births; 54,385 deaths
- Population as of July 1, 2023: 4,526,154 — total change: 14,591 or 0.32% from 2022
18. New Hampshire

- % population change from migration, July 1, 2022-July 1, 2023: 0.37% — or an increase of 5,157 people
- Migration components: +4,298 domestic migration; +859 international migration
- Natural pop change: –2,109 — 12,155 births; 14,264 deaths
- Population as of July 1, 2023: 1,402,054 — total change: 3,051 or 0.22% from 2022
17. Wyoming

- % population change from migration, July 1, 2022-July 1, 2023: 0.40% — or an increase of 2,338 people
- Migration components: +2,016 domestic migration; +322 international migration
- Natural pop change: +103 — 5,882 births; 5,779 deaths
- Population as of July 1, 2023: 584,057 — total change: 2,428 or 0.42% from 2022
16. Nevada

- % population change from migration, July 1, 2022-July 1, 2023: 0.41% — or an increase of 12,908 people
- Migration components: +8,642 domestic migration; +4,266 international migration
- Natural pop change: +3,733 — 33,055 births; 29,322 deaths
- Population as of July 1, 2023: 3,194,176 — total change: 16,755 or 0.53% from 2022
15. Alabama

- % population change from migration, July 1, 2022-July 1, 2023: 0.71% — or an increase of 36,128 people
- Migration components: +30,744 domestic migration; +5,384 international migration
- Natural pop change: –1,562 — 58,251 births; 59,813 deaths
- Population as of July 1, 2023: 5,108,468 — total change: 34,565 or 0.68% from 2022
14. South Dakota

- % population change from migration, July 1, 2022-July 1, 2023: 0.73% — or an increase of 6,600 people
- Migration components: +4,812 domestic migration; +1,788 international migration
- Natural pop change: +2,813 — 11,369 births; 8,556 deaths
- Population as of July 1, 2023: 919,318 — total change: 9,449 or 1.04% from 2022
13. Arkansas

- % population change from migration, July 1, 2022-July 1, 2023: 0.73% — or an increase of 22,202 people
- Migration components: +18,106 domestic migration; +4,096 international migration
- Natural pop change: –907 — 35,566 births; 36,473 deaths
- Population as of July 1, 2023: 3,067,732 — total change: 21,328 or 0.70% from 2022
12. Arizona

- % population change from migration, July 1, 2022-July 1, 2023: 0.78% — or an increase of 57,814 people
- Migration components: +36,179 domestic migration; +21,635 international migration
- Natural pop change: +7,702 — 78,494 births; 70,792 deaths
- Population as of July 1, 2023: 7,431,344 — total change: 65,660 or 0.89% from 2022
11. Oklahoma

- % population change from migration, July 1, 2022-July 1, 2023: 0.80% — or an increase of 31,967 people
- Migration components: +23,587 domestic migration; +8,380 international migration
- Natural pop change: +2,567 — 48,073 births; 45,506 deaths
- Population as of July 1, 2023: 4,053,824 — total change: 34,553 or 0.86% from 2022
10. Georgia

- % population change from migration, July 1, 2022-July 1, 2023: 0.81% — or an increase of 88,325 people
- Migration components: +58,206 domestic migration; +30,119 international migration
- Natural pop change: +27,817 — 125,664 births; 97,847 deaths
- Population as of July 1, 2023: 11,029,227 — total change: 116,077 or 1.06% from 2022
9. Maine

- % population change from migration, July 1, 2022-July 1, 2023: 0.82% — or an increase of 11,425 people
- Migration components: +9,216 domestic migration; +2,209 international migration
- Natural pop change: –5,053 — 11,945 births; 16,998 deaths
- Population as of July 1, 2023: 1,395,722 — total change: 6,384 or 0.46% from 2022
8. Montana
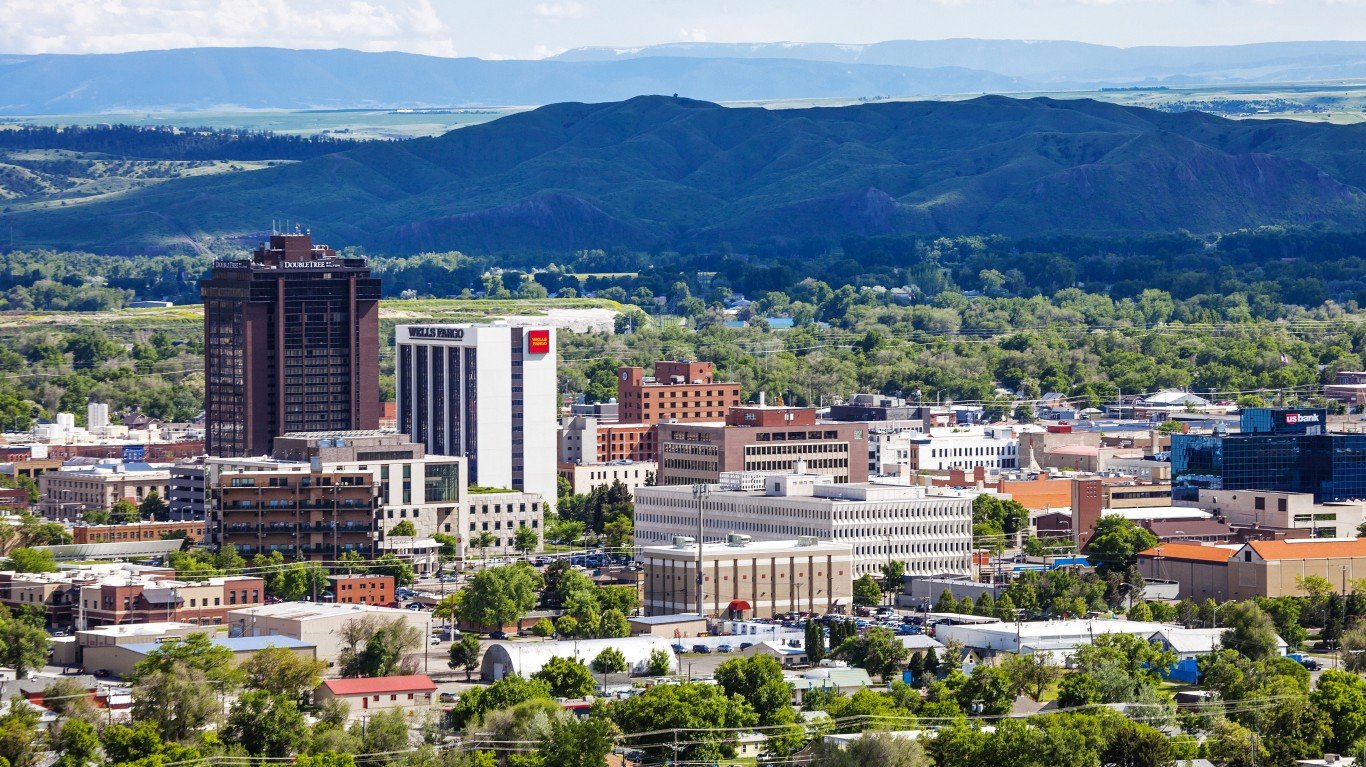
- % population change from migration, July 1, 2022-July 1, 2023: 0.90% — or an increase of 10,094 people
- Migration components: +9,485 domestic migration; +609 international migration
- Natural pop change: –171 — 11,206 births; 11,377 deaths
- Population as of July 1, 2023: 1,132,812 — total change: 9,934 or 0.88% from 2022
7. Idaho

- % population change from migration, July 1, 2022-July 1, 2023: 1.03% — or an increase of 20,053 people
- Migration components: +15,389 domestic migration; +4,664 international migration
- Natural pop change: +5,639 — 22,456 births; 16,817 deaths
- Population as of July 1, 2023: 1,964,726 — total change: 25,730 or 1.33% from 2022
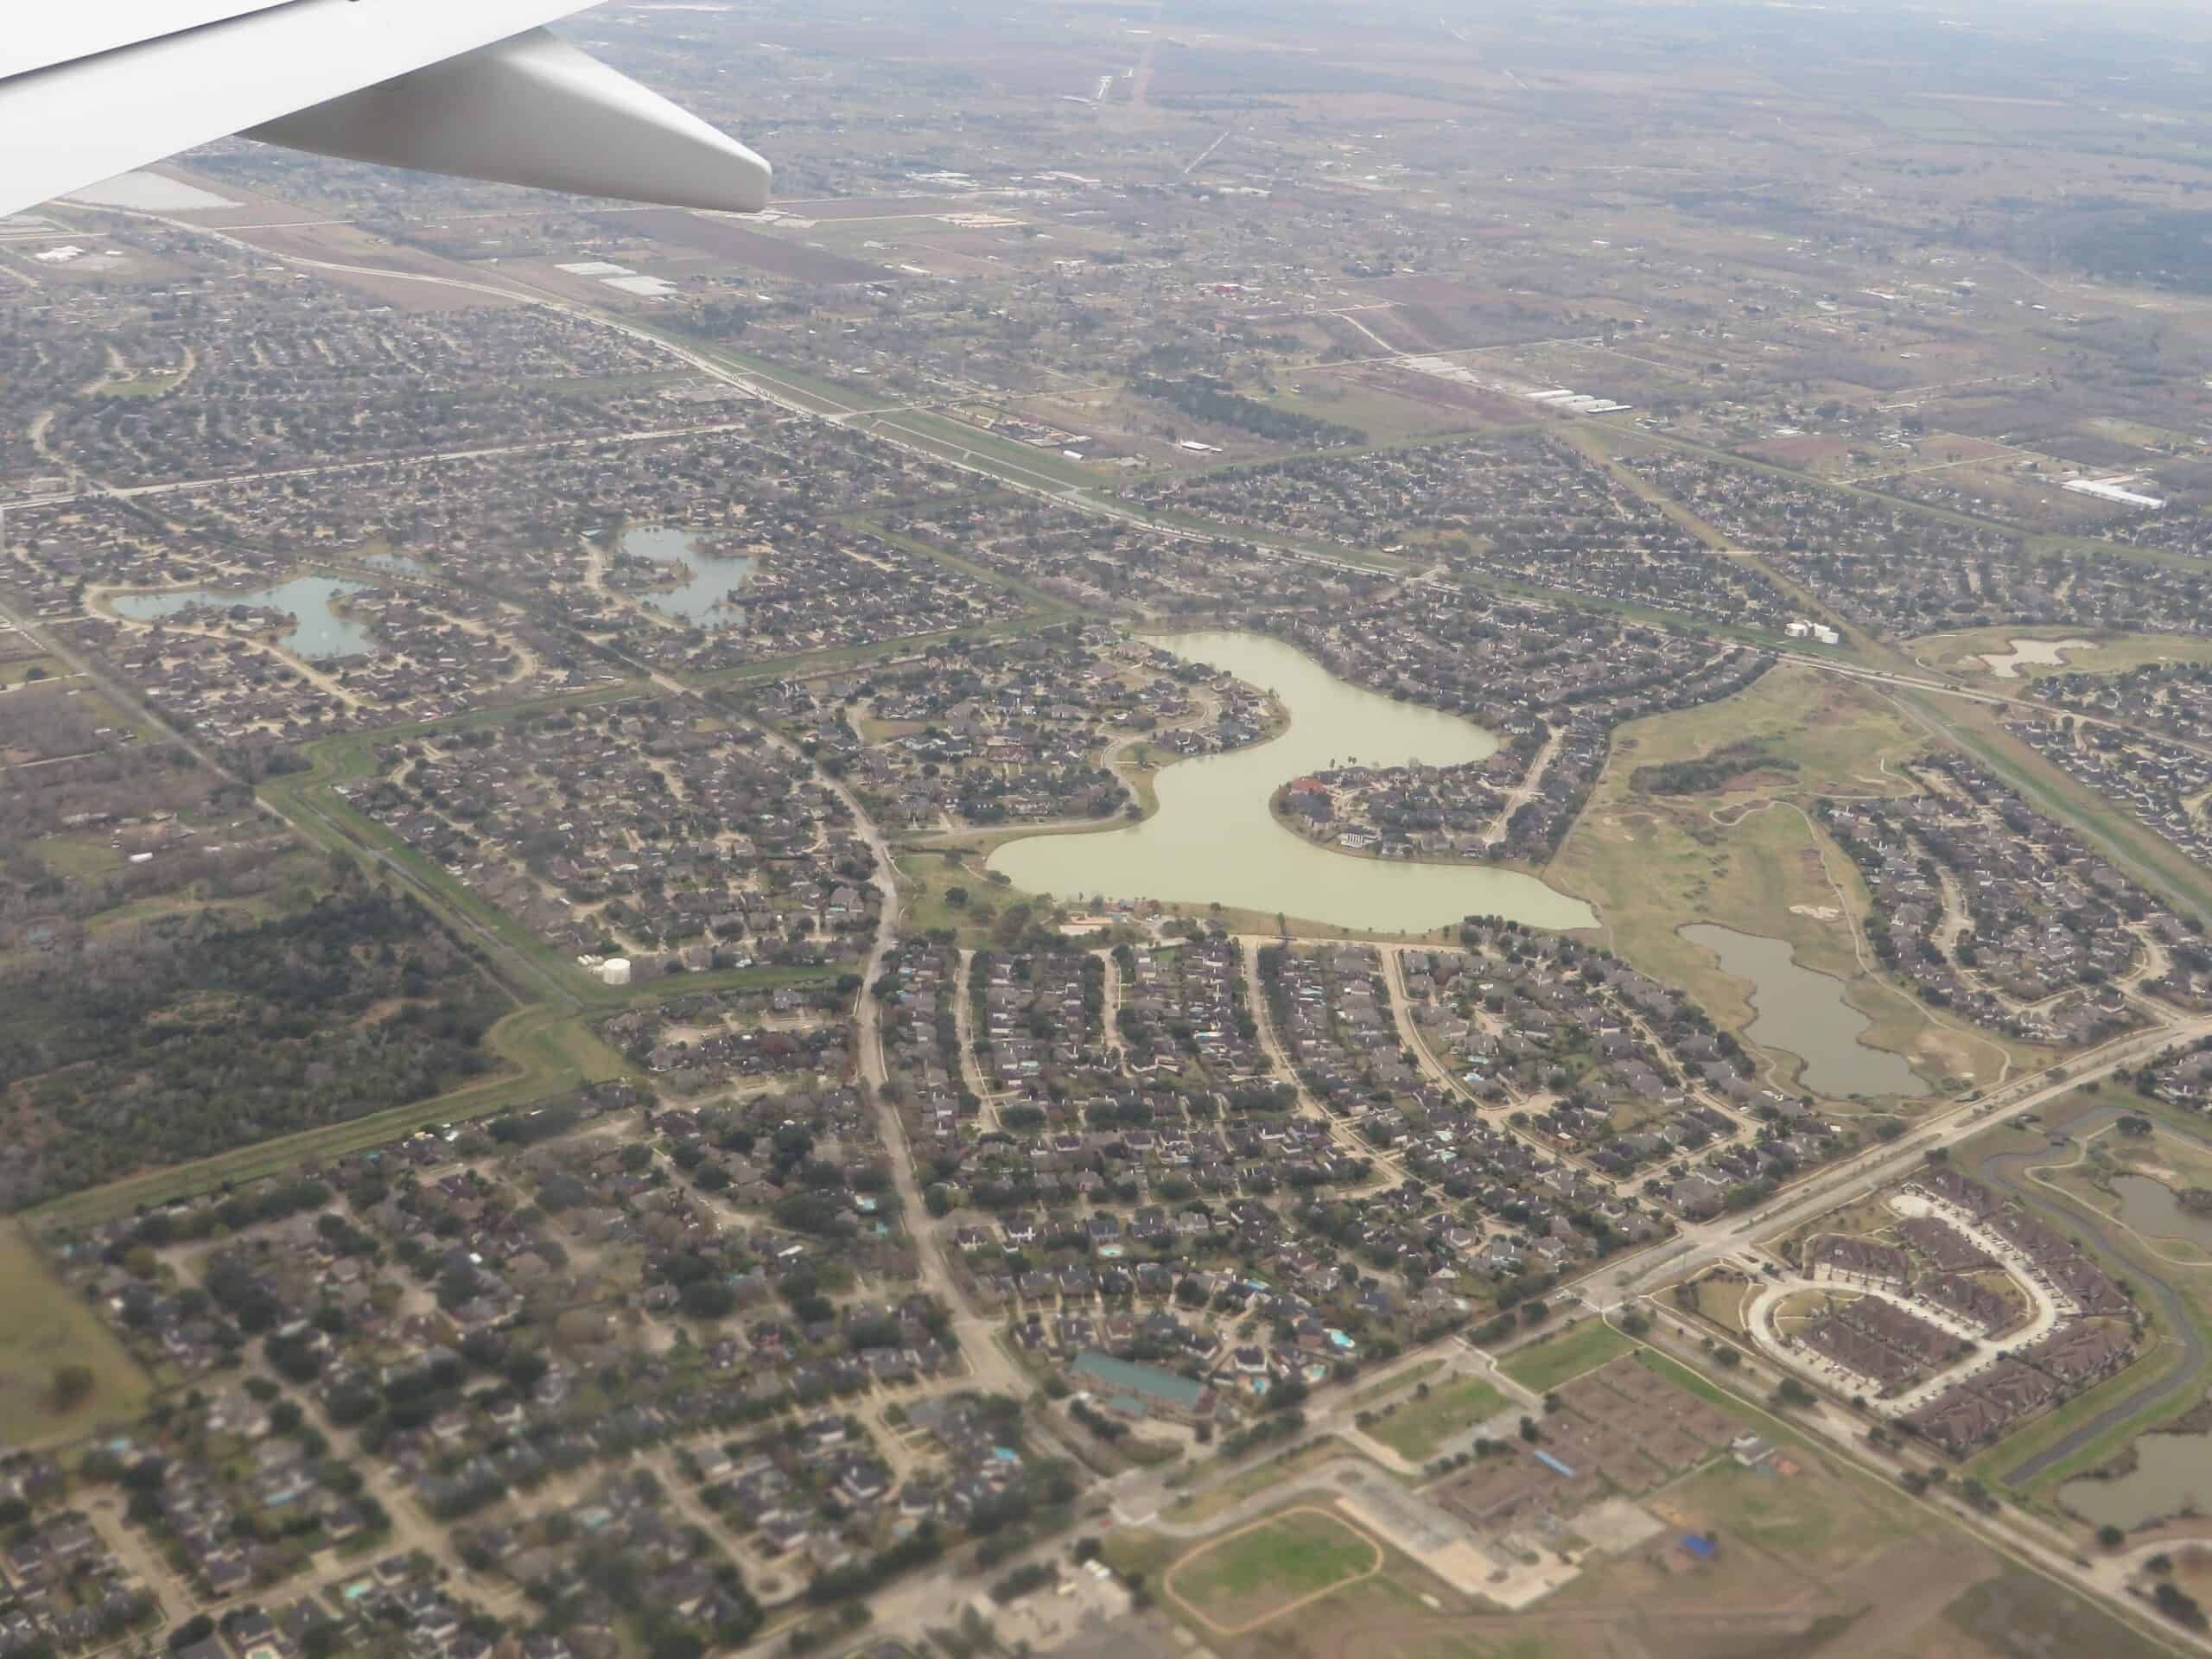
6. Texas

- % population change from migration, July 1, 2022-July 1, 2023: 1.05% — or an increase of 315,301 people
- Migration components: +186,767 domestic migration; +128,534 international migration
- Natural pop change: +158,253 — 390,494 births; 232,241 deaths
- Population as of July 1, 2023: 30,503,301 — total change: 473,453 or 1.58% from 2022
5. Tennessee

- % population change from migration, July 1, 2022-July 1, 2023: 1.08% — or an increase of 76,471 people
- Migration components: +63,417 domestic migration; +13,054 international migration
- Natural pop change: +1,028 — 82,244 births; 81,216 deaths
- Population as of July 1, 2023: 7,126,489 — total change: 77,513 or 1.10% from 2022
4. North Carolina

- % population change from migration, July 1, 2022-July 1, 2023: 1.18% — or an increase of 126,712 people
- Migration components: +97,264 domestic migration; +29,448 international migration
- Natural pop change: +12,657 — 121,148 births; 108,491 deaths
- Population as of July 1, 2023: 10,835,491 — total change: 139,526 or 1.30% from 2022
3. Delaware

- % population change from migration, July 1, 2022-July 1, 2023: 1.24% — or an increase of 12,597 people
- Migration components: +10,320 domestic migration; +2,277 international migration
- Natural pop change: –172 — 10,725 births; 10,897 deaths
- Population as of July 1, 2023: 1,031,890 — total change: 12,431 or 1.22% from 2022
2. Florida

- % population change from migration, July 1, 2022-July 1, 2023: 1.68% — or an increase of 372,870 people
- Migration components: +194,438 domestic migration; +178,432 international migration
- Natural pop change: –7,603 — 223,578 births; 231,181 deaths
- Population as of July 1, 2023: 22,610,726 — total change: 365,205 or 1.64% from 2022
1. South Carolina
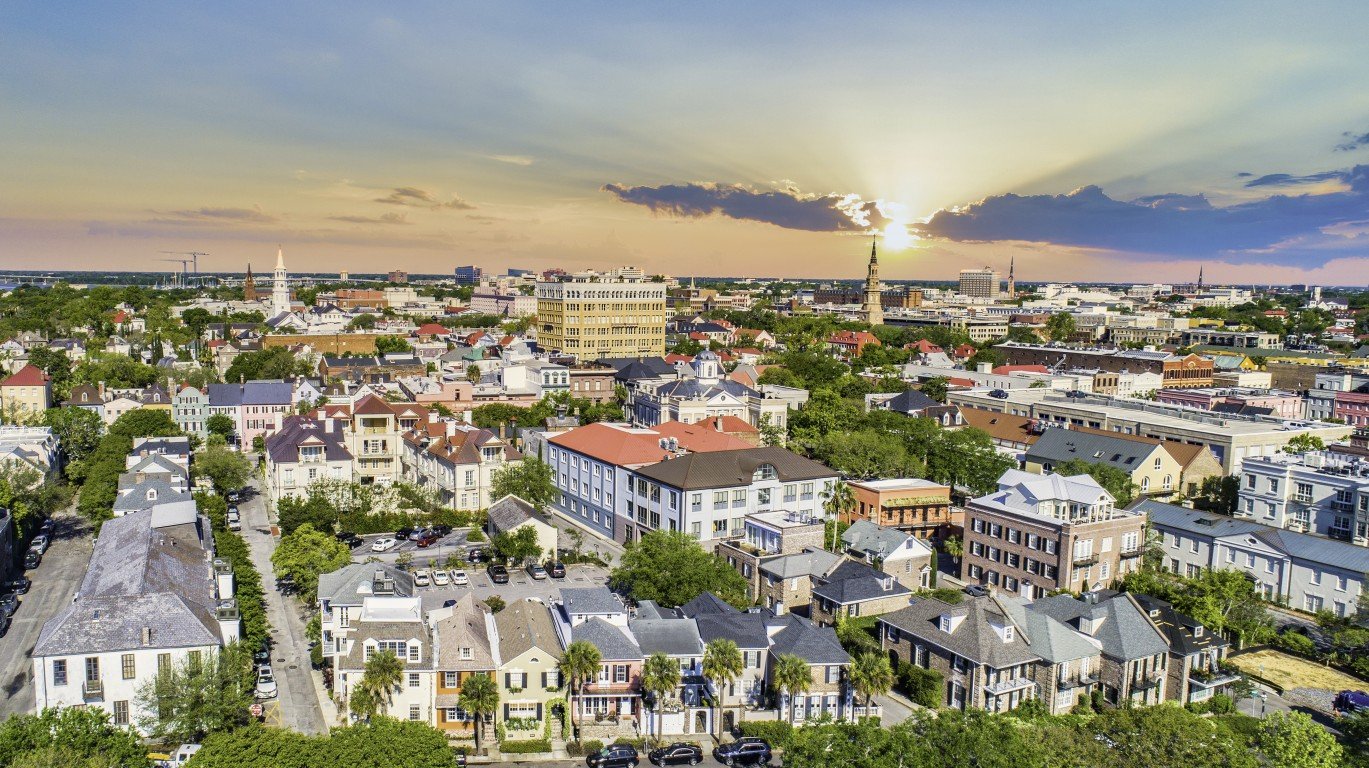
- % population change from migration, July 1, 2022-July 1, 2023: 1.74% — or an increase of 91,853 people
- Migration components: +82,562 domestic migration; +9,291 international migration
- Natural pop change: –1,271 — 57,581 births; 58,852 deaths
- Population as of July 1, 2023: 5,373,555 — total change: 90,600 or 1.71% from 2022
Contact [email protected] for any questions or corrections.